1
Introduction
This report is a quadrennial review of the National Nanotechnology Initiative (NNI) requested by the White House Office of Science and Technology Policy (OSTP) in 2019. The statement of task from the OSTP is provided in Appendix A.
WHAT IS “NANOTECHNOLOGY” AND WHY IS IT OF PERVASIVE INTEREST?
When small numbers of atoms are allowed, or are induced, to assemble into very small objects with dimensions of 1-100 nm, they have properties that are sometimes unlike any exhibited by their macroscopic counterparts—for example, the mesoporous zeolites described in Box 1.1, or cage-like fullerenes, cylindrical or flattened carbon nanotubes, or carbon formed as sheets of single-layer graphene.1 While fullerenes have yet to find a major application, the other nanoforms of carbon possess remarkable stiffnesses and strengths, ultra-high thermal and electrical conductivities, and a host of interesting and potentially transformative electrical transport behaviors. Counterparts made of silicon, boron nitride, and other molecules have been discovered or await discovery, and promise similar exciting technological prospects.
But nanotechnology embraces much, much more than this. For example, the controlled assembly of 100-10,000 cadmium and tellurium atoms into quantum
___________________
1 P.M. Ajayan, 2019, The nano-revolution spawned by carbon, Nature 575:49-50, https://www.nature.com/articles/d41586-019-02838-4.
dots of controlled size and shape results in nanoparticles whose quantized energy levels enable highly selective absorption and luminescent emission of monochromatic visible radiation. Their ability to produce red, green, and blue light has led to their widespread use in backlit TV displays. They are also used in emerging quantum-dot light emitting displays (QD-LEDs) with the potential to displace this current major application of quantum dot technology. Quantum dots also exhibit a host of other opto-electronic properties that are controllable by changing the composition of the atoms used to assemble them as well as their shape and geometry. Today, they are used to manipulate the color of glass,2 for biomedical assays,3 and embedded in nanowires within quantum photonic systems.4 Their likely future
___________________
2 D. Bera, L. Qian, and P.H. Holloway, 2010, Quantum dots and their multimodal applications: A review, Materials 3:2260-2345, https://doi.org/10.3390/ma3042260.
3 E. Petryayeva, W.R. Algar, and I.L. Medinitz, 2013, Quantum dots in bioanalysis: A review of applications across various platforms for fluorescence spectroscopy and imaging, Applied Spectroscopy 67(3):215-222, doi: 10.1366/12-06948.
4 M. Heiss, Y. Fontana, A. Gustafsson, G. Wüst, C. Magen, D.D. O’Regan, J.W. Luo, et al., 2013, Self-assembled quantum dots in a nanowire system for quantum photonics, Nature Materials 12:439-444, doi: 10.1038/nmat3557.
impacts are even more compelling. Silicon quantum dots5 and nanoscale Josephson junctions6 are two of the most promising approaches for synthesizing the qubits of emerging quantum computers.
Nanotechnology is pacing the performance of the most sophisticated and economically important computing and data storage technologies. The number of transistors in state-of-the-art integrated circuits has roughly doubled every 2 years for the past 5 decades,7,8 packing now billions of transistors per chip9 at densities above 100 million transistors/mm2.10,11 This extraordinary scaling of device density is achieved by pushing the fabrication of ever smaller feature sizes, now into the single-digit nm regime. For example, the “fin width,” or critical dimension, in a fin field effect transistor (FinFET) is now less than 10 nm.12 Such dense device packing has driven down the cost per device at a truly remarkable rate, but has required massive investments by industry to develop integrated circuit design software, silicon wafer processing and metrology tools, and new designs to manage the enormous thermal flux that must be removed from devices in operation. Partnerships between the Defense Advanced Research Projects Agency (DARPA)—one of the participating NNI agencies—and the U.S. semiconductor industry via programs such as STARnet,13 a program of the Semiconductor Research Corporation (SRC), have had an important role in maintaining U.S. competitiveness. As researchers approach the physics-defined limits of conventional circuit scaling and confront limits to the ability to pattern and process silicon, fundamental studies have been initiated to explore alternative device designs and materials that will allow the continued pace of computer chip performance increases into the foreseeable future.
___________________
5 R.M. Wilson, 2018, Silicon-based quantum dots have a path to scalable quantum computing, Physics Today 71(4):17-20, https://doi.org/10.1063/PT.3.3890.
6 See “Phase Qubit,” https://en.wikipedia.org/wiki/Phase_qubit, accessed 04/16/2020.
7 M.M. Waldrop, 2016, The chips are down for Moore’s law, Nature News 530(7589):144, doi: 10.1038/530144a.
8 T.N. Theis and H.-S.P. Wong, 2017, The end of Moore’s law: A new beginning for information technology, Computing in Science and Engineering 19(2):41, doi: 10.1109/MCSE.2017.29.
9 M. Bathe, L.A. Chrisey, D.J. Herr, Q. Lin, D. Rasic, A.T. Woolley, R.M. Zadegan, and V.V. Zhirnov, 2019, Roadmap on biological pathways for electronic nanofabrication and materials, Nano Futures 3(1): 012001, https://doi.org/10.1088/2399-1984/aaf7d5.
10 A. Malinowski, J. Chen, S.K. Mishra, S. Samavedam, and D. Sohn, 2019, in “What Is Killing Moore’s Law? Challenges in Advanced FinFET Technology Integration,” 2019 MIXDES—26th International Conference, “Mixed Design of Integrated Circuits and Systems,” June 27-29, 2019, pp. 46-51.
11 See K. Mistry, “10 nm Technology Leadership,” https://newsroom.intel.com/newsroom/wpcontent/uploads/sites/11/2017/03/Kaizad-Mistry-2017-Manufacturing.pdf, accessed 04/16/2020.
12 A. Malinowski, J. Chen, S.K. Mishra, S. Samavedam, and D. Sohn, 2019, in “What Is Killing Moore’s Law? Challenges in Advanced FinFET Technology Integration,” 2019 MIXDES—26th International Conference, “Mixed Design of Integrated Circuits and Systems,” June 27-29, 2019, pp. 46-51.
13 See Semiconductor Research Corporation, “About STARnet,” https://www.src.org/program/starnet/about/, accessed 04/16/2020.
This work includes the integration of nanoelectronics with nanophotonics. In 2015, the American Institute for Manufacturing Integrated Photonics (AIM Photonics)14 was established in support of this objective. AIM Photonics is a public-private partnership program funded at $600 million to deliver coordinated research and development (R&D) among more than 100 companies, nonprofits, and universities.
These few brief examples show that nanotechnology has been, and will continue to be, a highly interdisciplinary field of research (indeed, arguably the most interdisciplinary), with many discoveries and inventions awaiting. The early work has now advanced to a stage where nanotechnology is underpinning a rapidly growing range of economically important applications, including nanoelectronics, displays, catalysts, ultra-strong materials, energy storage, drug delivery systems, and so on, and is making important contributions to the technologies that underpin U.S. national security.
THE NNI FRAMEWORK
Formally established in January 2000 with expenditures authorized in 2003, the NNI is a U.S. government R&D initiative that currently spans the nanotechnology-related activities of 20 government participating departments and agencies. It is important to note that there has been no specific federal funding appropriated and allocated by Congress toward the work of the NNI. Instead, the NNI leadership leverages the existing budgets of the participating departments and agencies to execute the NNI goals. Practically, the role of the NNI is to coordinate the individual and cooperative nanotechnology-related activities of participating departments and agencies, which have a range of research priorities, regulatory roles, and responsibilities. That is, the nanoscience and nanotechnology R&D programs taking place in academic, government, and industry laboratories across the United States originate from, and are funded by, the participating departments and agencies, not the NNI. In its capacity as an interagency coordination effort, the NNI informs and influences the federal budget and strategic planning processes through engagement with its involved departments and agencies and with the National Science and Technology Council (NSTC). As the coordinating entity, the NNI is charged with bringing together the expertise needed to advance the fields of nanoscience and nanotechnology, and with creating a framework for shared goals, priorities, and strategies that help each participating federal agency leverage the resources of all participating agencies. This operational framework is starkly different from the explicitly directed nanoscience and nanotechnology investments of other nations reviewed by the panel.15
___________________
14 See Manufacturing USA, “AIM Photonics (American Institute for Manufacturing Integrated Photonics,” https://www.manufacturingusa.com/institutes/aim-photonics, accessed 04/16/2020.
15 The global competitive landscape is summarized in Chapter 3.
NNI Coordination
The NNI is overseen by the White House OSTP via the NSTC’s NSET Subcommittee, which comprises a representative from each major NNI participating department or agency. The National Nanotechnology Coordination Office (NNCO) provides administrative support to the NSET Subcommittee and acts as the primary point of contact for information on the NNI. The NNCO (1) provides technical and administrative support to the NSET Subcommittee, including the preparation of multiagency planning, budget, and assessment documents; (2) connects the NNI agencies and departments to academia, industry, professional societies, and foreign organizations; (3) provides public outreach on behalf of the NNI; (4) promotes access to, and early application of, the technologies, innovations, and expertise derived from NNI activities;16 and (5) develops, updates, and maintains the public-facing NNI website.17 The essential coordination work of the NNI, by NSET and the NNCO, is funded via “contributions” from the largest NNI participating agencies and departments at levels that are roughly proportional to their nanoscience and nanotechnology R&D expenditures, which are self-reported on an annual basis. Whereas it was originally proposed that these contributions should amount to 0.3 percent of the total NNI budget, it has been noted in previous NNI reviews that this level of support for the coordination effort has not been achieved, and appears to have been held flat at just less than $3 million, which for 2020 is about two-thirds of the proposed level of support.18 It has been reported to the committee that this model for supporting the NNI is essentially self-limiting, in that participating departments and agencies have a disincentive for reporting expanded R&D expenditures as nanotechnology, since doing so would trigger a higher contribution for support of the NNI mission and the work of NSET and the NNCO specifically. This is a very different coordination model from the directed funding allocations and robust support and coordination structures that other nations and regions use for investments in nanoscience and nanotechnology. The U.S. approach appears to be less agile and much less robust in the current dynamic international environment with increasing competitive threats.
___________________
16 See National Nanotechnology Initiative, “National Nanotechnology Coordination Office (NNCO),” https://www.nano.gov/about-nni/nnco, accessed 04/16/2020.
17 Located at www.nano.gov, accessed 04/16/2020.
18 See, for example, the narrative on page 31 of “The National Nanotechnology Initiative: Overview, Reauthorization, and Appropriations Issues,” J.F. Sargent Jr., 2014, Congressional Research Service, at https://fas.org/sgp/crs/misc/RL34401.pdf.
NNI Vision, Goals, and Program Component Areas
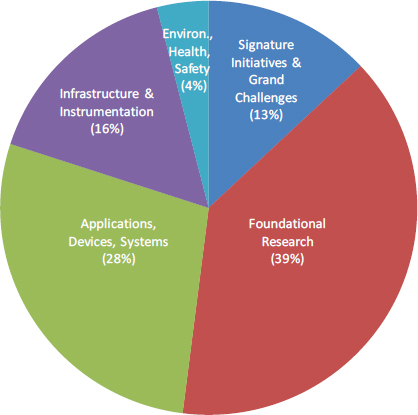
The NNI currently operates under a Strategic Plan published in October 2016. Within this plan, so-called Program Component Areas (PCAs) provide an organizational framework for categorizing the major NNI activities under which related projects and activities are grouped (see Box 1.2). Progress in the PCAs measure advancement toward the NNI’s vision and goals. The investment in each PCA is reported in the annual NNI supplement to the President’s Budget.19
The NNI Budget
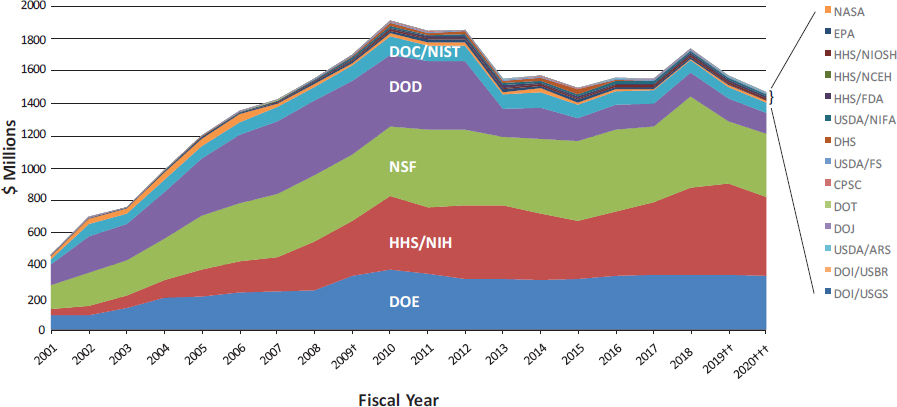
Annually, the NNCO prepares an NNI Budget Supplement to the President’s Budget, which also serves as an Annual Report for the NNI. The supplement to the President’s 2020 Budget requests over $1.4 billion for the NNI for continued investment in basic research, early-stage applied research, and technology transfer efforts.20 Including the 2020 request, the cumulative NNI investment has reached nearly $29 billion since the inception of the NNI. The budget distribution by agency since the start of the NNI is shown in Figures 1.1 and 1.2, while the largest agency/ department contributors are described in Box 1.3.
Since 2009, OSTP has worked with NNI agencies via the NNCO to assemble a set of Nanotechnology Signature Initiatives (NSIs) under PCA 1 that are intended to focus attention, resources, and more intensive program-level coordination on domains uniquely ready for accelerated development or that represent a priority national interest (see Box 1.2 and Box 1.4).
In 2014, in response to recommendations from the President’s Council of Advisors on Science and Technology (PCAST), OSTP worked with NNI member agencies to identify and select Nanotechnology-Inspired Grand Challenges, each intended to represent “an ambitious but achievable goal that harnesses nanoscience, nanotechnology, and innovation to solve important national or global problems and has the potential to capture the public’s imagination.”21 The Future Computing Grand Challenge that emerged from that process laid the essential groundwork for the recent launch of the National Quantum Initiative (NQI).22
___________________
19 See National Nanotechnology Initiative, “NNI Budget,” http://nano.gov/about-nni/what/funding, accessed 04/16/2020.
20 See National Nanotechnology Initiative, “NNI Supplement to the President’s 2020 Budget,” https://www.nano.gov/2020BudgetSupplement, accessed 04/16/2020.
21 See National Nanotechnology Initiative, “Nanotechnology Inspired Grand Challenges,” https://www.nano.gov/grandchallenges, accessed 04/16/2020.
22 C. Monroe, M.G. Raymer, and J. Taylor, 2019, The U.S. National Quantum Initiative: From act to action, Science 364(64390):440-442, doi: 10.1126/science.aax0578.
THE EVOLVING GLOBAL ENVIRONMENT
The combination of state-of-the-art facilities that allow increasingly complex nanostructures to be synthesized and characterized, appropriate investments in safety and standards, together with the remarkable scientific and engineering talent that has been drawn to the NNI program, has enabled the U.S. program to achieve remarkable scientific and technology advances. However, there are clear signs that the competitive backdrop against which so much has been achieved has been changing rapidly. The 2016 Triennial Review of the NNI identified a concern that the development of U.S. talent necessary to grow and sustain a vibrant U.S. nanotechnology program was showing signs of stagnating.23 It found that the number of science, technology, engineering, and mathematics (STEM) undergraduates was not increasing as rapidly as in some other regions of the world. Since this is the pool from which domestic students are drawn for graduate studies and to advance much of the R&D in nanotechnology, the future U.S. talent needed to support nano-related research and commercialization will likely be compromised, along with the prospects for growing the nation’s increasingly knowledge-based economy. The recent National Science Board (NSB) Science & Engineering Indicators 2020 report24 confirms these trends, as shown in Figure 1.3, and highlights the rapid growth in conferred STEM degrees in other countries, and especially in China. By 2016, the number of science and engineering (S&E) first undergraduate degrees
___________________
23 National Academies of Sciences, Engineering, and Medicine, 2016, Triennial Review of the National Nanotechnology Initiative, The National Academies Press, Washington, D.C., https://doi.org/10.17226/23603.
24 National Science Board, Science & Engineering Indicators 2020, https://ncses.nsf.gov/pubs/nsb20201/u-s-and-global-education.
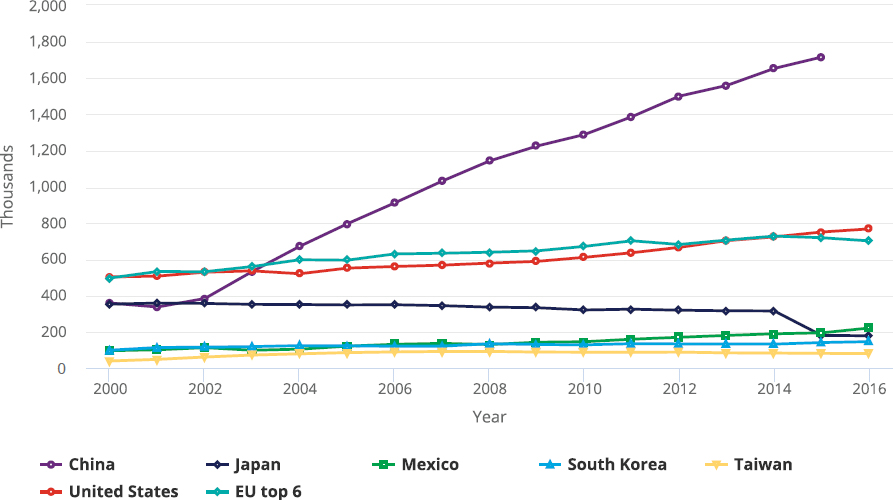
awarded by the United States had slowly risen to about 800,000, whereas in China, the number of similar awarded degrees had risen sharply to around 1.8 million. While the United States still leads in producing S&E graduates on a per capita basis, the trendline for China’s growth in S&E graduates suggests that this will not be true for long. Given the growing importance of a STEM-trained workforce for the economic prosperity of nations, these are concerning trends.
The same NSB report has also assessed the number of doctoral degrees awarded in science and engineering between 2000 and 2016, and those data are replicated in Figure 1.4. The United States awarded about 40,000 doctoral degrees in 2016. It can also be seen that the number of doctoral degrees awarded leveled off after a decade or more of sustained growth. The report shows that the top six research nations of the European Union (EU) continue to produce almost 50 percent more PhD degree
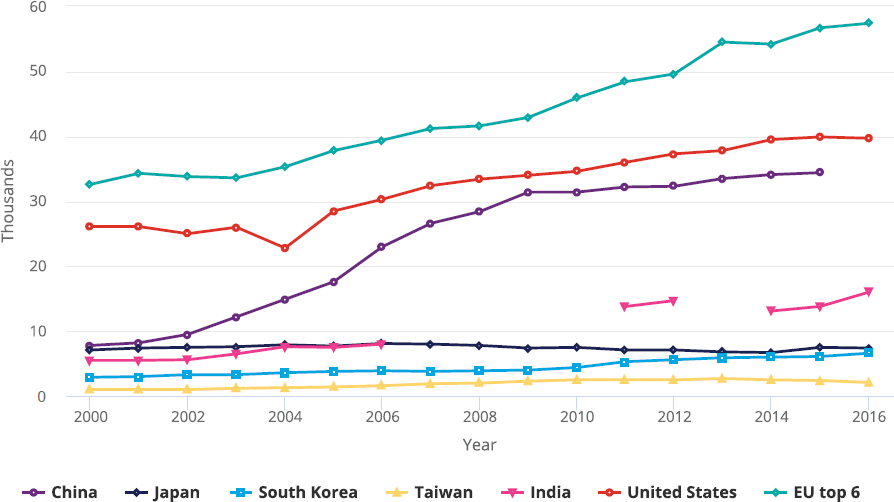
recipients per year than the United States.25 It also shows that Chinese PhD production has sustained a period of rapid growth, and now rivals the PhD production of the United States. The NSB report notes that a significant fraction of the PhD degrees awarded in the United States were granted to foreign students studying in the United States on temporary visas. For example, in 2017 temporary visa holders were awarded about one-third of the doctoral S&E degrees in the United States. Most of these students (between 64 and 71 percent) were subsequently granted another visa and remained in the United States for at least another 5 years. However,
___________________
25 Considering that the number of PhD degrees awarded by the EU top 6 is certainly only a fraction of the PhD degrees of all EU countries, the lead of the EU in this metric becomes even more pronounced.
the committee was concerned that if the number of students granted visa extensions declined, or if these talented people chose to work elsewhere, the domestic workforce pipeline is likely to be inadequate for the United States to successfully compete in future nanoscience discovery and nanotechnology commercialization.
To gain insight into the changing global nano-related research environment since the NNI’s launch, the committee reviewed the number of research papers on nanotechnology published annually. Zhu et al. have analyzed these published papers by region of origin.26 Their analysis indicates that the number of nanotechnology-related papers published per year has grown from 20,000 in 2000 to about 160,000 in 2016—a global annual growth rate of about 15 percent. However, the growth in papers from the United States has lagged behind that of several other regions. Consequently, while the United States contributed about 30 percent of the research papers in 2000, by 2016 this had decreased to ~18 percent—well below the contribution from the EU (25 percent) and notably behind China (33 percent). While the United States remains the largest contributor of high-impact publications (it contributes about two-thirds of the publications in Nature, Science, and PNAS, for example), contributions to these journals from the EU and China are growing rapidly. Deeper assessments indicate that the United States continues to innovate, coordinate, and focus research funding to achieve significant success. However, extrapolation of current trends indicates that the nation’s leadership in the most innovative areas is beginning to be challenged.
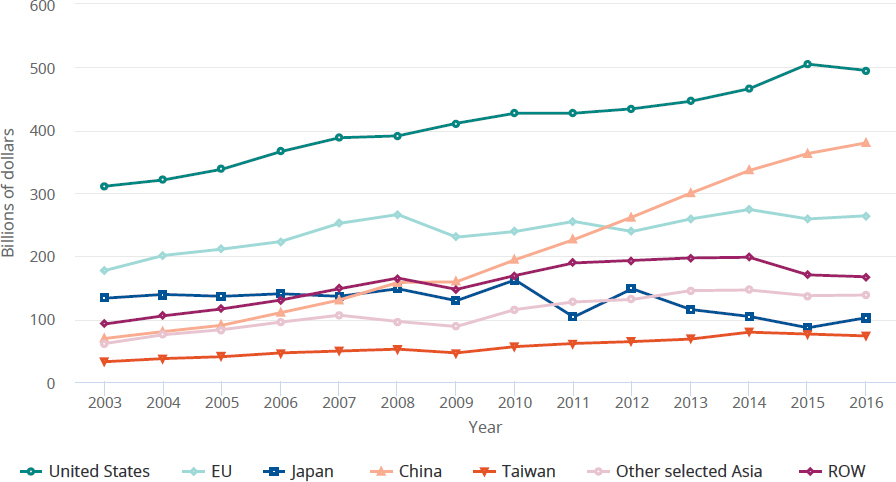
The review committee understood from the outset that past NNI investments in nanotechnology have already made robust contributions to the U.S. high-technology economy. The most recent NSB report has determined the regional distribution of economic contributions arising from high-technology (HT) manufacturing, to which nanotechnology makes a substantial contribution, and is reproduced in Figure 1.5 for the period 2003-2016. Note that in 2003, about $300 billion of HT manufacturing output occurred in the United States, followed by the EU and Japan. The report shows that by 2016, the U.S. contribution to the approximately $1.6 trillion of HT manufacturing had grown to around $500 billion, but that from China had grown faster, exceeding that of the EU (which had not changed since 2008) and Japan, and was rapidly approaching the U.S. level. These observations motivated the review committee to investigate the global nanotechnology enterprise, and the effectiveness of the NNI technology transfer activities, and to propose several changes to the coordination of the U.S. commercialization effort.
___________________
26 H. Zhu, S. Jiang, H. Chen, and M.C. Roco, 2017, International perspective on nanotechnology papers, patents, and NSF awards (2000-2016), Journal of Nanoparticle Research 19:370, https://doi.org/10.1007/s11051-017-4056-7.