


Below is the uncorrected machine-read text of this chapter, intended to provide our own search engines and external engines with highly rich, chapter-representative searchable text of each book. Because it is UNCORRECTED material, please consider the following text as a useful but insufficient proxy for the authoritative book pages.
36 C H A P T E R 4 This chapter contains five case examples of North American transit agencies that responded to the survey and have relatively robust and well-established bus TSP systems and practices. The synthesis team contacted selected case example agencies and arranged a web conference with transit agency staff. In this chapter, meetings with transit agency staff are not cited as sources. This chapterâs case examples are organized as shown in Table 20, which also displays each case example agencyâs key operational statistics. San Diego Metropolitan Transit System The San Diego Metropolitan Transit System (MTS) is a joint powers authority agency gov- erned by a 15-member board of directors. The board is composed of elected officials from the cities in MTSâs service area as well as San Diego County. MTS is a multimodal agency with three subsidiary corporations: ⢠San Diego Trolley, Inc. (SDTI) ⢠San Diego Transit Corporation (SDTC) ⢠San Diego & Arizona Eastern Railway Company (SD&AE) MTS operates three modes of service, either directly through the subsidiary corporations or contracted out to private operators: ⢠Light rail, operated by SDTI ⢠Bus, operated by SDTC, subdivided into â Fixed route â Paratransit ⢠Freight, using SD&AE right-of-way but contracted to private operators The operating statistics for these modes are shown in Table 21. MTS was chosen as a case example because its TSP system involves collaboration between numerous agencies, including the transit agency (MTS), the city and state departments of trans- portation that own the traffic signals, and the local metropolitan planning organization (MPO). This collaboration has been successful, as MTS reports significant benefits from TSP, and can serve as a positive example for other agencies with similarly complex operating environments. Bus TSP Program Overview MTS has a single TSP deployment group, which includes 50 intersections, four bus routes, and 130 buses. Some parameters vary at the intersection level, but all TSP-enabled intersections Case Examples
Case Examples 37 Table 20. Case example agency key operational statistics. Case Example Agency Region Bus Peak Vehiclesa Year TSP Implemented No. of Deployment Groups TSP Intersections TSP Buses San Diego Metropolitan Transit System San Diego, CA 512 2014 1 50 130 San Francisco Municipal Transportation Agency San Francisco, CA 674 1998 1 450 900 Toronto Transit Commissionb Toronto, ON, Canada 1,920 c 1991 1 200 2,000 Rhode Island Public Transit Authority Providence, RI 195 2014 1 59 223 King County Metro Transit Department Seattle- Tacoma, WA 1,155 1999 3 or more 200 1,500 NOTES: aBus peak vehicles includes all fixed-route bus modes. bData for the Toronto Transit Commission were obtained from the Toronto Transit Commission website (2019). cThe Toronto Transit Commission has 1,920 buses; fewer would be used in peak service. SOURCE: National Transit Database (2017), unless otherwise specified. Table 21. MTS key annual operating statistics by mode. Mode Unlinked Passenger Trips Vehicles Operated at Maximum Service Commuter Bus 287,252 17 Demand Response 636,365 174 Light Rail 37,638,945 97 Bus 49,632,244 495 Total 88,194,806 783 SOURCE: National Transit Database (2017). and buses use similar technology and business rules. TSP is currently used on rapid routes and is considered to be part of a package of transit priority measures, including queue jumps and dedicated lanes. Most of the experience cited in this case example comes from two bus routes: route 215, which has a short segment of dedicated lanes but otherwise runs in mixed traffic; and route 225, which has mostly dedicated lanes. Route 215 shares a pool of articulated buses with other routes, so all of these buses are equipped for TSP. Route 225 has a dedicated fleet of buses that are all equipped for TSP. MTS, through its subsidiary SDTC, owns and maintains the transit fleet, including the TSP hardware on board buses. The traffic signals along the TSP-equipped routes are owned and maintained by the City of San Diego, the City of Chula Vista, and the California Department of Transportation (Caltrans). The signal owner is responsible for TSP hardware installed in the sig- nal cabinet. IBI Group is a consultant to the San Diego Association of Governments (SANDAG, the regionâs MPO) and works with the cities on traffic signal operations, including TSP system operations and maintenance. Bus TSP History MTS first deployed TSP in 2014 and uses it on rapid bus routes. Rapid routes have replaced some of the busiest regular bus routes in the MTS system. TSP has been deployed during the conversion to rapid service and has been implemented at the same time as other transit priority measures, such as queue jumps and dedicated lanes. At the time of planning for TSP, the goals for TSP were to reduce bus travel time, improve schedule reliability, and improve headway reliability.
38 Transit Signal Priority: Current State of the Practice Both MTS and SANDAG played a constructor and designer role during TSP deployment. TSP deployments have been funded locally, primarily with funds from TransNet, a one-half-cent sales tax in San Diego County for transportation, first approved in 1987 and extended in 2004. Partnerships, Governance, and Oversight The governance structure includes the transit agency (i.e., MTS), signal owners, and the MPO. The signal owners are the City of San Diego, the City of Chula Vista, and Caltrans. TSP is provided at signals owned by San Diego and Chula Vista, and there are formal agreements in place to define maintenance responsibilities. Currently, active TSP is not provided at any signal owned by Caltrans. Caltrans-owned signals have been retimed for passive priority as part of the rapid route conversion, but this retiming is not covered by any formal agreement. There are, however, future plans to implement TSP at freeway ramp meters owned by Caltrans. IBI Group, as a consultant to SANDAG, works on the operations and maintenance of traffic signals, including TSP systems. MTSâs service area covers most of San Diego County. In the northern portion of the county (including Escondido and Oceanside), local bus service is provided by a separate agency, the North County Transit District (NCTD). Both agencies have rapid routes, with similar branding, that use TSP. MTS and NCTD rapid routes currently do not overlap, but future intero perability of TSP may be possible because SANDAG has been involved in the design, implementation, and maintenance of both TSP systems. Bus TSP System Design MTSâs TSP system uses McCain signal controllers with infrared detectors. The system is decen- tralized, with direct bus-to-signal and signal-to-signal communication. Buses have infrared emitters that have a range of approximately 800 ft. Many signals use a shorter detection distance, as buses must clear the nearest upstream signal or bus stop before sending a priority request. Some intersections with dedicated lanes use loop detectors in the pavement to detect buses. When a bus is detected, the detector passes its information to the phase selector card, which communi- cates with the signal controller. Signals on route 225 have peer-to-peer communication. On this corridor, an initial priority request is sent when the bus is detected up to two intersections upstream, and the busâs arrival time is updated when it clears the nearest upstream signal. Bus TSP Business Rules and Parameters MTSâs TSP system uses a similar set of business rules and parameters at all intersections, giving MTS one deployment group. Establishing Business Rules and Parameters The current business rules and parameters were established in discussions with local stake- holders and informed by analysis and modeling. IBI Group performed a capacity analysis at many intersections, calculating the expected number of TSP requests and their impact on signal operations, and presented the results of the analysis to the cities. IBI Group also has a monitor- ing contract and has adjusted parameter values in accordance with field conditions. The update cycle for business rules and parameters is approximately every 1 to 3 years. Requesting Priority Priority is unconditional: all rapid buses request priority at TSP-enabled intersections. Buses can be granted priority in the form of an extended green; an early green; phase insertion, rota- tion, or skipping; or a special bus-only signal.
Case Examples 39 Granting Priority MTS aims to provide as much priority to the buses as possible, but there is some variation between intersections. The starting point for a green extension or early green duration param- eter is 20 seconds, or 10 seconds for left turns. The use of extended green; early green; and phase insertion, rotation, or skipping depends on when the bus arrives in the signal cycle. The rapid routes pass through a mix of business districts and residential areas. Business districts have more pedestrian calls, which then require a minimum phase length for the cross street and reduce flexibility in signal timing. Some signals on route 215 use advanced traffic control, which allows the same phase to come up multiple times in the same cycle. Special bus-only signals are used when there is a bus-only lane or a bus-only phase (e.g., a left turn into a transit center). Special Rules and Exceptions MTS restricts TSP to buses operating a rapid route. However, there are no other special rules or exceptions (e.g., based on time of day) for requesting or granting priority. Operations, Monitoring, and Maintenance The main challenge MTS has experienced is assuring the continued operation of the TSP system. During the deployment of the system, SANDAG was concerned about performance slowly deteriorating because of bugs, unforeseen problems, and changing traffic conditions, and engaged IBI Group on a monitoring contract. MTS and IBI Group have encountered problems over time, including signal software losing coordination, skipping side streets and pedestrian calls, and an update to bus announcements disrupting the infrared emitters. IBI Group has had to update parameters in response to field observations and new developments. MTS reported that generating buy-in from all stakeholders was a minor challenge. The origi- nal implementation of TSP was done as a package with the introduction of a rapid service and the construction of queue jumps and dedicated right-of-way. This type of bus service was a first for San Diego, and there was pushback from the local community as well as concerns about the speed of buses, on-street parking, and so on. MTS now sees the perceptions of TSP improving, as the first corridor (route 225) is viewed as a success and other neighborhoods are asking for something similar. Bus TSP Effectiveness and Benefits Qualitatively, MTS has seen modest improvements in bus travel times, schedule adherence, headway adherence, bus travel time variability, and headway variability with TSP, as well as significant improvements to delay at intersections. The best results have been observed on route 225, which has a long stretch with dedicated lanes and TSP, producing faster trips and shorter dwell times. MTS notes that the general public is impressed by the technology, view- ing TSP as âfuturistic.â MTS believes that the perception of speed helps to attract choice riders. There is still some confusion among the general public about what TSP does; some riders believe it guarantees a green light for buses and therefore complain when the bus has to stop on red. TSP on route 215, in contrast, is less visible, because buses are in mixed traffic for most of the route, and the corridor has heavy car and pedestrian traffic. Still, ridership on route 215 has grown significantly since the introduction of rapid service. MTS expects overall performance to improve and TSP benefits to be more noticeable once a 4- to 5-mile stretch of dedicated lanes opens. Summary MTS has a newer TSP system that currently covers 50 intersections, four routes, and 130 buses. TSP is used only for rapid routes and is packaged with other transit priority measures, including queue jumps and dedicated lanes. The system is decentralized, with buses generating
40 Transit Signal Priority: Current State of the Practice priority requests when they enter the detection range of a signal. Detection is done through infrared emitters in some locations and in-pavement loop detectors in other locations where there are dedicated bus lanes. One corridor also has peer-to-peer communication between sig- nals, so a signal will receive an initial priority request when the bus is two intersections upstream. Priority is requested unconditionally, and signals will grant the request if it is possible within the signal timing constraints. Buses may receive a green extension; an early green; phase rotation, insertion, or skipping; or a special bus-only signal. Challenges MTS has experienced challenges related to stakeholder buy-in and continued operation. ⢠Stakeholder buy-in. Local stakeholders were unfamiliar with TSP and other transit priority measures, and there was resistance to the first rapid service deployment. Now that there is a working example, the community has been much more receptive to further deployments. ⢠Continued operation. TSP systems require regular maintenance and troubleshooting, and sometimes break after software updates to other systems. Notable Practices The governance structure is a good example of coordination between multiple partners, and MTSâs use of peer-to-peer signal communication is innovative and likely increases the benefits of TSP. ⢠Partnerships. MTSâs TSP system is a collaborative effort involving the transit agency (MTS), the local MPO (SANDAG), signal owners (San Diego, Chula Vista, and Caltrans), and a con- sultant responsible for maintenance (IBI Group). SANDAG has played an important role in coordinating all the partners. ⢠Peer-to-peer signal communication. MTSâs use of peer-to-peer signal communication to initi- ate priority requests two signals downstream is innovative. Increasing the advance notice is likely beneficial for priority actions that involve changing the signal phase (i.e., early green, phase insertion/rotation/skipping, and special bus-only signal). Lessons Learned MTSâs experience with TSP contains several lessons for other transit agencies. ⢠Pilot testing. MTS has found that, though theoretical models are useful for designing a TSP system, there are still software challenges to address and parameter fine-tuning to be done before service begins. On the first TSP deployment, MTS had planned for a 3-month pilot testing phase between construction completion and the beginning of service. Because of con- struction delays, the testing phase was reduced to 3 days. More time would have been useful, because debugging software and tuning parameters are done much more easily in a test envi- ronment than in a fully operative system. ⢠Plan for maintenance. MTS stressed the importance of having a responsive and proactive partner in charge of maintaining the system. ⢠Technology. MTS uses a distributed TSP system with infrared and loop detectors as its sensor technology but recommends that agencies considering a new system look into the latest tech- nology. MTS and IBI Group mentioned a centralized system and GPS and radio frequency sensors as technologies to consider. San Francisco Municipal Transportation Agency The San Francisco Municipal Transportation Agency (SFMTA) is a department of the City and County of San Francisco. It is a large multimodal oversight agency responsible for sur- face transportation infrastructure and operations and is organized into several divisions. The
Case Examples 41 divisions relevant to this case example are Sustainable Streets, responsible for streets, parking, and traffic signals, and Transit, the transit agency, also referred to as the San Francisco Municipal Railway (Muni). SFMTA operates several different modes of transit service: ⢠Bus, including services operated by trolley coach (i.e., trolleybus), which can be subdivided into â Local routes; â Rapid routes, denoted by the letter R (e.g., 38R), which are limited-stop services that are always paired with a local route; and â Community services, which primarily provide first-/last-mile connectivity to transit hubs. ⢠Muni Metro, composed of light rail routes that share a single subway tunnel in downtown San Francisco and have a mix of exclusive right-of-way and street running outside of downtown. ⢠Historic Streetcar, composed of streetcar routes with both exclusive right-of-way and street running sections, operated with historic rolling stock. Unlike many heritage streetcars, these routes are an integral part of the transit system and accept standard fares. ⢠Cable Car, including three routes operated primarily as tourist attractions with separate fares. ⢠Paratransit, which is contracted to Transdev, a transit service contractor, for operations. The operating statistics for these modes are shown in Table 22. In addition to the transit services listed above, SFMTA has three major projects under construction: the Central Subway (a light rail extension) and bus rapid transit lines on Van Ness Avenue and Geary Boulevard. SFMTA was chosen as a case example because it was an early adopter of TSP, with an initial deployment in 1998, and has a large TSP system today, including 450 intersections, 11 routes, and 900 buses. Additionally, SFMTA is an example of a unified governance structure, where the same agency operates both traffic signals and buses. SFMTA also provided detailed figures for TSP deployment cost. Bus TSP Program Overview SFMTA has a single TSP deployment group that includes 450 intersections, 11 bus routes, and 900 buses (including trolleybuses). Some parameters vary at the intersection level, but all TSP-enabled intersections and buses use similar technology and business rules. The deploy- ment includes intersections across SFMTAâs service area. TSP is currently enabled on fre- quent routes, a category that includes some routes with a split local/rapid service pattern, and others served by trolleybuses that have only local service because the electrical wires do not permit passing. All buses and trolleybuses in the fleet are equipped with the technology to use TSP. As a multimodal transportation agency, SFMTA owns and maintains both the traffic signals and the transit fleet. The Sustainable Streets division owns and maintains the traffic signals, and Mode Unlinked Passenger Trips Vehicles Operated at Maximum Service Cable Car 6,224,072 27 Demand Response 475,786 132 Light Rail 50,993,166 131 Bus 107,795,832 477 Streetcar Rail 7,471,854 24 Trolleybus 53,301,250 197 Total 226,261,960 988 SOURCE: National Transit Database (2017). Table 22. SFMTA key annual operating statistics by mode.
42 Transit Signal Priority: Current State of the Practice is responsible for the hardware attached to the signal controller that receives and processes TSP requests. The transit agency owns and maintains the bus fleet and is responsible for the GPS receivers on the buses. Bus TSP History SFMTA was an early adopter of TSP, starting in 1998 with an initial deployment at 10 intersec- tions on the 14-Mission route. Because this route is served by trolleybuses, the first TSP system used detectors on the overhead contact wires. A few years later, the original 10 intersections were converted to an Opticom infrared system, and 30 more intersections on the 14-Mission and 38-Geary routes were added. A subsequent phase added TSP to the 9-San Bruno route. In 2013, a large TSP deployment replaced older equipment with a GPS-based Opticom system and extended TSP to all rapid bus routes. At the time of planning, the goals for TSP were to reduce bus travel time, reduce bus travel time variability, and improve schedule reliability, as well as to implement an advertised feature of a high-frequency service bus. SFMTA selects entire bus routes for TSP deployment, using route type (e.g., rapid), street network or corridor type, and overall route ridership as selection criteria. The most recent deployment in 2013 was funded entirely with local funds, including sales tax revenues, bond measures, and transportation impact fees paid by developers. The use of local funding for transit capital costs, especially ballot measures, has been common in California. Recent examples include Measure W (San Mateo County, 2018), Regional Measure 3 (the Bay Area, 2018), Measure M (Los Angeles County, 2016), and Measure BB (Alameda County, 2014). SFMTA noted that it finds local funds easier to use than federal funds because local funds are more flexible. Partnerships, Governance, and Oversight The governance structure is very simple, because SFMTA is responsible for traffic signals, traffic signal timing, and transit services. Formal agreements between traffic signal and transit operators are not necessary, as the entire TSP system is managed by one entity. SFMTAâs service area covers the city of San Francisco, which is part of a larger region (the San Francisco Bay Area, or simply the Bay Area) with many transit agencies, some of which have their own TSP systems. These systems are not currently interoperable. AC Transit, the Alameda-Contra Costa Transit District, based in Oakland, uses the same TSP equipment but does not need TSP in San Francisco because its routes serve only the Salesforce Transit Center and have no street running. SFMTA has a relationship with Golden Gate Transit and will allow it to use transit-only lanes and TSP on the upcoming Van Ness Bus Rapid Transit corridor. Golden Gate Transit is using its own funds to purchase the necessary onboard equipment. Bus TSP System Design SFMTAâs TSP system uses components manufactured by GTT-Opticom, with GPS receivers on buses and D4 signal controllers. The system is decentralized, with direct bus-signal com- munication. The onboard GPS tracks bus location to establish that a bus is within a detection zone, and the bus is detected by radio antenna at the intersection. Detection zones are one block upstream of the intersection. When a bus is detected, the radio antenna passes its information to the phase selector card located within the traffic signal cabinet, which communicates with the signal controller.
Case Examples 43 Bus TSP Business Rules and Parameters SFMTAâs current TSP system uses a similar set of business rules and parameters at all inter- sections, giving SFMTA one deployment group. Establishing Business Rules and Parameters The current business rules and parameters were based on intuition and SFMTAâs experi- ence operating traffic signals and buses. The goals were to prioritize buses to the extent pos- sible while establishing rules to avoid wasted priority calls, excessive pedestrian wait times, and bus bunching. Business rules and parameters were changed in 2013 when the TSP system was upgraded. There is no regular update cycle, but business rules and parameters may be changed if problems emerge. Requesting Priority Priority is essentially unconditionalâthe only condition for sending a request is that the doors must be closed. This condition is used to disable requests from near-side stops. All other business rules are checked by the phase selector. On routes with both rapid and local service, priority requests indicate which service the bus is operating. At select intersections (2% of those with rapid and local service), the phase selector rejects requests from local busesâas those specific intersections have near-side transit stops that only the local servesâin an effort to focus on providing TSP to just the rapid buses. Buses can receive priority in the form of an extended green, early green, or special bus-only signal. Granting Priority Extended greens last for a minimum of 7 seconds and up to 15 to 20 seconds. If there is not enough flexibility in the cycle to provide a 7-second extension, then priority is denied. The 7-second minimum exists because SFMTA has noticed that bus operators watch pedestrian countdown timers and expect to stop when the time is low and they are still far from the inter- section. A 7-second extension seems to be enough time for operators to react, enter, and clear the intersection. The maximum extension depends on the cycle length, with a 15-second extension for cycles up to 75 seconds long and 20 seconds for cycles more than 90 seconds long. SFMTA is concerned about pedestrians crossing on red if the extension were any longer. Check-out detec- tion is used. Early greens are provided 5 to 10 seconds early, depending on the demand on the cross street and flexibility in the cycle. Signal timing varies by time of day, so the maximum green extension and early green also vary by time of day. When priority is granted, conflicting phases are reduced in the next cycle to maintain consistent offsets with other signals. Special Rules and Exceptions SFMTA also has business rules related to lockout, location, and direction of movement. The lockout duration is one cycle, to limit disruptions to other road users. Since moving to GPS- based equipment, SFMTA has experienced âurban canyonâ issues (where tall buildings dis- rupt GPS signals) in downtown San Francisco and has disabled TSP at 10 affected intersections because of this issue. TSP is also disabled where a bus intersects a major four-lane arterial and where a near-side stop is present. Operations, Monitoring, and Maintenance Different operation and monitoring practices are used for different parts of the system. For TSP equipment, the manufacturer, GTT, records calls per bus and per intersection and sends a weekly report. Anomalies are flagged, investigated, and fixed by the manufacturer if related
44 Transit Signal Priority: Current State of the Practice to onboard equipment. Issues with the traffic signal equipment are flagged and investigated by SFMTA. All signals are now connected to a central traffic monitoring center, and SFMTA can look at the controller remotely. Complaints from the public are taken through the 311 system and are referred to SFMTA or the manufacturer, depending on whether they relate to signal timing or TSP. SFMTA notes that it is often hard to tell whether problems are bus- or intersection-related. Another challenge has been to manage the expectations of riders and internal staff. There remains a misconception that TSP gives guaranteed greens to buses. On the operations side, SFMTA has found that operators are sometimes reluctant to take advantage of TSP because it puts them ahead of schedule. Finally, SFMTA notes that it is easier to obtain funding for new deployments and new intersections than to secure funding for ongoing maintenance. Bus TSP Effectiveness and Benefits Qualitatively, SFMTA has seen modest improvements in bus travel times, bus travel time vari- ability, and delay at intersections with the current TSP system. The current GPS-based system dates only to 2013, and SFMTA is still working on quantifying benefits. Travel time savings of 7% and intersection approach delay reductions of up to 50% have been observed on select segments. SFMTA is planning a trial where TSP will be turned off on some routes for 1 month to perform a before-and-after analysis. Baseline data were not collected before the 2013 deploy- ment, and in some cases TSP has been installed at the same time as other transit improvements (e.g., a dedicated bus lane), further complicating TSP benefit assessment. Summary SFMTA has a large TSP system that covers 450 intersections, 11 bus routes, and 900 buses. The current system was deployed during a large citywide project in 2013. The TSP system is decentralized, with buses generating priority requests based on GPS location and communicat- ing directly with traffic signals using radio antennas. Some business rules are checked on the bus side and others on the signal side. Buses may be granted a green extension, early green, or special bus-only signal. Priority is essentially unconditional, except where it is disabled because of near- side stops, intersections with four-lane arterials, and intersections with GPS location problems, as well as during one-cycle lockout periods. Challenges SFMTA has experienced some challenges related to transportation policy decisions, techno- logical limitations, and performance measurement. ⢠Transportation policy. The city of San Francisco has made various policy decisions to favor transit and pedestrians, but sometimes these priorities conflict. The majority of pedestrian signals are on recall (no button press required), and minimum crossing times are more generous than the national standard. However, this means less flexibility in the cycle to provide TSP. ⢠Technological limitations. After installing a GPS-based TSP system, SFMTA encountered âurban canyonâ issues, where GPS locations are unavailable or unreliable because of interfer- ence from tall buildings. SFMTA has elected to disable TSP at 10 intersections downtown that were most affected by these issues. ⢠Performance measurement. SFMTA has found it difficult to quantify the benefits of TSP, partly because of a lack of data from before the system was installed. TSP was also installed at the same time as other transit improvements (e.g., transit-only lanes, bulb-outs, and updated signal timing to increase pedestrian minimums), further confounding benefit analysis.
Case Examples 45 Notable Practices SFMTAâs use of service differentiation and experience with transportation policy is notable, and different from many other agencies that participated in the survey. ⢠Service differentiation. On corridors with both rapid and local service, SFMTA has the capa- bility to grant priority only to rapid buses and does so at select intersections (2% of all inter- sections with rapid and local service). The service type is encoded in the communication from bus to signal, and the phase selector denies requests from local buses. ⢠Transportation policy. In San Francisco, the key tradeoff in the discussion of business rules and parameters has been balancing the needs of pedestrians and transit vehicles. This experience shows there are still tradeoffs in TSP system design, even in a city that is moving away from auto-oriented policies. Lessons Learned SFMTAâs experience with TSP, particularly its rapid deployment, contains several lessons for other transit agencies. ⢠Operator behavior. Because the majority of pedestrian signals are on recall, SFMTA has learned that bus operators use the pedestrian countdown timers like signal countdown tim- ers. SFMTA first tried shorter green extensions but found that operators were not taking advantage because they expected the signal to turn red and were already preparing to stop. The green extensions are now longer, so that operators can see the signal is still green and have time to clear the intersection. ⢠Baseline data. SFMTA had a short timeline to deploy the current TSP system because of fund- ing availability and did not collect baseline data from before TSP implementation. The agency is now planning a 1-month TSP shutdown on certain routes to collect before-and-after data for a full quantitative analysis of benefits. ⢠Establish foundational TSP policies and goals. SFMTA deployed TSP first and developed policy guidelines after the fact, but recommends that other agencies establish policies and goals before starting deployment and establishing business rules and parameters. ⢠Iterate. SFMTA deployed its TSP system all at once because of funding availability, but recommends that other agencies consider deploying one route at a time to test and refine parameters. Toronto Transit Commission The Toronto Transit Commission (TTC) operates public transit service in the Greater Toronto Area, primarily in the City of Toronto. TTC is an agency of the City of Toronto, responsible to the Toronto City Council. TTC operates several different modes of transit service, including the following: ⢠Bus, with 145 routes ⢠Streetcar, with 11 routes that are primarily street running ⢠Subway, with three heavy rail routes ⢠Scarborough Rapid Transit, which is one light metro line ⢠Paratransit, which is operated by the Wheel-Trans division ⢠Community Bus, with five accessible bus routes operated by the Wheel-Trans division The operating statistics for these modes are shown in Table 23. TTC provided operating sta- tistics to the study team because as a Canadian agency it does not report to the National Transit Database.
46 Transit Signal Priority: Current State of the Practice TTC was selected as a case example to represent large bus operators and the Canadian experi- ence with TSP. It was the earliest adopter of TSP in the survey (first deployment in 1991) and makes extensive use of TSP for left-turning buses, which is a different use case from many other transit agencies. Bus TSP Program Overview TTC uses TSP for both streetcars and buses and considers them to be essentially the same system (i.e., giving priority to transit vehicles in mixed traffic and in semi-exclusive rights- of-way). Because the scope of this study is limited to bus TSP, the facts and descriptions included in this case example apply only to the bus portion of TTCâs TSP system. TTCâs bus TSP system consists of a single deployment group (i.e., similar business rules and parameters are used systemwide) that includes four bus routes as well as a number of isolated intersections throughout the city where buses make left turns. The four bus routes are high- frequency routes with headways of 3 to 4 minutes. With the deployment of articulated buses, the headways have been widened on some routes. Approximately 200 intersections through which buses operate are currently equipped with TSP, and the entire TTC bus fleet of more than 2,000 buses are equipped with transponders. TTC owns and maintains the entire TSP system, although it coordinates with two other divi- sions within the City of Toronto. For example, the City of Toronto Transportation Services (hereinafter referred to as Transportation Services) owns and maintains the traffic signals, and Toronto Hydro is the electric utility that owns and maintains some of the poles that detector lead-in cables are attached to. Bus TSP History TTC first deployed TSP in 1991 on its streetcar routes, which provide frequent service. There are approximately 200 TSP-equipped intersections through which streetcars operate. The vehi- cle detection technology included two components: the transponder used by streetcars for track switching, and a streetcar receiver module (SRM), which was developed by Novax to receive the transponder signal. The first bus route deployment was in 1998. TTC worked with Novax to develop a transponder for buses that was compatible with the SRM. TTC installed the transpon- ders on its entire bus fleet, one bus garage at a time, deploying TSP on the routes that made the most sense in each garage. The original goal for TSP was primarily to reduce operating costs by reducing running time and providing faster service at the same frequency with fewer vehicles. Bus routes were selected according to the frequency of service (less than 5 minutes) and the number of intersections Mode Unlinked Passenger Trips Vehicles Operated at Maximum Service Bus 261,112,835 1,920 Streetcar 55,914,914 241 Subway 213,011,622 848 Scarborough Rapid Transit 3,176,627 28 Paratransit (Wheel-Trans) 4,141,842 613 Community Bus (Wheel- Trans) 43,443 7 Total 537,401,283 3,657 SOURCE: Toronto Transit Commission (2019). Table 23. TTC key annual operating statistics by mode.
Case Examples 47 on the route (more intersections provide more opportunities for time savings). The original plans were to deploy TSP on one route annually. Subsequently, there were plans to accelerate the implementation, and to eventually deploy TSP at a total of 1,500 intersections. However, in 2004, TTC ran into problems running overhead wires to connect the in-ground antennas that detect vehicles to the traffic signal, because of new requirements by Toronto Hydro, and deploy- ment to additional bus routes stopped. In later years, Transportation Services expressed concerns about TSP expansionâs impacts on other road users. Since 2005, TTC has focused on isolated left turns where buses experience significant delays. TSP at these locations allows buses to call a special left turn phase that is not available to general traffic, or may be callable by general traffic but is extendable beyond the normal maximum duration only by transit vehicles. TTC has an annual capital budget of 5 to 6 million Canadian dollars (Can$5 to Can$6 mil- lion) for transit priority, which includes TSP and other measures such as queue jump lanes. The budget carries over from year to year if it is not spent. Left turn TSP or regular TSP is sometimes funded by developers at individual intersections to mitigate the impact of traffic generated by new developments. Partnerships, Governance, and Oversight TTC owns and maintains the bus fleet and all TSP equipment, including the SRMs located inside the signal cabinets. TTC coordinates with Transportation Services, which owns and main- tains the traffic signals, but there is no formal agreement. Originally, TTC provided funding for TSP installation and maintenance and Transportation Services operated the system. Now TTC has taken over installation and maintenance of TTC-funded TSP and deals directly with the signal maintenance contractor. TTC provides all funding for most new TSP installations. Transportation Services funds the implementation of TSP at newly signalized intersections on existing TSP-equipped routes (i.e., âinfillâ intersections). Originally, TTC had an agreement with Toronto Hydro where both agencies could attach wires to the other agencyâs poles. This agreement was used to install many of the detector lead-in cables connecting transit vehicle loop antennas to the signal cabinets. Since 2004, Toronto Hydro has required TTC to upgrade all existing installations to its current standards and undertake full pole engineering to confirm that each pole can accommodate the additional load from the detector lead-in cable. Although TTC has upgraded its existing installations, the requirement for full pole engineering and a subsequent requirement for an annual attachment fee have created an obstacle to further TSP deployment. TTC is exploring alternative selec- tive detection system technologies to potentially replace in-ground loop antennas and hardwire detector lead-in cables. Several neighboring transit agencies have TSP, but there is no interoperability at this time. There is also not much route overlap, as most TTC routes stop at Toronto city limits. Bus TSP System Design TTCâs bus TSP system uses Novax onboard transponders and Peek ATC-1000 signal control- lers. The system is decentralized, with direct bus-to-intersection signal controller communica- tion. Each intersection has check-in and check-out detectors. Some intersection approaches have two or more check-in detectors. The detectors are in-pavement antennas linked to the signal cabinet by a detector lead-in cable, which typically runs overhead. Check-in detectors are typically placed between 30 m and 300 m (98 ft to 984 ft) upstream of the intersection, depending on the green extension algorithm used and whether or not there is a stop within
48 Transit Signal Priority: Current State of the Practice the detection zone. (For detection zones with bus stops, expected dwell time is considered in the timing of the priority request.) The typical maximum green extension for through vehicles is presented in Table 24. The design extension is less than the maximum extension to account for some variability in travel time and dwell time. The expected travel time and dwell time can be accounted for by time of day. Check-out detectors are typically placed just after the stop bar. However, for transit vehicles in their own right-of-way, check-out detectors are sometimes placed upstream of the stop bar, when extensions are served in green/âwalkâ (allowing the vehi- cle to clear the intersection during the flashing âdonât walkâ). Bus TSP Business Rules and Parameters TTC has only one deployment group (i.e., similar business rules and parameters are used for the entire system). However, there are some differences between the two use cases: for bus corridors and for isolated left turn intersections. Establishing Business Rules and Parameters The green extension algorithms were developed in collaboration with Transportation Ser- vices. The green extensions were designed to be fairly long, because many bus stops are near side and the dwell time at these stops is uncertain. Parameter values are based on functional class: 30-second green extensions (green/walk) are typically allowed at minor intersections with short pedestrian clearance times, while 16-second extensions (green/solid donât walk) are typically allowed at major intersections with long pedestrian clearance times. At some intersec- tions, the maximum green extension is 14 seconds in green/walk andâfollowing flashing donât walkâ16 seconds in green/solid donât walk. Early green times are based on the amount of slack in the cycle (phase length minus pedestrian minimum). In downtown and at intersections of two major arterial roads, pedestrian signals are typically on recall (i.e., they come up every cycle without a button press). In more suburban areas, side street pedestrian signals are actuated (button press required). It is possible for cross street phases to be shortened below the pedestrian minimums if the pedestrian phase has not been called. However, this has not been the practice in the City of Toronto. The current recovery and green compensation strategies were developed more recently, in collaboration with Transportation Services, reflecting the need to minimize impacts to other road users. The strategies were designed to be extremely flexible and responsive, allowing spe- cific movements (including pedestrians) to be favored to account for site-specific conditions. Parameter values, including the threshold and amount by which to extend or reduce phases, can be set by time-of-day plan. Requesting Priority In TTCâs system, priority is generally requested unconditionally. Every bus with a working transponder that passes over a check-in detector generates a priority request. The TSP is not Traffic Signal/Pedestrian Signal Green/Walk Green/Solid Donât Walk Algorithm 1 NA 16 seconds Algorithm 2 30 seconds NA Algorithm 3 14 seconds 16 seconds Algorithm 4a 14 seconds 16 seconds NOTES: NA = not available. aSeparate detection zones used for extensions in green/walk and green/solid donât walk. Table 24. Maximum green extension (through vehicles).
Case Examples 49 schedule based, and all transit vehicles will be provided with a TSP feature if they are in the detection zone at the decision point associated with that specific feature. A request for a green extension is granted only if there is a high probability that the transit vehicle making the request will clear the intersection within the design extension, which is typically 14 or 20 sec- onds depending on the intersection, and if the transit vehicle is still in the detection zone at the ânormalâ end of the green phase (or the ânormalâ end of the walk phase, depending on the green extension algorithm used). Granting Priority TTC has four green extension algorithms that are used at different intersections. These algo- rithms are based on decision points at specific locations in the cycle (e.g., when a pedestrian walk signal changes to a flashing donât walk). As a result, priority requests for a green exten- sion received during the green phase are not immediately processed. When a decision point for an extension is reached, the signal controller checks whether there is an active priority request associated with the decision point (i.e., whether there is a bus between the first check-in detector and the check-out detector). If yes, the request is granted, and an extension is provided if the transit vehicle is still in the detection zone at the end of the normal green. The controller then extends the green until the bus passes over the check-out loop and cancels the request, or until the maximum allowable extension has been provided. No decision points are used for early greens, so priority requests received during the red phase are processed immediately, but only if there is no request for an extension of the conflict- ing green phase. The duration of early green is based on when the request is received and the amount of slack in the cycle as described earlier. Special transit signals (a white vertical bar) are used in some locations, more commonly for streetcars than for buses. The main application is for a protected phase for a transit vehicle to make a turn that other vehicles are not allowed to make (e.g., entering or exiting an exclusive right-of-way or making a turn that general traffic is prohibited from making). At intersections where left turn priority is available and where left turns can be made only permissively by general traffic, a left turn green arrow is displayed if a transit vehicle is in the detection zone at the decision point. And the left turn green arrow is displayed until the request is canceled or until the maximum allowable green time is provided. At intersections where a left turn green arrow is available for general traffic, this phase is also callable by transit vehicles. If the transit vehicle is still in the detection zone at the end of the decision point (i.e., the normal end of the phase), the left turn green arrow will continue to be displayed until the transit vehicle crosses the stop line and cancels the request, or until the maximum allowable extension has been provided. In contrast to corridor TSP locations, dwell times are not an issue, because the nearest bus stop is typically either well upstream or located far side. However, the parameter values do take queue clearance into account in accordance with typical traffic volumes. Special Rules and Exceptions There are few restrictions on the use of TSP. Extensions are not limited to the amount of slack in the cycle. Early greens are not typically used where a transit route crosses a major street. Some intersections have been excluded from TSP because of highly variable dwell times at a near-side stop. There are generally no lockout periods or headway-based rules; but because of the system architecture, if two buses are back-to-back, the second bus will not receive priority because the second check-in is not recognized when the first one is still active. Logic scripts in the ATC-1000 controller have been used to emulate headway-based TSP at some intersections on a streetcar corridor where buses also sometimes operate.
50 Transit Signal Priority: Current State of the Practice Operations, Monitoring, and Maintenance TTC has a Can$1,000 annual budget per TSP-equipped intersection for TSP operations and maintenance, and it reports that long-term TSP operation and equipment maintenance has not been a problem. Because the hardware was originally developed from streetcar track tech- nology, it has been extremely robust: check-in and check-out locations are accurate to within 1 m and are very reliable, except where in-ground loop antennas or detector lead-in cables have been damaged by construction. For monitoring, under the City of Torontoâs previous central traffic signal system, TTC had access to the cityâs real-time reports to run a diagnostic each morning to identify broken detectors and find issues with phantom calls. (TTC is working with the City of Toronto to gain a similar level of access to the cityâs updated central system.) If prob- lems are found, TTC issues a maintenance call and sends a contractor out within 1 day. The TSP is temporarily disabled at the intersection, and the contractor is obligated to repair the detector within 5 days. TTC reported challenges in implementing TSP because the operation of the traffic signals is the responsibility of the road authority. In addition, recent changes in TTC route manage- ment philosophy have resulted in increased running times. Metro Toronto, the former regional municipalityâresponsible for TTC, regional roads with frequent transit service, and all traffic control signalsâwas very pro-transit in the early 1990s when TSP deployments began, and all TSP decisions were made by a small group of experienced traffic signal engineers. With the amalgamation of the six local municipalities into a single megacity in 1998, decisions regarding TSP became decentralized. This resulted in the cityâs being divided into four districts, each with new staff and many with limited signals experience, which led to inconsistent TSP approaches and responses to TSP requests. Transportation Services is currently undergoing a reorganization, and decisions regarding TSP are now being recentralized. TTC prefers the centralized structure because it produces more consistent results citywide. TTC has also had to adjust to Toronto Hydroâs adding new condi- tions to its unwritten agreement with TTC, making TSP implementation more difficult. TTC is working with Toronto Hydro to try to improve the agreementâs terms. TTC is also pursuing other selective detection and communication technologies that would reduce or eliminate reli- ance on pole attachments. TTC originally pursued TSP as a cost-saving measure, setting an objective of saving two headways in round-trip service time during peak periods so that the same frequency of service could be provided with fewer vehicles. As a result, there was resistance to its implementation by TTC operating staff, as it was seen as a job reduction exercise. To address this resistance, under the current strategy, buses are not removed from the route; instead, the running times are adjusted to reflect the benefits of the TSP, and the frequency of service is increased. Although in the short term this results in more capacity than specified by TTCâs load standards, no additional service is scheduled until this excess capacity is utilized by ridership growth. Bus TSP Effectiveness and Benefits TTC reports significant speed and reliability benefits from using TSP. When the system was first introduced, early simulation software was used to assess benefits, and before-and-after studies were done. On bus route deployments, the average benefit in peak periods was 8 seconds in delay reduction per intersection, resulting in 16 seconds saved per intersection round trip. For isolated left turns, TTC expects that the benefits are greater but has had a harder time measuring the impact, because the old AVL system had poor resolution (every 20 seconds). The benefit might be up to 60 seconds (or more) per left turn, which also significantly improves travel time reliability.
Case Examples 51 TTC has noticed that some semi-actuated signals function like fixed-time signals during peak periods, because the âmaximumâ side street is always required because of high pedestrian volumes. In addition, at most semi-actuated signals in Toronto, the side street is programmed to be at or near the pedestrian minimum timings. Furthermore, at many semi-actuated sig- nals, a side street vehicle call will force the pedestrian walk regardless of pedestrian demand. For these reasons, at many locations in Toronto there is little or no ability to benefit from early greens. Summary TTC was an early adopter of TSP, implementing TSP in 1991, and operates a large system today that is used by both streetcars and buses. Focusing only on the bus deployment, TSP is used at approximately 200 intersections, which includes four bus routes and many isolated left turn intersections. All buses in the fleet are capable of benefiting from TSP. The system is decen- tralized, with buses detected at check-in and check-out detectors wired directly into the signal cabinets. Priority requests are not schedule based, and buses can receive green extensions, early greens, special bus-only signals, and left turn phases, depending on the intersection. Priority, if requested, is granted when possible with few exclusions. At intersections of two major arterial roads, early greens may not be feasible, given the minimum green time required for pedestrian crossings. At intersections with near-side stops with highly variable dwell times, extensions are not provided because of the high probability of failure (i.e., the transit vehicle will not be able to clear, even with a maximum extension). Challenges TTC has a highly effective TSP system but has experienced some challenges related to policy. ⢠Operator reaction. TTC experienced significant pushback from transit operators on its origi- nal plan, which was to save costs by reducing running time enough to eliminate vehicles and operators. However, this issue is no longer a concern. ⢠Political priorities. TTC implemented TSP during a pro-transit era, but shifting priorities and changes in staff following amalgamation have created barriers to new large-scale deployments. It is expected that this issue will be addressed with the recentralization of the TSP decision- making process and clearer direction to staff on the amount of priority that should be given to transit over general traffic. Notable Practices TTCâs notable practices include green extensions that also benefit some pedestrian move- ments, unique recovery and green compensation strategies, and the use of a selective detection system that has provided the level of precision and reliability that allowed the implementation of very aggressive and cost-effective TSP. ⢠Long maximum allowable extensions. TTC has a high percentage of near-side stops but has implemented TSP at these locations anyway, using long maximum allowable green exten- sions. Some extensions also extend the pedestrian walk, which is different from the practice in other cities. ⢠Flexible and responsive recovery and green compensation. TTC can program recovery and green compensation strategies very explicitly, allowing specific movements (including pedestrians) to be favored by time of day, to minimize impacts to other road users. ⢠Reliability. TTC developed its TSP system from streetcar track technology, which has made it very robust and more reliable than other technologies in use elsewhere.
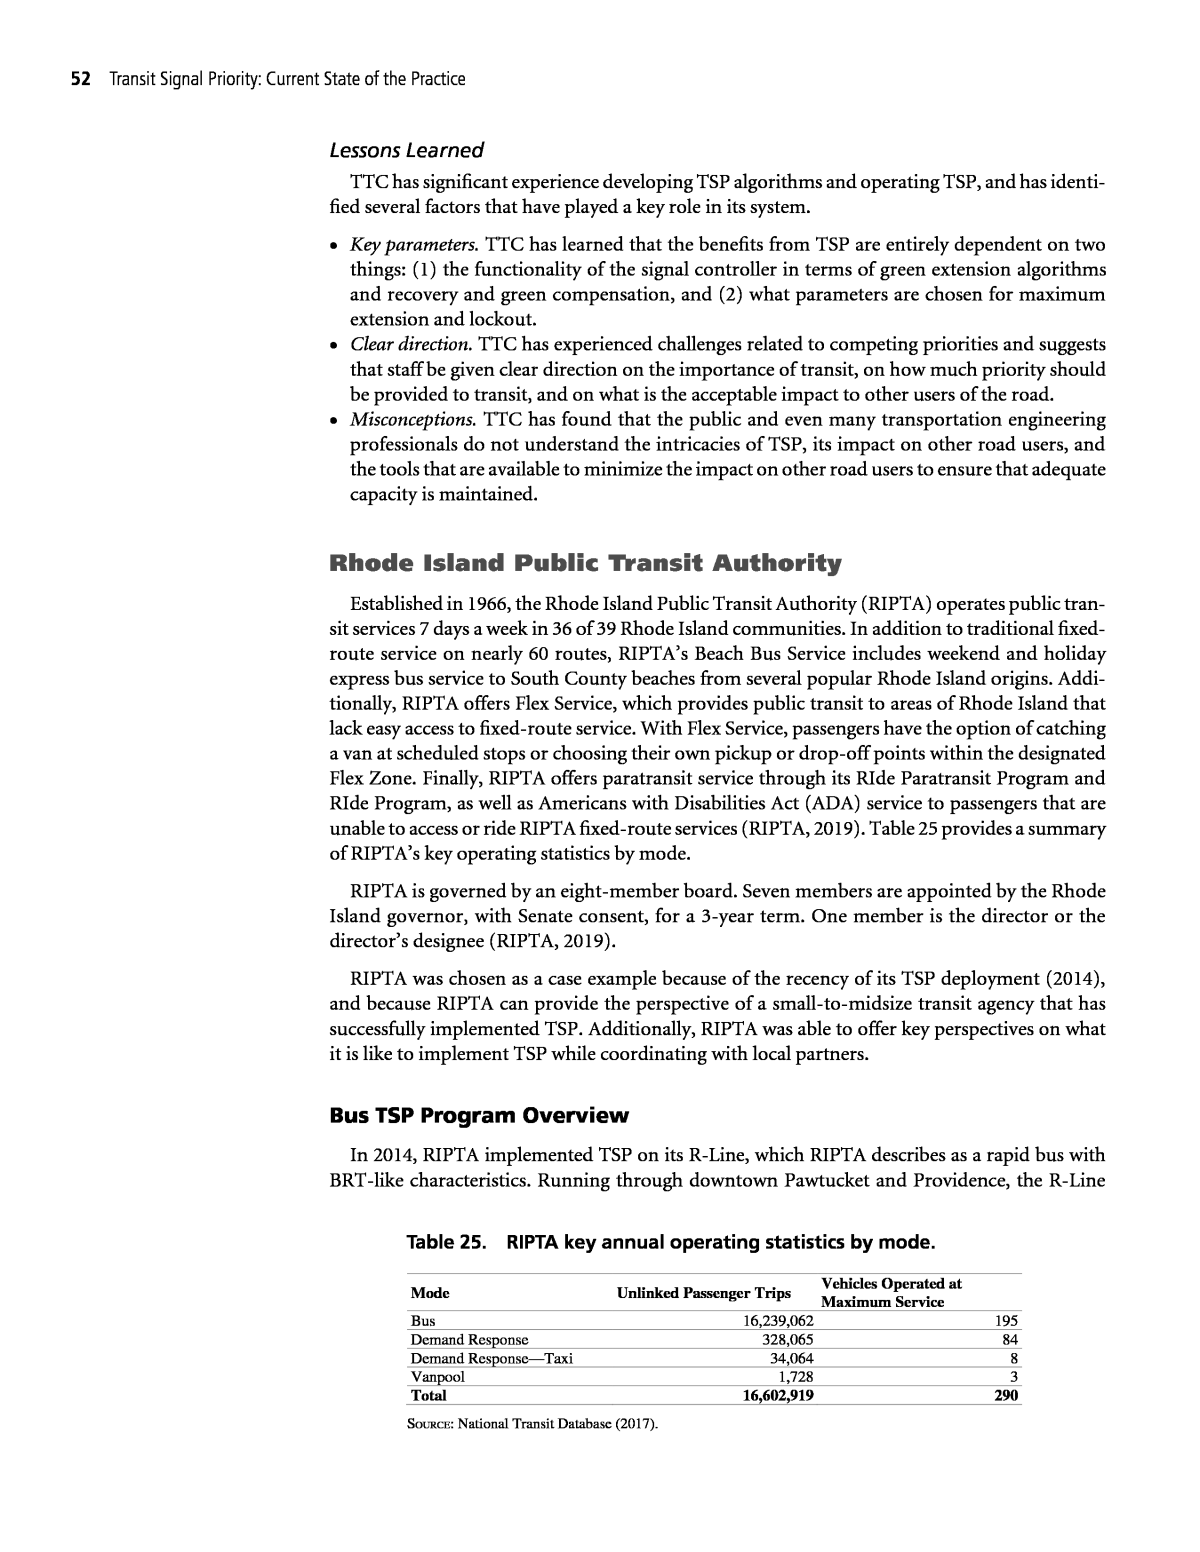
52 Transit Signal Priority: Current State of the Practice Lessons Learned TTC has significant experience developing TSP algorithms and operating TSP, and has identi- fied several factors that have played a key role in its system. ⢠Key parameters. TTC has learned that the benefits from TSP are entirely dependent on two things: (1) the functionality of the signal controller in terms of green extension algorithms and recovery and green compensation, and (2) what parameters are chosen for maximum extension and lockout. ⢠Clear direction. TTC has experienced challenges related to competing priorities and suggests that staff be given clear direction on the importance of transit, on how much priority should be provided to transit, and on what is the acceptable impact to other users of the road. ⢠Misconceptions. TTC has found that the public and even many transportation engineering professionals do not understand the intricacies of TSP, its impact on other road users, and the tools that are available to minimize the impact on other road users to ensure that adequate capacity is maintained. Rhode Island Public Transit Authority Established in 1966, the Rhode Island Public Transit Authority (RIPTA) operates public tran- sit services 7 days a week in 36 of 39 Rhode Island communities. In addition to traditional fixed- route service on nearly 60 routes, RIPTAâs Beach Bus Service includes weekend and holiday express bus service to South County beaches from several popular Rhode Island origins. Addi- tionally, RIPTA offers Flex Service, which provides public transit to areas of Rhode Island that lack easy access to fixed-route service. With Flex Service, passengers have the option of catching a van at scheduled stops or choosing their own pickup or drop-off points within the designated Flex Zone. Finally, RIPTA offers paratransit service through its RIde Paratransit Program and RIde Program, as well as Americans with Disabilities Act (ADA) service to passengers that are unable to access or ride RIPTA fixed-route services (RIPTA, 2019). Table 25 provides a summary of RIPTAâs key operating statistics by mode. RIPTA is governed by an eight-member board. Seven members are appointed by the Rhode Island governor, with Senate consent, for a 3-year term. One member is the director or the directorâs designee (RIPTA, 2019). RIPTA was chosen as a case example because of the recency of its TSP deployment (2014), and because RIPTA can provide the perspective of a small-to-midsize transit agency that has successfully implemented TSP. Additionally, RIPTA was able to offer key perspectives on what it is like to implement TSP while coordinating with local partners. Bus TSP Program Overview In 2014, RIPTA implemented TSP on its R-Line, which RIPTA describes as a rapid bus with BRT-like characteristics. Running through downtown Pawtucket and Providence, the R-Line Mode Unlinked Passenger Trips Vehicles Operated at Maximum Service Bus 16,239,062 195 Demand Response 328,065 84 Demand ResponseâTaxi 34,064 8 Vanpool 1,728 3 Total 16,602,919 290 SOURCE: National Transit Database (2017). Table 25. RIPTA key annual operating statistics by mode.
Case Examples 53 serves 30 stops. Currently, the R-Line is the sole route on which TSP has been deployed; however, RIPTA is currently engaged in a regional transit master planning effort in which several corridors have been identified for future TSP implementation. The R-Line TSP deployment consists of 13 40-ft Gillig buses that are R-Line branded and operate on a single route with 59 intersections. Bus TSP History In early 2013, RIPTA completed an operational analysis that identified a range of needed service changes and also investigated how ridership had changed over time. This analysis suggested that two routes currently offering very frequent service (routes 11 and 99) might operate more effectively if they were consolidated into one route. Approximately 18 months later, using a combination of federal Congestion Mitigation and Air Quality Improvement Program and local matching funds, the R-Line was fully operational with TSP. The specific goals of implementing TSP on the R-Line were to reduce bus travel time and improve schedule reliability. These goals were identified by reviewing TSP implementations at other peer transit agencies. RIPTA is also a member of the American Bus Benchmarking Group (ABBG), which is a consortium of mid-sized bus organizations in America that learn from each other by compar- ing performance, sharing experiences, and identifying best practices (ABBG, 2019). This organi- zation proved useful in learning more about TSP implementations. Having experienced positive results on the R-Line, RIPTA is now interested in seeing what other goals might be achievable. Partnerships, Governance, and Oversight RIPTA works with three different local partners on its TSP deployment. These local partners include the City of Providence, the City of Pawtucket, and the Rhode Island Department of Transportation. Although RIPTA owns and operates the public transit fleet and the TSP software and hardware, the local partners play a vital role as traffic signal owners and operators. RIPTA currently has operation and maintenance agreements in place with its local partners that out- line roles and responsibilities regarding the TSP system. Local partners use their maintenance budgets to pay for items such as equipment repair, cleaning, and purchasing new equipment for the signals. Bus TSP System Design R-Line buses can request priority up to 10 seconds before arriving at a signalized inter- section. Opticom hardware and software provide the bus-to-signal communication using infrared transmitters. RIPTA is investigating the utility of GPS-based systems for future TSP deployments. RIPTA stated that 40% of stops on the R-Line were near side, 35% were far side, and 25% were mid-block. TSP is provided for near-side stops, with the bus request sent after departing the stop. There are no queue jumps, and there are no dedicated bus lines on the R-Line. Bus TSP Business Rules and Parameters Establishing Business Rules and Parameters RIPTAâs business rule framework was refined after reviewing the business rules implemented by other peer transit agencies with TSPâand especially informed by other participants in the ABBG. RIPTAâs partner agencies own the signals, and RIPTA retains a consultant that routinely checks the software and hardware systems that work with the signals. If issues are identified, RIPTA works with its partner agencies to prioritize and resolve the issues. This unique relation- ship of shared responsibility also contributed to the development of RIPTAâs current business rule framework.
54 Transit Signal Priority: Current State of the Practice Requesting Priority The R-Line TSP deployment allows buses to unconditionally request an early green (3 to 5 seconds) and green extensions (4 to 5 seconds). These business rules provide a high degree of flexibility that has served RIPTA well. RIPTAâs R-Line deployment was the first time TSP was used in Rhode Island, outside of emergency vehicle preemption. RIPTA also stated that the organization realizes that TSP technology is advancing rapidly. A 2017 study commissioned by RIPTA identified advancements in technology and what other corridors may make sense for deploying TSP beyond the R-Line. Granting Priority Priority is granted on a first-come, first-served basis. RIPTA noted that, with regard to granting early greens, conflicting phases can be reduced beyond the pedestrian minimum if no pedestrian request to cross is made. Check-out detection is used to signal when the priority- requesting bus has left the intersection. The R-Line originally had a 10-minute lockout. This was implemented to avoid what some feared would be a constant state of bus prioritization. However, over time and as fears subsided, this lockout period has been reduced to about 1 minute. Operations, Monitoring, and Maintenance RIPTAâs Planning Department is responsible for operating and monitoring the TSP system. As part of the TSP deployment, RIPTA retained the services of a consultant, who periodically goes into the field and checks the system. The consultantâs findings are summarized in a report generated two to three times per year. Any issues are prioritized and communicated to local partners, who then work on resolving the issues. RIPTA is responsible for maintaining bus onboard equipment but is not directly responsible for maintaining the signaling infrastructure. RIPTA stated that the biggest challenge with the TSP deployment was maintenance, with a high degree of coordination required between RIPTA (the public transit operator) and the local partners (the signal owners). RIPTA is currently investigating ways to streamline maintenance processes in the future. Bus TSP Effectiveness and Benefits When TSP was initially deployed on the R-Line, there were 13 buses running the R-Line. Twelve months after TSP deployment, RIPTA was able to remove one bus (a reduction from 13 to 12 buses) and still maintain the same bus frequency and headways. RIPTA also reported an increase in on-time performance. Summary RIPTAâs deployment of TSP on the R-Line provides a notable example of how a small- to-midsize transit agency can work with local partners to successfully design, implement, and manage a TSP system with positive results. Challenges Maintenance. The most significant challenge noted by RIPTA was maintenance of the system, which requires a high level of communication across three different local partners. RIPTA is looking to improve maintenance processes in the future.
Case Examples 55 Notable Practices Unconditional Basis. RIPTAâs TSP deployment is unconditionalânot based on schedule or headway adherence rules. This business rule has proved effective in RIPTAâs operating context and has given RIPTA a high degree of flexibility by removing any competing interests that would reduce TSP benefit. Lessons Learned RIPTA provided the study team with some lessons learned that may benefit other transit agencies implementing or operating TSP systems. ⢠Stakeholder coordination. Public transit organizations interested in TSP deployments that involve multiple stakeholders should clearly map out roles and responsibilities for operation and maintenance before implementation. These agreements should be formalized in mutually agreeable terms to help ensure the system runs optimally at all times. ⢠Business rule customization. RIPTAâs current unconditional business rules provide a high level of system flexibility. However, RIPTA is well aware of the evolution of technology and the benefits new approaches to requesting and granting priority may bring. As such, transit agen- cies may benefit from experimenting with different business rules and parameters until they find a solution that works best for them. King County Metro Transit The King County Metro Transit Department (hereinafter referred to as King County Metro) provides public transit service in King County, Washington, including Seattle and surrounding cities. King County Metro operates bus, demand response, ferry, and streetcar services. King County Metroâs bus services are organized into several brands, including traditional bus, DART (a deviated fixed-route service), and RapidRide (a high-frequency BRT-style service). Key oper- ating statistics are provided in Table 26. King County Metro is a department of King County, separate from the King County Road Services department, which manages the traffic signals and rights-of-way in unincorporated areas of the county. King County Metro also works with many municipalities in which it oper- ates service, including the City of Seattle and the City of Bellevue. This case example focuses on TSP operations within the City of Seattle and the City of Bellevue. King County Metro was chosen as a case example because of its extensive and complex bus TSP program, which includes multiple deployment groups and relationships with local partners, among them a number of municipalities and the Washington State Department of Transporta- tion. King County Metro explored TSP very early, in 1999, before commercial off-the-shelf TSP Table 26. King County Metro key annual operating statistics by mode. Mode Unlinked Passenger Trips Vehicles Operated at Maximum Service Bus 102,013,147 1,015 Demand Response 854,155 320 Demand ResponseâTaxi 103,861 52 Ferryboat 599,954 2 Streetcar Rail 1,417,507 8 Trolleybus 19,339,147 140 Vanpool 3,626,422 1,617 Total 127,954,193 3,154 SOURCE: National Transit Database (2017).
56 Transit Signal Priority: Current State of the Practice systems were available, giving it extensive experience with different technologies, business rules, and strategies for deploying TSP. Bus TSP Program Overview King County Metro deploys TSP at 200 intersections, focusing TSP efforts on its six Rapid- Ride routes. However, three other routes also benefit from TSP: routes 44, 101, and 120. All of King County Metroâs approximately 1,500 buses are equipped with TSP hardware and software. Although King County Metro does not take a one-size-fits-all approach to deploying TSP, for purposes of this case example, King County Metro divided its TSP systems into two deployment groups: ⢠The original deployment, which included RapidRide lines A through F and routes 44, 101, and 120. This deployment group is referred to in this case example as RapidRide AâF Legacy. ⢠A redeployment of TSP in which King County Metro adjusted business rules and parameters to improve service reliability on RapidRide lines C and D. This deployment group is referred to in this case example as RapidRide CâD Optimization. The RapidRide AâF Legacy deployment group represents King County Metroâs âlegacyâ approach to TSP, and the RapidRide CâD Optimization deployment group represents King County Metroâs more recent work to optimize TSP business rules and parameters through further analysis and testing. Summary statistics for each deployment group are presented in Table 27. As part of the case example, the study team held two separate interviews, one with King County Metro and representatives from the City of Seattle, and one with King County Metro and representatives from the City of Bellevue. These two cities were chosen to be featured in King County Metroâs case example because their approaches to TSP are significantly different. Bus TSP History King County Metro first implemented TSP in 1999, before commercial off-the-shelf technol- ogies for TSP were widely available. King County Metroâs first TSP system architecture relied on radio-frequency tags on buses that were detected by a PRG that was installed in signal cabinets. The TSP program was focused mainly on high-frequency and high-ridership routes and was the first in the United States to use conditional priority for transit. The original TSP system was supported by both federal funds (from the Congestion Mitigation and Air Quality Improvement Program) and local funds. Deployment Group Number of Intersectionsa Number of Bus Routesb Number of Busesc RapidRide AâF Legacy 200 9 1,500RapidRide CâD Optimization 38 2 NOTES: aThe number of intersections for each deployment group do not add together. There are 200 TSP-equipped intersections; 38 of those intersections were part of the RapidRide CâD deployment group, in which King County Metro applied different business rules and parameters. bThe number of bus routes for each deployment group do not add together. The nine bus routes for the RapidRide AâF deployment group include six RapidRide lines (A, B, C, D, E, and F) and three other non-RapidRide routes (44, 101, and 120). RapidRide lines C and D are also in the RapidRide CâD deployment group, because these two routes received the changes in business rules and parameters. cBuses in each deployment group are interchange- able, which is why 1,500 buses are listed as the total for both deployment groups. Table 27. Summary of King County Metro TSP deployment groups.
Case Examples 57 In 2010, King County Metro began deploying its RapidRide service model and reconfigured the existing TSP system architecture to use a more reliable vehicle-to-infrastructure commu- nications technology, using a corridor-based roadside wireless network. (More details about this system architecture are provided in later sections of this case example.) The 2010 recon- figuration was financially supported by a local sales tax increase, branded under the moniker TransitNow. The sales tax increase supported the RapidRide service expansion in general, including funding the improved communications architecture for TSP. As King County Metro has been using TSP, King Countyâs Speed and Reliability Depart- ment has continually worked with internal and external stakeholders to keep the system running optimally and to explore new ways to optimize system business rules to maximize TSP benefits. Bus TSP System Architecture The King County Metro TSP system architecture is part of a broader intelligent transpor- tation system (ITS) architecture that powers King County Metroâs automated fare collection system and real-time passenger information signs. For TSP, buses know their location using the onboard INIT AVL system. Buses communicate their location and status (e.g., schedule devia- tion) to a roadside network via Wi-Fi over the 4.9-MHz public safety band. Buses check in and check out of each equipped intersection. The check-in message is communicated to the PRG, which also knows the current status of the intersectionâs signals. The PRG makes the decision, according to TSP business rules, whether to request priority for the approaching bus. When the PRG receives a check-out message from the bus (i.e., the bus has passed through the intersec- tion), the priority request is dropped. Although King County uses one vendor for bus AVL and the PRG, the different municipalities use a variety of signal controllers. Therefore, King Countyâs PRG interfaces with each controller using an interface panel. King County Metroâs TSP system is compatible with a variety of signal controllers, including ⢠M50/M52/M62 SEPAC; ⢠Econolite ASC/2, ASC/3, and Cobalt; ⢠Peek ATC-1000; and ⢠2070 NextPhase. Sample pictures of each of the TSP systemâs major components are shown in Figure 14. The signal cabinets are special double-door cabinets with dedicated space for city-owned traffic signal equipment and a dedicated door to access county-owned transit and ITS components. The bottom part of the cabinet contains the signal ownerâs equipment. The PRG is a McCain ATC controller, running custom TSP software developed specifically for King County. A fiber-optic network connects the roadside infrastructure to King County Metroâs back office for system monitoring and data storage. This fiber-optic network also makes propagation of business rule or parameter changes to PRGs relatively quick and easy. However, changing the settings of the bus message coming from the onboard AVL system, including the location of the check-in/check-out trigger points, is more difficult and requires King County Metro to propagate the change to every bus in the fleet using the garage network. King County is evaluating its options for using cellular communication between buses and the roadside network, eliminating the need for the 4.9-MHz Wi-Fi access points, which are outmoded and difficult to maintain. However, cellular communication has not yet been implemented. Within the City of Bellevue, the system architecture is essentially the same; however, the signal controller is different. The RapidRide B Line operates through the City of Bellevue, which uses
58 Transit Signal Priority: Current State of the Practice the SCATS adaptive signaling system. SCATS does not include support for TSP as an out-of- the-box feature. This difference forced King County and the City of Bellevue to design a way to place a priority call to the SCATS controller: the priority call is communicated from the PRG to the controller using a standard detector input in the controller. Business rules and parameters applied at 12 City of Bellevue intersections are also different from the rest of the TSP system and are described later in this case example. Partnerships, Governance, and Oversight The King County Metro TSP system requires collaboration among King County Metro; the Washington Department of Transportation, or WSDOT; and local municipalities. In particular, King County Metro and the City of Seattle coordinate extensivelyâsimply because most of the RapidRide routes pass through City of Seattle intersections. Although there is no formal agree- ment between King County Metro, WSDOT, and municipalities, they have positive working relationships and cooperation. King County Metro owns both onboard TSP equipment and some roadside equipment, including the PRG and the network equipment that supports communications between buses, the PRG, and the systemwide network. The systemwide network uses the public safety radio band and is available on all bus route corridors and at all bus bases. The network also supports that automated fare collection system and real-time passenger information signs. Municipalities own and maintain the intersection signaling system components, including the cabinets, signal controllers, and signals. There is no ongoing exchange of financial resources among the local TSP stakeholders; how- ever, stakeholders do their part to maintain their owned equipment and to collaborate with King County Metro on setting business rules and parameters for routes and intersections. SOURCE: King County Metro. Figure 14. Example photos of bus TSP system key components.
Case Examples 59 To deploy and optimize TSP for portions of the RapidRide B Line in the City of Bellevue, King County Metro and the City of Bellevue partnered to support consultant expenses associated with programming the cityâs SCATS system. However, there is not an ongoing formalized exchange of resources. Bus TSP Business Rules and Parameters King County Metroâs TSP business rules and parameters are highly varied across inter- sections and jurisdictions because of corridor-specific priorities and evaluations, as well as the limitations or requirements of the different signal controllers used by local stakeholders. Because of this variety, this section is broken into three subsections: ⢠RapidRide AâF Legacy ⢠RapidRide CâD Optimization ⢠City of Bellevue The City of Bellevue has its own section because it uses different signal controllers that require a substantially different approach to establishing business rules and parameters. RapidRide AâF Legacy This deployment group represents King County Metroâs current âstandardâ approach to TSP system architecture, business rules, and parameters and is currently applied on all RapidRide lines except lines C and D, which are discussed later in this case example. Establishing Business Rules and Parameters. When King County Metro deployed TSP along the RapidRide corridors, the original strategy was to reduce bus delay as much as possible, which conceptually meant that buses would receive priority whenever possible. However, in general, King County takes an intersection-by-intersection approach to establishing parameters and special business rules. Requesting Priority. In King County Metroâs TSP system architecture, buses check in and out at all TSP-equipped intersections, technically ârequestingâ priority all the time. In line with the goal to reduce bus delay, the business rules allow eligible buses (i.e., buses operating on TSP- eligible routes) to request priority whenever they approach an eligible intersection. Approximately 25% of the bus stops in this deployment group are near-side stops. Requesting priority at near-side stops has been a challenge for this deployment group, because buses need to be detected after they have left the near-side stop. King County Metro reported that priority after near-side stops was not very effective because of the technical challenges of sending the priority request in time to grant priority and modify the signalâs cycle. Granting Priority. In line with the goal to reduce bus delay, the business rules are designed to grant transit priority whenever possible. Priority is given by green extensions or early greens, which can vary from 10 to 30 seconds and from 0 to 60 seconds, respectively. The wide range of possible parameters is caused by several factors, including ⢠Variations in the capabilities of different signal controller hardware and software, ⢠Intersection-specific factors such as minimum pedestrian clearance times, and ⢠Upper limits on priority parameters set by local jurisdictions. Conflicting priority requests are handled on a first-come, first-served basis. Special Rules and Exceptions. In the RapidRide AâF Legacy group, there are several spe- cial rules and exceptionsâsome of which are applied to all intersections, and others to specific
60 Transit Signal Priority: Current State of the Practice intersections only. All intersections have a 120- to 180-second lockout rule. That is, granted priority requests must be separated by at least one full signal cycle (which is usually between 120 and 180 seconds, depending on the intersection). Some intersections are not eligible for priority, and some intersections have special rules that limit granting priority to peak travel directions during peak travel periods. RapidRide CâD Optimization In an ongoing effort to continually maximize the benefits obtained from TSP, King County Metro has embarked on a specific effort to modify TSP business rules and parameters on RapidRide C and D lines. The details of the current business rules and parameters of the C and D line TSP system are described in the following paragraphs. Establishing Business Rules and Parameters. Like all RapidRide corridors, King County Metro takes an intersection-by-intersection approach to establishing parameters and special business rules. However, in general, the goal of the C and D line optimization is to achieve improved headway reliability, not necessarily to improve average speed (as was the case for other RapidRide corridors). To improve headway reliability, King County Metro designed business rules around busesâ schedule adherence, because schedules were designed to deliver desired headways. To determine the business rules and parameters for each intersection, King County Metro and the City of Seattle examine the existing conditions of the intersection and transit service at different times of day. Together, they examine pedestrian activity data, transit delay data, volume-to-capacity ratios, level-of-service scores, vehicle counts (including turning movements), and other relevant information. The process of determining the final business rules and param- eters for a single intersection may take 3 to 4 hours of debate and discussion. These business rule decisions are documented in spreadsheets that can be referred to later when implementing the final timings in the field. Requesting Priority. In King County Metroâs TSP system architecture, buses check in and out at all TSP-equipped intersections, technically ârequestingâ priority all the time. The check-in message includes the busâs current schedule adherence status. However, the decision whether to grant priority is made by the PRG according to intersection-specific business rules and parameters. Approximately 25% of the bus stops in this deployment group are near-side stops, and buses request priority before leaving near-side bus stops. To accomplish this, King County Metro ana- lyzes typical dwell times at near-side stops and incorporates the dwell time into the busâs esti- mated time to clear the upcoming intersection. Granting Priority. In line with the goal to improve headway reliability, the business rules are designed to grant transit priority when buses are behind schedule. However, the lateness parameter varies from 0 to 180 seconds, depending on the specific parameters applied to the intersection, time of day, and direction. Priority is given in several ways, including green exten- sions, early greens, phase skipping, and cascading priority. In general, on-time buses can receive an extended or early green, and late buses can request phase skipping and cascading priority. Green extensions and early greens can vary from 10 to 30 seconds and from 0 to 60 seconds, respectively. The details of phase skipping will vary by intersection and are based on the cycle configuration. Cascading priority refers to when priority is granted at a series of closely spaced intersections, making sure that the granted priority can be fully utilized by the approaching bus and is not obviated by a signal that forces the bus to stop. Conflicting priority requests are handled on a first-come, first-served basis.
Case Examples 61 Special Rules and Exceptions. In the RapidRide CâD Optimization group, there are several special rules and exceptionsâsome of which are applied to all intersections and others to spe- cific intersections only. All intersections have a 100- to 180-second lockout rule. That is, granted priority requests must be separated by at least one full signal cycle (which is usually between 100 and 180 seconds, depending on the intersection). Some intersections are not eligible for priority, and some intersections have special rules that limit granting priority to peak travel directions during peak travel periods. City of Bellevue The TSP business rules and parameters for intersections within the City of Bellevue are unique because of the cityâs signaling system, which is a SCATS adaptive signaling system. The SCATS system did not support TSP out of the box, so the City of Bellevue and King County Metro had to work together to create a way to request priority. Twelve intersections support TSP within the City of Bellevue, and all twelve intersections are outside of the cityâs central business districtâa limitation that both the city and King County Metro agreed upon. There are also controller limitations that prevent TSP from being implemented at certain intersections. First, the SCATS system supports only seven signal stages at each intersection, so if the intersectionâs timing plan already uses seven stages, a stage for a TSP request cannot be added. Second, the controller allows for 24 detector inputs at each intersection, and some inter- sections use all 24 inputs, leaving no room for the PRG to be added as an input. To allow the SCATS system to support transit priority requests, the City of Bellevue added a signal stage that was the equivalent of a green extension or early green. When the PRG receives a check-in message from an approaching bus, the PRG communicates with the signal controller as a detector and requests that the stage be added if conditions at the intersection allow. In almost all cases, priority can be given only in the form of a green extension between 10 and 15 seconds, and the priority request to the controller is made only if there is not enough time left in the regular green phase for the approaching bus to clear the intersection. There are some additional limitations on granting priority at certain intersections. For exam- ple, there is an intersection where priority is not granted during the afternoon peak period because of large cross-traffic volumes. Intersections also do not grant priority in consecutive cycles. The logic to not request priority in consecutive signal cycles is built into the PRG. Operations, Monitoring, and Maintenance King County Metroâs TSP system has many different stakeholders and infrastructure owners because TSP-equipped corridors traverse through the intersections owned and operated by at least 13 state, county, and city governments. However, the lines of TSP system ownership and responsibilities are relatively clear. King County Metro owns, operates, and maintains the onboard equipment, the roadside wireless and fiber network, and the PRG installed in the signal cabinets throughout the region. Inter- section owners operate and maintain the signaling infrastructure and supporting hardware and software systems. Infrequently, confusion can arise when a signal cabinet is damaged by a third party. Cabinets have equipment from both King County Metro and the intersection owner, so who should pursue recouping repair or replacement expenses from the third party can be unclear. TSP System Coordination with Local Stakeholders One challenge of working with so many stakeholders with so many different signaling systems, timing plans, and goals is simply dealing with changes. Signaling systems have software and
62 Transit Signal Priority: Current State of the Practice firmware upgrades, stakeholders upgrade or completely change their signaling systems, or local stakeholders sometimes change signal timing to deal with acute challenges and may not communicate these changes to King County Metro. In some cases, these changes may eliminate established TSP strategies or may conflict with established TSP business rules and parameters. Two-way communication and coordination between King County Metro and its local stake- holders is absolutely essential to the successful operation of the TSP system. TSP System Operation, Evaluation, and Maintenance King County Metroâs Speed and Reliability Department is mainly responsible for the ongo- ing operation and evaluation of King County Metroâs TSP system. Other King County Metro departments are responsible for maintenance of the TSP equipment and of the roadside com- munication network. In the most recent fiscal year, King County Metro allocated approximately $500 per TSP-equipped intersection for TSP operations and maintenance. Funding to support TSP system operations and maintenance has been more difficult to sustain in recent years because of competing agency needs. The Speed and Reliability Department is also responsible for ongoing evaluation and opti- mization of the TSP system and for working with local partners to implement timing optimiza- tions throughout the region. King County Metro works to reevaluate TSP business rules and parameters for individual corridors about once every 4 to 6 years. However, funding to support evaluation and optimization has been irregular and, in recent years, more difficult to maintain because of competing agency needs. One of King County Metroâs ongoing challenges is the reliability and accuracy of the TSP system. Problems with reliability and accuracy are caused by a combination of factors both within and outside of King County Metroâs domain of control. King County Metro regularly tracks the number of requested and granted priority requests, as well as bus schedule adherence, to monitor the functionality of the TSP system and identify needed corrective actions. Bus TSP Effectiveness and Benefits King County Metro consistently evaluates the effectiveness of its TSP deployments and the ongoing efforts to optimize business rules and parameters. In general, King County Metro reports that its TSP deployments produce the benefits desired. RapidRide AâF Legacy In the case of the RapidRide AâF Legacy deployment group, King County Metro set TSP business rules and parameters to maximize bus speeds and saw both improvements in bus speed and reductions in travel time variability, caused mainly by a reduction in intersection- based delays. King County Metro conducted several internal studies to quantify these benefits. One study from 2014 analyzed intersection approach delays (the time between when buses approach and when they clear an intersection) and total corridor travel times for RapidRide lines C and E and the 120 line. King County Metro compared approach delays and travel times when TSP was off with times when TSP was on and found that, depending on the line and direc- tion, TSP could reduce intersection approach delay by 2% to 14% and corridor travel time by 2% to 5%. An example of the approach delay analysis for the RapidRide C line southbound is shown in Figure 15. Another study from 2016 analyzed TSP benefits for the RapidRide A Line by again com- paring intersection approach delay and corridor travel time from a period when TSP was turned
Case Examples 63 off with a period when TSP was turned on. King County Metro found corridor travel time savings of between 1% and 6% and found that most intersections experienced reductions in approach delay. (However, a percentage change was not calculated in the report.) Figure 16 displays an example analysis of corridor travel times for the northbound RapidRide A Line. A similar 2017 study on the RapidRide B Line found corridor travel time savings of between 0% and 6%, depending on the direction and time of day. However, after removing variations attributable to dwell times, King County Metro found that TSP delivered between 8% and 23% savings in corridor travel times. The same study also found that intersection approach delay was reduced by between 2% and 11% along the corridor. RapidRide CâD Optimization In the RapidRide CâD Optimization deployment group, King County Metro set TSP busi- ness rules and parameters to help buses maintain scheduled headways and reported signifi- cant improvements in bus headway adherence. (Logically, King County Metro did not observe increases in bus speeds when business rules and parameters were set to improve headway adherence.) King County Metro found notable improvement in headway adherence, especially during morning and afternoon peak periods. For example, the percentage of buses not meeting the headway standard for the outbound C Line during afternoon peak was reduced from 25.4% Figure 15. Example approach delay analysis for the southbound RapidRide C Line. Intersection Travel Times; C-Line SB SOURCE: King County Metro.
64 Transit Signal Priority: Current State of the Practice to 17.8% (a 30% reduction). However, headway adherence actually got worse during midday periods (see Figure 17). Moreover, the C and D lines did not see significant changes in corridor travel time or intersection approach delay. Summary King County Metro has a long history in TSP and an extensive TSP system that involves many local stakeholders. The agency takes a robust, data-oriented approach to achieve continual improvement from its TSP system and has found appreciable improvements in bus speeds, reductions in intersection delay, reductions in travel time variability, and improvements in headway adherence. Central to King County Metroâs TSP operations is having clear goals for TSP deployments that vary by route and corridor and then aligning business rules and parameter strategies (as possible and supported by the different signaling systems) to achieving those goals. Alignment between TSP goals and TSP business rules and parameters helps King County Metro to achieve desired outcomes and to coordinate and cooperate with local stakeholders. SOURCE: King County Metro. Figure 16. Example corridor travel time analysis for the northbound RapidRide A Line.
Case Examples 65 Challenges King County Metro has overcome many challenges during its implementation and ongoing optimization of its TSP system; however, a few challenges are highlighted as follows. ⢠Limitations of signaling systems. The City of Bellevueâs SCATS adaptive signaling system pre- sented several challenges to implementing TSP at the cityâs intersections. Notably, the SCATS system did not support TSP out of the box, and the system did not support many of the com- plex business rule and parameter configurations that King County Metro normally imple- ments along TSP corridors. ⢠TSP system reliability and accuracy. In particular, King County Metro sees problems with the check-in and check-out procedures across all deployment groups. This is an issue that King County Metro is currently working on. ⢠Outdated communications equipment. The King County Metro TSP system relies on 4.9-MHz Wi-Fi access points for bus-to-infrastructure communications. The access points are no longer manufactured, making replacement of malfunctioning units or expansion into new cor- ridors impossible without upgrading the communications technology. (The agency is examin- ing options for replacing the communications architecture between buses and infrastructure.) ⢠Signal controller limitations in coordinated signal operations. In corridors where traffic signals are coordinated (for example, to provide a green band using signal progression), it is both dif- ficult for the bus to take advantage of the signal coordination and challenging for intersections to get back into coordination after granting priority. Notable Practices King County Metro has several notable practices that have been discussed throughout this case example. A few highlights are provided as follows. ⢠Collaboration with local stakeholders. The collaboration between King County Metro and its local TSP stakeholders is strong. Intersection owners work very closely with the agency, diving into detailed intersection data, timing plans, and proposed TSP business rules and parameters in an effort to achieve optimal transit priority intersection by intersection. This collaboration can be very labor intensive, but through this collaboration, King County Figure 17. Percentage of buses not meeting headway standards before and after the RapidRide CâD Optimization. SOURCE: King County Metro.
66 Transit Signal Priority: Current State of the Practice Metro and local stakeholders can see improvements in transit service while maintaining intersection capacity for other road users. ⢠Evidence-based TSP evaluation. King County Metro takes a standardized, evidence-based approach to evaluating whether TSP is producing the desired benefits. In the three separate TSP evaluation studies provided to the study team, each collected data from a TSP-off and TSP-on period to ensure that observed differences in the data were caused by the TSP system. Each report measured the same dependent variables in the same way and presented and dis- cussed results using standard narrative and supporting tables and charts. ⢠Ongoing optimization. King County Metro has not implemented TSP and left the system to run on its own. The Speed and Reliability Department is continually seeking ways to improve the TSP system and to optimize business rules and parameters. Lessons Learned Through its implementation and ongoing operations, maintenance, and evaluation of its TSP system, King County Metro has learned many lessons that are transferrable to other transit agencies and regions that have implemented TSP or are considering doing so. ⢠Common goals are critical. Defining clear goals for the TSP system and developing consensus around these goalsâboth inside the transit agency and with local stakeholdersâis key to a successful TSP program. Without common goals, inconsistency in business rules, param- eters, and effectiveness evaluation will likely dissolve any potential benefits the TSP system could have. ⢠Schedule adherence business rules seem more effective. In King County Metroâs RapidRide CâD Lines Optimization deployment group, TSP business rules work to get late buses back on schedule rather than trying to speed up all buses. As such, TSP is used less often and can be more aggressively applied to obtain more significant benefit. ⢠Value of a roadside camera network. King County Metro uses real-time and archived access to a roadside camera network to help verify TSP calls, troubleshoot system issues, fine-tune parameters, and so forth. The camera system helps reduce field work and other complex investigations that would rely on data analysis and interpretation. ⢠Roadside PRGs add effort. Having a dedicated roadside PRG creates an additional layer of troubleshooting and maintenance. To support the TSP system, King County Metro has to own and maintain a PRG for every TSP-eligible intersection. The agency is currently investi- gating other system architectures to eliminate the need for roadside PRGs. Summary of Case Examples These five case examples have each provided different insights into TSP deployment. Table 28 provides a summary of all five case examples, including challenges, notable practices, and lessons learned.
Case Examples 67 Table 28. Summary of case examples: Challenges, notable practices, and lessons learned. Transit Agency Challenges Notable Practices Lessons Learned San Diego MTS Obtaining stakeholder buy-in at early stages of TSP deployment. Ongoing TSP system maintenance and troubleshooting. Multiple successful partnerships with cities, the MPO, state DOT, and a private consultant. Peer-to-peer signal communication allows for initiating priority requests when the vehicle is still upstream from the signal. Pilot testing is important for debugging the system and fine-tuning parameters. Plan ahead for and have a proactive approach to system maintenance. Legacy technologies work; however, new technologies may provide more benefit and flexibility. SFMTA Transit- and pedestrian- supportive transportation policies require tradeoffs that may limit TSP benefits. Urban canyons challenge GPS-based TSP systems. Quantifying TSP benefit is difficult without baseline data. TSP system differentiates priority requests from local and rapid routes and grants only rapid requests. Continually working to implement pedestrian- supportive policies while still maximizing TSP benefits. Operator behavior can influence TSP benefits. Baseline data are important to quantify TSP benefits; temporary TSP shutoffs may be necessary. Establish TSP policies and goals before implementation. Allow time for iteration of TSP approaches (e.g., implement corridors sequentially). TTC Operator concerns during implementation created challenges to deployment. Changing political priorities and governance structures can create barriers to continued TSP deployment. High percentage of near- side stops with TSP using long maximum allowable green extensions. TSP architecture based on streetcar track technology and very reliable. TSP benefits rely on signal functionality and capability and business rule and parameter choices (especially maximum green extension and TSP lockout). Clear priorities for TSP are critical to successful TSP operations and expansion. Public and traffic engineer conceptions about TSP are often incorrect, and intricacies of TSP are often not understood. RIPTA Ongoing maintenance is difficult, requiring coordination among several local partners. Unconditional priority has resulted in desired reduction in travel times and service operating cost. Clear mapping of roles and responsibilities with local stakeholders is necessary before implementation. Investigating new or alternative business rules and parameters may provide additional benefits. King County Metro Signal system limitations reduce flexibility of business rules and parameters. Check-in and check-out procedures problematic. Outdated communications equipment reduces system reliability and frustrates maintenance. TSP difficult in coordinated signal operations. Strong collaboration with multiple local stakeholders, including detailed, intersection-level discussion of TSP plans. Focus on evidence-based evaluation of TSP benefits, including TSP-off periods, to quantify effectiveness. Focus on continual improvement and optimization of TSP business rules and parameters. Common goals among all stakeholders (internal and external to the transit agency) are critical for TSP success. Schedule adherence business rules can be very effectiveâespecially with aggressive priority parameters (e.g., long green extensions). Access to a roadside camera network helps reduce the cost and difficulty of field data collection or system troubleshooting. Roadside PRGs create an additional layer of troubleshooting and maintenance.
