
Appendix B
Summary of June 10, 2019, Workshop
On June 10, 2019, the Panel on Measuring Alternative Work Arrangements for Research and Policy held an open workshop to highlight perspectives of data users and policy makers related to the modern economy’s changing work arrangements. This workshop complemented information learned during the panel’s first meeting, which featured presentations by U.S. Bureau of Labor Statistics (BLS) experts about the history, measurement objectives, and past performance of the Contingent Worker Supplement (CWS) of the Current Population Survey (CPS). The CWS is designed to shed light on individuals working in nonstandard jobs.
The June 10 workshop covered several topics central to the panel’s charge to review the CWS and other data sources, as well as methods surrounding the measurement of alternative work arrangements (AWAs). Workshop sessions included presentations on (1) the policy context for measuring alternative work, (2) measures of worker well-being, (3) employer and broader market issues, (4) insights about alternative work from other (non-BLS) surveys, and (5) use of administrative data that may substitute for or complement survey data. The sections of this summary correspond to the workshop sessions, in the same order as they were conducted.
B.1. THE POLICY CONTEXT FOR MEASURING ALTERNATIVE WORK
Following an overview of the study charge by the panel chair, Susan Houseman, Session 1 examined the policy context for measuring alternative work. Houseman reminded meeting participants that the CWS was created
in response to concerns during the 1980s about the changing nature of employment and its implications for workers and public policy. This means that concerns today about the changing nature of employment are not new, although the characteristics of AWAs have evolved, raising new issues.
During this opening session, presenters offered perspectives on what information policy makers need to know and what questions remain unanswered—for example, how many people engage in supplemental work and what their motivations are. Methodological considerations that allow data to be translated into policy (for example, collecting data that is representative at the state level) were also addressed; and definitions and boundaries for different categories of work were discussed, such as the categories of “contingent,” “independent,” and “web-mediated.”
Carolina F. Young, policy advisor, Office of U.S. Senator Mark R. Warner, kicked off the session, discussing legislative developments relating to alternative work. Senator Warner is honorary co-chair of the Aspen Institute’s Future of Work Initiative, and his office has been active on issues pertaining to gig work. Young updated the panel on her work in Senator Warner’s office on relevant initiatives—such as proposed legislation that would direct the U.S. Treasury to study tax issues for gig economy workers—and the kinds of data needed to inform this work.
Young noted that Senator Warner has been actively engaged with such issues as the changing nature of work and the relationship between employers and workers for a long time. Recently, the senator’s office has been focused on the rise of the gig economy, the impact of platform-based companies on flexible work arrangements, the opportunity for people to subsidize W-2 employment, and other issues related to the future of work in the 21st century economy. Warner has also expressed concern about the access that gig workers and other independent workers have to basic benefits, which are more typical of regular W-2 employment.
Young described three initiatives by Senator Warner’s office of particular relevance to the panel’s charge. The first stemmed from the fact that when the senator started working on these issues in 2015, the most recent CWS data were from 2005. Tax data, if accessible, would offer the potential for better year-to-year information about trends in wages and numbers of workers in nonemployer work. To explore this idea, the senator introduced legislation in 2018 to direct the U.S. Department of the Treasury to conduct a study of nonemployer business income.1 The study was not to be limited to the gig economy or platform-based work but would look at a much broader universe of employment. The senator directed Treasury to include,
___________________
1 The U.S. Census Bureau defines nonemployer businesses as businesses with no paid employees, having annual business receipts of $1,000 or more ($1.00 or more in the construction industries) and subject to federal income taxes.
in this study, a report for the Senate Committee on Finance and the House Committee on Ways and Means, to evaluate the following:
- Tax compliance from nonemployer business income, including whether there is significant overreporting of nonemployer business income from underutilizing allowable deductions and other tax benefits (if feasible, the study would break out the same information for income earned through online and mobile platforms);
- The current tax withholding reporting and tax-filing systems to identify how they should be updated to reflect the growing number of workers earning nonemployer business income; and
- How the earnings of wage income and nonemployer business income had changed over time, specifically dividing by income decile, and analyzing at least the most recent 10 years of available tax filing information.
The above-described kinds of information are not typically available to policy makers, Young noted, and this legislation was introduced to remedy that, providing insight into these different income streams. Moreover, policy makers would often prefer to work with federal agency data instead of having to rely on private proprietary data.
The second initiative by Senator Warner was a request that the U.S. Government Accountability Office (GAO) undertake a study of the platform workforce and how it deals with tax issues. Young noted that, for the workers engaged in this part of the labor force, complying with tax requirements or even understanding how to do so can be daunting. Senator Warner’s office also wanted the study to address how employers and organizations, which include independent contractors, comply with the tax system. Complications may be especially acute for form 1099-K earnings (introduced through the 2008 Housing and Economic Recovery Act) which involve third-party payment or service processors such as PayPal, for example. To alleviate the burden of requirements for companies, the threshold for reporting on 1099-K forms was set at over 200 transactions and over $20,000 in sales over the course of a year. Since many people engage in platform or other kinds of contract work on an ad hoc basis, sometimes to supplement W-2 wages, many do not meet the $20,000 a year threshold, and these workers typically do not get a tax form for that work.
The requested GAO study would address several core issues. It would analyze the available information on tax compliance of the platform workforce to help understand the level of underreporting and overreporting from workers earning income through platforms. It was also hoped that the paper would analyze the reporting regimes for tax withholding, tax filing, and current taxation to identify how they could be updated to reflect the
growing size of the platform workforce and any additional challenges and costs faced by the platform companies in complying with potential updates. Young reported that GAO has accepted this study request and is moving forward.
The third initiative from Senator Warner’s office seeks to address broader trends in the economy, such as how market forces encourage companies to prioritize short-term returns and, potentially, to have less loyal relationships with workers. Policy makers at the federal level are now trying to figure out what can be done about benefits such as workers’ compensation, paid leave, and retirement accounts for people engaged in jobs ranging from Uber drivers, to freelancers, to domestic workers. According to Young, the senator is broadening the scope of his thinking to include ways policy can help the entire contingent of workers in the nonemployee workforce. He has introduced legislation to create an innovation seed fund at the U.S. Department of Labor that would award grants to states, cities, and nonprofits interested in experimenting with the delivery of worker benefits to the alternative workforce. This would allow the current patchwork system of benefits at the state level to encourage more innovation at the local level that, in turn, could be adopted and scaled as federal solutions. However, it is currently difficult for policy makers to know how best to proceed without the data needed to understand the issues.
Young concluded her presentation with this summary take-away: Policy makers are, in fact, engaged on this topic, and they will be moving forward with legislation and advocacy of various kinds. As they do this they are making a series of assumptions about what the alternative worker population looks like, either through a tax lens, a worker-benefits lens, or an employer classification lens. The data piece is particularly important for these policy makers, she believes, as they attempt to build a consensus on how to move forward in a way that is helpful to this population of workers.
Following Young’s presentation, BLS Commissioner William Beach pointed out that his agency is fully engaged on this issue and would do all it could to be good partners in finding the necessary data to support research and policy. He asked Young which Senate committees would be dealing with the issues she discussed. She explained that finance questions around tax and compliance would be handled by the Senate Finance Committee, while benefits would fall within the purview of the Senate Committee on Health, Education, Labor, and Pensions.
Next, Alastair Fitzpayne, executive director of the Aspen Institute’s Future of Work Initiative, and Shelly Steward, research manager for the initiative, updated the workshop on their initiative’s plans. The Future of Work Initiative, which seeks to identify policy solutions to the challenges facing workers in the 21st century, has produced and maintains the Gig Economy Data Hub, in partnership with the New York State School of
Industrial and Labor Relations (ILR) at Cornell. This hub is an online resource that provides accessible summaries of data sources on independent and nontraditional work.
The initiative’s taxonomy of “nontraditional work”—identified in terms of employment classification, U.S. Internal Revenue Service (IRS) and BLS designations, and a set of job characteristics—is summarized in Figure B-1. Within this taxonomy, it is apparent that nontraditional work includes a wide variety of job types and occupations. They fall under five BLS categories: part-time, on-call, temporary help agency, contract employee, and independent contractor. Recently, in order to address worker issues that arise, the institute’s team has focused on portable benefits, tax simplification for independent workers, and worker training tax credits. They recently released a report on this subject, Designing Portable Benefits: A Resource Guide for Policymakers.
Fitzpayne noted that the Future of Work Initiative, which is nonpartisan, has been analyzing what changes in the nature of work could mean for our economy and labor market and what policies may be needed to prepare for the transitions. The project has focused on three trends: first, the fracturing relationship between workers and employers; second, the increased importance of access to skills and education as new technologies and increased automation change the world of work; and third, the market-based pressures that companies face to produce short-term profits rather than long-term value. Because the social contract between workers and employers has weakened, the initiative has proposed policy solutions aimed at improving economic security for both traditional and nontraditional workers.
Fitzpayne pointed out that well-designed policies require a better understanding of how our workforce is changing. With both the 2017 CWS data and recent academic research, more is known now than several years ago, but there are still unanswered questions and confusion among policy makers and the general public about how work arrangements are changing. Different sources, including those from government, academia, and the private sector, ask different questions and apply different definitions to the category of nontraditional work, and that makes it difficult to understand trends and identify solutions.
Echoing Young’s remarks, Fitzpayne noted that one central challenge for nontraditional workers is their ability to access workplace benefits and protections. Given the instability inherent in much of their work, nontraditional workers have a great need for workplace benefits, yet they have some of the lowest rates of coverage. BLS’s National Compensation Survey, conducted quarterly to collect information from establishments on pay and benefits provided to employees, has shown an overall decline in employer-provided benefits over the past two decades, most notably in
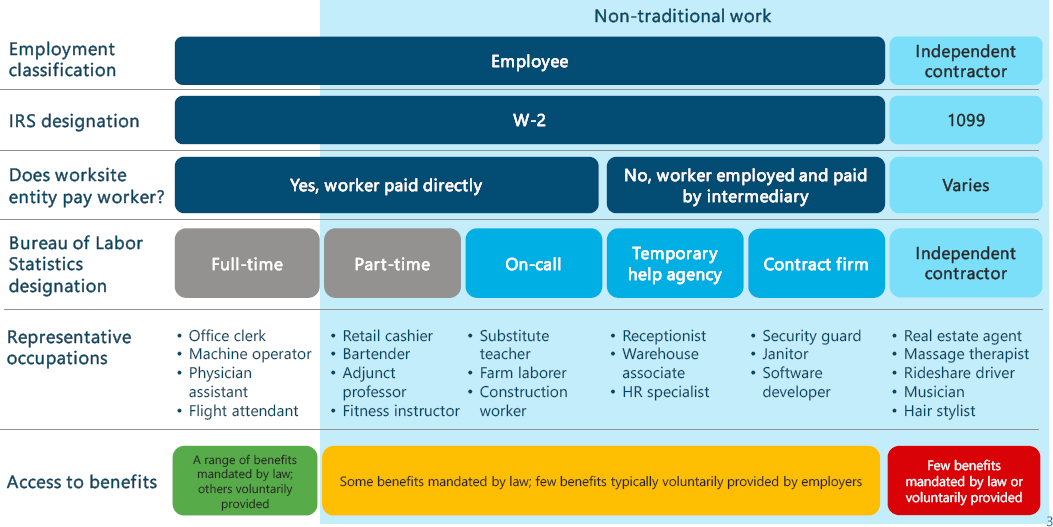
SOURCE: Fitzpayne and Steward presentation.
health insurance and retirement. This trend means workers today are facing more economic insecurity than prior generations of workers. Available data suggests to Fitzpayne that these challenges have been felt particularly acutely by nontraditional workers, including temps, subcontracted workers, and independent contractors. This problem might be addressed by several approaches, including one put forward by the Future of Work Initiative as a promising solution in today’s labor market: portable benefits that can be taken from job to job. Effective portable benefits policies, though, depend on a solid understanding of how people are working and what their needs are.
Shelly Steward, research manager for the Future of Work Initiative, spoke about the project’s efforts to connect policy makers with relevant data sources. She described the initiative’s Gig Economy Data Hub, created to provide an accessible and comprehensive summary of available data and research on gig, independent, and nontraditional work in the United States. The data hub seeks to provide summary answers to basic questions of interest to a range of stakeholders, including policy makers, journalists, students, and the general public. Among the key questions of interest are these: How many nontraditional workers are there? How many of them do this work to supplement other employment? What industries do they work in, and what is their demographic makeup? And, what are the motivations for nontraditional work, especially supplemental work, and how does that vary across income levels and other demographics? The initiative has partnered with Carnegie Mellon University to add interactive data visualizations on the site as well, using the 2017 CWS numbers, to allow people to look at these data in new ways.
Steward reiterated a point made by Young: that there are very different policy implications if people need benefits attached to nontraditional work because that is their primary source of income, as compared to when they are seeking supplemental work because reliance on a traditional job alone does not provide adequate financial security and benefits. Informal or under-the-table work, which is not well captured in official statistics, may be disproportionately performed by the most vulnerable segments of the population. Data, including at the state and local level, are needed to quantify this assertion and to assess variations among regions and cities and between rural and urban areas. Toward this end, Steward reported, the National Governors Association has a consortium (currently involving 10 states) working to improve knowledge within their states about on-demand and nontraditional workforces
Steward concluded with an overview of the ways better data could be helpful to policy makers working on portable benefits, which are defined by these characteristics:
- Portability: Benefits are connected to an individual, rather than to a single employer, and can be taken from job to job;
- Prorated: Benefits are provided in proportion to work performed and can be funded from multiple sources; and
- Universal: Benefits are accessible by all workers, regardless of work arrangement.
Several states have introduced bills to create portable plans, and also to make existing programs, such as a state paid-leave program or a state auto-enrollment retirement account, more accessible to a wider range of workers. Key questions that remain to be sorted out include: What benefits will be included in a new plan? Who would be eligible for these benefits? How will the benefits be funded? And, who will administer them?
Panel member Michael Strain, who led the open discussion, pointed out that a number of state-level policies have already been enacted, or an attempt was made to enact them, to redefine who is an employee and who is an independent contractor. The ground is shifting, as players at various levels of government are using different models with different built-in assumptions about how workers should be categorized, and this is complicating the measurement of phenomena, especially across time. Fitzpayne confirmed that this is the case, with work being done by different states that is moving in different directions concerning the definition of nontraditional work.
Steward agreed and noted that this points to the need to have data that do not rely on formal, established categories of employment, which are constantly shifting. Instead, the focus should be on job characteristics: Do these workers have access to benefits? Do they have channels through which they can access workplace protections or take action should they run into a problem? These questions, Steward suggested, are more about the job experience than about formal categories that can change. Panel member Annette Bernhardt stated that California is deep in policy design discussions concerning independent contractors, and one factor blocking progress there is that people do not understand how varied the set of independent contractors is—across the income spectrum, by industry, by demographic group, and by age.
Strain argued that some balance was needed when identifying key measurement objectives. He pointed out that, along with the challenges created by emerging AWAs, there are also positives: For example, people value the flexibility, and people value being their own boss. When thinking about measurement objectives, those considerations should be part of the overall picture. Strain agreed that worker benefits and tax compliance are important measurement objectives, along with wages, but he urged the committee to also consider the perspectives of businesses, both platform companies and businesses that employ contractors and contingent workers.
Other questions that he urged be looked into: How does the growth of contingent work affect traditional W-2 employers? What sorts of measures from their perspective would policy makers need to know?
Strain also posed several fundamental questions about the workforce that current surveys fail to adequately get at: Are workers satisfied with their jobs? Are they working part time for economic reasons? Are those who are working part time satisfied with the hours they are getting? Are the jobs that workers are currently holding perceived to be part of their longer-term career goals? Answering worker satisfaction questions of this type could be an important measurement objective as well.
Julie Hatch Maxfield, assistant commissioner for current employment analysis, noted that the CWS does ask workers about preferences and benefits—health care and retirement being the two topics on which BLS has traditionally focused. BLS commissioner William Beach noted the importance of not confining research on AWAs to any one statistical agency, and argued that the CWS is an ideal project to view through the lens of the Commission on Evidence-Based Policymaking (2017), calling for greater collaboration among the statistical agencies. He was optimistic that recommendations from the Commission’s report, The Promise of Evidence-Based Policymaking, would spur progress among the principal statistical agencies to improve measurement by combining data sources. Beach reported that the agencies were trying to design the right kind of guidance language and inspirational vision statement to do this.
Panel member David Weil raised an additional issue affecting data needs. The employment categories, particularly the representative occupations identified in Figure B-1, are constantly shifting, even within different types of employment structures. Even when one is able to determine which category a job is in, the wage structures in the nontraditional sector will increasingly affect wage structures in the traditional sector. Ultimately, the concern should be with broader phenomenon in the labor market—such as employment volatility, earnings, and benefit coverage—not with how jobs are labeled. Someone employed in the same occupation or the same industry may affect the wages and benefits of other people even if they are working under different employment models. How one thinks about this classification issue ultimately affects questions about the outcomes and questions the data are being used to answer.
B.2. MEASURES OF WORKER WELL-BEING
A discussion of policy issues affecting worker well-being continued with a presentation by Susan Lambert (University of Chicago, School of Social Service Administration). Among the broad spectrum of public policy issues associated with different types of worker arrangements is the problem of
unpredictable work schedules. This particularly affects the well-being and security of low-income and low-skill workers. Lambert discussed measurement challenges and the need to inform public policy around work-hour standards. She advocated the benefits of a multidimensional approach to estimating the prevalence of different types of work arrangements, especially those common at the lower end of the labor market. She also spoke about new items in the National Longitudinal Survey of Youth-97 and 2016 General Social Survey (GSS) to capture information about problematic scheduling practices.
Lambert’s comments focused on questions related to the timing of work—when people work, how much they work, and who controls the outcomes. She noted that, even when hired directly by firms, workers’ hours can be unpredictable, unstable, and scheduled on call. U.S. employers do not need to have special job categories or tax arrangements to provide workers with what is essentially temporary employment and demand-driven work hours.
To improve measurement, Lambert discussed the potential value of asking more detailed questions about work schedules in the CWS so that it would be possible to differentiate the form of employment arrangements from their functions. One goal would be to facilitate comparisons across standard and nonstandard alternatives even when jobs are not categorized consistently (either through time or across states or countries).
Lambert and colleagues have been studying the nature of work time and evaluating new “fair work week” legislation, which many cities now have. They have examined the different dimensions of working time and attempted to devise some core measures. The three dimensions of working time they identify are:
- Quantity: the number of weekly hours where, at one end, the worker is underemployed and at the other end, the employee is overworked;
- Timing: which may be either standard or nonstandard, where the majority of hours fall outside the hours of 9 to 5, Monday through Friday; and
- Stability: characterized by consistency in the number of hours, days of the week, and times of day; also, by consistency in the magnitude and direction of variation in the number of hours.
These dimensions of work can have serious ramifications for a worker’s economic security; as can predictability—the ability of workers to anticipate when they will and will not work—and the amount of input employees have in setting the number and timing of the hours. Lambert summarized what is known about the relationships of these different dimensions
to worker well-being and performance. Key among her findings are the following:
- Schedule unpredictability and instability are related to higher levels of stress, work-to-family conflict, and interferences with nonwork activities;
- For parents, schedule unpredictability makes it difficult to arrange reliable child care and to participate in family routines important to child development;
- An unpredictable and unstable schedule can mean unpredictable and unstable earnings; too few hours leads to too little income, and to economic insecurity;
- Evidence from a retail firm case study by Lambert and colleagues suggested that improving schedule stability and predictability can improve labor productivity.
In terms of survey measurement, a key observation is that national surveys are limited in capturing dimensions of working time. Surveys typically focus on “usual or typical hours” and are designed intentionally to smooth rather than reveal variations in work hours. Recently, items have been added to the NLSY-97 and the 2016 GSS that allow researchers to partly identify the magnitude and direction of fluctuations in weekly work hours, the extent of advance notice, and input into the number of hours. Respondents are asked, for example: What are the greatest number of hours you worked in a week in the last month, and what are the fewest number of hours you worked (not counting illness and vacation)? Or, How far in advance do you usually know what days and hours you’ll need to work?
The 2016 GSS hourly data indicate that 82 percent of respondents give a different number of hours for the greatest and fewest hours they worked in a week. The average difference between those two is 13 hours, which amounts to 37 percent of their reported usual hours. Fifty percent of respondents reported a difference of 8 or more hours, which is more than a full day of pay. This indicates how irregular hours are for some workers. Additionally, about 50 percent of people reported that their employer controls the timing of their work, meaning they have little or no input into their number of hours.
By looking at constellations of work-scheduling practices, Lambert and colleagues attempted to translate these responses into categories of employment. They found that on-call and on-demand workers display two qualities: There is variation in either the number or the timing of hours worked; and the hours are not controlled by the employee, but rather by the employer. In addition, hours are often set with only short notice. The researchers then compared this kind of multidimensional definition to the
direct approach used in the CWS question that attempts to measure on-call work. The CWS asks each respondent if they were an “on-call worker last week?” Beginning in 1997, a follow-up question was added that asks if hours are “regularly scheduled?”
As indicated in Table B-1, the 2017 CWS identifies 1.9 percent of respondents to be on-call workers. If the additional restriction—of having no regularly scheduled hours reported—is included, the figure drops to less than 1 percent. This means that half of the people who said they only work as needed also reported that they have some regularly scheduled hours.
In Lambert’s multidimensional approach to defining on-call workers, which they used in the GSS and which has also been used in the Federal Reserve’s Survey of Household Economics and Decisionmaking (SHED), the figure for the number of workers reporting less than 7 days’ notice jumps to about 15 percent. For less than 1 day’s notice, the figures for the two surveys are 6.4 percent (GSS) and 5.1 percent (SHED). Almost a quarter of workers reported that volatility that was at least 25 percent of their usual hours; about 11 percent reported that their hours varied in the last month by more than 50 percent of their usual hours. This means that the majority of people in the labor market effectively performing on-call or on-demand work are in a so-called conventional standard employment
TABLE B-1 Alternative Methods for Counting On-call or On-demand Workers
| CWS (2017) | GSS (2016) | SHED (2017) | |
|---|---|---|---|
| On-call Work (form/category) | |||
| Only work as needed (%) | 1.9 | ||
| No ‘regularly scheduled’ hours (zero hours contract) (%) | 0.8 | ||
| Multidimensional | |||
| On-call Work (unstable hours/no EE input/short notice) | |||
| Notice < 7 days (%) | 14.9 | 14.9 | |
| Notice ≤ 1 day (%) | 6.4 | 5.1 | |
| On-demand Work (unstable hours/no EE input/considerable volatility in hours) | |||
| Volatility ≥ 0.25 usual hours (%) | 22.7 | ||
| Volatility > 0.50 usual hours (%) | 10.7 | ||
| N | 41,722 | 493 | 5,120 |
SOURCE: Fugiel and Lambert (2019).
relationship. There is a blurring of lines in terms of what is standard and what is not standard.
Lambert suggested that if the CWS were to look at different dimensions of work schedules, it would offer a way to start teasing out the unique features of different kinds of employment relationships. It would also provide a way to make comparisons internationally to other countries that have even more different titles for the kinds of jobs people hold.
The workshop focus turned next to worker safety. The National Institute for Occupational Safety and Health (NIOSH) has led efforts to develop a taxonomy of work arrangements to examine their relationships with worker safety, health, and well-being. NIOSH is a prominent user of CWS/CPS data for its work identifying high-risk categories of workers, including those in industries and occupations with a high prevalence of AWAs.
Tim Bushnell, Economic Research and Support Office, and Toni Alterman, Division of Surveillance, Hazard Evaluations and Field Studies, represented NIOSH during this session. Bushnell’s talk covered NIOSH programmatic interests in work arrangements, including its Healthy Work Design and Well-Being Program; its work defining specific dimensions of work arrangements; the value of adding new questions to existing surveys concerning job dissatisfaction and reasons for quitting; and the role of the CWS and other data sources for NIOSH research related to work arrangements.
In addition to tracking patterns in occupational injuries and illnesses and the hazards and exposures related to them, NIOSH also devotes attention to organizational and managerial risk factors. The agency is interested in characteristics of work arrangements, not just because of their potential relationships with poor pay, benefits, and job security, but because of possible links to health and safety and other aspects of well-being.
The Healthy Work Design and Well-Being Program, still in formation, is the agency’s central vehicle for addressing concerns about work arrangements. Bushnell described the well-being outcomes connected to work design as including not only the traditional concerns with illness and injury but levels of physical, cognitive, and behavioral function, economic well-being, work/life fit and conflict, positive social experience, fair treatment at work in various forms, and intrinsic work rewards.
The Healthy Work Design and Well-Being Program defines standard work arrangements as fulfilling specific job conditions for the worker. These are employee status; secure, career oriented; adequate and stable pay; inclusion of health insurance and retirement benefits; regular, full-time schedule; adequate schedule flexibility; and paid leave. A nonstandard work arrangement is one that deviates from this standard arrangement definition.
Bushnell echoed Lambert’s point that examining the dimensions or characteristics of work, and not the formal categories, is most useful for their analyses. In addition to pay, benefits, and job security, he identified
the key work schedule dimensions: total work hours; shift type (e.g., day, evening, night, rotating, split); predictability of work hours; and work flexibility (e.g., sick leave, number and choice of days, and hours off). Bushnell cited evidence of the impact of work schedules on health. The effects on sleep quality and quantity, which are linked to a wide range of outcomes, are most obvious, but exercise, diet, smoking, substance use, and impact on work/life fit and conflict are also important considerations.
Bushnell pointed to evidence that NIOSH has observed distinctly higher injury rates among temp agency workers relative to their permanent counterparts. After adjusting for occupational differences, the injury rates of temp workers are about twice as high, he said. Temp workers actually tend to have less frequent exposure to job hazards but, on average, have less safety training and less selection for their jobs based on their experience.
Bushnell also discussed the distinction between employee and self-employed status, as well as the distinction between different forms of self-employment, noting that the agency is interested in obtaining better data on the number of employees misclassified as independent contractors, and about which industries and occupations they work in. These employers do not carry workers’ compensation insurance, they have less incentive to emphasize safety, and they lack other standard benefits and protections. Bushnell reported that the self-employed generally express a high degree of satisfaction with their work arrangement, but they also experience a work-related fatality rate that is four times as high as the conventionally employed. To better track these trends, NIOSH supports the idea of including on surveys a question on receipt of 1099-K tax forms or other means to identify misclassified workers, or simply to identify workers who consider themselves employees but are paid as independent contractors.
Bushnell also raised the possibility of surveying respondents about other key dimensions of AWAs, including split or shared responsibility for supervision, and form of compensation. Split responsibility for supervision may be present for contract workers placed under the management of a company that is a client of the worker’s direct employer, or workers who are supervised in part by other parties such as a customer, supplier, franchisor, software platform, or other contractors on the same worksite. The concerns with split or shared responsibility for supervision are about potential for lack of coordination of supervision, lack of understanding of supervising parties of all of the risks to workers, or failure to take sufficient responsibility for worker safety, health, and well-being. A general question on split supervision might ask workers whether, besides the employer who pays them, there is any other company or organization that also supervises or directs how they do their job. The form of compensation (as opposed to its amount) can affect safety, health, and well-being because it has the potential
to create incentives that undervalue safety and health as compared to speed and productivity or lead to stress and overwork.
Bushnell also described questions that could be added to surveys about workers’ job dissatisfaction—including reasons for leaving a job or looking for another job—which would be useful in indicating negative working conditions associated with all work arrangements. Such questions could also provide information about unfair treatment, excessive work demands, the physical and social work environment, schedule flexibility, and the safety and health risks of work. The complexity of job acceptance and quit decisions also allows multiple factors related to working conditions to be identified by respondents. Bushnell believes it would be useful to elicit salient information about dissatisfactions with current jobs from workers who are not planning to leave their jobs, since many aspects of discontent do not get expressed in job change.
Next, Bushnell turned to the role of the CWS and other data sources in NIOSH Work Arrangement Research. The CWS is useful for estimating the potential magnitude of work arrangement risks and the industry and occupation “location” of specific work arrangements. The CWS currently asks respondents if they are “registered with more than one temporary help agency last week?” Bushnell suggested a follow-up question—“How many temporary help agencies were you registered with last week?”—would potentially be valuable to NIOSH, since the nature of employment relationships changes with the number of agencies worked for.
One key initiative of the agency is its sponsorship of the Occupational Health Supplement to the National Health Interview Survey, one of the major data collection programs of the National Center for Health Statistics of the U.S. Centers for Disease Control and Prevention (CDC). This supplement was fielded in 1988, 2010, and 2015. The plan going forward is to ask at least 6 or 7 questions about work arrangements in 2020 or 2021.
Bushnell’s colleague, Toni Alterman, listed and described the measurement constructs proposed by NIOSH for 2020/2021 as follows: (1) self-employment; (2) working for temporary help or staffing agency; (3) job insecurity; (4) organizational justice, distributive justice/effort-reward; (5) shiftwork (usual shift); (6) mandatory overtime; (7) schedule flexibility; (8) income variability; (9) presenteeism (working while physically ill); and (10) schedule predictability.
Questions of interest for the future would address additional matters: (1) extra shift on short notice; (2) desired hours of work (more or less); (3) method of payment (salary, hourly wage, tips, commission, etc.); (4) financial stress (adequacy); (5) supervisors from multiple organizations; (6) presenteeism (working while having mental health problems); (7) work engagement (vitality); (8) type of employer or self-employment; and (9) use of electronic monitoring by supervisors.
Bushnell concluded with a discussion of the Quality of Work Life Survey module of the GSS (2002, 2006, 2010, 2014, and 2018). He noted that what is especially valuable to NIOSH is knowing the industry and occupation location where different kinds of work arrangements prevail. This project began through an interagency agreement with the National Science Foundation to add a special module assessing the quality of work life in America to the 2002 GSS. Because the GSS is a relatively small sample survey, it does not produce industry and occupation detail, but it does contain rich descriptions of working conditions that uncover national trends. As with the CWS, the GSS module showed a flat trend in the growth of explicitly named nonstandard categories of work arrangements.
B.3. EMPLOYER AND BROADER MARKET POLICY ISSUES
The new economy requires policies designed to make new employment models work well not just for employees, but also employers who hire them and for the markets in which they operate. Kicking off this session, Gene Zaino, founder and executive chairman of MBO Partners, spoke about his organization’s work on key policy issues shaping the independent workforce movement that need to be informed by data collections, as well as about how to think about different categories of workers (e.g., part time and full time) within this movement.
MBO Partners provides an end-to-end business management platform for independent workers and the enterprises with which they engage. Collaborating with the firms Emergent Research and Rockbridge Associates, MBO Partners has been conducting research on the independent workforce for about 9 years. The firm’s top-level findings, as summarized by Zaino:
- Independent work is a vibrant source of economic growth;
- Independent work satisfaction is high (most independent workers choose to work independently); and
- Measuring all segments of employment is important for effective policy.
MBO Partners estimates that, in 2018, full-time independent workers generated $1.28 trillion of revenue for the U.S. economy, more than 6 percent of gross domestic product (GDP). The organization estimates that about 15 million workers are “occasional independents” (e.g., doing “side gigs”), about 10.8 million workers are part-time independents (working regularly, but fewer than 15 hours per week), and about 15.3 million workers are full-time independents (working regularly, greater than 15 hours per week).
Zaino discussed four features distinguishing regular employees from independent workers:
- Relationship with the firm where they work: The regular employee has an extended or permanent relationship; the independent worker is project-limited;
- Risk: The regular employee does not realize profit or loss; the independent worker incurs profit or loss from a project;
- Control of work process: A regular employee’s manager has control over work; the independent worker’s manager does not control the work process; and
- Integration: The regular worker is part of the company’s regular business; the independent worker is outside the company’s regular business.
Among full-time independent workers, MBO Partners surveys find that 21 percent earn more than $100,000 per year. This subgroup, unsurprisingly, reports high levels of job satisfaction. A high percentage of full-time independent workers also report that they engage in independent work by choice (81%) and that working on their own is better for their health (68%). Zaino emphasized that, in his interpretation of MBO Partners research, people are engaging in independent work in large part because there is a positive side to it.
Zaino also addressed the business perspective. He cited the Deloitte Global Human Trends Survey (2018), in which 84 percent of surveyed businesses reported anticipating the use of independent professionals to increase or stay the same by 2020. Similarly, Mercer’s 2019 Global Talent Trends Study indicated that 79 percent of executives expect that contingent and freelance workers will substantially replace full-time employees in the coming years. Zaino’s view was that companies are using independent workers not just for cost reasons, but also for agility and for competitive advantage.
The MBO Partners perspective is that policies are needed that reflect economic realities and that do not restrain independent workers and the global advantage of U.S. firms that engage them. One goal, Zaino suggested, should be to protect the lower-paid, routine commodity workers who are vulnerable to abuse as part of a “race to the bottom,” while enabling on-shore economic growth for the higher-paid, nonroutine work where workers have choices.
To inform this policy area, Zaino advocated that BLS collect data on businesses’ use of independent workers and on various workforce segments. He believes information is needed in three areas: (1) workforce configuration—full time vs. part time and occasional, serving consumers vs. businesses, routine microprojects vs. skilled; (2) motivation for independence—reluctant, forced vs. chosen, primary income vs. supplementing other work income; and (3) hourly income levels associated with
different jobs. Zaino also spoke about the need to simplify and harmonize worker classification, a theme echoed by many of the speakers.
During open discussion of the Lambert, Bushnell, and Zaino presentations, panel member Arne Kalleberg reiterated the point that looking at the work categories themselves is not as useful as one would think, because they are ever-changing. Since there are good jobs and bad jobs even in “standard employment,” he argued, the discussion of contingent or nonstandard work is tangential to what the real issues are: the nature of work, how the nature of work is changing, and which aspects of work affect people’s lives in terms of health, stress, and family life. It is these characteristics, rather than the type of work arrangement, that should shape the measurement objectives, Kalleberg argued.
Panel Chair Susan Houseman asked Lambert, who had made a compelling argument for collecting data on irregular, unpredictable work schedules, if there was value-added to including such questions on the CWS, given that the information is collected on various other surveys such as the GSS and the NLSY. Lambert responded that researchers do use the CWS and the CPS to try to get at this issue, and the supplement should be more focused on these types of jobs than a broader, nonemployment-specific survey would be. For example, the CWS already identifies on-call workers, which would not be done in the NLSY or for most other datasets. Adding such a question in the context of the CWS would allow users to look at the similarities and differences across the range of employment arrangements.
Panel member David Weil followed up with Zaino to ask about the respective roles of worker and employer (or establishment) surveys. He referred to the Mercer’s 2019 Global Talent Trends study, discussed by Zaino, which reported that CEOs planned on moving aggressively to increase their use of contingent and freelance workers. In fulfilling measurement needs in this area, Weil felt it was clear that household surveys would not suffice to answer all the questions, such as how businesses are making decisions. Zaino agreed that business surveys are needed to understanding staffing decisions to use nontraditional workers which, again, he suggested are cost-based but also, in some cases, about accessing talent. Some types of workers, such as those in creative technology fields, are in high demand and do not necessarily want to be restricted to arrangements with only one company.
Panel member Kristen Olson asked Lambert if, in her surveys of hourly workers, she has been able to check the accuracy of responses regarding number of hours worked against payroll or other records. Lambert replied that her team had established that workers’ responses were accurate—even accessing information on the actual times when workers clock in and out every day—which helped them convince BLS to add questions about fluctuating hours to their surveys. Lambert implied that people’s perceptions of
how much their hours vary were less consistent, although they correlated closely with the actual variation.
B.4. INSIGHTS ABOUT ALTERNATIVE WORK FROM OTHER (NON-BLS) SURVEYS
Building on what was learned from BLS experts during the panel’s first meeting, this session included presentations intended to help the panel assess the range of questions that can best be answered using household surveys and to identify which questions require other kinds of data, such as those derived from employer surveys, administrative/tax records, and commercial sources.
Panel member Barbara Robles began the session with an overview of the Federal Reserve Board surveys, focusing on results from the 2018 SHED. The Division of Consumer & Community Affairs at the Federal Reserve Board has fielded the SHED for 3 straight years in an attempt to measure the extent of and reasons for engagement in alternative, enterprising, and informal work activities.
Ipsos, a private consumer research firm, administers the SHED survey using its KnowledgePanel, a nationally representative probability-based online panel. Ipsos selects respondents for this panel based on address sampling, and SHED selects respondents from this panel. The respondent sample for the 2018 survey’s “gig work” module was 3,152, from a total sample of 11,316 respondents, with a cumulative response rate of 4.3 percent. SHED attempts to be as inclusive as possible concerning categories of employment. The 2018 version of the module evolved from an exploratory stand-alone survey fielded in 2015, called the Enterprising and Informal Work Activity Survey, designed to pick up enterprising activity—that is, when people generate jobs for themselves. This survey had estimated that a high percentage of workers (36% in 2015) take part in freelance work.
Robles noted that some of the SHED questions on gig work were revised from those asked in 2016 and 2017, so time-series comparability is limited. Five percent of the survey’s screener respondents2 reported engaging in gig work providing child or elder care services; 3 percent engaged in dog walking, feeding pets, or home sitting; and 6 percent reported doing house cleaning or yard work. Driving or ride sharing, reported in a standalone question introduced in 2017, was reported by about 3 percent of respondents. Activities done online—any kind of paid online task—were reported by 4 percent. Selling goods at flea markets and garage sales was indicated by 5 percent of respondents; selling goods at consignment by 3 percent; and selling goods online (such as on eBay) by 10 percent. Four
___________________
2 The screener questions were asked of the full SHED sample.
percent reported renting property. Among the subgroup of respondents reporting they had engaged in gig work, a high percentage of the activities appear to have involved selling items they no longer had use for. The other large response category, accounting for 22 percent, was house cleaning, yard work, and property maintenance.
Strain raised the point that it is important to differentiate between income and labor earnings. Income can result from selling an old bicycle on eBay, yet that is not generally the kind of economic activity that official statistics try to capture. Strain added that asking questions about why people engage in alternative work is very useful for understanding the labor market, and also because the variety of reasons have very different policy implications.
The survey also asked why respondents engaged in the gig work. This was done using two separate types of questions: One allows gig respondents to provide a reason why they are motivated, using an open-ended format; the other provides a checklist for all that apply. The survey also asks respondents for a main reason for engaging in gig work. About 50 percent of respondents reported that they were motivated to supplement income; 35 percent reported that they wanted to sell items they no longer needed; and a substantial 21 percent reported that the money earned was their main source of income. When respondents were asked to indicate only one reason, the “main source of income” motivation dropped from 21 percent to 18 percent, and the answer, “to earn money supplementally,” dropped from 50 percent to 37 percent. Motivating factors varied somewhat by income category—40K and under, 40K–100K, 100K and over—and by ethnicity and race as well. Earning money to help family members was the most frequent response among the under-40K income group.
To conclude, Robles posed a set of questions for further research to guide design of the SHED. Are the right questions being asked and in ways such that respondents can convey how they see themselves: as workers, income generators, or both? If individuals are engaged in multiple forms of AWAs, how do we assign them “one” category?
The use of online probability panels remains a much-discussed issue among survey methodologists, researchers, and statistical agencies. Given the declining response rates in many paper and phone survey collection efforts, and given budgetary constraints, online surveys have increased in recent years as respondent pools have also become more adapted to internet and smartphone use. Robles pointed out that the digital divide remains an area of concern, both for respondent representation (do such respondents accurately represent the populations with no connectivity?) and for the acculturation of respondents presumably representing the “unconnected” populations.
Cynthia Davidson and Steve Berchem of the American Staffing Association (ASA) presented next on survey and policy work at their organization, which is headlined by the ASA Staffing Employment and Sales Survey (SESS). This survey, conducted on a quarterly basis since 1992, collects information from staffing firms to estimate temporary and contract staffing industry employment, sales, and payroll.
Berchem defined staffing companies as those that employ temporary and contract workers. In 2018, sales for the industry—which includes temporary and contract staffing as well as permanent placement services—amounted to around $167 billion. Temporary and contract staffing employees account for about 2 percent of the nation’s nonfarm workforce, or about 3 million people per day or per week. Over the course of the year, however, because turnover is around 400 percent, the industry employs about 17 million people. Berchem noted that, for those employed by staffing agencies, around 80 percent of temporary and contract workers work full time, and the majority are W-2 employees (meaning they are typically not platform employees for example). A similar proportion of temporary and contract workers come to staffing companies as a way to transition into a permanent job. Most assignments are 10 to 12 weeks, and most staffing employees come to work for a staffing company for one assignment with one staffing firm, and then they leave, presumably to go take the job permanently. Echoing a point made by Zaino when discussing firms hiring independent workers, Berchem stated that clients use staffing firms primarily to gain access to talent that they would not have otherwise; cost reduction is typically a secondary factor.
According to Berchem, the impetus for ASA developing the quarterly SESS occurred when BLS temporarily suspended its measuring of the staffing industry in 1990. (BLS resumed measuring it in 2000, reconstructing and publishing a series for the 1990s.) Meanwhile, ASA had already established its survey, which was created for it by DRI McGraw Hill.3 Having data collected by a third party is important for the purpose of keeping information provided by the staffing companies secure and private; ASA staff do not see information for individual companies.
The SESS is a stratified sample of about 100 companies of various sizes (encompassing about 10,000 establishments) drawn from the U.S. Census of Business. The survey is now a web-based instrument of no more than seven questions; employment, sales, and payroll are measured from quarter to quarter within each company-size stratum. The length of the SESS used to be about 20 to 25 minutes, but the number of questions has been reduced so that in now takes about 10 to 12 minutes to complete.
A key project derived from the survey is the ASA Staffing Index, a weekly measure of changes in employment by staffing firms. Berchem
___________________
3 The company was later renamed Global Insight and then IHS Market.
reported that the index tends to track closely with GDP. For example, in July 2009, at the end of the recession, the staffing index began to tick up, revealing the beginning of the subsequent expansion before many other indicators did.
Berchem closed by pointing out some differences between the SESS and the BLS surveys. The SESS is based on the methods of the BLS’s establishment surveys—for example, even collecting data for the week containing the 12th day of the month. However, the ASA survey includes temporary and contract workers only and does not include the corporate employees of staffing companies themselves, unlike the BLS. Berchem believes that the BLS surveys miss some contract employment, and pointed to two pieces of evidence: First, BLS estimates that the temporary help services industry employs about 2.5 million workers while ASA estimates a little over 3 million, even though BLS includes the corporate employees of staffing companies. Second, the BLS may miss some contract employment because, in some cases, the agency classifies temporarily placed computer programmers and other IT professionals under the category of “computer business professionals.”
Davidson expanded on Berchem’s presentation to discuss additional aspects of the SESS and differences relative to the CWS. The ASA survey, she pointed out, differs from the CWS in frequency, in its identification and classification of employees, and in survey length. As noted earlier, the SESS is quarterly, whereas the CWS has been done on a periodic basis. Because ASA is more narrowly focused on temporary and contract workers for staffing companies, its task is somewhat easier than the BLS’s task with the CWS, since the BLS seeks to measure all “contingent” work, a wider set of employment arrangements. The SESS screener questions ask whether or not a worker works for a staffing company and in what capacity. Terms are important, and ASA is careful not to call temporary workers “part-time” workers since, as pointed out earlier, they are more often working full time than not. The key distinction is temporary versus permanent.
The ASA data dashboard, which is used by industry leaders, economists, analysts, and journalists, includes four metrics: changes in ASA-measured staffing jobs (which can be compared by firm size); changes in BLS-measured temporary help jobs; changes in the ASA Staffing Index (described above); and changes in the GDP projections made by Wall Street Journal economists. Census data on turnover and overall annual employment, drawn from the quarterly survey and sector-level information, are added to provide dashboard users with extra layers of information. Statistics are available at a variety of geographic and sectoral levels.
During open discussion, panel member Arne Kalleberg asked the ASA why estimates of people working in the staffing industry were so much higher than those estimated by the BLS. Davidson responded that the main
difference between the ASA’s number and the BLS’s stems from the fact that in the BLS’s monthly jobs report contractors are often classified under other industries and not as temporary help. She said that after BLS revises its numbers, the two sets of estimates become closer.
Houseman questioned whether household surveys such as the CWS should continue asking whether respondents work for a temporary help agency, since staffing companies now call themselves just that and the old wording may no longer resonate. She also pointed out that there is considerable evidence from the CPS and CWS that people in temporary help jobs, for example, are often confused about their status and often report the client as their employer. This mix-up is revealed in the CWS responses and with further probing about whom they are being paid by (e.g., a client or a staffing agency).
Next, Leif Jensen of Penn State University presented survey-based research exploring urban-rural variation in informal work activities. He addressed definitional questions, differentiating between unpaid and paid (off-the-books) work, and discussed his research team’s measurement strategy for capturing informal work activities. He discussed a national survey of informal work conducted with colleagues Ann Tickamyer (Penn State) and Tim Slack (Louisiana State University) and identified possible implications for the panel’s study and its recommendations about the CWS.
Jensen noted that the term “informal economy” was historically associated with self-employment and small-scale family enterprise, but also with poverty and underemployment. An implication was that informal economic activity was endemic to underdeveloped countries and that its significance would decrease with economic growth. However, it has become clear that this is not the case—the informal economy retains importance in modern and rich societies, and indeed it has perhaps become more important with recent trends in work arrangements.
For the purposes of his presentation, Jensen used the following definition from Jensen, Tickamyer, and Slack (2019): Informal work includes “household work activities that generate cash or in-kind income or reduce expenditures that operate outside the scope of state regulation in contexts where [they otherwise would be].”
Jensen described qualitative evidence indicating that informal work is more common in rural than in urban areas. He cited several attributes of rural areas as reasons for this pattern: (1) formal sources of goods and services may be lacking; (2) networks of family and friends tend to be stronger; (3) there is greater deprivation; and (4) there is greater proximity to natural resources, which facilitates certain informal activities.
Jensen cited the lack of representative quantitative data to study informal work as his motivation for engaging in survey research on the topic. Building on earlier survey research (Jensen, Cornwell, Findeis, 1995; Slack,
2007; and Tickamyer and Wood, 1998, 2003), Jensen and colleagues initiated a national-level household survey of informal work using computer assisted telephone interviewing conducted by Penn State’s Survey Research Center. The sample was about 1,800 households, with a cooperation rate of about 50 percent, and low-income and rural households were oversampled. The content of the survey included questions on:
- Household roster with demographic information;
- Formal employment circumstances;
- Formal self-employment / business ownership;
- Informal economic activities (“things that you and other members of your household do to help economically by earning money, saving money, or getting other items of value through barter or trade, as opposed to formal employment”);
- Income sources; and
- Social capital and community involvement.
Respondents were asked 18 closed-ended questions regarding the engagement of household members in a list of informal economic activities. They were asked, “In the past year did you or any other members of your household engage in X?” and whether that X was any one of 18 different activities.
The overall fraction of households recording any kind of informal work done for any form of return was about two-thirds. When the definition was restricted to those who engaged in formal work only to earn money (as opposed to those also motivated to barter, save, or volunteer), the fraction shrank to closer to one-third. Table B-2 indicates the percentages of households reporting various categories of informal work performed; households could report more than one. Growing or producing food products and home repair and improvement were the most reported categories. For most categories, the rate of informal work was higher in nonmetro areas than in metro areas. In nonmetro areas, activities such as growing or producing food, hunting, and fishing were more common, while in metro areas personal services, accounting, and computer work were more typical activities.
Jensen has also explored the reasons motivating households to engage in informal work. The top reasons cited in the survey were to help out relatives and neighbors (77.6% reporting “somewhat important” or “very important”); to be able to set one’s own hours (58.7%); to make ends meet (58%); to be one’s own boss (55.2%); and to work at home (50.9%). Responses such as “to make ends meet” and “there aren’t enough good jobs around here” were more common motivating factors in rural areas.
Multivariate models using the data confirmed the higher prevalence of informal work in nonmetro areas. While the residential differences could
TABLE B-2 Percentage Engaging in Informal Work by Type and Residence
| Total Sample | Metro | Non-Metro | |||
|---|---|---|---|---|---|
| Total | Micro | Non-core | |||
| Any Informal Work | 67.0 | 66.0** | 72.1 | 73.4 | 70.4 |
| Grow or produce food products | 26.4 | 25.1** | 32.5 | 32.7 | 32.2 |
| Home repair or improvement | 24.0 | 23.2 | 27.9 | 30.2 | 24.6 |
| Repair vehicles, appliances, or other mechanical work | 18.6 | 17.9 | 22.0 | 22.9 | 20.8 |
| Personnel service | 17.3 | 17.4 | 17.1 | 18.5 | 14.9 |
| Hold or contribute to garage sale/flea market | 17.2 | 16.3* | 21.4 | 22.9 | 19.3 |
| Reuse/fix things others had discarded | 17.3 | 17.0 | 18.5 | 18.9 | 17.8 |
| Sell or trade clothes, makeup, scrap metal, etc. | 15.5 | 14.5** | 20.4 | 23.3 | 16.1 |
| Hunt, fish, or gather from land | 15.0 | 12.5** | 26.8 | 25.2 | 29.2 |
| Landscaping, snow removal, etc. | 12.7 | 11.9** | 16.9 | 18.1 | 15.1 |
| Provide blood or blood products (e.g., plasma) | 12.6 | 12.7 | 12.3 | 12.7 | 11.8 |
| Crafts, collectibles, or sew/do alterations | 8.9 | 8.8 | 9.2 | 10.4 | 7.6 |
| Other informal work not mentioned | 8.3 | 8.4 | 7.4 | 8.1 | 6.4 |
| Accounting or computer work | 7.4 | 7.5 | 6.7 | 7.8 | 5.1 |
| Give lessons(e.g., music, language, sports) | 7.0 | 7.0 | 7.0 | 6.8 | 7.2 |
| Breed, board, or tend non-farm animals | 4.6 | 4.6 | 4.4 | 4.7 | 4.1 |
| Clerical work (e.g., typing) | 4.4 | 4.2 | 5.4 | 6.0 | 4.4 |
| Take in boarders | 2.1 | 2.1 | 2.5 | 2.4 | 2.7 |
| Bartending or catering | 1.5 | 1.5 | 1.9 | 2.1 | 1.6 |
| Street vending/roadside sales | 1.4 | 1.3 | 1.6 | 2.0 | 1.1 |
| Number of Activities Reported | |||||
| Mean overall | 2.2 | 2.1** | 2.6 | 2.7 | 2.4 |
| Mean among those engaged in 1 or more | 3.3 | 3.2* | 3.6 | 3.7 | 3.4 |
| Maximum | 16.0 | 16.0 | 15.0 | 15.0 | 13.0 |
NOTES: *Metro/nonmetro difference significant at p < .05.
**Metro/nonmetro difference significant at p < .01.
SOURCE: Jensen, Tickamyer, and Slack (2019).
not be fully explained, they are partly accounted for by race/ethnic composition and the strength of social networks. However, other factors, such as lower levels of education in rural areas, suppress the residential effect.
Jensen concluded by summarizing the implications of his work for the panel’s study: Respondents’ location is an important factor influencing levels and types of informal work as an AWA. Definitional lines are blurry—it is difficult to know where to draw the line when defining informal activities (e.g., should barter and self-provisioning be included?). In a survey, listing specific types of informal work activities is effective but may not seem practical. However, if a respondent is asked if he or she engages in the informal economy, blank stares will follow! Summarizing, Jensen stated that rural America is important, different, and diverse; clearly, in his view, there is value in retaining the ability to identify rural populations and being attentive to their circumstances.
Next, panel chair Susan Houseman and panel member Katharine Abraham provided an update on their work (with Brad Hershbein of the Upjohn Institute) developing a survey module for the Gallup Education Consumer Pulse Survey, which consists of 14 questions asking respondents about the nature of their work arrangements. The goals of this research are to assess how well household surveys capture various types of contract and informal work and to inform ways in which household surveys might be improved to better measure these activities.
Houseman’s comments focused on a subset of objectives for fielding the Gallup module: to uncover the potential for miscoding workers’ employment status as “employees” in surveys such as the CPS and CWS; to capture all forms of work for pay—including informal work that may not be reported in government surveys, especially when not associated with a primary job; to measure contract company work; and to better measure work secured through online platforms or mobile apps.
In the Gallup survey, once a respondent has self-identified as an employee, one of the following question versions was asked in the added module:
- (Version 1): “Were you an employee on this job or were you an independent contractor, independent consultant or freelance worker?” Or,
- (Version 2): “Did this employer take any taxes out of your pay?”
Since an individual working as an independent contractor for an organization might respond that he or she is employed by that organization, the first follow-up question was designed to tease out cases where respondents are coded as employees when in fact they are not. The second version of the question catches miscoding as well, since respondents who are employees should have Social Security taxes taken out of their pay.
Findings revealed through the addition of one of the probing questions (summarized in Abraham and Amaya, 2019) indicate that some respondents do in fact get miscoded as employees when relying on their self-reported classification. The incidence of miscoding was 10.8 percent for the first follow-up question version and 8.9 percent for the second version. Employee miscoding was strongly (positively) associated with the number of employers the respondent had (i.e., multiple job holders), and also with low work hours, older workers, and gender (males).
The inference here, Houseman said, is that CPS question wording may suffer from similar problems of interpretation. As with the Gallup question, the CPS also attempts to distinguish the self-employed from those employed by government, by a private company, or by a nonprofit organization. The CWS itself provides some evidence of employee miscoding in the CPS, as 15 percent of independent contractors reported being employees on their main job (and 1–2 percent of all workers were coded as employees on their main job).
Another goal of the research highlighted by Houseman was to capture all sources of work activity, not just primary jobs. The Gallup survey, particularly in the work supplement module, may be better designed to capture work activity than other household surveys, like the CPS, because all respondents are asked both whether they were employed by an employer and whether they were self-employed. Additionally, question wording in the standard Gallup survey is designed to capture low work hours by asking about work for an employer or self-employment that occurs “even minimally like for an hour or more.” The Gallup self-employment question provides a more expansive definition of self-employment than is used in most household surveys.4
Houseman reported that their survey module also revealed a striking level of multiple job holdings—that is, of working for more than one employer in the prior 7 days. Multiple job holding includes cases where respondents worked for more than one employer and cases when work for an employer was combined with self-employment activity. Among those with some employment, the multiple-job-holding rate was 18.7 percent. Table B-3 summarizes the incidence of secondary work by worker category. The figures in the second column indicate that the incidence of secondary work is much higher among those coded as employees and—at between 37 and 38 percent—especially high among those that are miscoded as employees; and considerably higher than those whose main job is reported to be in self-employment activities. Among those who are self-employed,
___________________
4 Self-employment “means working for yourself, freelancing, or doing contract work, OR working for your own or your family’s business. Self-employment also includes fishing, doing farm work, or raising livestock for either your own or your family’s ranch.”
TABLE B-3 Incidence of Secondary Work by Type of Work Arrangement and Main Job Among Those in Indicated Main Job, Percentage with Secondary Employment Arrangement
| Percentage of All Respondents by Main Job | Any Secondary Work | Work for Employer | Self-employed | Other, Informal Work | |
|---|---|---|---|---|---|
| Employee, not miscoded | 50.77 | 19.81 | 6.94 | 12.91 | 2.14 |
| Miscoded employee | 4.43 | 37.80 | 21.71 | 18.85 | 5.92 |
| Self-employed, not IC | 5.34 | 7.65 | 3.76 | n/a | 4.94 |
| Self-employed, IC | 5.35 | 10.51 | 3.17 | n/a | 8.59 |
| Informal work only | 0.71 | n/a | n/a | n/a | n/a |
SOURCE: Houseman presentation.
secondary work is somewhat higher for independent contractors than it is for those who are not independent contractors.
The third part of the module discussed by Houseman explored contract company work. Here, respondents who reported being employed by an employer were randomly assigned to one of two sets of questions, as follows:
- (Version 1): “In the last 7 days, did your employer contract you or your services out? On this job, are you usually assigned to more than one client or customer? Do you usually work at the client’s or customer’s worksite?”
- (Version 2): “In the last 7 days, were you doing work for a business or organization that was different from the business or organization that paid you?”
The first version, while not identical to what was asked in the 2017 CWS, is very close to it. The second version attempts to get at respondents’ understanding of what it means to have their services contracted out—specifically whether the business where they are working is the same as the business that pays them.
The key finding here was that, using the narrow (version 1) definition similar to that used in the CWS, the percentage of contract company workers was estimated to be 2.0 percent. For version 2, the percentage was 1.4 percent, a statistically significant difference. The estimate based on the May 2017 CWS was 0.7 percent, but that only reflected respondents’ main wage and salary job. The incidence was higher among those saying they were “employed by an employer” but also (with further probing) reported
not being employees (possibly independent contractors); they had a higher incidence of also reporting being contracted out by their employer. Using the above definition, 4.4 percent of these respondents were miscoded, versus 1.5 percent of the others.
The final task of the Gallup module was to try to capture online intermediary work. As in the case of the CWS, the authors found evidence of substantial respondent confusion regarding this question. All respondents were randomly assigned to one of two question versions:
- (Version 1): “For any of the work you did in the past seven days, did you connect directly with new customers or clients through a mobile app or online platform?”
- (Version 2): (Repeats above question and adds examples): “For example, you might have given rides to people using a ridesharing app; used an app to find people looking for cleaning, delivery or handyman services; or used an online platform where people can bid on data entry or other tasks.”
Findings from the first two waves of the module indicated that adding the examples led to significantly lower measured incidence or reported online intermediary work. Examples appear to help individuals better understand the question and not misclassify work as mediated by a mobile app or online platform when it was not. Both versions of the question, however, yielded higher estimates than Houseman and colleagues expected.
For waves 3 and 4 of the survey, those who responded “yes” to either question version were also asked, “Did the customers pay you directly, or did they pay the mobile app or online platform which then pays you?” Houseman reported that unpacking content in this way reduced the measured incidence of online intermediary work by more than half, to about 3 percent. This finding is consistent with the hypothesis that the CWS questions are getting at a complex concept and that breaking out this information across questions would be helpful.
Houseman offered some preliminary conclusions. First, she cautioned against interpreting the levels of employee miscoding and multiple job holding as representative of the population, since the Gallup sample is weighted to be representative of the population based on observable characteristics. Many people may differ in unobserved ways that affect responses. Second, the findings from this research illustrate the potential of question wording to affect responses and support certain concerns about household surveys like CPS and CWS. Specifically, individuals working in contract arrangements may be miscoded as employees; surveys may miss some work activity, especially secondary jobs; measuring online intermediated work is difficult; and there is substantial confusion over payments coordinated by
intermediaries. However, according to Houseman, there is no evidence that the wording of questions in the CWS to identify independent contractors and contract company workers results in lower estimates of incidence than would the alternative wording, which was studied.
B.5. ADMINISTRATIVE DATA ALTERNATIVES/COMPLEMENTS TO SURVEY DATA
Building on the presentation by Diana Farrell about commercial banking data during meeting #1, this session explored what can be learned from nonsurvey data sources, on their own or in combination with surveys. Dmitri Koustas, University of Chicago, led off the session, presenting his research exploring what can be learned about alternative work arrangements from tax data. He also commented on his analyses, using personal financial service data, of the income, spending, and liquid assets of rideshare drivers. In considering the size and scope of the gig economy, Koustas is concerned not only with the jobs mediated through online platforms but also with how their emergence affects more traditional forms of alternative work arrangements. Specifically, there are clear implications for workers, since in the United States many social programs are administered through employers and many legal protections apply exclusively to traditional employees.
Koustas’ presentation focused on two different datasets that he and his coauthors have used in their research: financial accounts data capturing microtransactions and IRS information derived from returns, including individual tax returns. The financial accounts data derive from a financial aggregator and bill-paying application for smartphones and computers. The dataset used by Koustas and colleagues includes comprehensive coverage across financial providers for over 2.1 million workers covering the period 2012 to 2016, a time frame characterized by growth in the online platform economy. The researchers had access to anonymized data tracking microtransactions from linked credit cards and bank accounts that accrued through workers’ use of the app.
While there are concerns with datasets like these—for example, regarding the representativeness of people who use the app (for example, they might be more financially sophisticated than others, on average)—there are also distinct advantages. One important feature identified by Koustas is the administrative-level quality for measures of income, spending, and liquid assets all linked in one place. Also, the data are high-frequency, posting transactions daily. For measuring gig income, the microdata reveal transactions associated with major online platforms. Using these detailed personal financial app data allowed Koustas and his coauthors, for example, to determine that growth in the number of active Uber drivers, as reported by
Hall and Krueger (2018), tracked growth in gig work financial transactions very closely over the study period.
Next, Koustas discussed insights gleaned from his research5 using IRS tax records. The IRS records capture payments made by firms to unincorporated individuals for nonemployee services. Nonemployee compensation is reported on 1099-Miscellaneous forms, which allows the universe of firm-facing independent contractor relationships to be examined. Similar to the method using the microtransactions data from financial accounts, online platform firm names can be identified with the tax information.
Using the IRS data on business filings, it is possible to link to information about firms—e.g., industry and business expenses in broad categories such as legal/professional services and contract labor—that are issuing the 1099. On the individual tax side, 1040 returns capture information about the type of self-employment work people are doing. For workers who file a Schedule C, there is a self-reported industry, a description of business activity, and information on expenses. From W-2 forms, a panel of other work that people are doing can be constructed. Retirement and health benefits can be added using information from 5500 or 1095 forms.
By linking these data sources, Koustas and colleagues have produced several findings. One is that, for the tax workforce—defined as people who get a W-2 and file a form 1040 or a form 1099, or get a W-2 and don’t file—expansion of 1099 work in recent years has been driven almost exclusively by work in the online platform economy. A second finding is that most 1099 work and almost all online platform work supplement primary W-2 jobs. In other words, most people receiving a Form 1099 receive the majority of their earnings from wages, not from their independent contracting. They find much less growth in 1099 work among people who are primarily self-employed.
A third finding from Koustas and colleagues’ work is that the geography of the more traditional 1099 work and the online platform economy differs. The top five urban areas, measured as the percentage of the workforce engaged in online platform economy work, are San Francisco/Oakland CA (2.9%), Miami, FL (2.7%), Las Vegas, NV (2.6%), Washington, DC (2.5%), and Los Angeles, CA (2.5%). Because tax data are comprehensive, they pick up some geographic areas that do not show up in commercial data sources—for example, because the commercial entity such as a bank does not have a presence in that area—which are not necessarily representative of the broader population.
A fourth finding is that much of the online platform economy is missing from self-employment filings. Roughly 40 percent of people receiving
___________________
5 Joint research with Andrew Garin at the University of Illinois, Urbana-Champaign, Emilie Jackson at Stanford University, and two IRS partners, Brett Collins and Mark Payne.
a 1099 from an online platform did not file a Schedule C or Schedule SE, which is how self-employment filing in the tax data has been traditionally thought of. A final finding discussed by Koustas concerns the relationship between the 1099 independent contracting and self-employment filing in the tax data more broadly. Independent contracting is a subset of self-employment. Nearly all of the growth in self-employment has been coming from people without 1099s.
Koustas also addressed limits in the accuracy of tax data—specifically, that the reliability of those data depends on consistent reporting, which is not always the case. Of particular concern is that the typical reporting threshold for 1099-K companies is $20,000 and 200 transactions, compared with $600 for the 1099-MISC firms. Until 2016, some gig companies voluntarily reported at $1 of earnings. However, some of the largest gig companies have publicly announced they will increase their reporting thresholds, which would reduce the value for measurement of the resulting tax data. Policy can fix this problem. A current proposal, H.R. 594, would eliminate or lower the $20K threshold for the 1099-K filing (but increase the 1099-MISC threshold to $1,500). Some states (Massachusetts and Vermont) already require reporting at the $600 threshold, although they do not share these data with the IRS.
Mike Udell and Diane Lim, from the District Economics Group, continued the discussion of the role of tax data in measuring alternative work arrangements. They identified advantages and limitations of using tax data to measure various categories of alternative employment, including the size and scope of the platform economy, as well as the data’s potential to inform tax policy. Udell built on Koustas’ discussion of tax code deficiencies in regard to 1099-K workers, clarifying that his comments were about taxable income, not all income. Udell discussed workers who provide labor as contractors and the kind of tax information reporting that occurs in conjunction with those payments.
Information in tax systems serves several important purposes, in Udell’s view. It informs taxpayers about amounts of income earned, gross proceeds, and situations qualifying for special tax treatment. Having such information speeds up the ability of tax administrators to verify the accuracy of a tax return, and ideally it also supports policy making in areas ranging from unemployment and Social Security to student loans.
In an income tax system, liability is determined by income—e.g., wages, interest income, dividend income, and state and local income tax refunds—subject to tax less allowable deductions. If these were the only categories of income, tax returns would not be needed, because the tax administration has information on these sources and can precisely determine liability. But, Udell pointed out, some income is not fully subject to tax and requires additional time and cost on the part of individuals and tax administrators
to ascertain the taxable portion. One major example is Social Security income. Even though some recipients receive a 1099-SSA form, it does not tell the tax administrator what the taxable amount of that income is; other information is required for that determination. The same is true with pensions and annuities.
Another example where additional information is needed to determine tax liability is reporting about gross proceeds from the sale of goods and services. Gross proceeds, as Udell explained, are not subject to tax. Rather, it is income that is taxed, and income is equal to gross proceeds minus the cost of goods sold minus general, sales, and administrative costs.
As Udell framed the issue, one might wonder what this has to do with contingent and other alternative work arrangements. In the federal tax reporting system for, say, a platform worker such as an Uber driver, gross proceeds are documented using a form 1099-K. But, again, gross proceeds are not income. In almost all cases, taxpayers self-identify the cost of goods sold. This is why the largest part of the tax gap has to do with self-employed sole proprietors. It is not only because of unreported income, but because these workers control what the cost of goods sold is.
The measurement problem with the 1099-K arises when the cost of goods sold is larger than the gross proceeds received. Sometimes this is legitimate, but other times it is not, and when it is not, Udell emphasized, that turns out to be a big problem in the tax system. According to rules contained in section 6050W of the Internal Revenue Code, payments in any amount made to a business by a customer using a payment card, such as a VISA, MC, AMEX, or Diners Club card, are reported to the business (and to the tax administrator) at the end of the year by the payment card company. However—as pointed out by Koustas earlier—only payments made to persons providing goods and/or services on a third-party payment network in amounts greater than $20,000 and with more than 200 transactions during a year are reported to the seller by the payment network provider, such as Uber, Lyft, Airbnb, Etsy, and eBay.
When the 6050W legislation was drafted, third-party payment networks for service providers were not yet in existence (some, notably eBay, were providing goods). For a period prior to 2016, there was sufficient legal confusion whether the $20,000 threshold applied to services on third-party payment networks that some companies did file the form 1099-K on all of their service providers; however, others did not. After 2016, and as the result of a private letter ruling to a third-party payment network that provided only services, few if any networks are providing gross proceeds reports for service providers with sales less than $20,000 and 200 transactions per year. The development of section 6050W did not anticipate labor services being provided on third-party payment networks. (Nevertheless, the iPhone had come out in July of 2008, which is when
the app store turned on and therefore the moment when platforms began to be created.)
Udell expressed the view that, without new legislation, third-party payment networks will continue to use the threshold of $20,000 in gross proceeds and 200 transactions. In turn, this will result in very little information being reporting through the federal income tax to the great majority of individuals providing goods or services on these platforms. Udell went on to suggest two approaches for improving this tax reporting situation. First, while the 1099-K data are limited in their capacity to help researchers identify platform workers, corporate income tax returns of the companies may be more promising, since they do not miss the opportunity to deduct the payments made to the service providers. Buried in the details of a corporate income tax return is a dollar amount showing the size of the payments, although this is still gross proceeds, not income. The corporate income tax returns could be used to view top-level gross proceeds in an industry and provide some measure of total economic activity.
Another measurement option would exploit state and local sales tax information. Udell noted that a few states—Pennsylvania is one—are using a facilitator tax, which requires companies to report how much activity takes place inside their state. So, for example, the state taxing agency would ask a company like eBay the amount of their sales of goods that were delivered into Pennsylvania. Instead of taxing the seller, the state then taxes the facilitator, which has led to an increase in the state’s sales tax receipts. If more states follow through in a similar fashion, information on these facilitator taxes could potentially provide an effective way to measure the sale of both services and goods (although perhaps mostly goods) being transacted on platforms. States could also implement a tax on services provided over platforms as well, and then use the same approach.
During open discussion of the session on administrative data, Abraham asked Udell whether there could be modifications to the tax code to gain insights into how alternative work activities fit into people’s work lives. For that purpose, data on whether people have this type of income would be needed, not just covering aggregates but on a person-by-person basis. Udell suggested that replacing the threshold of $20,000 and 200 transactions with one set at $1,000 or $2,000 in gross proceeds would largely solve the issue. However, doing this would raise the problem of eBay sellers—1099-Ks being issued to people selling out of their attic—and that would undermine administrative record-matching programs. Separating goods and services in the 1099-K could address this problem.
The final presentation of the day, by Jim Spletzer (Center for Economic Studies, U.S. Census Bureau), was on work by the Census Bureau combining data sources. Spletzer addressed three topics: (1) The possibility of linking CPS microdata, specifically the CPS contingent worker supplement
microdata, to administrative data—specifically tax data—housed at the Census Bureau; (2) how this kind of data linkage is done; and (3) what can be learned using this approach.
Regarding the first topic, Spletzer reported that, as demonstrated through several projects,6 person records in the CPS can be linked to their information in administrative data. He then discussed three reasons for linking CPS and administrative data: (1) to understand differences in the measurement of various concepts—income is an example—between administrative records and household survey data (including those created by measurement error and nonresponse bias); (2) to improve imputations; and (3) to reduce respondent burden.
After walking workshop participants through the technique whereby the Census Bureau links records using a protected identification key (PIK)—a confidentiality-protected version of the Social Security number—Spletzer discussed the CWS. His understanding is that respondents who answer the May 2017 CWS and who also participate in CPS ASEC will be assigned a PIK. Spletzer said his own informal calculations suggest that based on this rule, perhaps 60 to 70 percent of the records in the May 2017 CWS should be linkable to administrative data housed at the Census Bureau, such as unemployment insurance (UI) wage records, Social Security Administration Detailed Earnings records, and nonemployer records.
Next, Spletzer provided a summary of what has been learned from previous exercises matching CPS microdata to administrative data. Abraham et al. (2013), for example, were able to compare employment status and multiple job holdings in the CPS with those estimated from UI wage records. Their findings included that 6.4 percent of UI employed—people who have a wage record—did not report being employed in the CPS; meanwhile, 17.6 percent of the CPS employed are not employed according to the UI wage records. Likewise, close to 70 percent of multiple job holders in the UI records show up as single-job holders in the CPS, while almost 45 percent of multiple job holders in the CPS appear as single-job holders in the UI records. Since the authors went to great pains to examine the same types of workers—e.g., those in nonfederal government and non-agriculture sectors—Spletzer admitted that he found it disconcerting to see such differences.
In another research project, Abraham et al. (2020) sought to understand why self-employment levels and trends in administrative data are higher than those revealed by household surveys. As reproduced in Figure B-2,
___________________
6 For example, monthly CPS to UI wage records are linked in Abraham et al. (2013). CPS ASEC records are linked to SSA’s Detailed Earnings Records (DER) in Abraham et al. (2018) and in Bollinger et al. (2019). CPS ASEC records are linked to nonemployer records (sourced from IRS Schedule Cs) in Abraham et al. (2020).
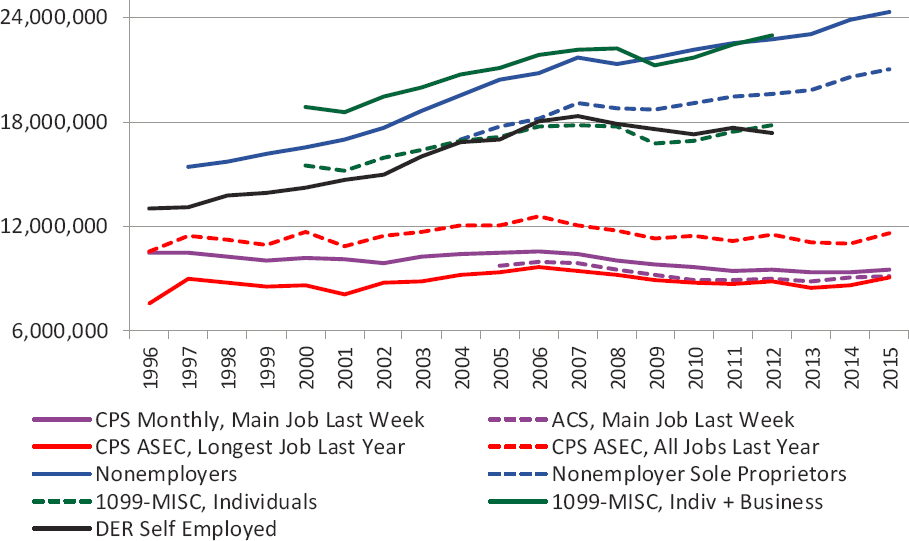
SOURCE: Analysis by K. Abraham, J. Haltiwanger, J. Spletzer, and K. Sandusky, based on data from U.S. Census Bureau, U.S. Department of the Treasury, CPS data, BLS website, and CPSASEC.
levels of unincorporated self-employed varied substantially by source. The bottom four lines are based on data from household surveys: the Monthly CPS, the Census Bureau’s American Community Survey, and the Annual Social and Economic Supplement of the CPS (often referred to as the March supplement). The top five lines capture administrative sources: Social Security’s detailed earnings records, the 1099-MISC, and the Schedule SEs from the SSA. Each administrative data source indicates that the number of unincorporated self-employed is rising over time and substantially higher than the number of unincorporated self-employed measured in household surveys.
The paper examines what is driving this difference by source in measured self-employment by linking the CPC ASEC to the SSA’s detailed earnings records. An attractive feature of this approach is that the CPS ASEC and the administrative tax data sources have the same annual reference frame. Spletzer also acknowledged minor differences, such as that self-employment is only reported on Schedule SE if earnings exceed $433. Again, findings based on administrative tax data were very different from those based on the CPS-ASEC. More than 50 percent of the CPS-ASEC respondents who identified as self-employed are not self-employed based on reporting to tax authorities. Conversely, 65 percent reporting to the tax authorities as self-employed are not showing up as self-employed in the CPS-ASEC—and that figure has increased over time.
Spletzer concluded with a few summary statements. He said research conducted at the Census Bureau that links CPS and administrative microdata has found that CPS-based and administrative data-based employment measures (such as wage and salary employment, multiple job holding, and self-employment) do differ, and some of these differences have grown over time. Spletzer asked why we would want to link the CWS to administrative data—is it to better understand measurement error or nonresponse bias, to improve imputations, or to reduce burden? In Spletzer’s view, research would need to overcome comparability issues, such as the use of different reference periods (e.g., “last week” versus quarterly or annually) and the problems arising from different concepts, such as the fact that administrative data do not measure “contingent work” or “electronically mediated work.”
During open discussion, potential problems with survey instruments were raised. Lim pointed out that a lot of people responding to a survey (such as the CPS) in which the first question is about the respondent’s main job will then have trouble shifting to accurately report self-employment (1099-K) income. Spletzer pointed out that the ASEC is a long survey, and that most of the income and earnings questions are placed at the end, so that by the time respondents reach them survey fatigue may have kicked in. Abraham added that the monthly CPS, which asks people about their work “last week,” is very different from the CPS-ASEC, which asks them
about their earnings over the whole prior year; answering these questions involves very different cognitive processes.
Robles raised the issue of how self-employment is categorized and measured given how diversely it manifests itself. For example, Schedule F employees are often overlooked even though they are in many ways similar to Schedule C workers. Partnerships, she suggested, were also important to capture, especially since, based on IRS data, they appear to have recently proliferated. Spletzer responded that the Census Bureau does publish nonemployer statistics by the legal form of organization. Eighty-seven percent of non-employers, he reported, are unincorporated sole proprietors. This, he suggested, is why he focuses on that group and calls them self-employed, which is what the Census Bureau does in their own publications. There are 22 million of these unincorporated self-employed.
Strain added that, even if a respondent earns $10,000 or $20,000 of self-employment income and it amounts to perhaps 10 percent of total income, that person could reasonably respond he or she is not self-employed. This speaks to the issue of how to design the survey question.
Olson argued that the mismatch between the household survey data and the tax data is partially due to measurement error, in that people are not classifying things appropriately. She added that specifying the right probing questions would be helpful, but there is also a more fundamental issue about whether or not people see the work that they are doing, regardless of the source of payment, as being under the umbrella of what they consider to be their job. And this is very important when thinking about contingent and temporary work and understanding payment mechanisms that help survey designers write better questions. An example would be a university professor being paid her university salary for the year, but receiving a grant covering 3 of those months. In such a case one could reasonably say that she was paid by, say, the National Science Foundation or the National Institutes of Health, even though all the grant money was paid to her through the university. Even a reasonably informed person could become confused about that kind of question.
Panel on Measuring Contingent Work and Alternative Work Arrangements
Second Meeting—June 10, 2019
The National Academy of Sciences Building
The Board Room/Room 120
2100 Constitution Ave. NW
Washington, DC 20418
AGENDA
MEETING GOALS: During its first meeting, the panel heard from BLS experts about the history, measurement objectives, and past performance of the Contingent Worker Supplement (CWS) of the Current Population Survey (CPS). Working with BLS, the panel also sharpened the statement of task for the project. During this second meeting, the panel will continue information gathering by hearing presentations from data users and policy makers dealing with changing worker and employer dynamics. Sessions will include presentations and discussion of measurement objectives and policy needs, the measurement capabilities of household and other kinds of surveys, and the complementary (or possibly, in some cases, substitute) role of nonsurvey data such as administrative (e.g., tax) or commercial data.
OPEN PUBLIC SESSION
| 9:00 AM | Welcome, Introductions, Agenda, and Reminder of the Study Charge |
|
— Susan Houseman, Panel Chair |
|
| 9:15 | SESSION 1: POLICY CONTEXT FOR MEASURING ALTERNATIVE WORK. This session features presentations to help the panel round out its thinking about measurement objectives. Presenters will offer perspectives on (1) what information policy makers need to know and what questions remain unanswered (for example, how many people engage in supplemental work and what their motivations are), and (2) methodological and other considerations that allow data to be translated into policy. Definitions and boundaries for different categories of work—contingent, independent (many of whom do not consider themselves as “contingent” or temporary), web-mediated, etc.—will be discussed. |
| Legislative developments relating to alternative work. U.S. Senator Mark Warner is honorary co-chair of the Aspen Institute “Future of Work Initiative,” and his office has been active on issues pertaining to gig work. Carolina Young will update the panel on her work in Senator Warner’s office on relevant initiatives—such as proposed legislation that would direct the U.S. Treasury to study tax issues for gig economy workers—and the kinds of data needed to inform this work. | |
|
— Carolina F. Young, Policy Advisor, Office of U.S. Senator Mark R. Warner |
|
| Update on Future of Work Initiative projects and plans. The Aspen Institute’s Future of Work Initiative seeks to identify policy solutions to the challenges facing workers in the 21st century. The Initiative, along with Cornell’s ILR School, produced and maintains the Gig Economy Data Hub, an online resource that provides accessible summaries of data sources on independent and nontraditional work. Recently, the team has written on portable benefits, tax simplification for independent workers, and worker training tax credits. The Institute has recently released the report, “Designing Portable Benefits: A Resource Guide for Policymakers.” | |
|
— Alastair Fitzpayne, Executive Director of the Aspen Institute Future of Work Initiative; Shelly Steward, Research Manager, Future of Work Initiative |
|
| Open discussion | |
| 10:30 | SESSION 1 (continued) |
| Worker well-being measurement issues. Unpredictable work schedules, particularly for low-income/low-skill workers, affect the well-being and security of those involved. Susan will discuss measurement challenges and needs for informing public policy around work hour standards and the benefits of a multidimensional approach to estimating the prevalence of different types of work hour arrangements. | |
|
— Susan Lambert, University of Chicago, School of Social Service Administration |
|
| Health and safety. The National Institute for Occupational Safety and Health is a federal research agency that has made work arrangements a key focus of its recently established program on Healthy Work Design and Well-Being. Tim will describe this program and its recent attempts to define those work arrangements of greatest concern. He will also discuss the value of CWS data for NIOSH research, and suggest some ways in which expanded details on work arrangements could be of value. |
|
— Tim Bushnell, Economic Research and Support Office, NIOSH; Toni Alterman, Division of Surveillance, Hazard Evaluations and Field Studies, NIOSH |
|
| Employer and broader market policy issues. The new economy requires polices designed to make new employment models work well not just for employees, but also employers who hire them and for the markets in which they operate. Gene will speak about his organization’s work on policy issues shaping the independent workforce movement, as well as about how to think about different categories of workers. | |
|
— Gene Zaino, Chief Executive of MBO Partners |
|
| Open discussion | |
| 1:15 PM | SESSION 2: INSIGHTS ABOUT ALTERNATIVE WORK FROM OTHER (NON-BLS) SURVEYS. Building on what was learned during meeting #1, this session includes presentations to help assess the range of questions that can best be answered using household surveys, and which questions require other kinds of data (whether stand-alone or linked to survey data), such as those derived from employer surveys, tax records, and commercial sources. |
| Federal Reserve Board surveys. Barbara will review results for 2018 from the Survey of Household Economics and Decisionmaking (SHED) and provide information about the survey’s questions. She may also comment on findings from the Enterprising and Informal Work Activities (EIWA) Survey, which estimates that a high percentage of workers (36 percent in 2015) take part in freelance work. | |
|
— Barbara Robles, Panel member |
|
| Survey and policy work at the American Staffing Association. The ASA Staffing Employment and Sales Survey generates insights about intermediary employment arrangements. The survey collects information from staffing firms to estimate temporary and contract staffing industry employment, sales, and payroll. Cynthia and Steve will describe the survey’s general methodology, how employment and payroll information differs from that generated from the CWS, what research is done using the survey, and what policy questions it helps to address. |
|
— Cynthia Davidson and Steve Berchem, American Staffing Association |
|
| Urban-rural variation in informal work activities. Leif will describe the background, methods, and findings of his collaborative research using a survey measuring geographic variation in informal work. He will address definitional questions about the types of informal work including unpaid and paid (off the books) work, the measurement strategy used to capture informal work, as well as (briefly) their findings on the prevalence of, reasons for, returns to, and correlates of informal work. | |
|
— Leif Jensen, Penn State University |
|
| Gallup Education Consumer Pulse Survey. Susan and Katharine will provide an update on their work developing a survey module for this Gallup survey consisting of 13 questions on respondents’ employment and the nature of their work arrangements. Goals of this work include assessing how well household surveys capture various types of contract and informal work and informing ways in which household surveys might be improved to better measure these types of work. Data collection is now complete, as is some initial analysis. | |
|
— Susan Houseman and Katharine Abraham, Panel members |
|
| Open discussion | |
| 3:15 | SESSION 3: ADMINISTRATIVE (TAX)DATAALTERNATIVES/COMPLEMENTS TO SURVEY DATA. Building on the presentation by Diana Farrell on the use of commercial banking data during meeting #1, this session will further explore what can be learned from non-survey data sources, on their own or in combination with surveys, about alternative employment. The focus here will be on administrative data (as opposed to commercial data), specifically the benefits and limitations of using tax data. |
| What can be learned about alternative work arrangements from tax data? (1). Dmitri may also comment on his analyses of rideshare drivers using personal financial service data containing information on rideshare income, outside income, spending, and liquid assets. |
|
— Dmitri Koustas, University of Chicago |
|
| What can be learned about alternative work arrangements from tax data? (2). Mike and Diane will discuss the advantages and limitation of using tax data to measure various categories of alternative employment (including the size and scope of the platform economy), and how it can be used to inform tax policy. | |
|
— Mike Udell and Diane Lim, District Economics Group |
|
| Census Bureau work combining data sources. Federal Research Data Centers (coupled with legislation) have allowed agencies and outside researchers to combine IRS data with existing Census surveys. Jim will discuss linking survey and tax data (in the context of LEHD or other programs) for the purpose of measuring independent contractor/self-employment work, and any implications that this might have for optimal design of the Contingent Worker Supplement. | |
|
— Jim Spletzer, Center for Economic Studies, U.S. Census Bureau |
|
| Open discussion | |
| 4:45 PM | ADJOURN |
This page intentionally left blank.


