National Academies Press: OpenBook

Review of the New York City Watershed Protection Program (2020)

Chapter: Appendix A: Technical Appendix on Trend Analysis

« Previous: Acronyms
Suggested Citation:"Appendix A: Technical Appendix on Trend Analysis." National Academies of Sciences, Engineering, and Medicine. 2020. Review of the New York City Watershed Protection Program. Washington, DC: The National Academies Press. doi: 10.17226/25851.
×

Appendix A

Technical Appendix on Trend Analysis

The following approach was used to evaluate trends in Chapter 5. For each site with two or more years of soil sample data the Kendall S (Kendall, 1975) statistic was computed. S is the number of data pairs showing an upward trend in soil test phosphorus minus the number showing a downward trend. The variance of the S statistic VarS was computed using the correction for tied values (Kendall, 1975). Also, for any given field, all pairwise slopes between soil test phosphorus values are computed. These are actually computed on the natural logarithm of the soil test phosphorus value. The Regional Kendall test (Helsel and Frans, 2006) results are identical for slopes computed with the actual data versus slopes computed with the logarithms. This test is repeated for all fields being considered in the test (this is 3,529 fields for the test of the full data set but is a smaller number for some of the subsets shown in Table 5-2).

The overall Regional Kendall test is computed as follows:

Image

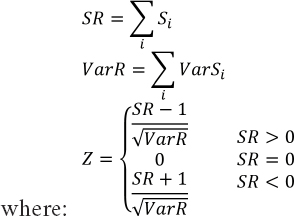
Si is the Kendall S statistic for the ith field

VarSi is the variance of Si

Then the attained significance level for the test is determined by comparing to a standard normal distribution.

For the computation of trend slopes the analysis is conducted on the natural logs of the soil test phosphorus data. In most applications of the Mann-Kendall test or Regional Kendall test the slope estimate is typically calculated using the Theil-Sen slope estimator which is the median of all pairwise trend slopes computed in accordance with the calculation of the Kendall S statistic. However, in the case of this data set, that estimate is not informative because there is such a large number of tied soil test phosphorus values that the median of these is typically zero. As an alternative, the trend slopes are computed here as the mean of all pairwise trend slopes of the log of soil test phosphorus. These mean trend slopes are then transformed as follows.

Suggested Citation:"Appendix A: Technical Appendix on Trend Analysis." National Academies of Sciences, Engineering, and Medicine. 2020. Review of the New York City Watershed Protection Program. Washington, DC: The National Academies Press. doi: 10.17226/25851.
×

If b is the estimated (mean) trend slope, in log concentration units per year, then the trend in percent per year (B) is computed as:

B = 100 ∙ (eb – 1)

Using this approach, one can compute the change over a period of n years (expressed as a ratio to the starting value) as:

en∙b

Thus, we can consider an example where the trend slope of the log values is b = –0.020 then the trend in percent is -1.98 percent/year, and the ratio of the value in the 10th year to the value in the starting year is 0.818 (a decline of 18 percent over the decade).

REFERENCES

Helsel, D. R., and L. M. Frans. 2006. Regional Kendall test for trend. Environmental Science and Technology 40(13):4066–4073.

Kendall, M. G. 1975. Rank Correlation Methods. London: Charles Griffin.

Suggested Citation:"Appendix A: Technical Appendix on Trend Analysis." National Academies of Sciences, Engineering, and Medicine. 2020. Review of the New York City Watershed Protection Program. Washington, DC: The National Academies Press. doi: 10.17226/25851.
×
Page 391
Suggested Citation:"Appendix A: Technical Appendix on Trend Analysis." National Academies of Sciences, Engineering, and Medicine. 2020. Review of the New York City Watershed Protection Program. Washington, DC: The National Academies Press. doi: 10.17226/25851.
×
Page 392
Next: Appendix B: Critique and Suggestions Regarding Current Water Quality Trend Reporting Approaches »
Review of the New York City Watershed Protection Program Get This Book
×
 Review of the New York City Watershed Protection Program
Buy Paperback | $95.00 Buy Ebook | $74.99
MyNAP members save 10% online.
Login or Register to save!
Download Free PDF

New York City's municipal water supply system provides about 1 billion gallons of drinking water a day to over 8.5 million people in New York City and about 1 million people living in nearby Westchester, Putnam, Ulster, and Orange counties. The combined water supply system includes 19 reservoirs and three controlled lakes with a total storage capacity of approximately 580 billion gallons. The city's Watershed Protection Program is intended to maintain and enhance the high quality of these surface water sources.

Review of the New York City Watershed Protection Program assesses the efficacy and future of New York City's watershed management activities. The report identifies program areas that may require future change or action, including continued efforts to address turbidity and responding to changes in reservoir water quality as a result of climate change.

READ FREE ONLINE

  1. ×

    Welcome to OpenBook!

    You're looking at OpenBook, NAP.edu's online reading room since 1999. Based on feedback from you, our users, we've made some improvements that make it easier than ever to read thousands of publications on our website.

    Do you want to take a quick tour of the OpenBook's features?

    No Thanks Take a Tour »
  2. ×

    Show this book's table of contents, where you can jump to any chapter by name.

    « Back Next »
  3. ×

    ...or use these buttons to go back to the previous chapter or skip to the next one.

    « Back Next »
  4. ×

    Jump up to the previous page or down to the next one. Also, you can type in a page number and press Enter to go directly to that page in the book.

    « Back Next »
  5. ×

    Switch between the Original Pages, where you can read the report as it appeared in print, and Text Pages for the web version, where you can highlight and search the text.

    « Back Next »
  6. ×

    To search the entire text of this book, type in your search term here and press Enter.

    « Back Next »
  7. ×

    Share a link to this book page on your preferred social network or via email.

    « Back Next »
  8. ×

    View our suggested citation for this chapter.

    « Back Next »
  9. ×

    Ready to take your reading offline? Click here to buy this book in print or download it as a free PDF, if available.

    « Back Next »
Stay Connected!