
3
New York City’s Water Supply System: Past, Present, and Future
New York City’s water supply system is unique and mostly quite robust. The system collects and transports surface water, by gravity, from 2,000 square miles of land in three upstate watersheds—the Delaware, the Catskill and the Croton watersheds—as far as 125 miles from New York City. Shown in Figure 3-1, the system has 19 reservoirs, three controlled lakes1, three large aqueducts, and numerous tunnels, siphons, and interconnecting and distribution structures with a total available storage capacity of roughly 580 billion gallons. Ninety percent of the supply, from the Catskill and Delaware portions of the system, is delivered without filtration and treated only by chemical and ultraviolet disinfection prior to distribution. The system supplies roughly 1.1 billion gallons per day (BGD) of drinking water to 8.5 million City residents, 1 million residents of neighboring upstate communities, and millions of commuters and tourists that visit New York City annually.
New York City has had the largest population of any city in the United States since the first census in 1790. Almost every subsequent census passed another demographic milestone as the city grew in increments of 100,000 at decadal intervals through the 1800s. When the Five Boroughs were combined in 1898, Greater New York instantly became the world’s second largest city (exceeded only by London with a population of 6.3 million). A total of 12 million immigrants arrived at Ellis Island in New York Harbor between 1892 and 1954; just over 1 million people arrived in 1907 alone. New York became the largest city in the world by 1925 and would remain so until it was surpassed by Tokyo in 1960. With a current population of 8.6 million, New York is still more than twice the size of the next largest U.S. city (Los Angeles, 4 million people). Throughout its history, New York City’s population growth has imposed extraordinary pressures on the city’s infrastructure.
DEVELOPMENT OF THE WATER SUPPLY
Prior to 1677, residents of Manhattan used private wells and rain cisterns for water supply. Around 1677, the first public well was constructed. In 1776, a reservoir was completed in lower Manhattan to serve a population of roughly 22,000; the water came from shallow wells and was distributed in hollowed logs. In 1799, the New York State legislature conferred authority to collect and distribute water in NYC to the Manhattan Company, a private firm. The population of Manhattan increased to 200,000 by 1830. Manhattan, surrounded by brackish water and with a shallow water table, could not provide residents with sufficient water to protect public health and safety. Cholera epidemics, one of which took the lives of approximately 2,500 NYC residents in 1832, as well as catastrophic fire in 1835 that destroyed ~700 buildings and killed two people in a 17-block area, plagued the City, demonstrating a need for a more robust water supply. In 1834, the state legislature granted NYC authority to develop water supplies outside of its boundaries. Table 3-1 is a timeline of population information and significant events, highlighting developments that have shaped the water supply system.
___________________
1 The term “controlled lake” refers to three small auxiliary reservoirs within the Croton watershed: Lake Gleneida and Lake Gilead in the hamlet of Carmel, and Kirk Lake in the hamlet of Mahopac. Each has a dam and spillway controlling its outflow. “Controlled” further applies to controlled access and controlled use, to protect the drinking water supply.
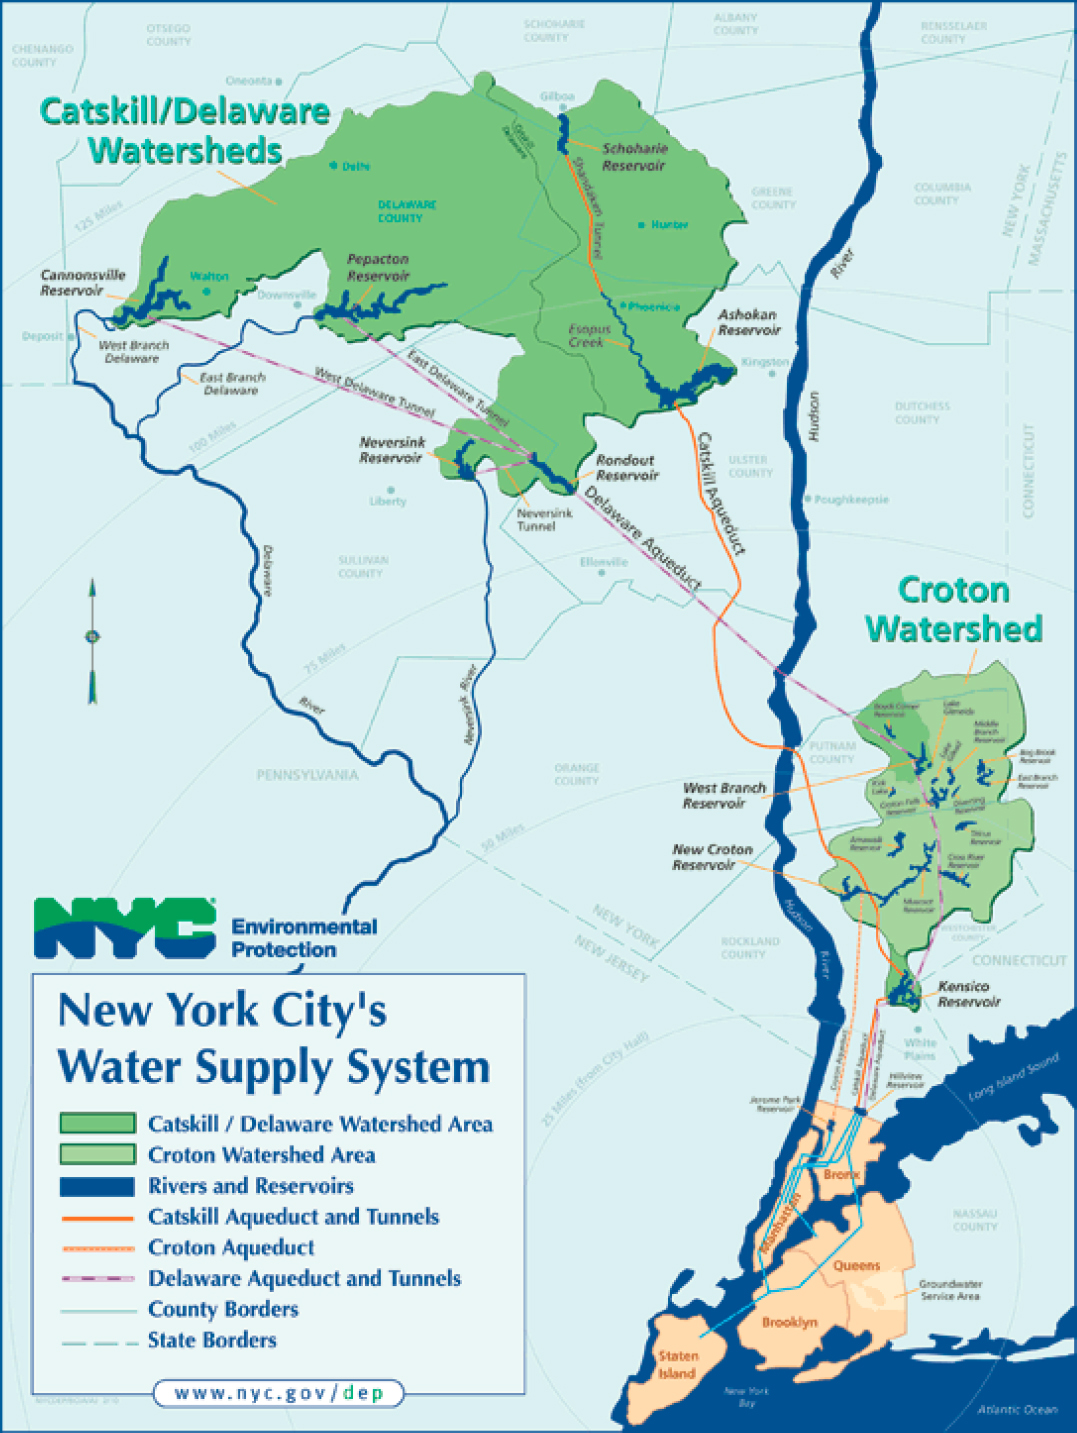
TABLE 3-1 Water System Construction Time Line, Population of NYC, and Related Events
| Population | Year | Event |
|---|---|---|
| 1677 | The first public well is dug in front of the old fort at Bowling Green. | |
| 22,000 | 1776 | A reservoir is constructed in Manhattan; water is distributed through hollow logs. |
| 60,000 | 1800 | The Manhattan Company collects and distributes water to part of the community. |
| 200,000 | 1830 | A tank for fire protection was constructed by the City. |
| 1832 | Cholera epidemic strikes NYC and other cities in the United States. | |
| 1835 | Great fire burns much of NYC. | |
| >312,710 | 1842 | First Croton Aqueduct put into service, transporting ~ 90 MGD from Croton Reservoir. |
| >813,669 | 1862 | Central Park distribution facility is placed into service. |
| 1866 | New York State Metropolitan Health Act. | |
| 1873 | Boyds Corners Reservoir is constructed in Putnam County. | |
| 1875 | Ridgewood distribution facility (Basin No. 3) is placed into service. | |
| 1 Million | 1878 | Middle Branch Reservoir is built in Putnam County. |
| 1883 | Aqueduct Commission is formed to build second Croton aqueduct, additional reservoirs. | |
| 1.5 Million | 1890 | New Croton Aqueduct is placed in service while still under construction. |
| 1891-1897 | East Branch, Bog Brook, Titicus, West Branch, Amawalk reservoirs are placed in service. | |
| 1898 | Five boroughs are consolidated into “Greater New York City.” | |
| 3.5 Million | 1905 | State legislature allows creation of NYC Board of Water Supply, commences development of Catskill water supply; New Croton Reservoir, Muscoot Reservoir, and Jerome Park distribution facility are placed into service. |
| 1908 | Cross River Reservoir is placed into service. | |
| 4.6 Million | 1911 | New Croton River system is completed, ~10% of present NYC supply. Chlorine disinfection of delivered water begins. |
| 1915 | First components of the Catskill System are completed: Ashokan, Kensico, and Hillview reservoirs; Catskill Aqueduct; City Tunnel #1 put into service. | |
| 1924 | Shandaken Tunnel connecting Schoharie Reservoir to Ashokan completed. | |
| 1926 | Schoharie Reservoir is completed. | |
| 1927 | Board of Water Supply submits a plan for development of upper portion of the Rondout watershed and tributaries of the Delaware River within New York State. | |
| 1928 | Rondout Watershed/Delaware River tributaries plan is approved; work is delayed by action by New Jersey in the U.S. Supreme Court to enjoin the City, State of New York from using the waters of the Delaware River within New York State. | |
| 1928 | Shandaken Tunnel, which connects Schoharie to Esopus Creek, put into service. | |
| 1931 | U.S. Supreme Court upholds right of NYC to tap headwaters of the Delaware River. | |
| 7.5 Million | 1936 | Tunnel #2 from Hillview Reservoir to Brooklyn is completed. |
| 1937-1964 | Construction of the Delaware System: Delaware Aqueduct; Rondout, Neversink, Pepacton, and Cannonsville reservoirs, Neversink, East and West Delaware tunnels. | |
| 1953 | NYC BWS issues initial Watershed Rules and Regulations. | |
| 1961 | Delaware River Basin Compact is signed; U.S. Public Law 87-328. |
TABLE 3-1
| Population | Year | Event |
|---|---|---|
| 1966 | Chelsea Pumping Station reconstructed to serve in time of severe drought. | |
| 1970 | Richmond Tunnel is completed. | |
| 1971 | Silver Lake Reservoir, Staten Island is replaced with covered Silver Lake Tanks, the world’s largest underground storage tanks: 100,000,000 gallons. | |
| 1974 | Safe Drinking Water Act (SDWA) is enacted. | |
| 1986-2018 | SDWA Amendments passed (1986, 1996, 2005, 2011, 2015, 2016, 2018). | |
| 1989 | Surface Water Treatment Rule is promulgated. | |
| 1990 | Draft revisions of new Watershed Rules and Regulations published by NYC DEP. | |
| 1993 | First Filtration Avoidance Determination (FAD) is issued by EPA Region 2. | |
| 1997 | Memorandum of Agreement (MOA) is signed. | |
| 1998 | Tunnel #3 Stage 1 is put into service. | |
| 2002, 2007 | FADs are issued by EPA Region 2 and NYS Department of Health. | |
| 2012 | Catskill/Delaware UV facility, start-up and testing; design flow 2,400 MGD. | |
| 8.5 Million | 2015 | Croton Filter Plant is completed, capacity 290 MGD. |
| 2017 | FAD is issued by NYS Department of Health. |
SOURCES: Adapted from NRC (2000, Table 2-1); NASEM (2018, Table 1-2); https://archive.epa.gov/region02/water/nycshed/web/html/filtad.html; https://health.ny.gov/environmental/water/drinking/nycfad; and https://www1.nyc.gov/site/dep/about/filtration-avoidance-determination.page.
Croton System
In the 1830s, the area now occupied by the Croton system was rural, with small farms and villages typical of the period. Because of the pressing need for a dependable water supply, and the lopsided balance of power between New York City and isolated rural communities, the Croton system’s construction was the City’s first use of eminent domain, including condemnation of properties and relocation of residents. This was an extraordinary step in the young republic where few, if any, tests of the Fifth Amendment to the Bill of Rights (“… nor shall private property be taken for public use, without just compensation”) had occurred. The passage of time, rapid industrialization of the United States, upheaval caused by the Civil War, and more recently, rapid urban and suburban development of the area seems to have obscured the contentious origin of the Croton system. For New York City and its residents, the completion of the Croton system was a transformative occasion and unqualified success.
It was Colonel DeWitt Clinton, Jr., who proposed building an aqueduct to convey 20 million gallons per day (MGD) from the Croton River 40 miles south to the City. The elevation of the Croton River, 200 ft above sea level, would allow water to flow by gravity with enough pressure to serve the needs of taller buildings and firefighting. The Croton River was far enough from the City that it was presumed that the water was relatively pure. Given the urgency to public health and safety, the project attracted the interest of civic leaders and politicians in both city and state government. By the time the project was fully developed, City residents voted to approve public funds for the project in 1835; construction began in 1837.
The massive project included a masonry dam impounding a reservoir with a storage capacity of 600 million gallons, a 40-mile covered masonry aqueduct with a cross section of 7 by 8 feet, a “high bridge” to convey the aqueduct across the Harlem River into Manhattan, a 35-acre receiving reservoir located in what is now
part of Central Park, and a distributing reservoir on the present site of the New York Public Library at Fifth Avenue and 42nd Street. On July 4, 1842, 90 MGD of fresh water from the first Croton aqueduct flowed into Manhattan serving about 300,000 residents. To continue to meet the demand of a growing metropolitan area, the Boyds Corners Reservoir (1.6-billion-gallon (BG) capacity) and the Middle Branch Reservoir (4.0 BG), both in Putnam County approximately 55 miles from Manhattan, entered service in 1873 and 1878 respectively.
As immigration and industrialization continued to attract residents to Manhattan, the City expanded the Croton system. From 1891 through 1897, five additional reservoirs entered service (East Branch Reservoir, Bog Brook Reservoir, Titicus Reservoir, West Branch Reservoir, and Amawalk Reservoir) with a combined additional storage capacity of 31.6 BG, along with the New Croton Aqueduct in 1892, with a capacity of 290 MGD. In 1905, the New Croton Reservoir (19.0 BG) replaced the original Croton Reservoir, while the Muscoot Reservoir (4.9 BG), which receives flow from all Croton system reservoirs except the New Croton Reservoir, was completed. Muscoot flows into the New Croton Reservoir, from which water is diverted to the Jerome Park Reservoir in the Bronx (0.8 BG), also placed into service in 1905, for distribution.
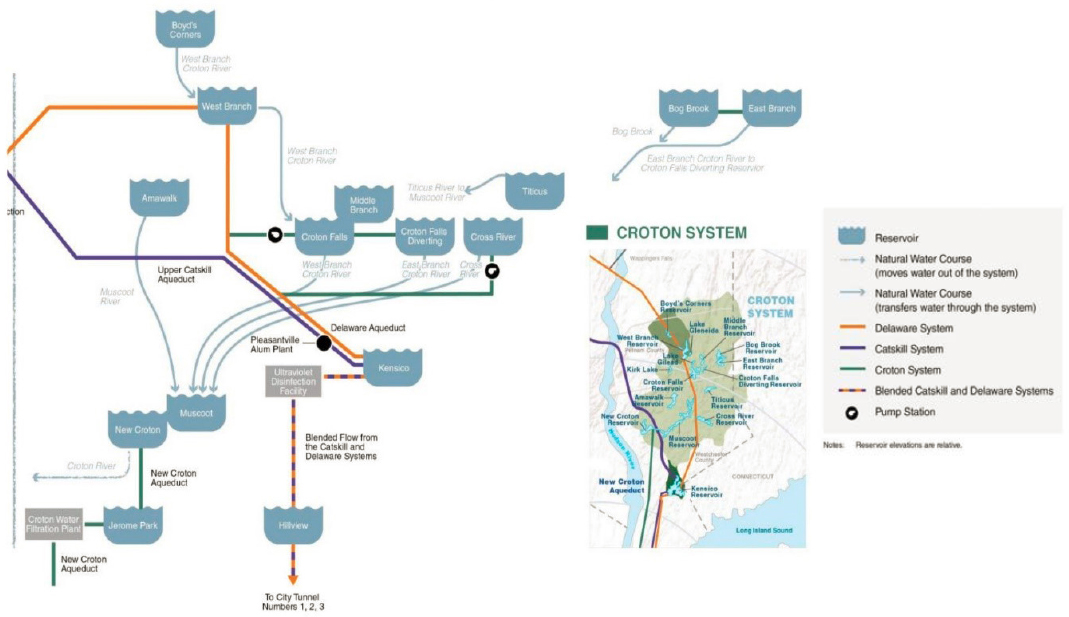
The complete Croton System is shown in Figure 3-2. With the construction of additional dams and the addition of chlorine disinfection, the Croton System was completed in 1911 and today provides roughly 10 percent of the City’s water supply.
Catskill System
New York City’s growth continued, now aided, ironically, by a plentiful and reliable water supply. As the population’s water demands came to exceed the dependable yield of the Croton system, it led to the question, Why not use the Hudson River? According to Engineer Albert Flinn in 1909, the Hudson River was rejected as a potential source for several reasons:
- The Hudson is a tidal estuary extending 150 miles north to the Troy Dam;
- If sufficient water to meet approximately one-half (~250 MGD in 1909) of New York City’s needs was withdrawn during extremely dry seasons, the salt front was expected to extend 10-15 miles north of Poughkeepsie;
- Large reservoirs would need to be built in the Adirondacks to store water during wet seasons to release water to augment the flow of the Hudson during dry periods;
- Untreated sewage was being discharged2 above any point along the Hudson where an intake could be located; and
- Water would need to be raised several hundred feet by powerful pumps to deliver it to New York City with sufficient pressure for the distribution system.
Consequently, it was concluded that it was more economical and prudent to take Hudson River water from some of the lower tributaries in the Catskill Mountains before it became contaminated, and at an elevation from which it could flow by gravity to the city. Flinn (1909) noted, with guarded optimism, that the Catskill System would “increase the safely available daily supply to two and a half times that now available, and provide bountifully for the city’s needs as far in the future as can be reasonably foreseen.” In the early-1900s, the scale, complexity, and cost of this massive public works project were exceeded only by the Panama Canal, the Suez Canal, and the (original) Aswan Dam in Egypt.
In 1905, the New York State legislature approved the Water Supply Act of 1905 and created the NYC Board of Water Supply (BWS), empowering the board to develop water supply facilities in the Catskills region. The Water Supply Act of 1905 also required the City to allow local communities to connect to the water supply infrastructure and required the City to allow boating and fishing on the water supply reservoirs. Concurrently, the State legislature passed the state Public Health Law of 1905, allowing the City to regulate land use in the upstate watershed to protect City drinking water and providing the City eminent domain to acquire land needed for the water supply. This legislation also authorized the State Department of Health (DOH) to promulgate rules and regulations to protect the City’s drinking water.
The City proceeded to acquire water rights, expanding into the Catskill Mountains. In the Catskill system, the reservoirs divert flow from streams and rivers that wholly reside in New York State. The Ashokan Reservoir (122.9 BG) in Ulster County, and the Catskill Aqueduct, the first components of the Catskill System, were completed in 1915. The Ashokan Reservoir operates with two basins, separated by a concrete weir and roadway. Most flow that enters the reservoir comes through the west basin prior to entering into the east basin. Both basins provide significant settling of particulate matter before delivering water to the Catskill Aqueduct. From the east basin, the Catskill Aqueduct diverts flow 92 miles from Ashokan, under the Hudson River, conveyed through an inverted siphon, to Kensico Reservoir in Westchester County (30.6 BG), also completed in 1915. From Kensico Reservoir, flow proceeds to Hillview Reservoir (0.9 BG) in Yonkers, New York, which has served as a balancing and distribution reservoir since 1915. City Tunnel #1, which conveys flow from Hillview Reservoir to the City, also began service in 1915.
The second of two Catskill System reservoirs, the Schoharie Reservoir (17.6 BG) entered service in 1926. The Schoharie Reservoir is at the intersection of Schoharie, Delaware, and Greene counties, roughly 110 miles from the City, and is the northern-most water supply for the City. Flow from the Schoharie Reservoir travels via the Shandaken Tunnel, placed into service in 1928, southeast 18 miles to Esopus Creek and then 12 addition-
___________________
2 This would not change until the passage and implementation of the Clean Water Act in the 1970s and 80s.
al miles in the Esopus Creek before entering the Ashokan Reservoir. Shandaken Tunnel is an interbasin diversion moving Schoharie Reservoir water into the Catskill system, which would otherwise flow north to the Mohawk River and into the Hudson River near Albany. The Catskill System, as completed in 1928, currently provides the City with roughly 40 percent of its water during normal, nondrought conditions. In 1936, the City completed Tunnel #2, which conveys flow from the Hillview Reservoir to Brooklyn.
Delaware System
Domestic and industrial water use in New York City was increasing so rapidly, that in 1920 Chief Engineer J. Waldo Smith, warned that consumption threatened to exceed the dependable yield of the Croton and Catskill system by the early-1930s (Galusha, 2016). Again confronted with a growing imbalance between supply and demand, another major expansion of the system was sought. BWS engineers assessed many possible sources within 200 miles of New York (e.g., wells in Long Island and prospective reservoir sites near and far), once again rejected the Hudson River, and in 1927 concluded that the two headwater branches of the Delaware River were the most promising option. In contrast to the Catskill system, the Delaware system would involve—geographically, politically, and legally—the adjacent states of New Jersey and Pennsylvania. Ultimately, this controversial interstate issue landed in the U.S. Supreme Court,3 which allowed NYC to divert up to 800 MGD, provided that 1,750 cubic feet per second (cfs) flow remains in the Delaware River as measured at Montague, New Jersey (Kolesar and Serio, 2011).
Work began on the Delaware system in 1937. It includes the Delaware Aqueduct, completed in 1944, which was then the world’s longest aqueduct at 105 miles and designed to convey up to 900 MGD. The four Delaware system reservoirs are Rondout (49.6 BG, 1950), Neversink (34.9 BG, 1954), Pepacton (140.2 BG, 1955), and Cannonsville (95.7 BG, 1964). Flow from Neversink Reservoir is conveyed through the Neversink Tunnel (1954) to Rondout Reservoir. The East Delaware Tunnel (1955) brings flow from Pepacton Reservoir, and the West Delaware Tunnel (1964) brings flow from Cannonsville Reservoir, with both tunnels flowing into Rondout Reservoir. Rondout Reservoir is a central collection for the 95-square mile watershed and directs flow into the Delaware Aqueduct.
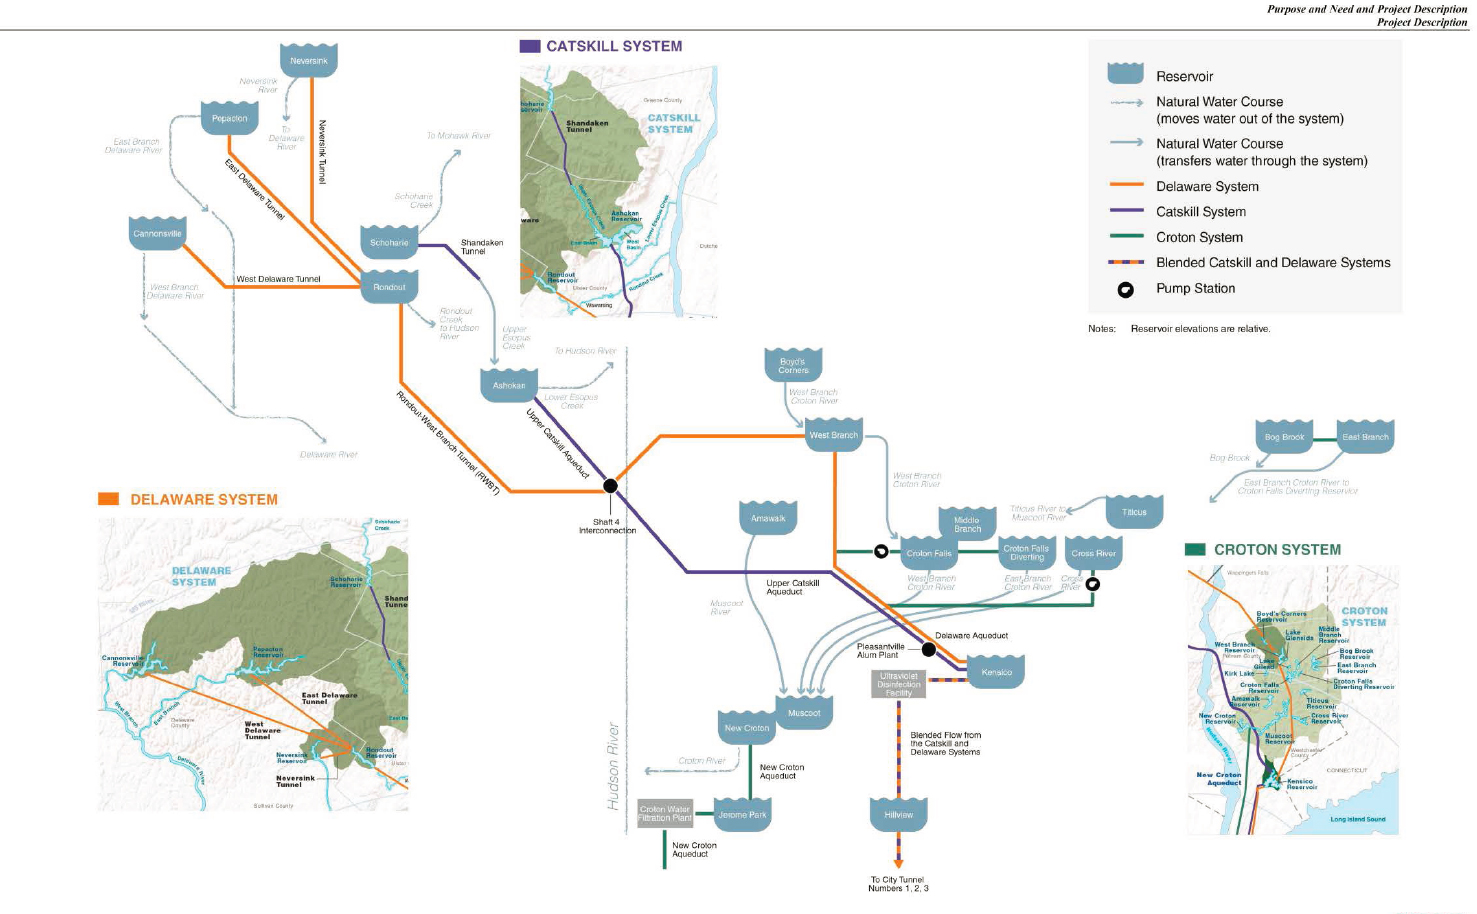
From Rondout Reservoir, the Delaware Aqueduct flows 85 miles under the Hudson River via a deep inverted siphon to the West Branch and Kensico reservoirs, where the flow is combined with water from the Catskill system. Figure 3-3 is a current schematic of the Croton, Catskill, and Delaware systems.
NYC WATER SUPPLY TODAY
New York City’s water supply system is managed by the NYC Department of Environmental Protection’s (NYC DEP) Bureau of Water Supply. NYC DEP was created in 1977 by consolidating the water supply and wastewater treatment functions of the City government. The mission of the NYC DEP is to enrich the environment and protect public health for all New Yorkers by providing high-quality drinking water, managing wastewater and stormwater, and reducing air, noise, and hazardous materials pollution. The tap water in New York City was lauded as the “best tasting tap water” regionally in 2008 and 2018 (Chan, 2008; NYC DEP, 2018b) and nationally in 2017 by the Huffington Post (Park, 2017).
The system is managed by a multidisciplinary team of the NYC DEP that works throughout the watersheds to ensure the reliable delivery of high-quality water. The Bureau of Water Supply includes three groups responsible for the operation of the system. Source Water Operations, with 279 full-time equivalent (FTE) staff, is tasked with water supply operations, reservoir operations, and NYC DEP-owned wastewater treatment plant (WWTP) operation. The Water Quality unit, with 222 FTE, collects and analyzes tens of thousands of water
___________________
3 In 1931 and 1953, the U. S. Supreme Court resolved the interstate controversy. President Kennedy signed into law the Delaware River Basin Compact. In 2007, the Decree parties entered into a “Flexible Flow Agreement” administered by the U.S. Geological Survey Office of the Delaware River Master. The terms and specifications of the agreement were refined and revised in 2017 in a two-part, ten-year agreement.
quality samples from more than 450 locations throughout the watershed and distribution system. The Water Treatment Operations unit, with 269 FTE, operates such facilities as the ultraviolet (UV) disinfection facility, the Croton Filtration Plant, Shaft 18 at Kensico Reservoir, and Hillview Reservoir. NYC DEP estimates that system operators require 12 to 18 months of intensive on-the-job training to be properly prepared to operate the system at the level required to meet all of the quality and quantity constraints of system (K. Kane, personal communication, October 17, 2018). Given the high complexity and operational flexibility of the NYC system, substantial staff training and expertise are necessary. Recent national experience during the Covid-19 pandemic has highlighted to many water utilities the need for thoughtful planning in the event of staff loss or unavailability. The positive aspects of system flexibility can become a liability if critical expertise becomes unavailable. This complex system can only work as well as the people operating it. As with many water systems, NYC DEP will see substantial retirements in the next few years, and without careful succession planning, cross-training and documentation of processes, there could be a loss of important skills and knowledge.
Current System Operation
The goals for the operation of the water supply system are to meet the supply needs of New York City, meet all release and diversion requirements, divert the best-quality water, keep the systems balanced such that there is roughly equal percentage storage in the three systems (Clark, 1950, 1956), and operate such that the system is full by June 1 of each year. To meet the stated goals, the operational strategy is to delay drawdown as late as possible in the hydrologic year (June 1 to May 31). Historically, water quality was defined by turbidity, microbial concentrations, and algae content. Those constituents continue to be important, as well as the more recent focus on disinfection byproducts. Other concerns include lead and copper levels in the drinking water and, over the longer-term, emerging contaminants such as pharmaceuticals and other home and healthcare chemicals.
Compared to typical run-of-the river intake drinking water supplies, New York City’s water supply is larger and more complex, with multiple interconnections among diverse components of the supply that allow for considerable operational flexibility. NYC DEP uses a sophisticated model (the Operations Support Tool) to help route water among its reservoirs in response to short-term forecasts of weather and streamflow, which allows system operators to anticipate how to respond to near-term extreme events (NASEM, 2018). The combination of advanced system operations, the Watershed Protection Program, and available treatment options (primarily disinfection) present multiple barriers to contamination of the water supply.
Croton System
The Croton system is east of the Hudson (EOH) River in Westchester, Putnam, and Dutchess counties, with a small portion in Connecticut. This watershed covers approximately 375 square miles and maintains 12 reservoirs and three controlled lakes connected primarily by streams and rivers that drain into the terminal New Croton Reservoir in Westchester County. With a gross storage of 95 BG, the Croton is a stable system that may go months without changes to operations. The Croton system supplies approximately 10 percent of the City’s average daily water demand but can supply up to 30 percent during drought or other unusual conditions.
Croton system water is transmitted via the New Croton Aqueduct from Croton Lake Reservoir into Jerome Park Reservoir and then to a filtration plant completed in May 2015. The Croton Water Filtration Plant, which is below-grade in the Bronx, New York, was required of the NYC DEP because of periodic regulatory violations. The treatment system includes coagulation, flocculation, dissolved air flotation, and dual-media filtration. Following sand filtration, the water is disinfected using UV light, chlorine is added to prevent microbial growth in the distribution system, sodium hydroxide is added to adjust pH, food-grade phosphoric acid is added for corrosion control to help prevent lead from leaching from service lines and household plumbing into drinking water, and, finally, fluoride is added to protect the dental health of City residents. Croton water must pass through the filtration plant before entering the City’s distribution system. The Croton Water Filtration Plant is operated on an as-needed basis; for example, in 2017 the plant was not operated from January 1 through February 28, 2017, with the Catskill/Delaware system providing all of the City’s water during that time.
Catskill/Delaware System
The Catskill and Delaware reservoirs are, in general, larger and deeper than the Croton reservoirs and are operated much more dynamically than the relatively stable Croton system. Consequently, the residence times of the Catskill/Delaware reservoirs are quite variable and have increased in the past 20 years due to the decrease in water demand. Table 3-2 includes the total storage capacity, drainage basin area, mean depth, and mean hydraulic residence time of the reservoirs, as reported in 2000 and 2018. The more recent residence times in the west-of-Hudson reservoirs range from 0.016 to 1.27 years. To maintain a balance throughout the entire system, withdrawals are managed at 0.25 percent of each reservoir’s current stored volume per day under quiescent operating conditions. Also, given the depth of the reservoirs, operators can withdraw from a variety of depths based on the turbidity, dissolved oxygen concentration, water temperature and other water quality parameters to supply the highest-quality drinking water.
Catskill System.
The Catskill system, with a storage capacity of 140.5 BG, has two reservoirs, Schoharie and Ashokan, and a watershed that extends over parts of Ulster, Schoharie, Delaware, and Greene counties. Flowing entirely by gravity, surface water leaves Schoharie Reservoir through the Shandaken Tunnel, which empties into Esopus Creek, and then travels to Ashokan Reservoir. The Ashokan Reservoir has two discreet basins (west and east) that can be operated to maximize detention time (usually in the west basin) to increase settling of suspended solids. Surface water flows from the Ashokan Reservoir via the 75-mile long Catskill Aqueduct, which travels through the Croton Watershed to the Kensico Reservoir in Westchester County. The combined detention time and flow configuration of the Catskill reservoirs and Kensico is generally sufficient to remove turbidity to below drinking water standards (with the exception being during and after large storms).
The Catskill system has an inherent risk of high turbidity due to the watershed’s geology. The Catskills are steep and reach roughly 1,640 feet within 5-6 miles of the Hudson River, with the highest elevations (3,000–4,200 ft) in the Esopus and Schoharie Creek watersheds. The beds of the area’s rivers and streams are composed of fine glacial sediments. During intense precipitation events, turbidity can be an issue for the entire Catskill system. To address periodic high turbidity, NYC DEP can add alum into the Catskill Aqueduct 1 mile upstream of Kensico Reservoir to coagulate particles, which then settle out in Kensico Reservoir near where the aqueduct enters Kensico Reservoir. Alum addition allows NYC DEP to meet the standard for turbidity in water leaving Kensico Reservoir during such storms. In addition, NYC DEP conducted detailed investigations as part of the Catskill Turbidity Control Study over more than ten years, culminating in the development of the Operations Support Tool to help maximize water quality by improving reservoir operations (discussed below).
Catskill system operation is regulated by two State Pollutant Discharge Elimination System (SPDES) permits. Following complaints that the Shandaken Tunnel was discharging pollutants in the form of suspended solids, turbidity, and heat into the Upper Esopus Creek (a popular trout stream), NYC DEP has been required to comply with SPDES Permit 026 8151, which specifies limits for turbidity, flow, phosphorus, temperature, and solids on flow entering Esopus Creek from the tunnel. A second permit, SPDES Permit 026 4652, allows the NYC DEP to dose alum and sodium hydroxide into the Catskill Aqueduct to reduce turbidity, as described above. The optimal dose of alum is determined by daily jar tests throughout each dosing event.
Delaware System.
The Delaware system has four reservoirs—Cannonsville, Pepacton, and Neversink in the Delaware River basin, and Rondout in the Hudson River basin. The first three reservoirs supply Rondout via the East Delaware, West Delaware, and Neversink tunnels. Water flows from Rondout to the West Branch Reservoir in Putnam County via the Rondout/West Branch Tunnel. Water from West Branch then flows through the Delaware Aqueduct into Kensico Reservoir. The Delaware system has drilled, deep-rock tunnels that operate under pressure, unlike the Catskill Aqueduct.
The West Branch Reservoir is routinely operated as part of the Delaware system to increase detention time. The Delaware system, not including Kensico and West Branch reservoirs, holds 322 BG; this system provides on average 50 percent of NYC’s water supply. The Delaware system generally provides the highest-quality water in the system. In the Delaware system, downstream release requirements on the Delaware River are nearly
TABLE 3-2 Storage Capacities, Drainage Areas, Depths, Residence Times, and Yields of the Catskill/Delaware Reservoirs
| Drainage Basin | Total Storage Capacity (BG) | Drainage Basin Areaa(mi2) | Mean Depthb (ft) | Mean Residence Time, 1992-1996b (yr) | Mean Residence Timec (yr) | Dependable Yielda (MGD) |
|---|---|---|---|---|---|---|
| Catskill System | ||||||
| Schoharie | 17.6 | 315.1 | 44.3 | 0.10 | 0.25 | |
| Ashokan – E | 122.9 | 255.0 | 41.3 | 0.31 | 0.67 | |
| Ashokan – W | 0.20 | |||||
| Total | 140.5 | 570.1 | 470 | |||
| Delaware System | ||||||
| Cannonsville | 95.7 | 454.7 | 53.5 | 0.43 | 1.27 | |
| Pepacton | 140.2 | 370.9 | 69.5 | 0.71 | 1.11 | |
| Neversink | 49.6 | 92.6 | 62.0 | 0.42 | 0.71 | |
| Rondout | 34.9 | 95.0 | 66.3 | 0.14 | 0.17 | |
| Total | 320.4 | 1013.2 | 580 | |||
| East-of-Hudson | ||||||
| West Branch | 8.1 | 19.8 | 25.9 | 0.38 | 0.57 | |
| Kensico | 30.6 | 13.2 | 41.0 | 0.06 | 0.16 | |
SOURCES: a NYC DEP (2017), bNRC (2000, Table 2.4 using 1992-1996 data); ccalculated from NASEM (2018, Figure 1-2).
540 MGD, roughly the same amount of water diverted from the system.
Kensico Reservoir.
Flow from both the Catskill and Delaware systems enters Kensico Reservoir, where it has an average residence time of approximately 22 days. Because the waters from the Catskill and Delaware watersheds are comingled at Kensico Reservoir, they are referred to as one system, the Catskill/Delaware system. When conditions dictate, the Catskill and Delaware systems can operate in “float mode” in which flow bypasses the West Branch and Kensico reservoirs. This bypass is generally initiated when wind creates shoreline erosion and raises turbidity within Kensico Reservoir, which could degrade the quality of water coming from the Catskill and Delaware aqueducts. Upon leaving Kensico, the flow enters the UV plant, from which it flows by gravity to Hillview Reservoir.
Hillview Reservoir.
Hillview Reservoir is in Yonkers, New York, at the City’s northern boundary, and is the distribution reservoir for the Catskill/Delaware system. The reservoir entered service in 1915 and is on a 90-acre facility, and has a storage capacity of 0.9 billion gallons. Under normal operations, flow from the Catskill/Delaware watersheds is diverted to Kensico Reservoir, then to the UV disinfection facility, and then to Hillview Reservoir where water receives chemical addition similar to the Croton system: chlorine, sodium hydroxide, food-grade phosphoric acid, and fluoride. Water then is diverted directly to the distribution system.
The current operation of the Hillview Reservoir brings two significant vulnerabilities. First, although the capacity of the Hillview Reservoir is 0.9 billion gallons, only roughly 25 percent, or the equivalent of six hours’ demand, is available for distribution because of the hydraulics of the system. Second, the reservoir is open to the environment, even though it receives very high-quality water that has undergone both chemical and UV disinfection. This configuration leaves the reservoir potentially exposed to contamination from a myriad of sources. Redundancy could be built into the system, perhaps with a bypass from the UV facility or with a second distribution reservoir. However, NYC DEP staff say that while it is physically possible to bypass Hillview (via Delaware and Catskill Bypass tunnels), it would be difficult operationally. This difficulty is because Hillview operates as an equalization basin for the varying diurnal demand; that is, the volume stored in Hillview decreases during the highest demand and increases during low-demand periods. Bypassing the basin would eliminate that diurnal storage volume and make flow control from the UV facility extremely critical. The storage issue is mitigated to some extent by the entire system working by gravity flow, which makes it easier to respond to flow change needs, and because there is considerable private storage in the system (e.g., almost every building in Manhattan has rooftop storage). These vulnerabilities are scheduled to be addressed by NYC DEP and are discussed further in this chapter under Upcoming Infrastructure Rehabilitation and Construction.
System Interconnections and Operational Flexibility
Five reservoirs in the NYC water supply are considered “terminal” reservoirs because, depending on how the system is operated, they can be the last impoundment prior to the distribution system. These terminal reservoirs are Kensico, West Branch, New Croton, Ashokan, and Rondout and are sometimes also referred to as “source” water reservoirs (as opposed to “non-source” reservoirs)—a term equivalent to “terminal.” EPA defines a “source water reservoir” as water from a reservoir used for a drinking water system4. This distinction between “source” and “non-source” or “terminal” and “non-terminal” is important in compliance monitoring programs, where terminal or source reservoirs are subjected to more frequent sampling for a large number of parameters. Given their position in the system, New Croton and Kensico reservoirs are most frequently the “terminal” or “source” reservoirs in the Croton and Cat/Del systems, respectively. However, operational flexibility of the system (discussed below) can lead to situations when the other three reservoirs serve as terminal reservoirs.
The Croton, Catskill, and Delaware systems include various control structures and interconnections to increase operational flexibility. This flexibility can mitigate localized conditions and take advantage of excess water in any of the three watersheds. For example, in anticipation of upcoming turbidity events, the Catskill system can be operated to maximize release (out of the system) from the Ashokan west basin to create storage space for the expected highly turbid inflows. During severe storms, flow can be released from either the west or east basin via the Ashokan Release Channel into Esopus Creek to avoid diverting turbid water from Ashokan Reservoir to Kensico Reservoir. Second, newly renovated stop shutters in the Catskill Aqueduct allow system operators to drastically reduce flows from the Catskill system into the City’s supply without affecting the delivery of water to communities that draw from the aqueduct above Kensico Reservoir. Third, both the Catskill and Delaware aqueducts can bypass West Branch and Kensico reservoirs, the so-called float mode, if local conditions might impair water quality in those reservoirs.
Within the Croton watershed, there is an ability to pump Croton water via pump stations into the Delaware Aqueduct north of Kensico Reservoir (such that the water would not be filtered). To provide additional operational flexibility, NYC DEP recently completed construction of the Catskill/Delaware Interconnecting Chamber at Shaft 4. At this location, flow can be diverted from the Delaware Aqueduct into the Catskill Aqueduct, up to 365 MGD, to maintain water quality. Also, Delaware Aqueduct valves can now be adjusted to increase maximum flow from approximately 840 to 990 MGD.
Figure 3-4 shows the annual average flow diverted from the Catskill, Delaware, and Croton systems from 2006 through 2016. If water quality in the reservoirs allows, operators of the system divert roughly the same quantity of water from the Catskill and Delaware systems. Between 2010 and 2013, the Croton system was shut down to construct the Croton Water Filtration Plant. The dramatic reduction in diversion from the
___________________
4 See https://www.epa.gov/sourcewaterprotection/drinking-water-mapping-application-protect-source-waters-dwmaps-glossary.
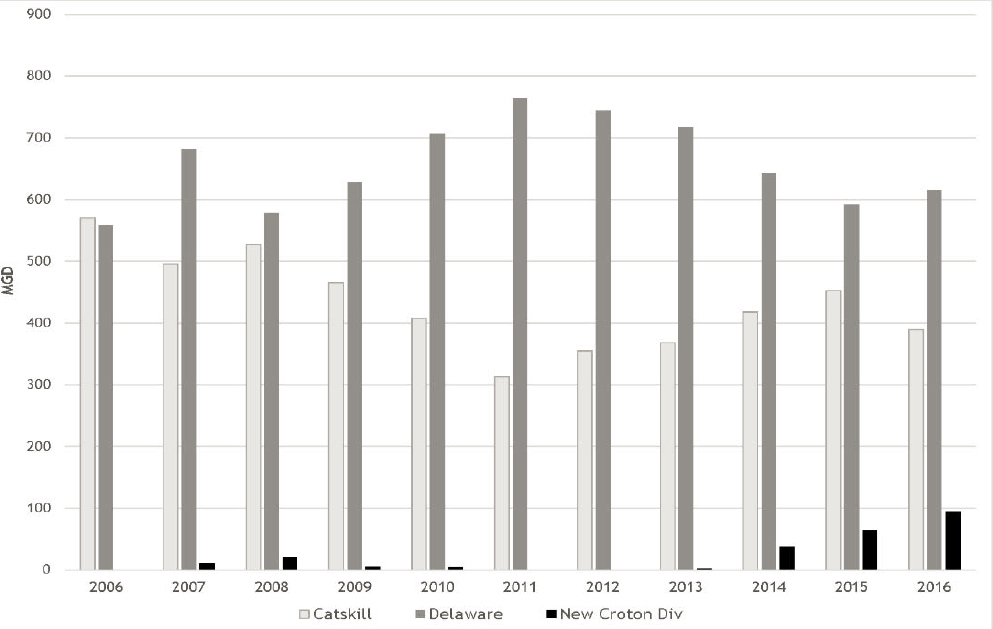
Catskill system in 2011 was in response to high turbidity caused by precipitation from Tropical Storms Irene and Lee. Tropical Storm Irene delivered an estimated 12-16 inches of rain in 12 hours to the Schoharie basin and up to 10 inches of precipitation throughout the region on August 28, 2011. Within 24 hours of the storm, NYC DEP began adding alum to the Catskill Aqueduct, and they adjusted diversions to maintain acceptable water quality in Kensico Reservoir. Tropical Storm Lee delivered another intense rain event ten days after Tropical Storm Irene, further stressing the system.
On September 9, 2011, in response to high fecal coliform concentrations in Kensico Reservoir, NYC DEP initiated chlorination (addition of sodium hypochlorite) of the Delaware System at Shaft 10 of the Delaware Aqueduct, located at the West Branch Reservoir. NYC DEP also dechlorinated the Delaware Aqueduct water at Shaft 17 using sodium bisulfite prior to discharge into Kensico Reservoir. With the alum addition, chlorination, and other swift operational responses to these devastating storms, NYC DEP maintained compliance with all Surface Water Treatment Rule (SWTR) and filtration avoidance determination (FAD) requirements, demonstrating the system’s operational flexibility and robustness.
Given the higher elevations and large geographical area of the NYC watersheds, approximately 95 percent of the water supply is delivered to the consumer by gravity. Only about 5 percent of the water is regularly pumped to maintain the required pressure in the distribution system. As a result, operating costs are relatively insensitive to fluctuations in the cost of power. However, during drought conditions, additional pumping is required.
Although the NYC DEP maintains 69 wells in Jamaica, Queens, they have not been used for water supply since 2007. From 1979 through 1998, the average daily usage from the wells was 35.5 MGD. The usage from the wells declined until 2007, when only one well was in use, with a daily supply of 1.1 MGD (NYC DEP, 2017). Currently, all water used for supply comes from the three upstate watersheds.
Operations Support Tool
Since November 2012, NYC DEP system operators have used a combined reservoir operations/water quality model called the Operations Support Tool (OST) routinely to predict future reservoir levels and water quality within the system. OST uses real-time data on streamflow, snowpack, water quality, reservoir levels, diversions, and releases, and it incorporates ensembles of streamflow forecasts from the National Weather Service. Model outputs are simulations of future reservoir storage (days to weeks to months), departures from target storage levels, turbidity levels at key locations, and degree of achievement of various system goals (such as targets for releases to downstream river reaches). These predictions inform system operators, who then make decisions based on the most current data and forecasts. OST does not dictate operations of any aspect of the water supply system. Rather, OST informs water system managers of potential consequences of any particular set of decisions and provides a basis for comparing operational alternatives.
Water routing for the New York City water system is complicated because of tradeoffs between multiple objectives such as meeting water demands, controlling floods, and maintaining downstream releases from a large number of reservoirs concurrently. The OST decision support platform encompasses the many interdependent decisions that must be made to appropriately balance multiple objectives at any time and in response to a wide range of possible future conditions. It is intended to simulate decisions that closely approximate the decisions that a knowledgeable operator would make after considering and processing the available data, constraints, and possible operational controls. Manual completion of this task for the complex NYC DEP water system would allow for a complete evaluation of only a few operational options. The National Academies reviewed OST in 2018 and found it to be one of the most advanced and complex support tools for water supply operations of its kind in the world (NASEM, 2018).
Ultraviolet Disinfection Facility
NYC DEP built the Catskill/Delaware Ultraviolet Disinfection Facility in part to comply with the Long-Term 2 Enhanced Surface Water Treatment Rule (LT2ESWTR)5, promulgated by EPA in 1996. Commencing full service in 2012, the facility is in the towns of Mount Pleasant and Greenburgh in Westchester County and receives water from Kensico Reservoir by gravity. The UV plant is the world’s largest drinking water UV disinfection system, with a design maximum flow of 2.4 BGD. Water from the Cat/Del system is first disinfected with chlorine prior to UV treatment. Once at the UV facility, the water flows under UV light for a prescribed contact time to inactivate potentially harmful microbiological contaminants, such as Cryptosporidium and Giardia.
NYC DEP was required to design and operate the UV disinfection plant at a dose of 40 mJ/cm2 unless NYS DOH approves alternative operational parameters. NYC DEP has since shown effective disinfection, including a 2-log reduction of Cryptosporidium, with lower doses and in late 2015 reduced the dose to 19.62 mJ/cm2. Continuing to review the effectiveness of lower doses of UV will provide significant energy and cost savings while maintaining water quality.
Water Demand
The NYC water supply service area includes 8.5 million City residents and nearly 1 million residents of Westchester, Putnam, Orange and Ulster counties. Demand for water has declined more than 30 percent since 1990 (Figure 3-5). The recent peak demand in NYC was in 1980 when over 1,500 MGD was delivered to a service population of roughly 7.1 million residents; the low demand in the early and mid-1960s was caused by a multiyear drought. In 2017, roughly 990 MGD was delivered to over 8.5 million residents of NYC. This trend in reduced per capita water demand is consistent with other U.S. metropolitan areas and is attributed to
___________________
5 Among many enhancements to the 1989 Surface Water Treatment Rule, the LT2ESWRT requires additional treatment for many water supplies that use surface water sources. For unfiltered surface water sources, such as the Cat/Del system, the LT2ESWTR requires two types of disinfection.
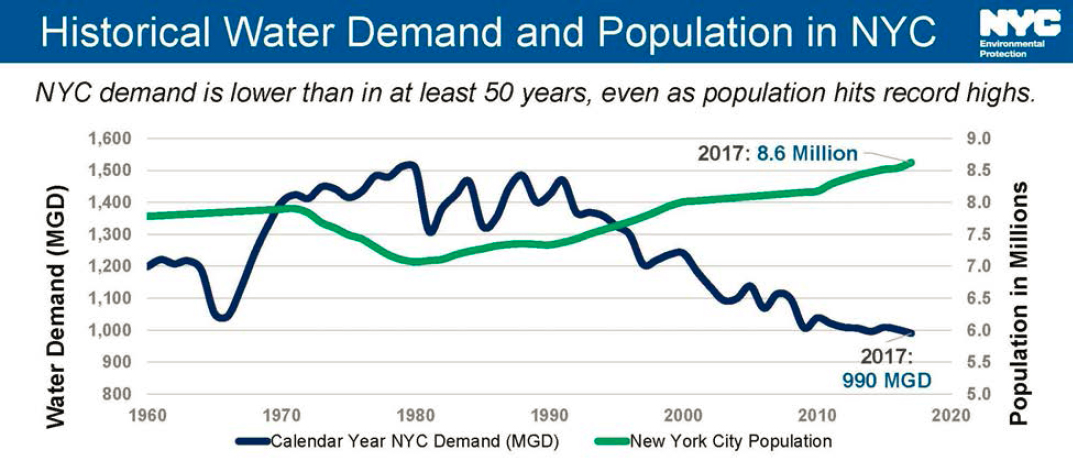
water conservation, replacement of leaking distribution pipes, more efficient water fixtures, and the movement toward universal metering and the associated economic incentives. In the City, demand management remains a priority and an opportunity for better management of costs and resources.
NYC DEP has a conservation goal of reducing water use in the City and upstate communities by 20 MGD by 2022. However, considering the stress to supply that will result when the Delaware Aqueduct is removed from service for six months as projected for 2022 to connect the Delaware Aqueduct Bypass Tunnel, perhaps the effort for water conservation should be more aggressive.
Reducing water demand could provide considerable cost and energy saving throughout the system. In water treatment, reduction in demand would generate energy and cost savings because less flow is treated by UV disinfection and chemical addition to the water for distribution. Downstream, NYC would discharge less wastewater, but with similar biological and chemical load; when wastewater is less dilute from water conservation, biological processes used to treat the wastewater can be more efficient and use less energy in pumping and treatment.
The City’s current demand management plan (NYC DEP, 2018) includes six strategies to reduce water usage systemwide including programs that address municipal water efficiency, residential water efficiency, nonresidential water efficiency, water distribution system optimization, water supply shortage management, and upstate wholesale customer demand management.
The NYC DEP municipal water efficiency program has established partnerships with the NYC Department of Education, Department of Parks and Recreation, and Fire Department, and the City University of New York, among others. The program includes installation of more efficient plumbing fixtures, devices with push-button activation for water throughout municipal agencies, and water recycling at fire department training facilities. Retrofits at the NYC Department of Parks and Recreation alone have saved an estimated 1.1 MGD.
The residential water efficiency program provides residents with a $125 voucher to replace old, inefficient toilets with high-efficiency models. NYC DEP launched the program in 2014, and through 2017, 12,000 toilets have been replaced. The nonresidential water efficiency program includes three “Water Challenges” for different commercial sectors: restaurants, hotels and hospitals. The programs encourage participants to reduce water consumption 5 percent from the prior 12 months of usage. Three hospitals, New York-Presbyterian/Queens, Memorial Sloan Kettering, and NYC Health + Hospitals/Harlem, completed the challenge and
achieved the reduction goal. In April 2018, NYC DEP pledged an additional $1.1 million to NYC Health + Hospitals/Harlem; the hospital reduced consumption by 35,000 gallons per day in the initial Water Challenge and will use the grant money to reduce consumption by an additional 60,000 gallons per day (NYC Health + Hospitals, 2018).
In September 2018, NYC DEP announced extending the Water Challenge to six NYC universities including Fordham University, Long Island University: Brooklyn Campus, Pace University, St. John’s University, The New School, and Weill Cornell Medical. This program again extends the challenge to universities to reduce water consumption by 5 percent, which would reduce water use by 1.3 million gallons per month (NYC DEP, 2018d).
Another focus for demand management is water distribution system optimization. Throughout the United States, aging water distribution systems and leaks cause considerable water losses. In 2017 alone, NYC DEP inspected 4,720 miles of water mains and repaired leaks, saving an estimated 2 MGD. In addition to leak detection, NYC DEP also is replacing and repairing fire hydrants.
NYC DEP has also revised the Emergency Drought Rules program to become Water Shortage Rules to address water shortage emergencies not associated with natural disasters such as planned and unplanned infrastructure outages and repairs.
REGULATORY FRAMEWORK FOR FILTRATION AVOIDANCE
The primary driver of NYC’s Watershed Protection Program is the federal Safe Drinking Water Act’s Surface Water Treatment Rule, which governs the conditions under which NYC’s water system can continue its status as an unfiltered supply. In addition, elements of the Watershed Protection Program related to managing water quality within the reservoirs and streams are affected by the provisions of the federal Clean Water Act (CWA). Finally, management of water transfers and releases from the reservoir system are regulated under the Flexible Flow Management Program developed to meet the requirements of a 1954 Supreme Court decision settling an interstate dispute between New York, Pennsylvania and New Jersey. The NYC water supply, and the Watershed Protection Program in particular, also is subject to several state and local regulations. These federal, state and local requirements are discussed below.
Safe Drinking Water Act
The Safe Drinking Water Act (SDWA) of 1974 created national health-based standards for public drinking water supplies. Amendments to the SDWA passed in 1986 require that public water supplies be disinfected, with filtration being required for nearly all public water systems that use surface water or groundwater under the direct influence of surface water. In 1989, EPA codified elements of the SDWA to create the SWTR to specifically address public health risks from Legionella, Giardia lamblia, and viruses for all public water systems using surface water.
Surface Water Treatment Rule
The SWTR requires disinfection and filtration of all surface water sources. However, under a narrow set of criteria, well-protected sources may receive a “waiver” of the filtration requirement or a filtration avoidance determination, allowing use of only disinfection. In developing criteria for determining which surface water systems did not require filtration, the 1986 amendments to the SDWA required that “EPA must consider source water quality, protection afforded by watershed management, treatment techniques such as disinfection practice and length of water storage, and other factors relevant to protection of health” (EPA, 1987: 42179).
Only a few large surface water systems have qualified for the FAD. Large currently unfiltered systems include New York City, Boston, San Francisco’s Hetch Hetchy source with its watershed in Yosemite National Park, Seattle’s Cedar River source (their Tolt source is now filtered), and Portland, Oregon’s Bull Run source (although they recently decided to filter and are moving ahead with design). Tacoma, Washington, recently
choose to filter its well-protected Green River source to increase capacity and robustness. Smaller unfiltered systems include Holyoke, Massachusetts; Portland and Bangor, Maine; Walla Walla, Washington; and Syracuse, New York (MWRA, 2018).
The filtration avoidance requirements in the SWTR (and its subsequent enhancements) include 11 separate criteria, all of which must be met continuously. The watershed protection-related criteria have not changed substantively since 1989, but treatment-related portions have been modified. The 11 criteria are
- Low levels of source water fecal bacteria;
- Low levels of source water turbidity;
- Adequate watershed protection and control;
- Adequate inactivation of Giardia, Cryptosporidium, and viruses;
- Redundant disinfection equipment to ensure reliability;
- Adequate and consistent disinfectant residual levels at the entry point;
- Adequate disinfection residual levels within the distribution system;
- Compliance with the disinfection byproducts rules;
- Low levels of total coliform bacteria within the distribution system;
- No evidence of waterborne disease outbreaks; and
- Adequate performance on annual on-site inspections.
NYC DEP’s FAD and related watershed protection programs are primarily regulated by the New York State Department of Health (NYS DOH), which received delegated authority from EPA to implement the SDWA rules in September 2007.
1. Low Levels of Source Water Fecal Bacteria.
Source water must be sampled prior to disinfection at least five days per week. Over each rolling six-month period, the fecal coliform concentration must be less than or equal to 20 colony forming units (CFU)/100 mL, or the total coliform concentration must be less than or equal to 100 CFU/100 mL, in at least 90 percent of samples. If a system monitors for both fecal and total coliforms, the fecal coliform results are used for compliance. Fecal coliforms, or “thermo-tolerant” coliforms, are an indicator of potential contamination by fecal material by a warm-bloodied animal, and are thus a more direct indicator of contamination of health concern than total coliforms, which can come from a variety of other environmental sources and may not be health related. The compliance point for NYC DEP to monitor fecal coliforms is at Kensico Reservoir Shaft 18 prior to chlorination.
2. Low Levels of Source Water Turbidity.
Turbidity is a measure of the amount of particulate material in the water. It is regulated for unfiltered systems because higher turbidity can interfere with effective disinfection either by depleting the disinfectant concentration or by the particles shielding microorganisms from disinfection. Turbidity is measured in the source water prior to disinfection (i.e., NYC DEP monitors for turbidity at Shaft 18). Turbidity must be measured every four hours, or with a continuous measurement device validated with grab samples. Turbidity cannot exceed five nephelometric turbidity units (NTU) unless NYS DOH determines that the event was caused by circumstances that were unusual and unpredictable. There can be no more than two events in which the turbidity exceeded 5 NTU in the previous 12 months, or more than five events in the previous 120 months. An event is defined as a series of consecutive days during which at least one turbidity measurement each day exceeded 5 NTU.
3. Adequate Watershed Protection and Control.
The requirements for watershed control in the SWTR focus on the ability of the watershed control program to minimize contamination by Giardia, viruses, and Cryptosporidium in the source water. The actual regulatory language is quite general (see below). Most of the specific requirements in the rule relate to the characterization of the watershed and identification and monitoring of activities that may have an adverse effect on water quality as it relates to viruses, Giardia, and Cryptosporidium.
(2) Watershed control requirements.
To avoid filtration, systems must establish and maintain an effective watershed control program to minimize the potential contamination by Giardia lamblia cysts and viruses in the source water. [Note that the Interim Enhanced SWTR added control of Cryptosporidium to the list of organisms to be controlled by watershed protection.] The State must determine whether the watershed control program is adequate to limit potential contamination by Giardia lamblia cysts and viruses. In making this determination, the State must consider the comprehensiveness of the watershed review; the effectiveness of the system’s program to monitor and control activities occurring in the watershed that could have an adverse effect on water quality; and the extent to which the system has maximized land ownership and/or control of land use within the watershed. At a minimum, the watershed control program must: (1) Characterize the watershed hydrology and land ownership; (2) identify watershed characteristics and activities which may have an adverse effect on source water quality; and (3) monitor the occurrence of activities which may have an adverse effect on source water quality. The public water system must demonstrate through ownership or written agreements with landowners in the watershed, or a combination of both, that it controls all human activities which may have an adverse effect on the microbiological quality of the source water. The system must submit an annual report to the State that identifies any special concerns about the watershed and how they are being handled; describes activities in the watershed that affect water quality; and projects what adverse activities are expected to occur in the future and describes how the public water system intends to address them.
[EPA, 1989a:27502]
A critical element of the watershed control program specifically called out in the SWTR is land ownership or control as the mechanism for reducing the potential for these adverse effects. The SWTR includes the requirement that an unfiltered system “must demonstrate through ownership or written agreements with landowners in the watershed, or a combination of both, that it controls all human activities which may have an adverse effect on the microbiological quality of the source water” (EPA, 1989a:27507). As originally conceived by EPA in development of the rule and in its guidance documents, a well-protected watershed was entirely owned and controlled by the water system. Many of the West Coast unfiltered systems come close to achieving this standard. Seattle owns 100 percent of its Cedar River watershed. Portland, Oregon’s Bull Run watershed is 95 percent owned by the U.S. Forest Service, 4 percent by the city and 1 percent by the U.S. Bureau of Land Management, with legislative and written agreements providing that it be managed for water supply protection. Public access is not allowed in the Seattle or Portland watersheds. San Francisco’s watershed is owned by the National Park Service; while there is public access, it is managed to protect the water supply.
Unfiltered water systems in the eastern United States generally have more fragmented ownership within their watersheds, with less of the land being publicly owned. Portland, Maine, owns only about 2 percent of the Sebago Lake watershed, which has hundreds of square miles of completely unrestricted use, but its intake is in deep water within the extremely large Lake Sebago (in which active body contact recreation is allowed). The Quabbin, Ware, and Wachusett watersheds of the metropolitan Boston system have a combined system ownership of 47.3 percent. However, if lands protected by other local, state, and nonprofit groups are included, approximately 67 percent of the watershed is protected (MWRA, 2018). NYC owns about 16.7 percent of its 1,970-square-mile watershed; this increases to 38 percent when considering state and local protected lands.
While EPA appears to have begun with an expectation of requiring 100 percent ownership or control, EPA and state primacy agencies have recognized the value of ongoing efforts to protect undeveloped land over time and the benefits of protecting higher-value lands rather than simply owning more land (EPA Region 1, 1996). Using ongoing land acquisition to avoid the adverse effects of watershed activities appears to be an acceptable interpretation of the ownership or written agreement requirements. All of the unfiltered supplies mentioned above have continued to receive FADs. In several revisions of the SWTR since its initial promulgation in 1989, and since the initial NYC FAD in 1997 (EPA, 1997), EPA has not changed this criterion.
A final important consideration with land acquisition programs is whether the type of activities permitted on lands owned or controlled provide adequate protection against any “adverse effect on the microbiological
quality of the source water.” As discussed in Chapter 5, ownership or easements on land, without appropriate use restrictions and enforcement, may not provide sufficient assurance that water quality will not be adversely affected.
NYS DOH, in drafting its own state rules to implement the SWTR, added several specific requirements for watershed protection and control:
- The ownership and control language is delimited by the ability of the system to demonstrate that portions of the watershed have more than 60 days’ travel time from the intake under all but emergency conditions, focusing land ownership requirements on lands closer to the intake.
- No new WWTP discharges are allowed within 60 days’ travel time of the intake. Existing wastewater treatment discharges to a tributary watercourse are allowed within the 60-day travel time if specific defined levels of physical removal and disinfection treatment are provided (99.9 percent reduction in Giardia and 99.99 percent reduction in viruses). New wastewater treatment facilities beyond the 60-day travel time must have similar treatment.
4. Adequate Inactivation of Giardia, Cryptosporidium, and Viruses.
Unfiltered surface water supplies must implement disinfection adequate to inactivate 99.99 percent of enteric viruses, 99.9 percent of Giardia, and with the promulgation of the Long-Term 2 Enhanced SWTR (LT2), 99 percent of Cryptosporidium.6 LT2 also added the requirement that two separate primary disinfectant processes be used, each capable of providing the full required inactivation for at least one of the target organisms. Systems using chlorine or ozone disinfection must meet the disinfection requirements during the peak flow hour of the day every day each month. The regulations allow failing the requirement during the peak hour one day during one of the 12 previous months. There are regulatory provisions allowing failure in a second month in the previous 12 months if the circumstances were found by DOH to be unusual and unpredictable. For disinfection with UV light, no more than 5 percent of water produced can be “off-spec,” that is, not meeting all required parameters during any month. To comply with LT2, NYC DEP constructed the UV plant at Eastview, and now provides disinfection with both free chlorine and UV light.
5. Redundant Disinfection Equipment to Ensure Reliability.
Because unfiltered systems rely on only disinfection to inactivate any pathogens potentially present in their source water, the SWTR requires that their disinfection systems must have a degree of redundancy and backup power to ensure continuous operation. Otherwise, the system must have the capability of automatic shutdown if disinfection levels drop too low—an option used primarily by much smaller systems. This criterion is checked during annual on-site inspections.
6. Adequate and Consistent Disinfectant Residual Levels at the Entry Point.
To ensure that adequate disinfection is occurring at all times, in addition to the inactivation requirements, the SWTR requires that the residual disinfectant concentration in the water entering the distribution system cannot be less than 0.2 mg/L for more than four hours. Continuous monitoring is required. The NYS DOH can allow a failure of this criterion without requiring filtration if it determines that the failure was caused by circumstances that were unusual and unpredictable. (These terms, unusual and unpredictable, are deliberately not defined to allow the regulator some leeway to evaluate the specific circumstances.)
7. Adequate Disinfection Residual Levels Within the Distribution System.
In addition to requiring a continuous minimum residual at the entry point, the SWTR requires that unfiltered systems maintain a detectable residual within the distribution system. All samples collected for total coliform analysis are required to have the chlorine residual analyzed, and no more than five percent in any two consecutive months can have a nondetectable residual. Nondetectable residual is further defined as a sample with no detectable residual and
___________________
6 If mean measured Cryptosporidium concentrations in an unfiltered surface water system exceeded a regulatory threshold of 0.01/L in required initial or 6-year review sampling, 99.9 percent inactivation would be required.
a heterotrophic plate count (HPC) analysis of more than 500 CFU/mL, or a sample with no detectable residual without an HPC analysis. As with several of the other criteria, this criterion must be met on an ongoing basis unless NYS DOH determines that a failure was not caused by a deficiency in treatment of the source water.
8. Compliance with the Disinfection Byproducts Rules.
Unfiltered systems must meet all disinfection byproduct (DBP) rule requirements, including maximum contaminant levels (MCLs) for total trihalomethanes, haloacetic acids, bromate, and chlorite and the maximum residual disinfection level requirements within its distribution system. While failure to meet any of the DBP requirements would of itself be a rule violation, for unfiltered systems it would also be a violation of one of the criteria for remaining an unfiltered system because they are relying solely on watershed protection to effectively manage influent organic carbon and other DBP precursors.
9. Low Levels of Total Coliform Bacteria Within the Distribution System.
Unfiltered systems must not exceed a total coliform treatment technique trigger in 11 of the 12 previous months, unless the NYS DOH determines that failure was not caused by a deficiency in treatment of the source water. Under the revised Total Coliform Rule promulgated in 2013, the treatment technique trigger is that no more than 5 percent of distribution system bacteria samples can be total coliform-positive in a given month.
10. No Evidence of Waterborne Disease Outbreaks.
An unfiltered water system must not be identified as a source of a waterborne disease outbreak. Neither the federal nor the NYS DOH regulations provide significant detail on this criterion, but the EPA October 1989 Guidance Manual (EPA, 1989b) provides some limited guidance on evaluating disease data and determining if it was related to source water and treatment. The NYC DEP collaborates with the NYC Department of Health and Mental Hygiene in reviewing and analyzing potential waterborne disease cases (see Chapter 11).
11. Adequate Performance on Annual On-Site Inspections.
As an additional assurance of the necessary implementation and maintenance of the other criteria, the SWTR requires that the state primacy agency (NYS DOH) conduct an annual on-site inspection. The annual on-site inspection is different from (and in addition to) watershed sanitary surveys, and sanitary surveys conducted by the state primacy agency of the entire water system under other SDWA rules. As defined in EPA (1989b), the annual on-site inspection must, among other things:
- Review the effectiveness of the watershed control program,
- Review the physical condition and protection of the source intake,
- Review the maintenance program to ensure that all disinfection equipment is appropriate and has received regular maintenance and repair to ensure a high operating reliability, and
- Review data records to ensure that all required tests are being conducted and recorded and that disinfection is being effectively practiced.
Revisions to the Surface Water Treatment Rule.
Since 1989 when EPA issued the SWTR, there have been three major revisions, none of which substantially altered the watershed control-related conditions for filtration avoidance. In revising the SWTR, EPA convened two phases of a Federal Advisory Committee Act (FACA) regulatory negotiation process chartered to develop consensus recommendations dealing with both microbial contamination, principally Cryptosporidium in response to the 1993 Milwaukee outbreak, and disinfection byproducts, recognizing the possibility of risk–risk tradeoffs in separately responding to either issue. During the second FACA process, the unfiltered systems were explicitly included in the negotiation process with their own representative.
The Interim Enhanced Surface Water Treatment Rule (IESWTR), promulgated in 1998, added more stringent requirements on filtration processes for large systems that filter to enhance reliable removal of Cryptosporidium, and a maximum contaminant level goal of zero and watershed control requirements for Cryptosporidium
for those systems that had FADs. The Long Term 1 Enhanced Surface Water Treatment Rule (LT1), promulgated in 2000, established standards similar to those of the IESWTR for smaller systems. Finally, the Long Term 2 Enhanced Surface Water Treatment Rule (LT2), promulgated in 2006, required that systems using surface water test for Cryptosporidium and add additional treatment based on the levels. The unfiltered option was preserved, and no additional watershed control requirements were added. Unfiltered systems were required to achieve at least 99 percent Cryptosporidium inactivation (99.9 percent if source water testing indicated higher levels of Cryptosporidium presence), and must use two separate primary disinfection systems. NYC DEP complies with the disinfection requirements via UV light and chlorine disinfection.
Comparison of Large-System FADs
The depth of engagement of the New York state primacy agency in requiring detailed investigations, as well as the degree of reporting required for the NYC DEP, is substantially greater than for other states with large unfiltered systems. This difference refers both to the level of detail in required reporting and the specificity of reporting deadlines for specific deliverables. While all these metropolitan systems appear to have an ongoing working relationship with their state primacy agency, most other unfiltered systems are required to provide at most a formal annual report and receive a relatively broad response from the primacy agency.
Boston, Massachusetts.
The Massachusetts Department of Environmental Protection (MA DEP) first issued a determination of filtration avoidance for the MWRA on November 13, 1998. It was 12 pages long and focused on evidence that the MWRA system had met the 11 SWTR criteria for filtration avoidance, and it was conditioned on the issuance of an administrative consent order (ACO). No specific reporting requirements were set out in the determination. Specific conditions in the ACO primarily related to milestones for completion of MWRA’s permanent treatment facility using ozone for primary disinfection (replacing interim treatment facilities using chlorine) and removal of remaining downstream open distribution storage facilities. Reporting requirements in the ACO focused on construction activities. The requirements of the ACO were met upon completion of the treatment and covered storage facilities in 2005, and the ACO itself was terminated. The FAD has no specific time period.
MA DEP issues an annual assessment of the FAD each year after their on-site inspection. These assessments are typically several pages long, reiterating compliance with each of the criteria, and may contain several to a dozen requests for follow-up information. These requests typically result in brief letter responses or transmittals of already-collected data. The MWRA (and its sister watershed agency the Department of Conservation and Recreation) issue an updated watershed protection plan every five years, and typically receive a brief approval letter with no additional conditions from MA DEP.
Portland, Oregon.
The Portland Water Bureau (PWB) applied for a filtration waiver in December 1991 (PWB, 1991), providing the Oregon Department of Human Services, Health Division with the data necessary to demonstrate compliance with each of the filtration avoidance criteria. The PWB demonstrated that it met all source water criteria, and was about to come into compliance with the disinfection inactivation and redundancy criteria. In January 1992, the state issued the FAD in a two-page response letter (Oregon Department of Human Resources, 1992), requiring that the PWB continue to meet the criteria, provide an annual report, and participate in an annual on-site inspection. The 2018 annual report (PWB, 2018) consisted of 19 pages documenting watershed protection, wildlife control, access, enforcement and infrastructure activities.
Typical annual inspections consist of a single-day inspection in the watershed and single-day inspection of the treatment works. The Oregon Health Authority documents the inspections in an eight-page report (OHA, 2018), and provides a one-page response letter indicating that the PWB continues to meet the FAD criteria.
New York City.
The EPA issued conditional FADs in January and September 1993 because it was evaluating the adequacy of NYC DEP programs. These conditional determinations contained numerous requests for
additional information and reporting. The first included 66 specific conditions, and the second included over 150 specific conditions that NYC DEP needed to meet.
The FAD issued by the EPA in May 1997 was 68 pages long. It required numerous specific reports, evaluations, engineering or modeling studies, and program status reports, each with specific milestones. Fourteen of the specific milestone reports related directly to the SWTR criteria for avoiding filtration, while the remaining ones (over 150) added additional specific reporting or progress milestones. For example, the FAD required 22 tasks related to the Land Acquisition Program, 33 related to modeling of Cannonsville, Pepacton, Rondout, Neversink, West Branch, Ashokan, and Schoharie reservoirs, and another 22 related to modeling and remediation at Kensico Reservoir. The nonpoint pollution and septic programs each had over a dozen tasks, with the Wastewater Treatment Plant Program having over two dozen, many with multiple milestones within them. The 1997 FAD covered a five-year period, as did the 2002 FAD. The 2007 FAD covered a period of ten years, consisting of two five-year periods. The second five-year period was the subject of the Revised 2007 FAD, issued in May 2014. It is 98 pages long, with over 150 specific tasks and reports with milestone dates. The 2017 FAD was issued for a ten-year period, with NYC DEP making ten-year program commitments, although still with the expectation of a midpoint review and revision after five years. It is 120 pages long with over 150 tasks and required reporting milestones.
The much higher level of detail in regulatory agency scrutiny applied to NYC seems to have arisen from the initial history of NYC DEP’s FAD. The substantial commitments that NYC DEP made as part of the process of negotiating the 1997 Memorandum of Agreement (MOA), as well as the large number of programs getting started, understandably resulted in a long list of deliverables in the initial FAD. Subsequent FADs appear to have served as a public and robust way to memorialize agreements between NYC DEP and watershed stakeholders on specific program details as those programs were developed and revised. This type of detailed process provides a level of transparency, but tends to cause programs to be more “siloed,” less flexible, and perhaps less adaptable. Given the now long history of successful Watershed Protection Program implementation and ongoing cooperative relations with watershed stakeholders, it may be timely to move toward a FAD process focused on program performance and more broadly responsive to the SWTR’s filtration avoidance criteria, rather than the current approach of excessively detailed program inputs and administrative milestones, many somewhat distantly related to the SWTR criteria. Such an approach would allow NYC DEP and the watershed communities greater flexibility to manage changed circumstances and priorities.
Clean Water Act
While operation of the water system for the protection of drinking water quality is regulated by the SDWA, the system also is regulated by the federal CWA as it relates to water quality in the tributaries and reservoirs. The CWA, which has evolved over the years, seeks to reclaim degraded waters and protect and prevent waters from future degradation by eliminating discharge of pollution into the waters of the United States. The basis of the CWA was enacted in 1948 as the Federal Water Pollution Control Act, but the Act was significantly reorganized and expanded in 1972. The CWA became the Act’s common name with amendments in 1972. EPA has delegated responsibility for implementation and enforcement of the CWA to the state primacy agency, the New York State Department of Environmental Conservation (NYS DEC), although some decisions and permits also must be approved by EPA. The need for NYC DEP to simultaneously meet requirements of both the SDWA and the CWA underlies several watershed protection programs and the development and use of the Operations Support Tool.
Water Quality Standards
The CWA establishes the basic structure for regulating the quality of surface waters of the United States. States must designate beneficial uses for all surface waters (e.g., recreational uses; protection and propagation of fish, shellfish, and wildlife; drinking water supply). Each designated use has associated water quality criteria. State primacy agencies must ensure, via water quality data, that waterbodies are meeting water quality stan-
dards (defined by the designated use and associated criteria).
Use classifications for each waterbody in New York, including the New York City water supply reservoirs and the tributaries, are published as part of NYS DEC Regulations (See Title 6 Chapter X- Division of Water Subchapter B).7 As drinking water sources, the Catskill/Delaware and Croton reservoirs are designated as either Class A or Class AA waters. This classification is designed to provide a level of protection that can also support recreational and fishing uses, as well as fish, shellfish, and wildlife propagation. Tributaries to those reservoirs vary in their use classification. Water quality criteria for each use can be found in Part 703 of the New York Water Quality Regulations. Under the CWA, EPA has also set wastewater standards for industry.
Section 303(d) of the CWA requires that waterbodies not meeting their designated uses be listed as impaired (or threatened if they are likely to become impaired in the next monitoring cycle). The state must then determine the maximum amount of pollutants that can enter the waterbody and still meet the water quality standard necessary to support the designated use, under the so-called total maximum daily load (TMDL) process. This daily load is then apportioned between point and nonpoint sources discharging to the waterbody, and any SPDES permits (see below) should be made consistent with that apportionment.
Some waterbodies within the NYC water supply watershed have been identified as not meeting water quality standards. Eight Croton reservoirs and Cannonsville Reservoir have been routinely impaired for phosphorus in the last 20 years. In 2000, Phase II TMDLs were developed for these waterbodies, which were subsequently removed from the 303(d) list (NYS DEC, 2018). Ashokan Reservoir and Upper Esopus Creek (and minor tributaries) were listed (in 2002 and 1998, respectively) as silt/sediment impaired (NYS DEC, 2018) but no TMDLs have been developed for either waterbody.
SPDES Permits
The CWA also requires regulation of all municipal, industrial and commercial facilities that discharge wastewater or stormwater directly from point sources, including the development and enforcement of effluent limits for such discharges. These effluent limits are codified in National Pollutant Discharge Elimination System (NPDES) permits, or in cases where a state agency has primacy, a SPDES permit. NYS DEC is responsible for regulating point source pollution by issuing permits for wastewater discharges and for stormwater.
NYC DEP has historically added aluminum sulfate (alum) to the Catskill Aqueduct to reduce the turbidity of flows into Kensico Reservoir in order to manage turbidity levels at the Shaft 18 intake to meet SWTR criteria. Alum acts as a coagulant, causing particles to clump together and settle out near the discharge point into Kensico Reservoir. After determining that the addition of alum violated the CWA narrative standard for suspended and settleable solids, in 2006 NYS DEC issued a SPDES permit to NYC DEP for the discharge of water containing alum from the Catskill Aqueduct into Kensico Reservoir. The permit is unusual in that it requires the evaluation of structural, operational, and erosion control measures to reduce turbidity in the water entering the aqueduct, in order to reduce the amount and frequency of alum addition. NYC DEP has recently proposed modifications to this SPDES permit, including operation of the Ashokan Release Channel (discussed below) and the dredging of alum floc from Kensico Reservoir; a review to determine the environmental impacts of these modifications is ongoing.
The use of the Shandaken Tunnel to divert water from Schoharie Reservoir to Ashokan Reservoir via Upper Esopus Creek, a valued cold-water trout fishery, has brought about a complex series of regulatory and litigation actions over the last 20 years. Environmental groups sued under the CWA that the diversions were discharging turbidity, suspended solids and heat into the Upper Esopus Creek and required a SPDES permit (issued in 2006). The suits raised questions of regional and national importance, focusing on the application of the CWA to naturally occurring constituents of one waterbody being transferred to another. A series of permit applications, draft permits, appeals and variance applications from 2010 to the present have resulted in continued efforts to manage turbidity and water temperature to protect the fishery. Those efforts have included a series of studies of structural and nonstructural options for turbidity control, ongoing stream restoration
___________________
efforts, and the development of OST, which now facilitates modified system operations of Schoharie Reservoir to reduce turbidity and heat in the diversions.
Interim Release Protocol
As discussed previously, the west basin of Ashokan Reservoir can serve as a settling basin for highly turbid water to improve in quality prior to being allowed to flow into the east basin and subsequently to the Catskill Aqueduct. If the west basin is highly turbid and likely to spill into the east basin, some of that turbid water can be released via the Ashokan Release Channel to Lower Esopus Creek to avoid having it be drawn into the water supply. These releases are dictated by the Interim Release Protocol (IRP), required by NYS DEC and implemented by NYC DEP. The IRP details the allowable releases during different seasons, water quality conditions, and reservoir and drought status in order to balance the competing needs of stream quantity and quality in Lower Esopus Creek. It attempts to provide an adequate supply of water to Esopus Creek (neither too much nor too little) to maintain a void within the west basin reservoir to prevent potential downstream flooding during storm conditions, and to reduce the level of turbidity in water entering the Catskill Aqueduct. The IRP was created after communities along Lower Esopus Creek complained about excessively turbid releases following the storms of 2011; the release quantities that it specifies are meant to minimize downstream impacts to the extent possible (Order on Consent, October 2013; NASEM, 2018).
Stormwater Regulations
In 1987, the CWA was reauthorized to include discharges from municipal and construction site stormwater runoff in the NPDES program. The NPDES program requires permits for stormwater discharges from municipalities, industries, and construction sites either as individual permits issued by the state or EPA to a single facility or as a general permit developed by the state or EPA to cover classes or categories of dischargers under a single permit. In 1990, EPA’s Phase I regulations for municipal separated storm sewer systems (MS4) required individual permits for municipal populations over 100,000 (EPA, 1990). No Phase I permittees exist in the watershed for NYC’s drinking water supply. In 1999, EPA’s Phase II regulations for small MS4s under a state or EPA general permit were expanded into cities and counties with populations greater than 50,000, and urban areas of 10,000 or more with a population density greater than 1,000 per square mile, as well as nontraditional MS4s such as public universities, state departments of transportation, hospitals, and prisons (EPA, 1999). MS4 permits require a municipal jurisdiction to develop a stormwater pollution prevention plan with approved program plans (see Chapter 9 for details).
Numerous small MS4s have been designated by the NYS DEC in the counties in or partially in the NYC watersheds (NYS DEC, 2010). West of Hudson (WOH), there are no MS4s in Delaware, Greene, and Schoharie counties, one MS4 in Sullivan County, and 13 in Ulster County; however, none contribute urban runoff to the NYC water supply. The EOH watershed contains many small towns in Dutchess, Putnam, and Westchester counties. Being in closer proximity to New York City, these counties are more densely populated, and so have more designated MS4s. Dutchess County has 13 MS4s with only one draining to the EOH watershed. Putnam County has 7 MS4s and all drain to the watershed. Westchester County has 44 MS4s and 12 drain to the watershed. Industrial site NPDES permits apply to both EOH and WOH watersheds. In addition, construction sites that disturb one acre or more of soil must obtain a NPDES permit and create an approved stormwater pollution prevention plan.
Flexible Flow Management Program
A final federal requirement affecting the NYC water supply stems from the watersheds of the Delaware system draining to the downstream states of Pennsylvania, New Jersey, and ultimately Delaware. Under the terms of a 1954 U.S. Supreme Court Decree that settled an interstate water dispute between New York City, New York State, and the lower Delaware River basin states, releases from Pepacton, Cannonsville, and Never-
sink reservoirs are managed to balance all of the states’ interests. A new ten-year Flexible Flow Management Program (FFMP) was recently approved by New York, Pennsylvania, New Jersey, Delaware, and New York City and went into effect October 20, 2017. It is designed to meet water supply demands, protect downstream fisheries and recreation, enhance flood mitigation, and control upstream intrusion of saltwater in the Delaware Estuary, which could affect the Philadelphia water supply. NYC DEP’s OST is now used to manage water forecasted to be available and to inform reservoir release decisions.
State and Local Regulations That Affect the NYC Water Supply
Operational aspects of the NYC water system also are regulated by the NYS DEC, in part through their water supply permit program. In 1997, NYC DEP received a 10-year Water Supply Permit (with a 5-year renewal option) from NYS DEC that among other things, authorized and governed the newly created Land Acquisition Program. The permit memorialized details of the Land Acquisition Program that had been agreed upon in the 1997 Watershed MOA, including the solicitation process, parcel acreage minimums, prioritization factors, and limits on purchases in established community centers. Under the 2007 FAD, NYC DEP was required to apply for a new Water Supply Permit in 2010 (NYC DEP, 2010c). That permit was issued effective December 2010, and has been amended several times to incorporate changes in the Land Acquisition Program.
Watershed Rules and Regulations
The watershed rules and regulations (WR&R) of the MOA were designed to prevent activities and land uses that might degrade NYC water quality. The WR&R are founded on a 1905 public health law as well as regulations in 1917 and 1953 that dealt with WWTP discharges and discharges from privies. The WR&R in the 1997 MOA (and subsequently revised in 2002, 2010 and 2019) added provisions for stormwater discharges and the siting of impervious surfaces, sewers and septic systems, and holding tanks. Storage of solid waste or winter highway materials also are included. Agriculture, silvaculture, and mining are exempt from the WR&R. For the most part, the regulations are built on top of state standards.
The WR&R require setbacks between specified activities/land uses and surface water features such as reservoirs, reservoir stems, controlled lakes, watercourses, and wetlands (12.4 acres or larger). The setbacks, which are meant to provide water quality benefits such as allowing for functioning riparian buffers and limiting soil compaction and disturbance, range from 25 to 300 feet depending on the activity. For example, new impervious surfaces and septic systems must be at least 100 feet from adjacent watercourses or wetlands and at least 300 feet from adjacent reservoirs, controlled lakes, or reservoir stems. NYC DEP defines a watercourse as a visible path through which surface water travels on a regular basis (Giannetta, 2019).
The WR&R require the creation of Stormwater Pollution Prevention Plans, similar to the requirements of the stormwater programs under the CWA. The stormwater WR&R apply to both EOH and WOH watersheds, and include locations outside NYS DEC-designated small MS4s. Stormwater pollution prevention plans are to be prepared for new developments including residential subdivisions, commercial and industrial facilities, gasoline stations, solid waste management facilities, and new roads—in accordance with requirements set forth in NYS DEC general SPDES Permit GP-0-10-001.
The WR&R also specify design standards for septic systems. The regulations require a minimum 3-minute soil percolation rate, 100 percent absorption field reserve area, and absorption fields may not be installed under pavement. There is a ban on mound, sand filters and galley-type septic systems, as well as limits on gravel-less systems. For WWTPs, the WR&R require tertiary treatment or microfiltration to achieve phosphorus concentrations less than 1 mg/L.
The WR&R are enforced by NYC DEP, which reviews permit applications for projects that might, for example, create new impervious surfaces, septic systems, or stormwater discharges. In addition to reviewing and approving applications, NYC DEP conducts numerous inspections of new WWTPs, septic systems, and active construction; the agency completed 500 inspections in October 2018 alone. According to Giannetta
(2019), having a consistent project review process with routine field inspections is important to the success of the WR&R. Applicants can apply for reimbursement (e.g., from the Catskill Watershed Corporation) for some activities, such as the costs associated with design, construction, and ongoing operations and maintenance for stormwater, wastewater, and septic systems.
A final requirement of the WR&R is the designation of basins as either “phosphorus-” or “coliform-restricted.” Phosphorus restriction is defined as follows:
(i) the drainage basin of a source water reservoir in which the phosphorus load to the reservoir results in the phosphorus concentration in the reservoir exceeding 15 micrograms per liter, or (ii) the drainage basin of a reservoir other than a source water reservoir or of a controlled lake in which the phosphorus load to the reservoir or controlled lake results in the phosphorus concentration in the reservoir or controlled lake exceeding 20 micrograms per liter. (NYC DEP, 2010a)
This evaluation is made annually based on monthly samples from May 1 through October 31 and uses a running (arithmetic) average of annual geometric mean dissolved phosphorus concentration values. Some details of the statistical method used for making this determination are unconventional and violate some aspects of statistical best practices.
Sections 18-48(a)(1), 18-48(c)(1), 18-48(d)(1), and 18-48(d)(2) of the WR&R also require the City to perform an annual review of its reservoir basins to make “coliform-restricted” determinations. Source basins (Kensico, West Branch, New Croton, Ashokan, and Rondout) must comply with federally imposed limits on fecal coliforms collected from waters within 500 feet of the reservoir’s aqueduct effluent chamber. Non-source basins must comply with NYS ambient water quality standard limits on total coliform bacteria (6 NYCRR Parts 701 and 703).
The list of phosphorus-restricted basins is updated annually in the Watershed Water Quality Annual Report. In 2018, no Delaware or Catskill reservoir basin was phosphorus-restricted (NYC DEP, 2019a). With the exception of Boyd’s Corners, all Croton system reservoir basins continued to have phosphorus-restricted status. Although no source reservoir was listed in 2018 as coliform-restricted, several non-source reservoirs are coliform-restricted.
FUTURE SYSTEM OPERATION, REGULATIONS, AND CONCERNS
Looking forward, NYC DEP must continue to maintain and rehabilitate its system’s assets to provide a safe and reliable supply of water, and will come under increased regulatory and public pressure regarding water quality concerns. Meeting these needs will require substantial investment in rehabilitating or repairing the Delaware and Catskill aqueducts, providing a redundant connection between the Kensico Reservoir and the Eastview UV plant, covering Hillview Reservoir, and extensive work on dams and intakes in the reservoir system.
The public is constantly exposed to potentially confusing messages about water quality. Advertising for bottled water, home filtration devices, and nutritional supplements can deliberately or inadvertently cast doubt on tap water quality. Lack of clear knowledge about the causes of common diseases such as cancer can lead to suspicion of any “chemical” in drinking water, food, or air. These concerns are likely to result in either regulatory changes or customer pressures to manage existing and emerging contaminants in the water. Although it seems unlikely, these pressures could lead to further consideration of filtration for the Catskill/Delaware system.
Upcoming Infrastructure Rehabilitation and Construction
The following are identified as critical infrastructure rehabilitation projects that include system upgrades to improve operational flexibility. These upgrades are intended to allow NYC DEP to operate the systems to achieve all system operation goals, including enhancing habitat for fish and wildlife. During critical construction periods of the projects listed below, provisions must be made for some portion of the system being unavailable to provide water.
Catskill Aqueduct Repair and Rehabilitation
In 2018, NYC DEP began a $158 million, three-year project to rehabilitate the northern-most 74 miles of the Catskill Aqueduct (NYC DEP, 2018a). The work includes cleaning the entire length of conduit, repairing an estimated eight leaks in the system, replacing 36 valve chambers, and other structural and mechanical repairs as needed. The work includes shutting down the aqueduct for ten weeks during the autumn in each of the three years. Autumn has the lowest seasonal water demands.
The Catskill Aqueduct currently conveys approximately 590 MGD, but historical records indicate that the aqueduct has had a capacity of 660 MGD. This rehabilitation and cleaning are projected to increase conveyance capacity of the Catskill Aqueduct by 40 MGD. NYC DEP reports that they planned the work on the Catskill Aqueduct in anticipation of a longer shutdown required for the Delaware Aqueduct, discussed below.
Kensico-Eastview8Connection
NYC DEP is currently in the design phase of a $1.2 billion project that will include constructing a new 2-mile-long tunnel between Kensico Reservoir and the Catskill/Delaware UV disinfection facility. This new tunnel will provide additional conveyance of 2.6 BGD between Kensico Reservoir and the UV facility. The project also will include rehabilitation and enlargement of a 100-year-old intake structure at Kensico Reservoir, shoreline improvement of Kensico Reservoir, construction of an interconnecting structure for the Town of Mount Pleasant water supply, upgrades to the chemical feed systems at Kensico Reservoir, and construction of a connection chamber at the UV disinfection facility.
Work for this project is scheduled to begin in 2023 with tunneling expected to start in 2025 and entire project completion scheduled for 2035. The Kensico-Eastview Connection is a requirement of the Consent Decree that the NYC DEP agreed to on March 18, 2019, to cover the Hillview Reservoir by 2049 (DOJ, 2019).
Hillview Reservoir Improvements
Also in the Consent Decree that NYC DEP entered on March 18, 2019 is the requirement to complete Hillview Reservoir improvements. This work, estimated to cost $375 million, is scheduled to be staged concurrently with the Kensico-Eastview Connection and is projected to be complete by 2033. The project includes installation of equipment and controls for flow-paced chemical dosing, replacement of sluice gates and operators that control flow into and out of the reservoir, completion of structural and electrical upgrades to allow the system to continue to operate reliably, and construction of a new hydraulic connection between Hillview Reservoir and City Tunnels 2 and 3. According to the Consent Order9, the Kensico-Eastview Connection and Hillview Reservoir improvements should precede construction of a cover for Hillview Reservoir.
The NYC DEP is required by Consent Decree to cover Hillview Reservoir with the expected completion of the cover for the east basin and west basin in 2042 and 2049, respectively. The estimate for this work in 2009 was $1.6 billion. NYC DEP is required under the federal order to submit plans to the U.S. government and New York State indicating the type of cover to be constructed by April 30, 2025.
Ashokan Century Program
NYC DEP recently announced the Ashokan Century Program, a $750 million plan to upgrade water supply infrastructure at Ashokan Reservoir after being in service for over 100 years. The Ashokan Century Program will include:
- Rehabilitation of Olive Bridge Dam and other flow control structures,
- Upgrade of the valves that regulate flow from the reservoir into the aqueduct,
- Replacement of the bridge that crosses the reservoir, and
- Restoration of the historic monument used by surveyors during construction of the reservoir.
___________________
8 Eastview is a former hamlet and an old place name within Mount Pleasant.
9 See https://www.justice.gov/usao-edny/press-release/file/1144796/download.
The Ashokan Century Program is the largest public works project in the Catskills since the City completed the Catskill system in 1928. Construction of these projects is estimated to start in 2023 and will take approximately ten years to complete.
Delaware Aqueduct Bypass Tunnel
In 2017, NYC DEP initiated tunneling for the Delaware Aqueduct Bypass Tunnel. The project, estimated to cost $1 billion, will create a 2.5-mile bypass around two leaking sections of the Delaware Aqueduct. The bypass tunnel is being constructed 600 feet below the Hudson River between Newburg and Wappinger, New York. Once finished, the bypass tunnel will be connected to structurally sound portions of the existing Delaware Aqueduct to carry water around the leaking section.
The bypass tunnel was excavated by a state-of-the-art tunnel boring machine called NORA. Tunneling was scheduled to take approximately 20 months to complete, and was completed on schedule in August 2019 (NYC DEP, 2019b). Following excavation, the tunnel will be reinforced with steel and lined with concrete. NYC DEP expects to shut down the Delaware Aqueduct for approximately six months in 2022 to connect the bypass tunnel to the Delaware Aqueduct. The Catskill and Croton systems are projected to meet the needs of water consumers in New York City during the shutdown. Repairs to the Delaware Aqueduct are scheduled to be completed in 2023.
Upgrades at Schoharie Reservoir
NYC DEP is continuing rehabilitation of the Schoharie Reservoir. The project includes the construction of a tunnel and valves that will allow NYC DEP to release flow from the reservoir into the Schoharie Creek. The new release works will increase operational flexibility by making it easier for NYC DEP to perform dam maintenance, respond to emergencies, mitigate flood risk for downstream communities, and enhance downstream habitat for fish and wildlife. The $142 million project to build the release tunnel is scheduled to be completed in 2020.
Upcoming Regulatory Considerations
Looking towards the future, several regulatory trends may affect NYC DEP’s watershed protection and treatment programs. These factors may not be FAD or filtration issues per se, but they are important to the larger issues of water supply operation. In addition to regulatory trends, advances in laboratory methods and continued public attention to any water-related potential risk raise issues of how to maintain public confidence in the safety of drinking water.
Per- and Polyfluoroalkyl Substances
In July 2019, NYS DOH indicated that it would issue draft drinking water regulations for per- and polyfluoroalkyl substances (PFAS), proposing MCLs for two of the PFAS: perfluorooctanoic acid and perfluorooctane sulfonate (PFOS) at 10 parts per trillion (ng/L) each. In February 2020, the EPA indicated that it intended to develop standards for the same two PFAS (EPA, 2020). Other states have or are planning drinking water standards for these and other PFAS. Besides these two compounds, several thousand PFAS chemicals are manufactured and used in a variety of industrial and consumer products including nonstick cookware, firefighting foams, and fast-food packaging. PFAS are now practically ubiquitous in the environment. A significant source of these chemicals in the environment has been their use in some firefighting foams, used by the military and airports, but also by local fire departments for fighting oil or gas fires (Cuomo, 2019; EPA, 2019). Although human health data are not available for most PFAS chemicals, some have been linked to potential negative
health outcomes in laboratory animals, including reproductive and developmental, liver and kidney, and immunological effects.10
Sampling within the NYC distribution system conducted as part of the Unregulated Contaminants Monitoring Rule (UCMR3) in 2015–2016 did not detect any of the PFAS chemicals using the required EPA methods and reporting limits. Earlier testing within the watersheds during 2009–2010 for a number of potential contaminants, including pharmaceuticals and personal care products, detected low levels of less than 1 part per trillion (ng/L) of PFOS at Catskill and Delaware key point locations, and less than 3 ng/L in the Croton system (NYC DEP, 2010b). Results from 2019 sampling using more sensitive methods indicated that key points from the Catskill and Delaware aqueducts, as well as water leaving Kensico Reservoir at Shaft 18, had nondetectable levels of PFAS. However, while most results from Kensico tributaries were in the low single-digit range, some streams had sample results as high as 460 ng/L (NYC DEP, 2019c). While these initial test results within the NYC water system are below the proposed drinking water standards, a related issue is how NYC DEP’s wholesale customers will be affected by the regulations. As of 2019, two communities, New Windsor and Newburgh, have detected PFAS in their local water supplies or in areas potentially connected to their supplies, and have chosen to rely entirely on the Catskill Aqueduct for water (Randall, 2019; Sparks, 2018). This decision is creating difficulties within NYC DEP for the necessary rehabilitation work on the Catskill Aqueduct in preparation for the Delaware Aqueduct shutdown to connect the tunnel bypass now under construction, because it limits NYC DEP’s ability to shut down the aqueduct (Rush, 2019).
Current treatment technologies for removing PFAS include granular activated carbon (GAC), ion exchange resins, or high-pressure membranes such as reverse osmosis. All are costly and energy-intensive. For a system as large as NYC’s, it is likely that only GAC would be feasible, and would likely require GAC in the context of a full-scale filtration plant. The PFAS data available do not indicate a need for NYC to consider additional treatment at this time.
Changes to Safe Drinking Water Act Regulations
Proposed changes to the Lead and Copper Rule received prominent attention in November 2019 following several years of attention focused on Flint, Michigan, and other cities including Newark, New Jersey. While the changes are likely to require that NYC DEP focus more attention on lead service lines, and may require further optimization of the system’s corrosion control, they are unlikely to affect the City’s watershed protection programs.
EPA continues to examine DBP national occurrence and potential health risks, most recently by including additional haloacetic acids in the current UCMR. NYC DEP meets all current DBP regulations and has undertaken studies of source water quality and disinfection levels to evaluate the potential for DBP production and to consider reservoir operating procedures to manage DBP production. If EPA lowers current DBP MCLs or adds additional DBPs without commensurately increasing the MCLs, NYC could possibly exceed them. The possibility of source water quality degradation due to nutrient transport into the reservoirs increases the risk of DBP exceedances, and could require additional watershed management efforts. Conversely, the reduction in chlorine use needed to meet regulatory requirements once UV was added have helped reduce DBP levels, and the eventual covering of Hillview Reservoir offers the potential to further reduce chlorination requirements and DBP production. Continued attention to this issue is warranted as water age increases in the system with reductions in water use and as NYC brings on the remaining segments of City Tunnel Number 3.
Algal Issues
Algal toxins from cyanobacteria blooms in water supplies rose to national attention with the 2014 Lake Erie bloom. Cyanotoxins are not regulated at the federal level, but state and federal guidance values provide a benchmark of comparison and public notification. Although not a problem in NYC DEP’s WOH reservoirs at this time, as with DBP formation potential, increased levels of nutrients in reservoirs could lead to growth of harmful algal blooms in the reservoirs. More information on nutrients and algal growth is presented in Chapter 4.
___________________
A related issue is the potential for an increase in taste and odor problems from algal blooms. While taste and odor are not a health concern, drinking water that tastes and smells bad is considered by most water customers to be unacceptable and leads to distrust of the water’s safety and dissatisfaction with the provider’s level of service (Delpla et al., 2020). Particularly as costs rise with investment in system improvements, customer satisfaction will be increasingly important. Recurring taste and odor episodes over several years would likely spur customer demands for additional treatment. NYC’s current Catskill/Delaware treatment system is not designed to remove algal-related tastes and odors; treatment to remove them would likely require filtration with GAC, powdered activated carbon, or ozonation, prevention at the source being key.
Increasing Detection with Improving Methods
Nationwide, water suppliers face a continuing challenge in communicating water safety, especially in light of increasing analytical ability to find lower and lower concentrations of natural and engineered substances in water. Only a few years ago, laboratories could typically detect part-per-million (milligrams/L) and part-per-billion (micrograms/L) levels of most substances, but now analytical sensitivities are a thousandth to a millionth of those values, with detection levels measured in parts per trillion (nanograms/L) or parts per quadrillion (picograms/L). Any substance in use within the watersheds can potentially be detected in source water if the detection limits are low enough. Very small quantities of a substance may have no health significance, but their detection can still create concern among consumers. Compounding the problem is that the science of detection is typically far ahead of the science of health effects. And the creation of credible guidance levels or regulatory limits for comparison with analytical results often lags behind even the science of health effects. The example of PFAS having not been detected in many systems during the UCMR3 testing, but later found as more sensitive analytical methods became available, will likely be repeated for many more contaminants.
Future of Filtration for the Catskill/Delaware System
NYC DEP has known for decades that, ultimately, it could be required to install a filtration plant to treat all water supplied to NYC. Indeed, each reissuance of the FAD has been accompanied by the requirement that NYC DEP be prepared to build a filtration plant to comply with all drinking water regulations. As a result, NYC DEP has always maintained a plan for a filtration plant and conducted studies on several occasions to prepare for the possibility that a treatment plant will become necessary (and mandated).
If a filtration plant must be built, it would be on the Westchester County site that now contains the UV plant treating all water going to NYC. When the UV plant was designed, the likely eventuality that filtration would be required was accounted for in siting the UV facilities. Fitting a full treatment plant onto that site would be challenging but the plans made to date suggest that it is possible. Thoughts about the likely design of a filtration system for the NYC water supply follow.
The most likely design for a NYC filtration plant would be to use granular media. As noted in Box 3-1, the number of granular media filters required depends primarily on three characteristics: the maximum design flow, the design filtration velocity, and the size (area) of each individual filter. Several other design features ultimately must be decided before any treatment plant could be built, but those three can give a sense of the scale of a filtration project that would be required if the NYC DEP decided or was forced to abandon filtration avoidance. The discussion here ignores the possibility that chemical pretreatment and possibly the inclusion of other solid/liquid separation could be required; the removal of algae, algal toxins, or natural organic matter could result in more extensive treatment than simply filtration preceded by chemical addition. In such cases, the constraints imposed by the existing planned site in Westchester County might be too great.
For this exercise, the Committee chose to use a design flow of two BGD (or 3.15 × 10⁵ m3/h), which is approximately twice the average daily flow. The design flow for the UV plant was 2.2 BGD, which was twice the average daily flow at the time of design, but demand has continued to fall since that time, as shown in
Figure 3-5. Designers would normally want the two parts of a plant (UV and filtration) to have the same design flow but the decrease in the average flow in the years between the two designs makes assuming a smaller flow reasonable.
Fifty years ago, a typical design filtration velocity (the flow rate to an individual filter divided by area of the filter) was in the range of 6 m/h, but with advances in knowledge of the role of chemistry in effective filtration, the typical range now is much higher. The rise in filtration velocity has been offset by increasing the depth of the filter and better use of destabilizing chemicals. A NYC filtration plant would likely use a very high filtration velocity, made possible by the head available that will allow gravity flow through deep filters and the high-quality water that would normally need to be treated. For estimating purposes, two filtration velocities are considered: 18 m/h and 30 m/h. The former is at the high end of common practice, whereas the latter has been at least considered for many plants. If filters were designed with a surface area of 100 m2 (a ten-meter by ten-meter square, which would be on the high end of common filter designs), the number of filters required would be 105 at the higher design filtration velocity and 175 at the lower value.
To estimate the land area required on the same site as the UV plant, several assumptions were made, all of which lead to the smallest possible land area. These assumptions include that the plant would utilize “contact filtration” (meaning that no separate flocculation or sedimentation facilities would be needed); chemical addition for particle destabilization would be in existing pipelines upstream of the plant; backwash would be by gravity from elevated storage tanks (allowing smaller pumps than would be necessary if backwashing was done by direct pumping); the post-backwash water would be treated onsite with the residuals hauled away and the cleaner water after treatment recycled into the plant. Each filter requires a built-in channel to collect and remove the backwash water and piping below the filter (but offset horizontally), and these requirements add to the area required directly by the filters. With these assumptions, the minimum land area required would be five times the filter surface area required. For the two different filtration velocities used above, the estimated land areas would be 52,500 m2 for the 30-m/h filtration velocity and 87,500 m2 for the 18-m/h velocity. In perhaps more understandable terms, these values would translate to approximately 10 or 16 football fields, respectively. The depth requirements for filters are not severe—approximately seven to ten meters from the top of the concrete walls of a filter (and adjacent walk area) to the floor of the pipe gallery below the filter. The scale and cost of such a plant would be enormous, making it obvious why the NYC DEP has continuously sought a FAD.
Simple Economic Risk Analysis of Decision to Build a Filter Plant for New York City
The major motivation for New York City’s investments in the Watershed Protection Program is to avoid the costs of building and operating a large filtration plant for water from the Catskill and Delaware watersheds. This section presents a simple exploratory comparison of the likely economic values and costs of adding a filtration plant to the New York City water system.
Costs of Water Quality Failures without Filters.
With or without a filter plant, NYC has some annual probability of water quality failures bad enough to require sizable costs, hazards, or inconvenience to the city’s water users. When delivered water quality does not satisfy standards, outcomes can range from taste and odor impacts to customers, calls to reduce water use dramatically, use of bottled water, business and hospital disruptions, and other inconveniences and damages, perhaps even illness and death for some vulnerable populations. The most serious failures often bring boil-water orders for water supply customers, where users are advised or required to boil water to kill pathogens. This response is required by the SWTR in some cases but is also common in cases of actual or feared pathogen contamination of a drinking water supply.
Here a boil-water order is used as a surrogate consequence for a major drinking water quality failure. The average cost of all likely sizable violations of drinking water standards ranges from $100 to $1,000 per average individual customer per boil-water order, including both customer and utility costs (Corso et al., 2003; Helfin et al., 2014; Wagner et al., 2005). Serving roughly 10 million individuals, NYC would incur a total cost per city-wide boil-water order of $1 billion to $10 billion. (Much smaller costs and far less public health risk would result from lesser taste and odor problems that might not violate drinking water standards.) If the total cost of a boil-water episode is CBW, and the annual probability of a boil-water order without a filtration plant is PNF, then the average annual cost of boil-water failures would be PNF*CBW.
Costs of Failures and Nonfailures with Filtration.
Filtering a water supply brings an annualized cost for the facility and its operation, CF. If filter plant construction costs $10 billion, at a 5 percent discount rate the annualized capital cost is about $500 million/year. The annual operating cost is probably $100-$300 million per year, making annualized total costs for filtration about $600-$800 million/year.
The net filter cost to the city (∆CF) would be a little less, assuming filtration would lead to reductions in NYC’s watershed protection programs. Ending all watershed protection would save less than $100 million/year. Building and operating a filtration plant reduces the annual probability of a boil-water order by some amount, ∆Pf, which must be less than PNF since adding a filter plant can only reduce but not eliminate the probability a drinking water quality failure.
The average annual water quality cost with a new filter plant is the capital and operating costs of the filter plant, plus the lower cost of the now less likely boil-water orders. This is ∆CF + (PNF - ∆Pf)*CBW.
When is it Worthwhile to Build a Filtration Plant?
From a purely economic perspective, the City would build a filtration plant when ∆CF + (PNF - ∆Pf>)*CBW < PNF*CBW. That is to say, when the annual cost of filtration is less than the average cost of likely system failures (major contamination event), a filtration plant would be economically justified. Algebraically, this equation reduces to, ∆CF < ∆Pf*CBW. This relationship is plotted for a range of parameter values in Figure 3-6. Since the annual probability of a major water quality failure today is probably less than 5 percent (0.05) today, it would not be possible for filtration to reduce failure probability by enough to make filtration justifiable without much lower filtration costs or much higher probabilities of water quality failure without filtration.
Even with a 10 percent per year chance of a boil-water order that could be prevented by filtration (the dotted line in Figure 3-6), the costs of filtration would likely exceed its direct benefits. However, if water quality were to deteriorate substantially so that filtration could reduce the expected number of boil-water orders per year by one per year (dashed line in Figure 3-6), then filtration would likely become economical. This explains why cities with poor source water quality filter their water supplies to avoid one or many more boil-water orders per year.
The equation ∆CF < ∆Pf*CBW can be rearranged to ∆CF/CBW < ∆Pf, which is plotted in Figure 3-7, where the line of “Indifference” shows combinations of boil-water order frequency and relative filtration to boil-water order costs where filtration and nonfiltration alternatives have equal average costs. Where the relative costs of filtration exceed the reduction in boil-water frequency from adding filtration, filtration is not likely to be worthwhile. (The “Indifference” line is curved because it is plotted on a log scale for ∆Pf to show a wide range of likelihoods of annual boil-water orders occurring without filtration.)
This plot helps explain why most urban surface water supplies find it economical to filter water. Most urban surface water systems begin with much poorer source water quality and very high probabilities of water quality failure, which are greatly improved at reasonable cost with filtration. New York City begins with very high reliability, which cannot be reduced much further by filtration, making the addition of filtration difficult to justify economically.
Today, filtration does not seem likely to be obviously worthwhile economically for New York City. Filtration is clearly economical, necessary and prudent for many other cities with poor source water quality, remedied economically with filtration. With current watershed conditions in the New York City system, already high water quality can only rarely be improved significantly with filtration—such as low-probability flood events (e.g., Tropical Storms Irene and Lee) when additions of alum are needed to reduce turbidity.
A great reduction in source water quality reliability or a great lowering of the relative costs of filtration would be needed to make filtration of New York City’s water supply economically desirable, balancing benefits and costs. Although great reductions in filtration costs seem unlikely (e.g., new technologies), future reductions in watershed water quality could result from more frequent toxic algal blooms, turbidity episodes, microbial pathogen observations, or changes in climate or land use.
A more detailed set of calculations might be insightful, but this simple calculation illustrates the major crux of the problem. For the time being, avoiding or deferring filtration should help make financial resources available for other public health and economic purposes, such as funding further safeguards or expansions for Hillview Reservoir or other substantial distribution system storage for finished water, and addressing distribution system corrosion problems.
As the climate, watershed, regulatory standards, and treatment technology change, filtration could become more attractive for NYC. Planning and policy decisions should consider that the construction and operation of a filtration plant might require 20 years of effort to complete (Rush, 2019). New York City should always be prepared for filtration, even if filtration is not now economical.
Although a substantially greater probability of major water quality violations would appear to be needed to economically justify filtration, it is likely that social and political preferences or legal requirements could bring filtration well before it becomes justified solely on an economic basis. The public and public health regulators
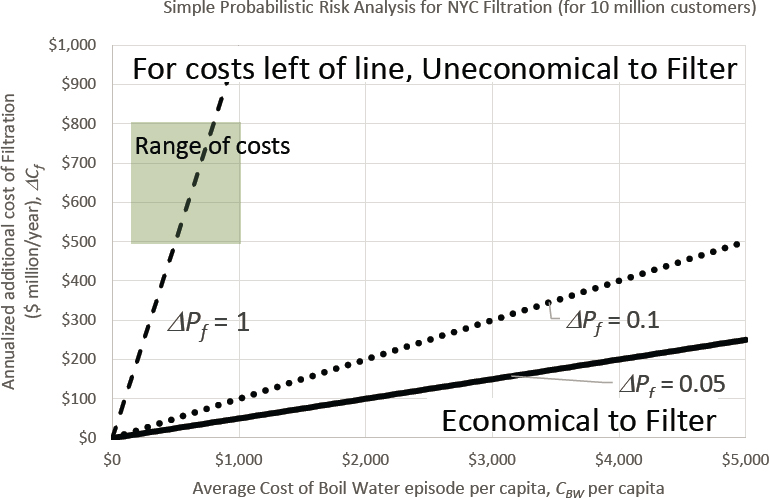
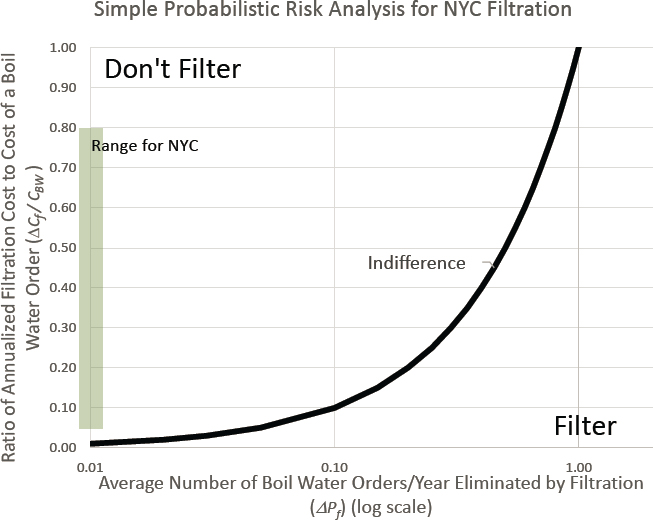
may demand large investments to reduce risks to the lowest attainable level. For now, economic health seems better served by not investing in filtration of water for New York City, and public health is probably better served by other health investments.
CONCLUSIONS AND RECOMMENDATIONS
NYC has a very complex water supply system with many barriers to contamination. Despite the absence of filtration, NYC has high-quality water sources and several layers of treatment, including settling in reservoirs, aided by introduced alum under some conditions, as well as sequential UV and chlorine disinfection before water is distributed to customers. (Water from the Croton system is also filtered.) NYC also takes advantage of its diverse reservoirs, sources, and aqueduct connections upstream of the City, using its OST operations modeling, to improve water quality and reduce the risk of poor quality water entering the City’s lower reservoirs and disinfection plants. Additional efforts are undertaken to detect any waterborne disease outbreaks in the city. This multilayered complexity gives great flexibility and reliability, when well managed by experienced professionals. The following conclusions and recommendations are made in light of this impressive system.
Given the potential loss of highly experienced operators and managers, the New York City Department of Environmental Protection should invest in succession planning and operator professional development. The long time needed to train diverse cohorts of expert operators suggests that succession planning should be formally documented and expected by regulators and higher-level system leaders.
After the completion of Delaware Aqueduct repairs, covering Hillview Reservoir should be a top infrastructure priority. Storage of finished water is essential for ensuring flexibility of systems operations to respond or adapt to stressors and for protecting public health. The lack of adequate finished water storage in the NYC water distribution system greatly increases the vulnerability of NYC water supplies to problems in the watershed. Expediting the project to cover the Hillview Reservoir would further strengthen the water supply system by protecting water immediately after disinfection. Hillview Reservoir should be covered expeditiously, and in advance of the current timeline for doing so.
More aggressive watershed protection efforts may be needed to reduce the likelihood of nutrient levels in the reservoirs creating either algal toxins or unacceptable tastes and odors, which can lead to a loss in customer confidence in water quality and continuing satisfaction with the product. These efforts will also assist in keeping levels of emerging contaminants such as PFAS or existing contaminants such as DBPs below expected regulatory limits.
Embarking on a new large water filtration plant does not yet seem to be the best investment for public health, economic, or environmental objectives. If watershed water quality deteriorates greatly or filtration costs fall greatly, then filtration would become more promising. Because construction of a filtration plant will require time and great expense, New York City and State should regularly revisit this issue.
REFERENCES
Chan, S. 2008. City’s water is ranked best in a taste test. New York Times, August 27. https://www.nytimes.com/2008/08/28/nyregion/28water.html.
Clark, E. J. 1950. New York control curves. Journal of American Water Works Association 42(9):823-827.
Clark, E. J. 1956. Impounding Reservoirs. Journal of the American Water Works Association 48(4):349-354.
Corso, P., M. Kramer, K. Blair, D. Addiss, J. Davis, and A. Haddix. 2003. Cost of illness in the 1993 waterborne Cryptosporidium outbreak, Milwaukee, Wisconsin. Emerging Infectious Diseases 9(4):doi. org/10.3201/eid0904.020417. https://www.ncbi.nlm.nih.gov/pmc/articles/PMC2957981/.
Cuomo, A. M. 2019. Governor Cuomo announces availability of $350 million for water system upgrades statewide and directs Health Department to begin adopting maximum contaminant levels for PFOA, PFOS and 1,4-dioxane. Press Release, July 8. https://www.governor.ny.gov/news/governor-cuomo-an-nounces-availability-350-million-water-system-upgrades-statewide-and-directs.
Delpa, I., C. Legay, F. Proulx, and M. J. Rodriguez. 2020. Perception of tap water quality: Assessment of the factors modifying the links between satisfaction and water consumption behavior. Science of the Total Environment 722:137786.
DOJ (U.S. Department of Justice). 2019. City of New York agrees to settle federal complaint by covering the Hillview Reservoir to prevent contamination of the city’s drinking water supply. Press Release, March 18. https://www.justice.gov/usao-edny/pr/city-new-york-agrees-settle-federal-complaint-covering-hill-view-reservoir-prevent/.
EPA Region 1. 1996. J. DeVillars to T. Coxe, D. Balfour, and D. MacDonald, November 14.
EPA. 1987. 40 CFR Parts 141 and 142: National primary drinking water regulations; filtration and disinfection; turbidity, Giardia lamblia, viruses, Legionella, and heterotrophic bacteria; proposed rule. Federal Register 52(212):42178-42222.
EPA. 1989a. 40 CFR Parts 141 and 142; Drinking water; national primary drinking water regulations; filtration, disinfection; turbidity, Giardla lamblia, viruses, Legionella, and heterotrophic bacteria. Federal Register 54(124):27486-275541.
EPA. 1989b. Guidance Manual for Compliance with the Filtration and Disinfection Requirements for Public Water Systems Using Surface Waters, October 1989.
EPA. 1990. 40 CFR Parts 122, 123, and 124. National Pollutant Discharge Elimination System Permit application regulations for storm water discharges; final rule. Federal Register 55(222):47990-48091.
EPA. 1997. New York City Filtration Avoidance Determination. May.
EPA. 1999. 40 CFR Parts 9, 122, 123, and 124. National Pollutant Discharge Elimination System—regulations for revision of the water pollution control program addressing storm water discharges; final rule. Federal Register 64(235):68722-68851.
EPA. 2019. EPA’s Per- and Polyfluoroalkyl Substances (PFAS) Action Plan. February.
EPA. 2020. EPA announces proposed decision to regulate PFOA and PFOS in drinking water. Press Release, February 20. www.epa.gov/newsreleases/epa-announces-proposed-decision-regulate-pfoa-and-pfos-drinking-water, accessed March 1, 2020.
Flinn, A. D. 1909. The World’s Greatest Aqueduct: Water from the Catskill Mountains to the City of New York. Harper’s Monthly. http://www.catskillarchive.com/rrextra/dnaque.Html.
Galusha, D. 2016. Liquid Assets: A History of New York City’s Water System. Second Edition. Fleischmanns, NY: Purple Mountain Press.
Giannetta, M. 2019. NYC Watershed Regulations. Presentation at Meeting 4 to the NASEM Committee to Review the NYC DEP Watershed Protection Program. Hunter, NY. May 14.
Heflin, C., J. Jensen, K. Miller. 2014. Understanding the economic impacts of disruptions in water service. Evaluation and Program Planning 46(October):80-86.
Kolesar, P., and J. Serio. 2011. Breaking the deadlock: Improving water-release policies on the Delaware River through operations research. Interfaces 41(1):18–34.
Massachusetts Water Resources Authority. 2018. Water Master Plan, 2018. http://www.mwra.com/publications/masterplan/2018/mp-water.pdf.
NASEM (National Academies of Sciences, Engineering, and Medicine). 2018. Review of the NYC DEP Operations Support Tool. Washington, DC: The National Academies Press.
NRC (National Research Council). 2000. Watershed Management for Potable Water Supply: Assessing the New York City Strategy. Washington, DC: The National Academies Press.
NYC DEP. 2010a. New York City Watershed Rules and Regulations 1997, amended April 4, 2010. Rules and Regulations for the Protection from Contamination, Degradation, and Pollution of the New York City Water Supply and its Sources. RCNY Title 15, Chapter 18.
NYC DEP. 2010b. Occurrence of Pharmaceutical and Personal Care Products in Source Water of the New York City Water Supply. May 26.
NYC DEP. 2010c. Water Supply Permit Application. January.
NYC DEP. 2016. Watershed Protection Program Summary and Assessment. March.
NYC DEP. 2017. New York City Water Supply System Reference Guide. April.
NYC DEP. 2018a. DEP announces start of $158 million project to rehabilitate Catskill Aqueduct. Press Release, October 23. https://www1.nyc.gov/html/dep/html/press_releases/18-100pr.shtml#.XeXfiOhKiMo.
NYC DEP. 2018b. NYC water takes first place in regional taste test. Press Release, August 23. https://www1.nyc.gov/html/dep/html/press_releases/18-081pr.shtml#.XePql-hKiMo.
NYC DEP. 2018c. One Water NYC: 2018 Water Demand Management Plan.
NYC DEP. 2018d. Six New York City universities work to reduce water use. Press Release, September 14. https://www1.nyc.gov/html/dep/html/press_releases/18-088pr.shtml#.XevT9uhKiMo.
NYC DEP. 2019a. 2018 Watershed Water Quality Annual Report.
NYC DEP. 2019b. DEP announces major milestone for Delaware Aqueduct repair as tunneling machine completes excavation. Press Release, August 16. https://www1.nyc.gov/site/dep/news/19-062/dep-major-milestone-delaware-aqueduct-repair-tunneling-machine-completes#/0.
NYC DEP. 2019c. Emerging Contaminants Monitoring Project summary. May 15.
NYC Health + Hospitals. 2018. NYC Health + Hospitals/Harlem receives $1.1 million in funding from Department of Environmental Protection for water conservation efforts. April 9. https://www.nychealthandhospitals.org/pressrelease/1-1-million-in-funding-for-water-conservation-efforts.
NYS DEC (New York State Department of Conservation). 2010. Designation Criteria for Identifying Regulated Municipal Separate Storm Sewer Systems (MS4s). Albany NY: NYS DEC.
NYS DEC. 2018. 2018 Section 303(d) List of Impaired Waters Requiring a TMDL/Other Strategy.
Oregon Department of Human Resources. 1992. Health Division, letter to Portland Bureau of Waterworks. January 30.
OHA (Oregon Health Authority). 2018. Annual On-site Watershed Inspection of Portland Water Bureau. February 13.
Park, M. 2017. The top 10 tap water cities in America. Huffington Post, December 6. https://www.huffpost.com/entry/the-top-10-tapwater-cities-in-america_b_8184138.
PWB (Portland Water Bureau). 1991. Letter to Oregon Department of Human Resources, Health Division. December 17.
PWB. 2018. Annual Watershed Control Program Report for Water Year 2018. December.
Randall, M. 2019. New Windsor closing wells after toxic chemicals found. Times Herald Record, May 2. https://www.recordonline.com/news/20190502/new-windsor-closing-wells-after-toxic-chemicals-found.
Rush, P. 2019. The Strategic Vision for New York City’s Source Water Protection Program. Presentation at Meeting 4 to the NASEM Committee to Review the NYC DEP Watershed Protection Program. Hunter, NY. May 13-15.
Sparks, L. 2018. Newburgh “giving up” on reopening primary water supply. Times Herald Record, August 4. https://www.recordonline.com/news/20180814/newburgh-giving-up-on-reopening-primary-water-supply.
Wagner, M. M., G. L. Wallstrom, and A, Onisko. 2005. Issue a boil-water advisory or wait for definitive information? A decision analysis. AMIA Annual Symposium Proceedings 2005:774–778. https://www.ncbi.nlm.nih.gov/pmc/articles/PMC1560439/.


