
3
Restoration Progress
This committee is charged with the task of discussing accomplishments of the restoration and assessing “the progress toward achieving the natural system restoration goals of the Comprehensive Everglades Restoration Plan [CERP]” (see Chapter 1 for the statement of task and Chapter 2 for a discussion of restoration goals). In this chapter, the committee updates the National Academies’ previous assessments of the CERP and related non-CERP restoration projects (NASEM, 2016, 2018; NRC, 2007, 2008, 2010, 2012, 2014). The committee also addresses programmatic and implementation progress and discusses the ecosystem benefits resulting from the progress to date.
PROGRAMMATIC PROGRESS
To assess programmatic progress the committee reviewed a set of primary issues that influence CERP progress toward its overall goals of ecosystem restoration. These issues, described in the following sections, relate to project authorization, funding, and project scheduling.
Project Authorization
Once project planning is complete, CERP projects with costs exceeding $25 million must be individually authorized by Congress before they can receive federal appropriations. Water Resources Development Acts (WRDAs) have served as the mechanism to congressionally authorize U.S. Army Corps of Engineers (USACE) projects. In the 20 years since the CERP was launched in WRDA 2000, five WRDA bills have been enacted:
- WRDA 2007 (Public Law 110-114), which authorized Indian River Lagoon-South, Picayune Strand Restoration, and the Site 1 Impoundment projects;
- Water Resources Reform and Development Act (WRRDA) 2014 (Public Law 113-121), which authorized four additional projects (C-43 Reservoir, C-111 Spreader Canal [Western], Biscayne Bay Coastal Wetlands [Phase 1], and Broward County Water Preserve Areas [WPAs]);
- WRDA 2016 (Title I of the Water Infrastructure Improvements for the Nation Act [WIIN Act]; Public Law 114-322), which includes authorization for the $1.9 billion Central Everglades Planning Project (CEPP). WRDA 2016 also authorized changes to the Picayune Strand Restoration Project related to cost escalations to allow for its completion;
- WRDA 2018 (Public Law 115-270), which authorized the CEPP post-authorization change report, which included the 240,000 acre-foot (AF) Everglades Agricultural Area (EAA) Storage Reservoir; and
- WRDA 2020 (Public Law 116-260), which authorized the Loxahatchee Watershed Restoration Project and combined the EAA Storage Reservoir and CEPP into a single project.
The occurrence of WRDAs every 2 years (since 2014) has ensured that the authorization process does not pose delays on CERP restoration progress.
Authorized CERP projects are sometimes classified by the WRDA bills in which they were authorized—Generation 1 (WRDA 2007), 2 (WRDA 2014), 3 (WRDA 2016 and 2018), and 4 (WRDA 2020), with the Melaleuca Eradication Project, which was authorized under programmatic authority, included in Generation 1.
Funding
Changes in funding can illuminate progress or programmatic constraints on implementation. Funding for Everglades restoration has significantly increased over the past 2 years, achieving rates of funding in fiscal years (FY) 2020 and 2021 (requested) that for the first time exceed the original CERP vision of $200 million of state and $200 million of federal funds annually. The history of federal funding for the CERP is illustrated in Figure 3-1, which includes construction funds and support for planning, design, coordination, and monitoring. After a significant decrease to $44 million in FY 2014, federal funding for the CERP increased to between $70 and $105 million over the 5 years FY 2015-2019. In FY 2020, federal CERP funding totaled $247 million, and $257 million has been requested for FY 2021. These would be only the second and third years (2010 was the first) when federal appropriations met or exceeded funding rates envisioned in the original 1999 CERP plan. Over the most recent 5-year period, FY 2016-2020, for which data are available, federal funding for Everglades restoration (including
SOURCE: Data from SFERTF, 2021.
both CERP and non-CERP efforts) averaged $247 million per year, with $125 million for CERP and $123 million for non-CERP efforts (Figure 3-2).
State budgets for the CERP have sharply increased in recent years, while non-CERP funding has remained steady (Figures 3-1 and 3-2). State CERP funding in FY 2020 reached nearly $373 million and has exceeded $200 million in each of the past 4 fiscal years, consistent with the original CERP vision and more than doubling CERP funding levels compared to the previous 5 fiscal years. State non-CERP funding totaled $602 million in FY 2020 and averaged $593 million over the past 5 fiscal years. Total state restoration funding (CERP and non-CERP) has exceeded $775 million per year since FY 2017, a level last reached in FY 2011. FY 2021 state funding requests for CERP of $264 million and non-CERP of $582 million continue this level of increased state investment in restoration (SFERTF, 2021). These increased levels of both state and federal funding support increased construction progress compared to earlier years, leading to faster restoration of benefits and potentially mitigating ongoing ecosystem degradation.
SOURCE: Data from SFERTF, 2021.
Project Scheduling and Prioritization
The anticipated future progress of CERP projects and the relationships among all the federally funded South Florida ecosystem restoration projects and some highly relevant, state-funded projects are depicted in the Integrated Delivery Schedule (IDS). The IDS is not an action or decision document but rather a communication tool across agencies that provides information to decision makers to guide planning, design, construction sequencing, and budgeting. The schedule is developed by the USACE and the South Florida Water Management District (SFWMD) in consultation with the Department of the Interior, the South Florida Ecosystem Restoration Task Force, and the many CERP constituencies. The IDS replaced the Master Implementation Sequencing Plan, initially developed for the CERP, as required by the Programmatic Regulations (33 CFR §385.31).
Updated versions of the IDS were released in October 2019 (USACE, 2019a) and October 2020 (USACE, 2020c). The 2019 IDS was the focus of the committee’s analysis based on the release of the 2020 IDS late in the review process,
but many of the issues discussed here remain relevant to the 2020 IDS. The reporting horizon for the 2019 and 2020 schedules remains only through 2030 as in the previous July 2018 IDS. The most significant programmatic change compared to the 2018 IDS was an expanded and more detailed depiction of the CEPP that includes the EAA Storage Reservoir authorized in WRDA 2018. The expanded CEPP depiction is broken into three components: CEPP South, which removes barriers to flow in the southern half of the remnant Everglades; CEPP North, which addresses barriers to flow in northern Water Conservation Area 3A (WCA-3A); and CEPP New Water, which provides increased water storage and treatment to facilitate increased flows into the Everglades. An updated status of project implementation as of August 2020 is shown in Table 3-1, with expected completion dates based on the 2020 IDS.
Key limitations of the IDS noted in NASEM (2016, 2018) remain in the 2019 IDS. First, it is difficult to discern individual project costs or essential dependencies among projects. Second, the IDS does not include the full set of anticipated CERP projects in the schedule—only project components scheduled through 2030—potentially providing a false impression of when the CERP will be completed.1 Third, although the Programmatic Regulations require RECOVER to assess any changes in the master schedule “for effects on achieving the goals and purposes of the Plan and the interim goals and targets,” this is not being done. Communicating the effects of schedule changes on the nature and timing of anticipated ecosystem benefits could improve decision making, particularly in the context of current ecosystem trends and new pressures such as sea-level rise and harmful algal blooms, and potentially lead to shifts in priorities to maximize regional benefits.
Of greater concern, the October 2019 IDS notes: “The funding shown for FY20 and beyond is only notional, representing approximate funding levels that would be needed to sustain the work displayed in the IDS for a particular FY. The funding does not represent a commitment by the Administration to budget the amounts shown.” This approach is a significant change from previous IDSs, which compounds the already false impression that the CERP will be completed in 2030. The October 2019 IDS indicates that $4.1 billion in total construction costs will be needed over the next 5 years (FY 2021-2025) or an average of $818 million per year. For comparison, the combined state and federal CERP funding averaged only $257 million per year over FY 2015-2019 and $344 million per year over FY 2016-2020 (Figure 3-1). This pattern suggests that realistic funding
___________________
1 The 2020 IDS does include a list of all CERP projects and classifies them in the following categories: complete, authorized/design/construction, pending, planning/feasibility study, and deauthorized.
TABLE 3-1 CERP or CERP-Related Project Implementation Status as of June 2020
| Project or Component Name | Yellow Book (1999) Estimated Completion | IDS 2020 Estimated Completion | Project Implementation Report Status | Authorization Status | Construction Status | Ecosystem Benefits Documented to Date |
|---|---|---|---|---|---|---|
| GENERATION 1 CERP PROJECTS | ||||||
| Picayune Strand Restoration (Fig. 3-3, No. 2) | 2005 | 2024 | Submitted to Congress, 2005 | Authorized in WRDA 2007 | Ongoing | Increased water levels in 20,000 acres and with early vegetation responses detected |
| Site 1 Impoundment (Fig. 3-3, No. 3) | 2007 | Submitted to Congress, 2006 | Authorized in WRDA 2007 | |||
| - Phase 1 | Completed | Completed, 2016 | ~16% reduction in seepage loss | |||
| - Phase 2 | Not specified | Phase 2 requires further authorization | Not begun | NA | ||
| Indian River Lagoon-South (Fig. 3-3, No. 4) | Submitted to Congress, 2004 | Authorized in WRDA 2007 | ||||
| - C-44 Reservoir/STA | 2007 | 2021 | Ongoing | None to date | ||
| - C-23/24 Reservoirs/STA | 2010 | 2030 | Not begun | NA | ||
| - C-25 Reservoir/STA | 2010 | 2030 | Not begun | NA | ||
| - Natural Lands | NA | Not specified | Not begun | NA | ||
| Melaleuca Eradication and Other Exotic Plants (Fig. 3-3, No. 5) | 2011 | NA | Final June 2010 | Programmatic authority WRDA 2000 | Construction completed 2013, operations ongoing | Increased capacity for biocontrol |
| GENERATION 2 CERP PROJECTS | ||||||
| C-111 Spreader Canal Western Project (Fig. 3-3, No. 6) | 2008 | Not specified | Submitted to Congress, 2012 | Authorized in WRRDA 2014 | Mostly complete; S-198 structure not yet constructed | Current data insufficient to assess response to project |
| Biscayne Bay Coastal Wetlands (Phase 1) (Fig. 3-3, No. 7) | 2018 | 2024 | Submitted to Congress, 2012 | Authorized in WRRDA 2014 | Ongoing | Some wetland vegetation responses to freshwater inputs |
| C-43 Basin Storage: West Basin Storage Reservoir (Fig. 3-3, No. 8) | 2012 | 2023 | Submitted to Congress, 2011 | Authorized in WRRDA 2014 | Ongoing | None to date, construction ongoing |
| Broward County WPAs (Fig. 3-3, No. 9) | Submitted to Congress, 2012 | Authorized in WRRDA 2014 | ||||
| - C-9 Impoundment | 2007 | After 2030 | Not begun | NA | ||
| - C-11 Impoundment | 2008 | 2027 | Not begun | NA | ||
| - WCA-3A & -3B Levee Seepage Management | 2008 | 2027 | Not begun | NA | ||
| GENERATION 3 CERP PROJECTS | ||||||
| Central Everglades Planning Project (Fig. 3-3, Nos. 10, 11, and 12) | NA | Submitted to Congress, 2015 | Authorized in WRDA 2016, 2018 | NA | ||
| - CEPP South | 2027 | Ongoing | ||||
| - CEPP North | 2026 | Not begun | ||||
| - CEPP New Water (incl. EAA Reservoir) | 2027 | Ongoing | ||||
| Project or Component Name | Yellow Book (1999) Estimated Completion | IDS 2020 Estimated Completion | Project Implementation Report Status | Authorization Status | Construction Status | Ecosystem Benefits Documented to Date |
|---|---|---|---|---|---|---|
| GENERATION 4 CERP PROJECTS | ||||||
| Loxahatchee River Watershed (Fig. 3-3, No. 13) | 2013 | Not specified | Submitted to Congress, 2020 | Authorized in WRDA 2020 | Not begun | NA |
| CERP PROJECTS IN PLANNING OR NOT YET AUTHORIZED | ||||||
| Lake Okeechobee Watershed (Fig. 3-3, No. 14) | 2009-2020 | NA | Final PIR, Aug. 2020 | NA | NA | NA |
| Western Everglades (Fig. 3-3, No.15) | 2008-2016 | NA | In development | NA | NA | NA |
| Biscayne Bay Southeastern Everglades Ecosystem (Figure 3-3, No.16) | 2008-2020 | NA | In development | NA | NA | NA |
| REMAINING UNPLANNED CERP PROJECTS | ||||||
| WCA Decompartmentalization (Phase 2) | 2019 | NA | NA | NA | NA | NA |
| Everglades National Park Seepage Management | 2013 | NA | NA | NA | Partly addressed by LPA Seepage Management Project | NA |
| C-43 ASR | 2012 | NA | NA | NA | NA | NA |
| Site 1 Impoundment ASR | 2014 | NA | NA | NA | NA | NA |
| Palm Beach Agricultural Reserve Reservoir | 2013 | NA | NA | NA | NA | NA |
| Central Lake Belt Storage Area | 2021-2036 | NA | NA | NA | NA | NA |
| WCA-2B Flows to Everglades National Park | 2018 | NA | NA | NA | NA | NA |
| WPA Conveyance | 2036 | NA | NA | NA | NA | NA |
| Caloosahatchee Backpumping with Stormwater Treatment | 2015 | NA | NA | NA | NA | NA |
| A.R.M. Loxahatchee National Wildlife Refuge Internal Canal Structures | 2003 | NA | NA | NA | NA | NA |
| Broward Co. Secondary Canal System | 2009 | NA | NA | NA | NA | NA |
| Henderson Creek – Belle Meade Restoration | 2005 | NA | SW Florida Comprehensive Watershed Plan, 2015 | NA | NA | NA |
| Southern CREW | 2005 | NA | NA | NA | NA | NA |
| Florida Bay Florida Keys Feasibility Study | 2004 | NA | Study terminated in 2009 | NA | NA | NA |
| Comprehensive Integrated Water Quality Plan | 2006 | NA | NA | NA | NA | NA |
NOTES: Table 3-1 does not include non-CERP foundation projects. NA = not applicable. Remaining unplanned CERP projects include all projects more than $5 million (2014 dollars) as reported in USACE and DOI (2016), for which the components have not been incorporated in other planning efforts. Lake Trafford Restoration has been removed from the CERP and will be completed by the SFWMD.
SOURCES: NASEM, 2018; USACE, 2020c, E. Velez, USACE, personal communication, 2020; N. Hooseinny-Nabibaksh, SFWMD, personal communication, 2020.
SOURCE: International Mapping Associates. Reprinted with permission; copyright 2021, International Mapping Associates.
constraints could double or even triple the expected time frame for completing the projects currently included in the IDS.
In response to concerns expressed by the Task Force about the funding assumption underlying the October 2019 IDS, two additional hypothetical funding scenarios reflecting more realistic funding levels were presented at the May 7, 2020, Task Force meeting (Childress, 2020). These alternative scenarios illustrate how annual funding rates affect the pace of restoration.
An underlying assumption in the October 2019 IDS is that the rate of funding does not affect the optimal prioritization of projects. This assumption is maintained in the alternative funding scenarios (Childress, 2020). The validity of this assumption is questionable, and its potential implications are a cause for concern. The rate of funding clearly determines the pace (time frame) of restoration. It is well understood that the system is continuing to degrade over time and that the rates of degradation vary across system components (NRC, 2012). Some elements of the ecosystem are in poor condition, but those elements could recover on relatively rapid time frames when improved conditions are provided (e.g., periphyton), while the degradation of other elements (e.g., peat loss) may not be recoverable on human time frames. Additionally, system inputs (e.g., temperature, rainfall) and boundary conditions (e.g., sea-level rise) are changing over time. All of which would argue that restoration benefits are likely time dependent and optimal project prioritization should reflect these dependencies.
If, in fact, optimal project prioritization is time dependent, then the 2019 IDS is misleading and inconsistent with the assertion that “the IDS synchronizes program and project priorities with the State of Florida and achieves the CERP restoration objectives at the earliest practicable time, consistent with funding constraints and the interdependencies between project components” (italics added). The IDS sidesteps the difficult but essential CERP interdependency scheduling decisions associated with realistic funding constraints. In the face of funding levels less than those identified in the current IDS, should all projects move forward simultaneously, but more slowly, or should some projects be prioritized over others to expedite benefits? The May 2020 alternative funding scenarios reflect a path of merely moving forward more slowly. Development of the IDS could serve as a means to debate these challenging decisions with the multiple CERP agencies and stakeholders. Uncertainty of funding (which occurs on regular basis) necessitates evaluation of realistic and alternative levels of funding with consideration of the many time-dependent factors that may affect an optimal project prioritization.
NATURAL SYSTEM RESTORATION PROGRESS
In the following sections, the committee focuses on recent information on natural system restoration benefits emerging from the implementation of CERP and major non-CERP projects. The discussions of progress that follow are organized based on geography and describe CERP projects, non-CERP projects, and CERP projects in planning for:
- Central and western Everglades,
- Lake Okeechobee and the northern estuaries, and
- The southern estuaries.
The findings and conclusions are based on reported monitoring data to date for CERP projects for which construction has begun, with emphasis on progress and new information gained in the past 2 years. The committee’s previous report (NASEM, 2018) contains additional descriptions of the projects and progress up to July 2018. The South Florida Environmental Report (SFWMD, 2020) and the 2018 Integrated Financial Plan (SFERTF, 2018) also provide detailed information about implementation and restoration progress. Following these regionally based discussions, the committee reviews systemwide evaluation of the state of the South Florida ecosystem.
Central and Western Everglades: CERP Projects
This section includes CERP projects with sufficient construction progress that they are affecting remnant Everglades and western Everglades, located south of Lake Okeechobee. These projects include the C-111 Spreader Canal (Western) Project, Picayune Strand Restoration Project, the Melaleuca Eradication Project, and the Site 1 Impoundment. Early construction progress on the CEPP is also briefly discussed.
C-111 Spreader Canal Western Project
The C-111 Canal (Figure 3-3, No. 6) is the southernmost canal for the entire Central and Southern Florida (C&SF) Project. The canal system (Figure 3-4) was engineered in the 1960s, expanding upon a remnant canal designed to transport solid fuel moon rockets from the AeroJet General Corporation. Originally designed to provide flood protection in Dade County, the C-111 Canal spurred agricultural development on lands to the east while draining water from the Southern Glades and Taylor Slough in Everglades National Park. A principal source of the freshwater in the canal is seepage from Everglades National Park.
SOURCE: Qui et al., 2018.
Because seepage drains water from the park and alters the flow pattern of Taylor Slough, it has potentially deleterious ecological and environmental effects on Taylor Slough and Florida Bay. The C-111 Canal also discharges large volumes of freshwater through the S-197 structure into Manatee Bay and Barnes Sound, while reducing overland flows that entered the central zone of Florida Bay, altering the natural salinity regime and ecology of those waters (see also Chapter 5).
The construction of the C-111 Spreader Canal Project was envisioned in two phases—the western and eastern projects. The C-111 Spreader Canal Western Project, working in concert with the non-CERP C-111 South Dade Project and the SFWMD Florida Bay Initiative to the north, was designed to retain water in Taylor Slough and improve the quantity, distribution, and timing of flow into eastern Florida Bay (USACE and SFWMD, 2011a). The project creates a 6-mile-long hydraulic ridge along the eastern boundary of Everglades National Park to reduce seepage from the park and improve the hydrology of Taylor Slough. The
project also includes canal modifications to reduce canal flows into eastern Florida Bay. To create this hydraulic ridge, excess canal water is pumped into the Frog Pond Detention Area through S-200 (see Figure 3-4) and the Aerojet Canal impoundment (through S-199) to the west of the canal. This water will seep into the ground and later flow back into the canal. However, the hydrologic ridge element only functions when water is available to fill the detention areas. The project was largely completed in February 2012, and operations began in June 2012. One major authorized component—the S-198 structure in the lower section of the C-111 Canal—remains to be completed. According to the 2020 IDS, this last component is to be completed by 2025 (USACE, 2018b). Planning for the second project, the C-111 Spreader Canal Eastern Project, began in mid-2020 as part of the Biscayne Bay-Southern Everglades Ecosystem Restoration (BBSEER) Project (USACE and SFWMD, 2020b).
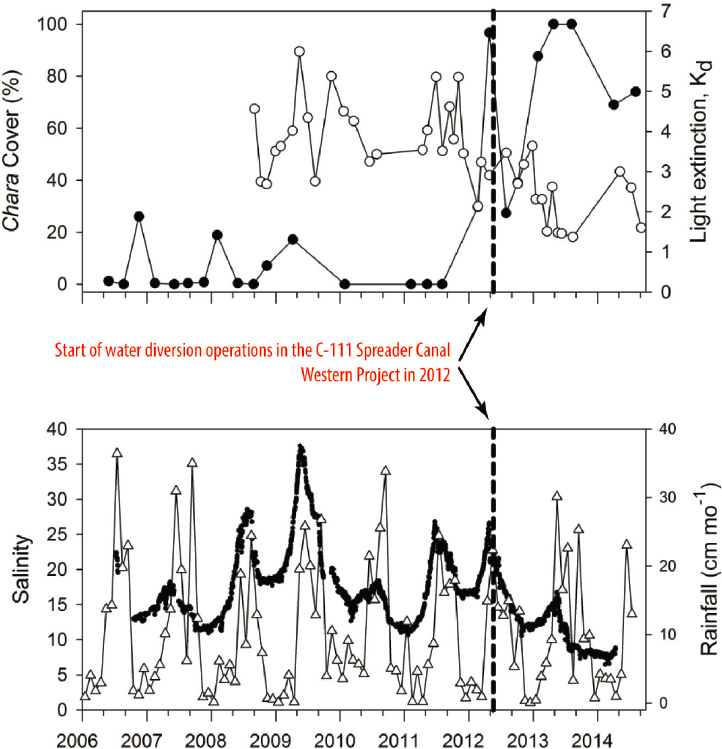
In its last report (NASEM, 2018), the committee discussed the difficulty in assessing progress from this project due to the lack of rigorous analysis of monitoring data, considering interannual variability in precipitation and expected performance. These challenges continue, and the committee was unable to obtain new data analyses that resolved these issues, even when examining the collective response of the multiple CERP and non-CERP projects in this region. Some data highlight potential positive trends with the onset of the project related to water levels and salinity in coastal lakes. For example, in West Lake, at the western edge of Taylor Slough, the cover of Chara, a desirable microalgae, has increased, and it appears that spikes in salinity in the coastal lakes in the same region have decreased in severity since 2012 (Figure 3-5). However, without more rigorous trend analysis across the system it is difficult to draw definitive conclusions about the benefits of the project at this time, particularly given interannual variation in precipitation. This conclusion is consistent with the findings from NASEM (2018). High variability, natural and confounding factors (sea-level rise, changes in weather), and the effects of nearby non-CERP projects (e.g., C-111 South Dade [see Chapter 4]) continue to make it difficult to effectively quantify the benefits of this CERP project on Florida Bay. These issues point out the need to evaluate monitoring programs and study designs through rigorous assessments to evaluate whether they can establish restoration progress with known certainty. This need is especially important when monitoring plans change due to reductions in budget.
SOURCE: Sklar et al., 2019. Reprinted with permission; copyright 2019, Oxford University Press.
Picayune Strand Restoration
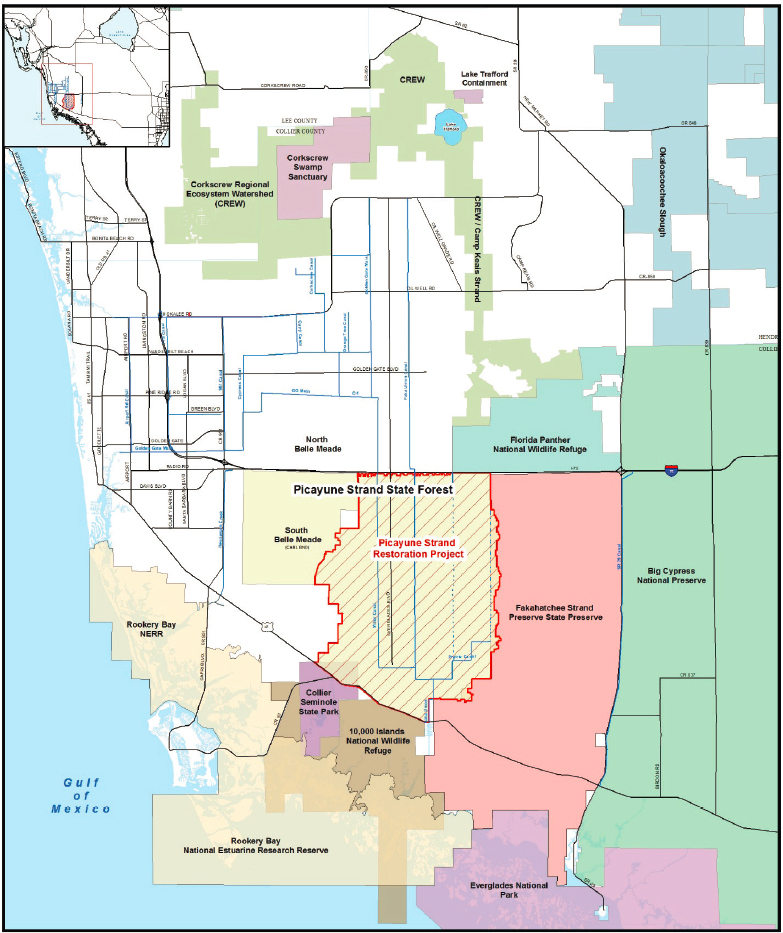
The Picayune Strand Restoration Project, the first CERP project under construction, focuses on an area in southwest Florida substantially disrupted by a real estate development project that drained 55,000 acres (about 86 mi2) of wetlands before being abandoned (Figure 3-3, No. 2). The roads and drainage disrupted sheet flow into Ten Thousand Islands National Wildlife Refuge, altered regional groundwater flows in surrounding natural areas, and drained a large expanse of wetland habitat (Figure 3-6).
The primary objective of the Picayune Strand Restoration Project is to “establish the pre-development hydrologic regime, including wet and dry season water levels, overland sheet flow, and hydroperiod” (RECOVER, 2014). An array of ecological objectives is dependent on the restoration of hydrology. Hydrologic restoration involves filling at least 50 percent of the length of the larger canals and several smaller ditches draining the area. The project also requires eliminating impediments to reestablishing sheet flow by removing more than 250 miles of raised roads and logging trams and plugging more than 40 miles of canals. There has been considerable progress in constructing the Picayune Strand Restoration Project, including canal plugging, road removal, and construction of pump stations, although it was necessary to add features to maintain flood protection to neighboring developed areas, which extended the time frame for project completion (Table 3-2). The ecosystem responses expected to arise from hydrologic restoration include the reestablishment of natural plant distribution and composition, increase in fish and wildlife resources, improved habitat for listed species, and greater ecological connectivity to adjacent public lands (USACE and SFWMD, 2004a). To achieve these benefits, the project requires not only the restoration of natural hydropatterns, but also the control of exotic, invasive, and nuisance plants and reestablishment of a natural fire regime in the Picayune Strand State Forest. The project is also expected to improve estuarine conditions in the Ten Thousand Islands region by reducing canal discharges to Faka Union Bay and increasing freshwater flows to Blackwater Bay and Pumpkin Bay (USACE and SFWMD, 2004a).
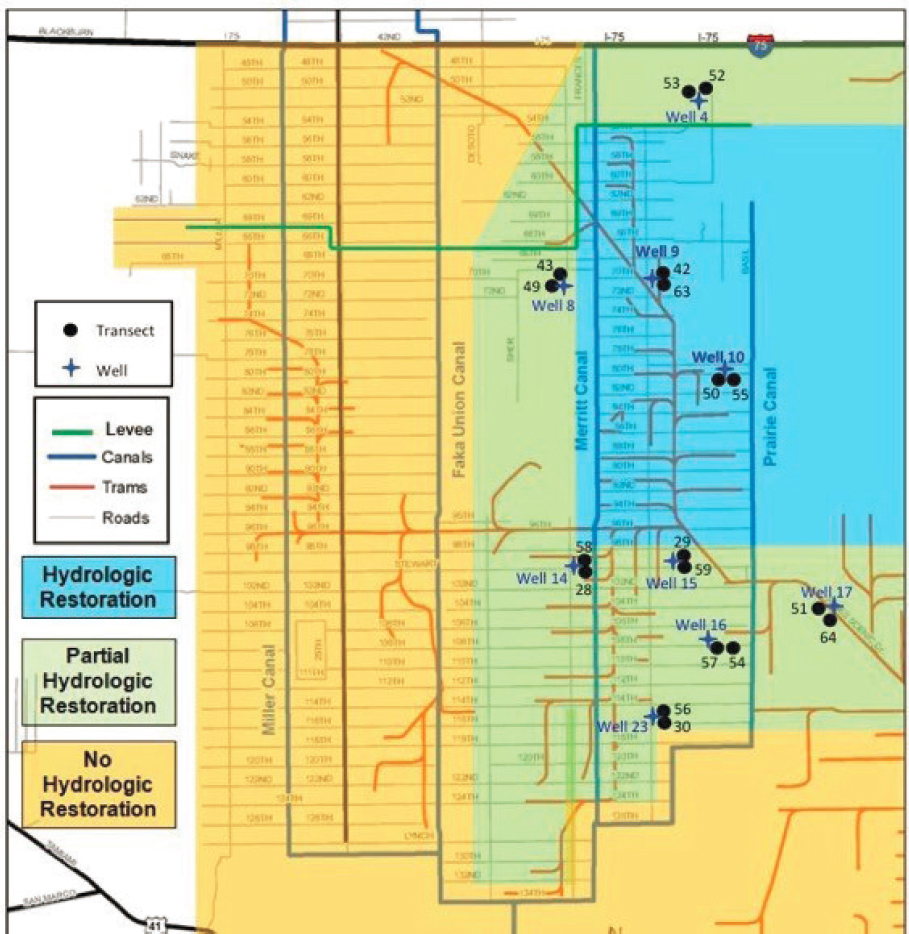
Because hydrologic restoration is a prerequisite for ecological restoration, hydrologic monitoring should provide the first signals of restoration progress. A robust monitoring effort for both hydrologic and ecological objectives (USACE and SFWMD, 2009) was established in 2009, although the monitoring plan was reduced in 2014 as part of budget reductions (M. Duever, Natural Ecosystems, personal communication, 2020). Currently, the hydrologic monitoring has delineated the project area into three levels of hydrologic restoration achieved to date—full, partial, and no hydrologic restoration—determined based on the project components constructed and the local influences of neighboring canals
SOURCE: Chuirazzi et al., 2018.
TABLE 3-2 Phases and Progress of the Picayune Strand Project
| Lead Agency | Road Removal (mi) | Logging Tram Removal | Canals to Be Plugged (mi) | Other | Project Phase Status | |
|---|---|---|---|---|---|---|
| Tamiami Trail Culverts | State | NA | NA | 17 culverts constructed | Completed in 2007 | |
| Prairie Canal Phase | State (expedited) | 64 | 30 | 7 | Hydrologic restoration of 11,000 acres in Picayune Strand and 9,000 acres in Fakahatchee Strand State Preserve Park | Plugging and road removal completed in 2007; logging trams removed in 2012 |
| Merritt Canal Phase | Federal | 65 | 16 | 8.5 | Merritt pump station, spreader basin, and tie-back levee constructed | Completed in 2015; pump station transferred to SFWMD in 2016 |
| Faka Union Canal Phase | Federal | 81 | 11 | 7.6 | Faka Union pump station, spreader basin, and tie-back levee constructed | Roads removed in 2013; pump station completed in 2017; upper 3 miles canal plugging scheduled for 2021. The rest is scheduled for 2025 |
| Miller Canal Phase | Federal/state | 77 | 11 | 13 | Construct pump station, spreader basin, tie-back levee, and private lands drainage canal; remove western stair-step canals | Miller pump station completed June 2019; road removal and canal plugging TBD, respectively |
| Manatee Mitigation Feature | State | 0 | 0 | 0 | Construct warm water refugium to mitigate habitat loss | Completed in 2016 |
| Southwestern Protection Feature | Federal | 0 | 0 | 0 | Construct 7-mile levee for flood protection of adjacent lands | Construction completion scheduled for 2024 |
| Eastern Stair-step canals | Federal | 0 | 0 | 5.2 | Plugging completion expected in 2021 |
SOURCE: J. Starnes, SFWMD, personal communication, 2016; Chuirazzi et al., 2020; J. Weaver, SFWMD, personal communication, 2020.
SOURCE: Chuirazzi et al., 2018.
on water levels (see Figure 3-7). Since construction has begun, ecological monitoring has been focused on areas with full or partial hydrologic restoration, utilizing reference sites in neighboring Fakahatchee Strand Preserve State Park and Florida Panther National Wildlife Refuge (Barry et al., 2017, 2019; Worley et al., 2017).
Hydrologic restoration progress.
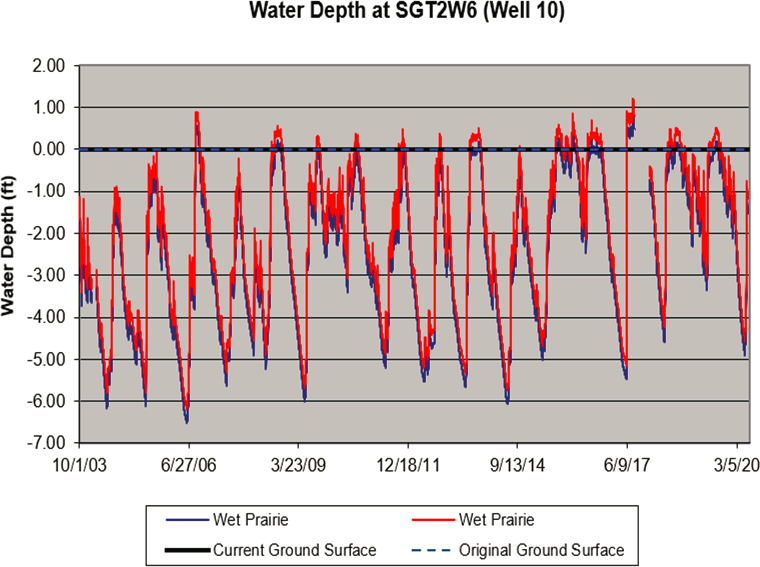
Patterns of lengthening hydroperiod (days per year that water levels are at or above ground surface) appear to follow restoration progress, with the largest gains demonstrated at wells in the fully restored areas. For example, it appears that there has been a lengthening hydroperiod in the upper reach of the Prairie Canal (Well 10 in Figure 3-7) almost immediately after plugging the Prairie Canal (2004 through 2007) and further lengthening after the filling of the neighboring Merritt Canal in 2015, when the area was considered to be fully restored (Figures 3-8 and 3-9). Records from this
SOURCE: M. Duever, personal communication, 2020. Reprinted with permission; copyright 2020, M. Duever.
SOURCE: M. Duever, personal communication, 2020. Reprinted with permission; copyright 2020, M. Duever.
area for 1997-2004 indicated a lack of recorded standing water, in contrast to the significant hydroperiods observed in 2008, 2013, and the fall and winters of 2015 through 2020. A partially restored area along the Merritt Canal (Well 8 in Figure 3-7) appears to be responding to the canal plugging and removal of roads and logging trams completed in 2015 (Figure 3-10). This area had no significant periods of inundation until 2015 and 2016, in which the completion of restoration activities coincided with above average rainfall years.
Reports of improvement have been visual and not evaluated quantitatively against expectations from models (considering factors such as timing and distribution of rainfall, temperature, wind, humidity, evapotranspiration rates, as well as changes in vegetation). Hydroperiod targets are available for primary plant communities, and it is expected that Picayune Strand restoration will increase hydroperiods in these communities. Estimation of hydroperiods in two vegetation transects near Well 10 suggests that since 2015 there have been improvements in
SOURCE: M. Duever, personal communication, 2020. Reprinted with permission; copyright 2020, M. Duever.
hydroperiods for hydric flatwood and wet prairie communities (although recent data suggest the targets were not met in the southern region) (Figure 3-9). As restoration proceeds and the eastern stairstep canals are plugged, it is expected that hydroperiods will increase further in this area. These early indicators of restoration progress could be easily communicated to the public through simple metrics and figures; by not communicating these metrics more broadly, the CERP is missing an opportunity to highlight the progress made.
Ecological restoration progress.
The monitoring of flora and fauna also suggests some ecological improvements in the restored areas. Restoration work began in 2004, and 63 vegetation transects were established in 2005 to assess restoration progress. These transects have been irregularly sampled six additional times since 2005. The most recent vegetation monitoring analysis (Barry et al., 2019) used data through 2018 from 18 of these transects located in the restored
areas (and 9 control transects) to describe results for vegetation transects in three types of predrainage habitat—cypress, wet prairie, and pineland—which are reported by four strata (i.e., vertical layers of vegetation): canopy trees, subcanopy trees, the shrub layer, and groundcover.2 Their report summarized vegetation monitoring data using vegetation indices, multivariate ordination methods, and observations.
The vegetation monitoring results provide an emerging trajectory of restoration, although few definitive conclusions can be drawn from the data. Across all habitat types, short-term changes are most evident in the groundcover stratum, as should be expected. Comparisons of the groundcover in the wet prairie habitat between 2005, 2016, and 2018 show evidence of recovery toward typical wetland vegetation. One index used to summarize vegetation change is the wetland affinity index (WAI),3 which represents an artificial index of dominance by hydrophytic (inundation-tolerant) vegetation species, over three different habitat types. By 2016, WAI averages in wet prairie transects became more similar to reference transects, which represent the target restoration conditions (Figure 3-11). Mean WAI values in restored transects in pinelands have increased only slightly and are closer to the reference mean WAI but have not increased much since 2005. A possible reason for the small increase is that the restored transects occur in areas with partially restored hydrology. In addition, the pinelands have the highest elevations, so hydrologic changes would not be expected to result in significant changes. As expected because of the slow growth of cypress, cypress habitats show little improvement; cypress habitats could take decades to show a significant response. Indices such as WAI are generalizations of the vegetation community as data from a number of species are combined. The index may ignore the importance of critical species or the actual composition of species.
Other summaries and analysis by Barry et al. (2019) indicate the importance of controlled fire that removes overgrowth of shrubs and reduces cabbage palm seedling recruitment and survival. The cabbage palm is the key invasive species because drainage created conditions that enabled it to establish, and restoration of hydrology will not eliminate it. Increased inundation in wet prairie habitat may be responsible for reductions in the invasive Brazilian pepper density in one transect and favorable changes in wetland species in another transect.
___________________
2 Canopy trees consist of woody plants with a diameter at breast height (dbh) greater than 10 cm; subcanopy trees consist of woody plants with a dbh between 2.5 and 10 cm, excluding woody shrubs; the shrub layer consists of trees with a dbh of less than 2.5 cm and all shrub individuals; and groundcover consists of all remaining plants and primarily herbaceous species.
3 The wetland affinity index is calculated as the probability that an observed species generally occurs within wetlands times the relative frequency of occurrence, summed over the species detected in the quadrant or transect.
NOTE: “Control” here describes the reference sites.
SOURCE: Data from Barry et al., 2019.
Monitoring data from 2016 and 2018 for faunal indicators (e.g., treefrogs, aquatic macroinvertebrates, and fish) show a system that is generally in transition from short hydroperiods to more sustained surface-water inundation. However, there is high variability among individual sites and over time (Ceilley et al., 2020; Worley et al., 2017), which makes identification of significant differences between restored, partially restored, and nonrestored sites more difficult to detect using the faunal indicators. Macroinvertebrate data, for example, were evaluated using multivariate analysis and indices such as species richness, evenness, and diversity indices. Although there is some indication of improvements in some restored sites (i.e., grasses and cypress) associated with hydroperiod restoration, high variability and adverse environmental conditions (a shortened hydroperiod and dry October sampling sites) weakened inferences for other groups of sites (Ceilley et al., 2020).
Invasive species continue to be a problem in Picayune Strand, and there is an ongoing effort to map the extent of invasive species and control their expansion (Barry et al., 2017). The recent survey was reduced in scope due to lack of funding (Barry, 2019). More than 100 invasive species have been documented and 64 mapped, and the results show that management success has been mixed. Although some invasives have been partially controlled, torpedograss and cattail increased steadily in both the Prairie and Merritt Canal Phases because of
an inability to treat these species due to weather and budget constraints (Barry, 2019). It is expected that increased inundation will reduce these invasives. Woody plants such as Brazilian pepper and cabbage palm continue to be problematic.
The aquatic fauna monitoring data provide striking evidence of the challenges from invasive species on understanding ecological responses to restoration. For example, there was no statistically significant difference in treefrog composition between reference and restored sites largely because the exotic Cuban treefrog is outcompeting native species across all sites. Fish composition showed a similar challenge, with the postrestoration study documenting the presence of the non-native African jewelfish across both reference and restored sites; the species was not present in baseline studies.
Effects of fire management on restoration progress.
Fire, as either controlled burns or wildfire, is an important factor determining understory vegetation. Barry et al. (2019) considered controlled burns to be as important as hydrologic restoration. In pinelands, for example, fire is necessary to control the growth of shrubs and provide opportunity for germination and growth of pine. Prior to restoration, drainage resulted in drier habitats that were significantly affected by wildfires, and the combination of drainage and fire increased the spread of fire-tolerant invasive species, such as cabbage palm and Brazilian pepper (Barry et al., 2019). Controlled burns are especially important in these areas to help limit the germination and growth of invasive species. Barry et al. (2019) indicated that the reference transects (i.e., target conditions) experience greater fire frequency, which reduces cabbage palm seedling success and understory shrubs. Various metrics associated with fire events are not routinely recorded and maintained in a database (with the exception of Florida Panther National Wildlife Refuge) because of lack of systematic reporting by the fire management agencies even though these data are critical for interpretation of changes in vegetation. Fires also affect the monitoring of restoration response, including destruction of sampling devices and harm to vegetation from vehicles and control procedures. Transects with different fire histories will also show different vegetative responses.
Issues and opportunities with monitoring and evaluation of success.
Reports and discussion from those evaluating monitoring data raise a number of concerns about the monitoring programs and their continuity (examples provided in Table 3-3; see also Ceilley et al., 2020). As currently designed, there is little evidence that restoration success can be determined with any certainty for indicators beyond hydroperiod. Several improvements to the ecological monitoring program would enhance evaluations of restoration progress and better support adaptive management. NASEM (2018) also discussed improved monitoring and assessment strategies to more rigorously demonstrate early restoration success.
TABLE 3-3 Examples of Issues That Have Reduced the Effectiveness of the Monitoring Program at Picayune Strand
| Issue | Examples |
|---|---|
| Sampling protocols and investigator training vary | Macroinvertebrate sampling intensity and identification have varied with researcher |
| Sampling methods are biased toward some species | Beder fish traps attract the invasive African jewelfish; Auran sampling method is biased toward one species |
| Increased hydroperiod reduces ability to access sites | Some vegetation sampling sites are not accessible under high water conditions, resulting in data gaps |
| Drought and dry periods | Fish sampling sites were often dry, leading to reduced sample size |
| Fire control | Fire control and suppression can increase soil temperature; equipment can cause erosion and destroy transect vegetation; fire has destroyed some sampling devices |
| Unclear definition of success | Degree of similarity between control and restored that would be considered successfully restored is not defined |
| Inadequate sample size | Low power for tests comparing vegetation control and restored sites |
First is the need for clearer monitoring objectives (see NASEM, 2018). Although the objective of the monitoring appears to be to provide statistical evidence of restoration success, few statistically significant responses to restoration have been documented, and for several metrics, invasive species and natural events (e.g., fire, drought) are confounding meaningful assessments. If statistical evidence of success is the goal, the monitoring plan should be reviewed to assess whether the number of sampling units, metrics, and frequency of monitoring are appropriate to provide this information, particularly within a partially restored system. The current sample sizes generally are rather small for the analyses that are considered, resulting in low power for statistical tests (a large difference is required for statistical significance). There is also considerable variation between sampling sites within the control and restored groups. Therefore, strategies should be developed to reduce variability in the sampling and measurement process. Possible actions include using experienced staff to plan and conduct the monitoring, especially where sampling technique or sample processing is likely to affect data quality. Faunal sampling methods may need to be refined to minimize bias associated with differential detection probabilities or identification of organisms (Jacobsen and Kushland, 1987; Michelangeli et al., 2016; Parkos et al., 2019). Agencies should be cognizant of other factors that may exacerbate variability, such as differences in fire history or invasive species treatment among transects, and include this information in databases. If other sources of variability, such as invasive species, are so large that monitoring no longer provides meaningful information about restoration progress, some components of the ecological monitoring plan may need to be eliminated.
If decision makers expect monitoring to inform future management decisions, adaptive management should be emphasized as a monitoring objective, with management questions identified so that monitoring and assessment can be targeted to address the questions. For example, managers may want to understand the impacts of invasive species on CERP restoration goals at Picayune Strand. Cabbage palm, which was established when Picayune Strand was drained, is a key invasive species in the area and neither simple fire nor hydrologic restoration will eliminate it. The adaptive management plan (USACE, 2014) suggests selective harvesting of cabbage palm and management through controlled burn. Monitoring and modeling can help identify and track critical cabbage palm management areas that affect restoration goals and be used to examine the effectiveness of practices to remove or reduce the density of palms. Metrics used in the analyses would need to be coordinated with objectives. For example, the WAI is useful as a general summary of wetland vegetation, but it does not track species-specific goals. In cypress habitat, for example, it is possible to obtain good WAI values without having any cypress present.
Second, improved analysis and modeling both before and after sampling would improve the usefulness of the data collected (NASEM, 2018). The complexity of the modeling that has been used is varied across research reports. In some cases, simple tests are used to compare control and restored sites. In other analyses, a more complex multivariate approach is used. Ideally there should be an a priori plan that specifies what might be expected and what is biologically important, and a discussion of analyses and hypotheses that reflect the biological expectation (i.e., the alternative hypothesis might be one sided, increasing the power of the test). In the Picayune Strand monitoring plan (USACE and SFWMD, 2009), however, expectations for restoration success are not defined. Finally, there is no plan with regard to how to incorporate fire and rainfall into the analysis. Although fire events are recorded for the monitoring transects, the incidence of fire is not included in modeling of the data. Inclusion would require a more complex model for analysis, but such an analysis is possible and would improve the utility of results.
Third, there is a need for better communication and planning across different agencies, especially related to prescribed burns. Prescribed burning is the responsibility of the Florida Forest Service and is necessary to control invasive vegetation, eliminate buildup of natural fuel sources, and support natural vegetation processes (Barry et al., 2019). Burning at a schedule that is similar to reference sites is required to support restoration, especially in the pinelands. If vegetation monitoring is critical, then the agency involved in prescribed burns needs to recognize this importance, work with other agencies, and inform monitoring personnel about the location and timing of the burn. Efforts should be made to avoid, to the extent possible, damaging the natural, desirable vegetation
as well as the monitoring equipment both from the burn and from equipment used in fire management. Improved reporting on the timing and spatial extent of controlled burns can lead to better modeling and evaluation of the restoration process and improve adaptive management.
Finally, adequate and consistent funding is required for effective monitoring and adaptive management. Unplanned monitoring funding cuts can lead to reductions in data quality (e.g., if using interns instead of more experienced staff) or data gaps that limit the knowledge gained from this long-term investment. For example, taxonomic identification is dependent on factors such as the skill of the researcher, and changes in budget and researchers in different years can therefore affect identification and inference about changes in taxonomic composition over time (Ceilley et al., 2020). These effects can be limited through careful longer-term planning that considers the value of the information gained from the different monitoring investments and examines ways to address critical questions with less cost (see NASEM, 2018). Recent expectations for quality assurance and quality control in contracts from the Florida Department of Environmental Protection and SFWMD may improve the consistency and value of information collected (FDEP, 2018).
Monitoring to inform management decisions.
There is a great opportunity to revise and implement a monitoring plan that can be used for improving management actions rather than simply documenting changes in the Picayune Strand Restoration Project. Although there is a comprehensive adaptive management plan for the project (USACE, 2014), the plan has not yet been used to inform management changes. The challenges faced in Picayune Strand are significant and could be usefully addressed through an adaptive management plan targeted toward the most critical decisions. For example, restoration projects rarely restore an area to historical conditions (Duarte et al., 2009; Livingston, 2006). Improving hydrology improves conditions for desirable flora and fauna but also provides opportunities for invasive species, which are sometimes difficult to control (Barry, 2019). Although prescribed burns may be effective at reducing invasive vegetation, such as cabbage palm, at the lower strata, it has not been effective at removing larger plants. Recognizing that the restoration will not result in a return to historical conditions should be viewed as an opportunity, not as a hindrance. Acknowledging this can, for example, lead to identification of more realistic management targets and metrics that are dynamic and better connected to adaptive management.
Adaptive management offers an opportunity to revisit goals, based on new information and analyses of monitoring data, to refine the project goals and objectives. For example, a shift in focus from eliminating cabbage palm to inhibiting its growth might be more realistic and make better use of limited resources. Rather than striving to replicate the plant and animal abundance
from the predrainage system in Picayune Strand under a changing climate, a more realistic goal might be to increase the abundance of desirable flora and fauna and improve the resilience of the region to future change. Such a goal recognizes not only the habitat value of Picayune Strand but the benefits that the project provides within a larger ecosystem, including the mangrove transition areas of the Ten Thousand Islands, Fakahatchee Strand, and ultimately Big Cypress National Park. Achieving satisfactory results requires the use of hydrologic restoration combined with fire management and invasive species control as critical components of the CERP project strategy.
Melaleuca Eradication and Other Exotic Plants
The Melaleuca Eradication and Other Exotic Plants Project is a CERP effort to address the potential threat to restoration posed by non-native invasive plant species by mass rearing and releasing biological control agents. Five invasive species that are particularly problematic are the focus of major ongoing management efforts: Melaleuca (Melaleuca quinquenervia), Brazilian pepper (Schinus terebinthifolia), water hyacinth (Eichhornia crassipes), Old World climbing fern (Lygodium microphyllum), and air potato (Dioscorea bulbifera). The CERP biological control project addresses these species, centered at the U.S. Department of Agriculture’s (USDA’s) Invasive Plant Research Laboratory in Davie, Florida, where specific biological control agents—mostly insects—are developed and reared for release. CERP funding supported the 2013 completion of a mass rearing area at this facility, which expanded the production capacity for biological controls for several invasive nonindigenous plant species. More than 7.5 million biological agents have been reared and released through the program (A. Dray, USDA, personal communication, 2020).
Melaleuca control involves prescribed burns, harvesting, chemical treatments, and biological controls. A recent study (Rayamajhi et al., 2018) indicates that the biological controls not only reduce the growth and health of melaleuca but also improve conditions for native plants by reducing leaf litter and seeds. Although biological treatments have the potential for negative effects (e.g., toxicity to insectivorous wildlife; Oelrichs et al., 1999), evidence indicates that these biological controls do not cause damage to other plants or wildlife (Center et al., 2008). Biological agents reared and released through the CERP-funded program include the melaleuca weevil (Oxyops vitiosa), the melaleuca psyllid (Boreioglycaspis melaleucae), the melaleuca midge (Lophodiplosis trifida), and the air potato beetle (Lilioceris cheni). These organisms are now well established on the landscape and no longer require additional releases. In many areas, biological and other controls have reduced the cover of melaleuca to the point where it is not considered a major problem. Melaleuca remains problematic in
a few areas, such as Loxahatchee National Wildlife Refuge, where the melaleuca weevil cannot pupate in wet soils, and in the eastern Everglades Buffer, which has never been treated with biological agents. A fourth organism was awaiting approval for release in 2020 (M. Smith, USDA, personal communication, 2020).
With successful results from melaleuca biocontrol, the CERP mass rearing effort is now focused on biocontrol agents for Old World climbing fern, Brazilian pepper, and water hyacinth. The biological controls for these invasive plants, including the brown lygodium moth (Neomusotima conspurcatalis), lygodium gall mite (Floracarus perrepae), and waterhyacinth planthopper (Megamelus scutellaris), have been released in the greater Everglades. Information on the control of these four species is summarized in Table 3-4. Old World climbing fern is perhaps the most difficult to control, with dense infestations in the Kissimmee, Everglades, and west coast regions. Control through herbicide is common but only partially effective due to rapid reestablishment. The most abundant and widespread species is Brazilian pepper, which is currently managed through chemical and mechanical means. However, two biological control agents were approved for field releases in 2019. Mass rearing is under way, and more than 65,000 Brazilian pepper thrips (Pseudophilothrips ichini) have been released. Releases of the second agent, a leaf galler (Calophya latiforceps), are expected in 2020.
Site 1 Impoundment
The Site 1 Impoundment Project (No. 3 on Figure 3-3) was originally envisioned to provide water storage (13,300 AF) and help alleviate demands on water
TABLE 3-4 Summary of the Conditions of Four Non-native Invasive Vegetation Species in 2019
| Invasive | Upper Lakes | Kissimmee | Lake Okeechobee | East Coast Region | West Coast Region | Everglades | Florida Bay & Southern Estuaries | Florida Keys |
|---|---|---|---|---|---|---|---|---|
| Old World climbing fern | Y | R | Y | Y | R | R | G | G |
| Melaleuca | G | Y | G | Y | Y | Y | G | G |
| Brazilian Pepper | Y | Y | G | Y | R | R | Y | Y |
| Water Hyacinth | Y | Y | Y | Y | Y | G | G | G |
NOTE: Red implies a severe negative condition; yellow, improving due to control measures; and green, under control.
SOURCE: Rodgers et al., 2020.
in the Arthur R. Marshall Loxahatchee National Wildlife Refuge, thereby allowing for improved hydrologic conditions in the refuge (USACE, 2018a). In 2009, the project was divided into two phases. Construction of Phase 1, completed in 2016, was an $81 million effort that included modifications to the existing L-40 levee and construction of a 6-acre wildlife wetland area (USACE, 2018a; G. Landers, USACE, personal communication, 2016). Phase 1 is estimated to provide a 16 percent reduction in existing seepage at the L-40 levee (USACE, 2019b). Phase 2 of the project requires further congressional authorization necessitated by increased costs (USACE, 2018a). The SFWMD, however, in 2016 communicated to the USACE that it is no longer interested in constructing Phase 2, because of the high anticipated cost of the plan relative to the benefits provided (M. Morrison, SFWMD, personal communication, 2016). CERP planners have not formally deauthorized the project, but the project is not listed in the 2019 or 2020 IDS (USACE, 2019a, 2020c).
CEPP
CEPP is a multicomponent project (Figure 3-3, Nos. 10, 11, and 12) that was authorized in WRDA 2016 and modified with the addition of the EAA Reservoir, A-2 stormwater treatment area (STA), and canal conveyance improvements in WRDA 2018. WRDA 2020 clarified that CEPP includes the EAA Reservoir, with a combined authorized cost of $4.4 billion. With the authorized changes, CEPP components include a 240,000 AF, 23-foot-deep reservoir, 6,500-acre STA, and conveyance improvements. The project also improves the distribution of flow through seepage management, the filling of canals, and levee removal in the central Everglades. This large and complex project aims to reduce harmful estuary discharges and increase flows into the WCAs and Everglades National Park, while improving the timing and distribution of those flows (NASEM, 2018; SFWMD, 2018c; USACE, 2020a).
The project has been divided into three phases: CEPP North, CEPP South, and CEPP New Water. Construction of one early component of CEPP South (the S-333N spillway) began in September 2018 and was completed in October 2020. The S-333N spillway will increase the total capacity of the S-333 from 1,350 to 2,500 cubic feet per second (cfs), thereby helping to reduce high water levels in WCA-3A by moving higher flows to Everglades National Park during the wet season.4 The CEPP South Project Partnership Agreement was executed in July 2020. The SFWMD has begun work for removing portions of the Old Tamiami Trail included in CEPP. The USACE has completed design work on gated culvert structures in the L-67A levee, spoil mound removal, and L-67 levee gaps
___________________
4 See https://usace.contentdm.oclc.org/digital/api/collection/p16021coll7/id/7551/download.
features of CEPP South. Design work is proceeding for two other components of CEPP South: replacement of the S-356 pump station and the S-355W divide structure in the L-29 Canal associated with the Blue Shanty Flowway. Construction contracts for these features are scheduled for 2022 and 2023.
The SFWMD began construction of the inflow and outflow canal structures for the A-2 STA, a feature of CERP New Water, in April 2020. STA construction is expected to be completed by 2023. The committee commends the agencies on the fast implementation efforts under way in CEPP, which will help expedite restoration benefits to the heart of the Everglades.
Central and Western Everglades: Non-CERP Restoration Progress
Several major non-CERP projects are critical to the overall success of the restoration program and to the restoration of the central and western Everglades region. Progress in non-CERP projects that contribute to improving water quality are discussed in this section. Chapter 4 describes the benefits expected from the Combined Operating Plan for the Modified Water Deliveries Project to Everglades National Park and the C-111 South Dade Projects, designed to restore flow to Northeast Shark River Slough.
Everglades Water Quality Treatment
Achieving water quality goals—specifically total phosphorus concentrations in the STA discharges south of Lake Okeechobee—is critical to progress in making additional water available to the remnant Everglades (see Chapter 2). Thus, progress addressing water quality throughout the watershed has implications for CERP progress. Additionally, water quality affects the capacity to reach CERP ecological objectives regarding habitat quality throughout the ecosystem. Trends and progress on major state water quality initiatives to address phosphorus are reviewed in this section.
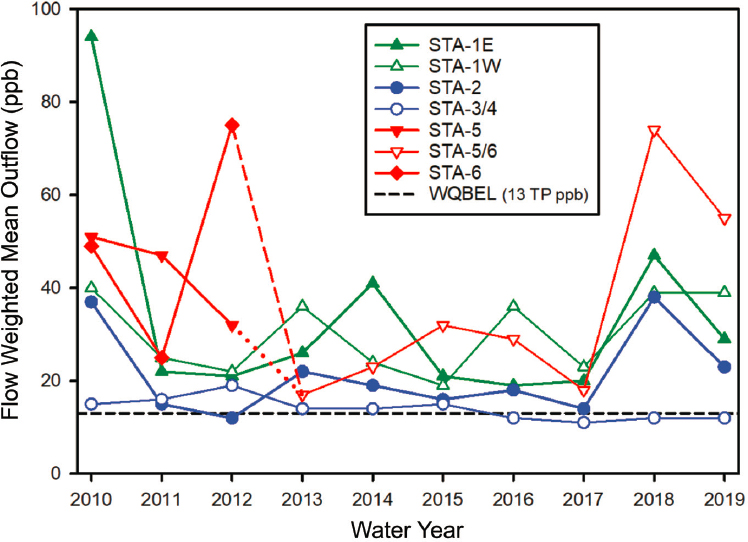
As mandated under the Everglades Forever Act, the State of Florida is mitigating phosphorus inflows to the Everglades Protection Area largely through watershed best management practices and the construction and operation of large constructed wetlands, known as STAs. The STAs are located south of Lake Okeechobee and include five constructed wetland complexes (STA-1 East [STA-1E], STA-1 West [STA-1W], STA-2, STA-3/4, and STA-5/6; Figure 3-12). The design and operation of the STAs is focused on decreasing total phosphorus concentrations and loads of surface waters prior to discharge into the Everglades Protection Area (Chimney, 2020). In 2012, the U.S. Environmental Protection Agency (EPA) established a water quality–based effluent limit (WQBEL) for total
SOURCE: Jacoby, 2020.
phosphorus in STA discharge to “not exceed: 13 µg/L as an annual flow-weighted mean in more than 3 out of 5 water years on a rolling basis; and 19 µg/L as an annual flow-weighted mean in any water year” (Mitchell and Mancusi-Ungaro, 2012). This effluent limitation is intended to allow drainage to meet the 10 µg/L (or parts per billion) phosphorus criteria in the Everglades Protection Area. In 2012, the SFWMD developed its Restoration Strategies plan, which provides for expanding existing STA acreage and additional infrastructure improvements to meet the WQBEL. The Science Plan for Everglades Stormwater Treatment Areas (SFWMD, 2018b) was revised in 2018 to reevaluate and revise priorities based on understanding obtained during the 5 years of implementation. Restoration Strategies is expected to be fully constructed and operational by 2025, after which EPA will begin the process to assess compliance. Progress on Restoration Strategies project implementation is described in Table 3-5.
TABLE 3-5 Summary Status of Major Restoration Strategies Project
| Component | Purpose | Status | Construction Completion |
|---|---|---|---|
| Eastern Flowpath | |||
| L-8 FEB | Attenuate flow into STA-1E and -1W | Completed | 2017 |
| L-8 Divide Structures (G-716, G-541) | Assist movement of inflows and outflows to L-8 FEB | Completed | 2016 |
| STA-1W Expansion (Phase 1) | Increase STA-1W effective treatment area | Undergoing initial flooding and optimization | 2018 |
| STA-1W Expansion (Phase 2) | Increase STA-1W effective treatment area | Design completed in July 2020 | Expected in 2022 |
| G-341 Related Improvements | Divert flows (600 cfs max) to the west | Under construction | Expected in 2024 |
| Central Flowpath | |||
| A-1 FEB | Attenuate flow into STA-2 and -3/4 | Operational testing completed in 2018 | 2015 |
| Western Flowpath | |||
| STA 5/6 Earthwork | Improve the performance of STA-5/6 | Undergoing initial flooding and optimization | May 2020 |
| C-139 FEB | Attenuate flow into STA- 5/6 | Design under way | Expected in 2023 |
SOURCE: https://www.sfwmd.gov/documents-by-tag/resstrategies; Jacoby, 2020, N. Hooseinny-Nabibaksh, SFWMD, personal communication, 2020.
Despite year-to-year variability associated with the quantity of water and loads of phosphorus treated, the extent of total phosphorus removal in the STAs has generally improved, with percent removal of inflowing total phosphorus peaking at 86 percent in 2016. In water year (WY) 2019, the flow-weighted mean outflow concentration of total phosphorus was 23 µg/L. The phosphorus removal performance varies across the STAs with effluent flow-weighted mean concentrations of total phosphorus ranging from 12 µg/L for STA-3/4 to 55 µg/L for STA-5/6 for WY 2019 (Chimney, 2020). However, a time series of flow-weighted mean annual concentrations of total phosphorus over the most recent 10-year period does not show any consistent pattern of improvement (Figure 3-13). Overall, the total phosphorus removal effectiveness has been good, but effluent concentrations in most STAs remain far from the water quality targets. Only one STA (3/4) performs consistently well with flow-weighted annual concentrations that approach or meet the WQBEL, with minimal year-to-year variation. STA-2 has the next-best performance, with one year that met the WQBEL and several others that approached it, but with poor performance in the most recent years (2018 and 2019). An important factor contributing to the good performance of STA-3/4
SOURCE: Data from Chimney, 2014, 2015, 2017a, 2018, 2019, 2020; Germain and Pietro, 2011; Ivanoff et al., 2012, 2013; Pietro, 2016.
is that it receives consistently low inflow total phosphorus concentrations. The inflow total phosphorus concentration in STA-3/4 in the most recent water year (2019) was 80 µg/L, compared to the average of 125 µg/L across all STAs (Chimney, 2020). However, mechanistic explanations for performance differences between STAs are still lacking, although developing a fuller understanding of why treatment performance varies among the STAs is one of the objectives of the Science Plan that is currently in implementation (SFWMD, 2018b). Despite recent elevated phosphorus concentrations in several STAs, interior sites of the Everglades Protection Area remain in compliance with the total phosphorus criterion (Julian et al., 2020).
Completion and operation of additional STA expansion areas, flow equalization basins, and other improvements planned under Restoration Strategies are intended to improve the performance of STAs 1E, 1W, and 5/6. Both STA-2 and
STA-3/4 are currently benefiting from the operation of the A-1 FEB, completed under Restoration Strategies in 2015, but STA-2 effluent remains well above the target, with an average flow-weighted mean concentration of 26 µg/L over the past 5 years (C. Armstrong, SFWMD, personal communication, 2021). High flows in 2018 contributed to poor STA performance that year. The period of record for the operation of the A-1 FEB is short and may not be long enough to judge its effectiveness. The 2018 STA Science Plan (SFWMD, 2018b) indicates that the A-1 FEB has reduced peak flows and improved overall performance of the STAs. The 2018 Science Plan also suggests that a number of other factors should be examined to improve STA performance, including operational and design refinements, enhanced vegetation-based treatment, and reduced internal loading of phosphorus. As the period of record for the A-1 FEB is extended and the other STA enhancements come online, a quantitative analysis of the factors influencing STA removal efficiencies, as suggested in the 2018 Science Plan, would be critical to help guide future STA improvements toward meeting the WQBEL and redistributing flows in CEPP.
SOURCE: Paudel et al., 2010. Reprinted with permission; copyright 2010, ELSEVIER.
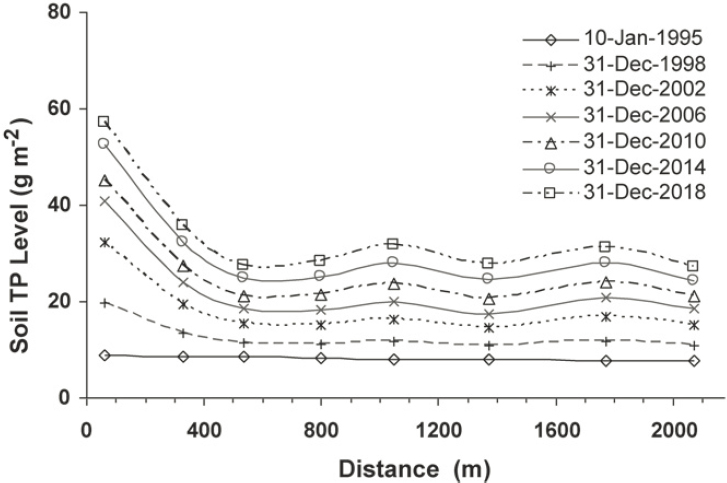
An important further consideration is the longer-term performance of the STAs. With long-term loading with phosphorus-enriched influents, there is a likelihood that soils within the STAs will become saturated with respect to phosphorus inputs, reducing the effectiveness of treatment. Long-term model simulation suggests that, over the course of STA operation, the quantity of total phosphorus in soil will accumulate, with more pronounced increases in the cells of the STA adjacent to the inlet (Paudel et al., 2010; Figure 3-14). Paudel et al. (2010) compared model-simulated sediment accumulation of total phosphorus against measured values, finding good agreement. This or a similar STA model could be used to analyze recent observations, including spatial accumulation patterns in sediments, to gain insight into the long-term function of STAs for nutrient accumulation and removal.
Recent observations show that long-term nutrient loading to the STAs has resulted in accumulation of phosphorus-enriched materials in the upstream areas of the flow path of floc, emergent aquatic vegetation, and submerged aquatic vegetation (Reddy et al., 2020). This input has decreased nitrogen-to-phosphorus ratio (N:P) in floc and recently accreted soils within STAs, resulting in a shift from phosphorus limitation toward nitrogen limitation. Excess bio-available phosphorus beyond the demand by microbes, algae, and plants will likely be exported from the STAs. Therefore, it is essential that STA management extend beyond total phosphorus to also include the stoichiometry of nutrient loading (including carbon and nitrogen). For example, FEBs could be operated to create high N:P in inflow nutrient loads to induce ecosystem utilization of internal surplus phosphorus (Reddy et al., 2020) or cells could be maintained periodically to remove accumulated phosphorus.
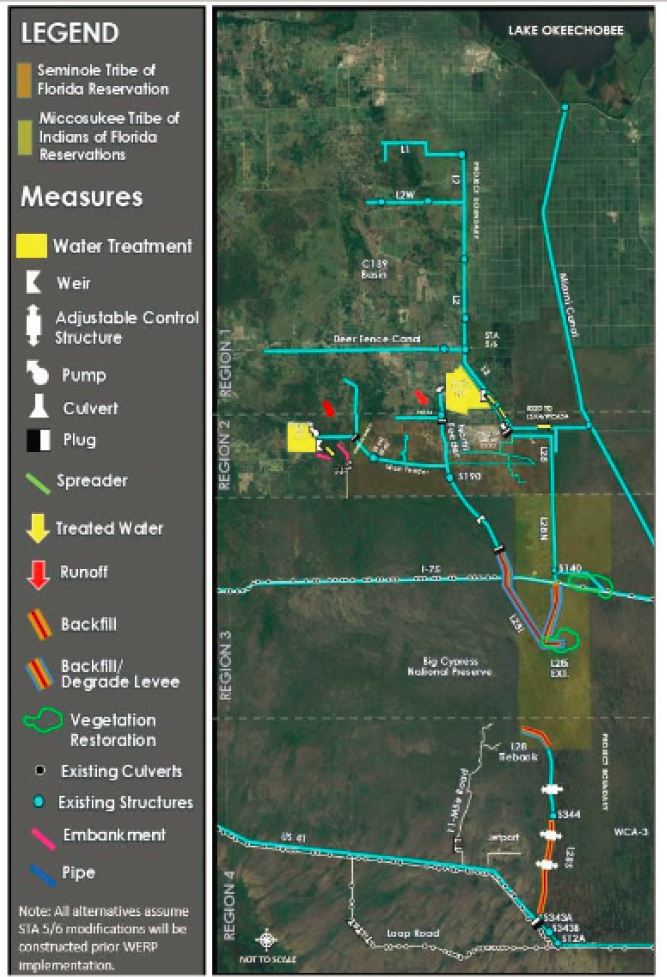
Central and Western Everglades: CERP Projects in Planning—Western Everglades
One project, the Western Everglades Restoration Project, is currently in planning in the central and western Everglades region. The western Everglades extends westward from WCA-3A and the EAA and encompasses Big Cypress National Preserve, as well as reservations of the Seminole Tribe of Florida and the Miccosukee Tribe of Indians of Florida (Figure 3-3, No. 15). This area suffers from water quality impairment, particularly from phosphorus-laden runoff from agriculture landscapes in the north, and altered hydrology. Elevated nutrient levels have spurred changes in flora and fauna, degrading the biodiversity of the region and affecting habitats used for traditional cultural practices. Unnaturally high water stages drown tree islands along the perimeter of WCA-3A, while unnaturally dry conditions promote wildfires elsewhere within the western
Everglades. The Western Everglades Restoration Project (WERP) is intended to reestablish ecological connectivity, restore hydroperiods and predrainage distributions of sheetflow, restore low-nutrient conditions to reestablish native vegetation, and promote ecosystem resilience. At 1,200 square miles, the WERP footprint is large, covering an area equivalent to the CEPP.
The WERP planning process was launched in August 2016 and, over the next 18 months, the WERP Project Delivery Team narrowed an initial array of alternatives to three alternatives and, from these, formulated a hybrid alternative, referred to as Alternative H (Figure 3-15). Alternative H included STAs and buffer zones to address water quality concerns, as well as conveyance features intended to direct water to historic sloughs. It also involved various flood protection features and degradation and backfilling of levees and canals that were constructed as a part of the C&SF Project. The preliminary cost estimate for Alternative H was estimated at $1.2 billion (Summa, 2019).
In July 2019, further work on WERP planning was suspended for a number of issues, the most contentious of which involved potential impacts on private properties in the project footprint. A preliminary analysis on 52 private holdings within the Big Cypress National Preserve within the WERP footprint suggested that all 52 parcels may be impacted by increased ponding and hydroperiods in a future with the WERP features in place, and land owners expressed concerns about possible land acquisitions. The Tribes also expressed concerns with components of the plan, including impacts to their land ownership rights, water quality, and project cost. After the USACE announced its intention to terminate the project planning process in October 2019, the SFWMD, Florida Department of Environmental Protection, Department of the Interior, Seminole Tribe of Florida, and Miccosukee Tribe of Indians of Florida worked collaboratively and pledged support for continuation of the planning process. As of January 2021, the planning process has restarted but is awaiting a waiver associated with planning time and budget. CERP agencies aim to complete the project implementation report and submit the Chief’s report to Congress for authorization in 2022.5
CERP Projects Affecting the Northern Estuaries
Two CERP projects are under construction that directly affect the northern estuaries: the C-43 Reservoir and Indian River Lagoon-South. The impacts of these projects on the condition of the northern estuaries are discussed in more detail in Chapter 5.
___________________
5 See https://evergladesrestoration.gov/content/wg/minutes/2021meetings/012821/6_USACE_SFER_Overview.pdf.
SOURCE: Gonzales, 2020.
C-43 Storage Reservoir
A major environmental issue in the estuary of the Caloosahatchee River on the west coast of Florida is the restoration and maintenance of appropriate salinity levels for aquatic organisms, particularly shellfish. Early in the 20th century, the course of the Caloosahatchee River was deepened and straightened, and canals were excavated in the river basin to drain agricultural lands and urban areas. As a result, during prolonged dry periods, freshwater flow to the estuary is greatly reduced, to the extent that saline water can migrate far up the river and kill beds of freshwater submerged plants. During periods of heavy rainfall, large volumes of nutrient- and sediment-rich freshwater are transported into the estuary, affecting habitat quality for seagrasses, oysters, and other aquatic organisms (see also Chapter 5). The Caloosahatchee River (C-43) West Basin Storage Reservoir (Figure 3-3, No. 8) is a CERP project designed to impound up to 170,000 AF of stormwater runoff from the C-43 drainage basin or from Lake Okeechobee during wet periods (USACE, 2019d). The C-43 Reservoir is predicted to reduce high-volume events (mean monthly flows of >2,800 cfs) by about 14 percent and very high flows (mean monthly flows of >4,500 cfs) by 23 percent. The benefits during dry periods are even greater, when this stored water can be released to supplement low river flows to maintain optimal salinity levels in the estuary and is available for water supply. The project is expected to reduce low flow events (mean monthly flows of <450 cfs) by 77 percent (USACE and SFWMD, 2014). Construction is under way, with completion anticipated by 2023 (USACE, 2020c). As a result, it is too soon to see natural system benefits from this project.
The Florida Department of Environmental Protection and SFWMD are currently conducting a feasibility study to examine water quality treatment options for water leaving the C-43 Reservoir. Water quality treatment is being considered because of the potential for the stored water containing elevated nutrient levels to support the growth of algae in the reservoir and seed harmful algal blooms in the Caloosahatchee River Estuary. Because the feasibility of water quality treatment is being considered after the reservoir has been planned and partly constructed, options for effective treatment of algal blooms in general and toxic blooms in particular may be because most available land for an STA is upgradient of the reservoir discharge.
Indian River Lagoon-South
The Indian River Lagoon and St. Lucie Estuary are biologically diverse estuaries located on the east side of the Florida Peninsula, where ecosystems have been impacted by similar factors as those that have impacted the Caloosahatchee
River Estuary—surges of freshwater from Lake Okeechobee and canals in the watershed and polluted runoff from farmlands and urban areas (USACE and SFWMD, 2004b). The Indian River Lagoon-South Project (Figure 3-3, No. 4) is designed to reverse this damage through improved water management, including the 50,600-AF C-44 Storage Reservoir, three additional reservoirs (C-23, C-24, and C-25) with a total of 97,000 AF of storage, three new STAs, dredging of the St. Lucie River to remove 7.9 million cubic yards of muck, and restoring 53,000 acres of wetlands. The project also involves the restoration of nearly 900 acres of oyster habitats and 90 acres of artificial habitat for submerged aquatic vegetation. Construction is under way on the C-44 Reservoir and one of the three STAs, with estimated completion in 2021 (USACE, 2020d). Because no project features have been completed, there is no natural system restoration progress to report.
Loxahatchee River Watershed Restoration
The Loxahatchee River watershed once connected the sawgrass and ridge and slough habitats of the Everglades to the coast. The natural mouth of the river sometimes closed after storms due to blockage by shoaling of sand. The river system has been altered substantially over the past century. Jetties were placed on the inlet in the 1920s, and a deep channel was dredged through the inlet in the 1940s. In the 1950s, as part of the C&SF Project, several features (C-18 Canal, C-18W Canal, and the S-46 structure) cut off the northwest fork of the Loxahatchee River from Loxahatchee Slough and the rest of the watershed, reducing inflows. The Southwest Fork was channelized, and flows increased through canal drainage. The connection of the river to the watershed was also altered by urban and agricultural development and wetland degradation, which limited the storage of excess waters, resulting in periods of either excessive or limited flows to the Loxahatchee River Estuary. The resulting changes in natural land cover, including up-river migration of mangrove and the displacement of cypress, raised concern, especially in the area designated as a Wild and Scenic River (FDEP, 2010).
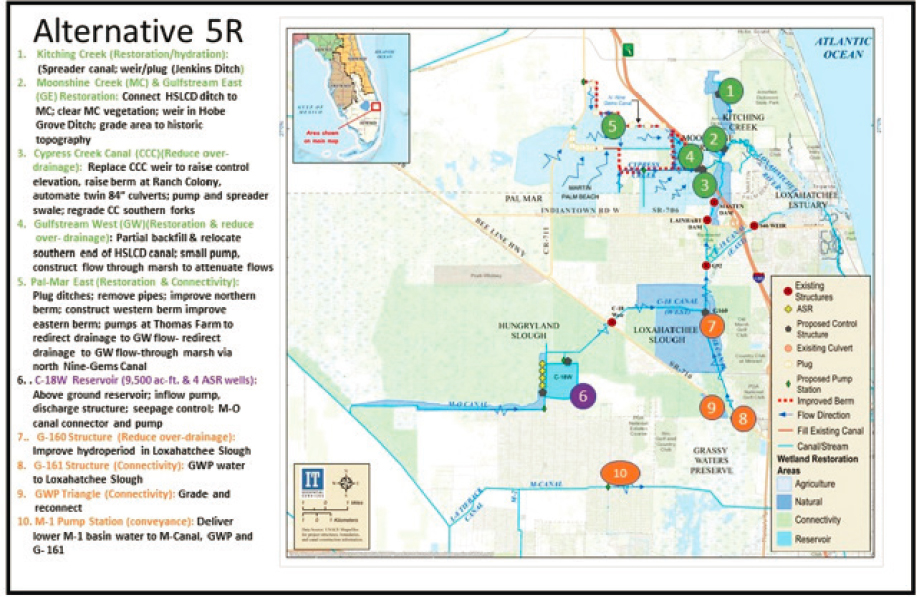
The Loxahatchee River Watershed Restoration Project (Figure 3-3, No. 13), authorized in WRDA 2020, seeks to capture, store, and redistribute freshwater currently lost to tide, rehydrate natural areas in the headwaters, reduce peak discharges to the estuary, and improve the resilience of estuarine habitats by altering the timing and distribution of water from upstream. Planned components of the project (Figure 3-16) include wetland restoration and hydrologic improvements within the watershed, a single 9,500-AF reservoir, four aquifer storage and recovery (ASR) wells, and several structures related to connectivity in the southern part of the watershed. RECOVER recommended that the project
SOURCE: USACE and SFWMD, 2020a.
include ecotoxicological testing related to ASR, consistent with the findings of NRC (2015). The project leverages extensive publicly owned land within the watershed, allowing improvements to hydrology to occur despite a heavily urbanized portion of the system. The total first cost of the project is $741 million (USACE and SFWMD, 2020a), and well over a quarter of the cost is associated with the C-18W Reservoir.
Together the components of the project are expected to deliver 98 percent of the wet season restoration flow target and 91 percent of the dry season restoration flow target in the Northwest Fork of the Loxahatchee River (USACE and SFWMD, 2020a). These flows are expected to limit saltwater penetration in the estuary, conserve the remaining cypress, and promote the recovery of freshwater vegetation (e.g., Vallisneria) and other habitats important for estuarine species
such as manatee and oysters. The project benefits were examined relative to three sea-level rise scenarios estimated based on the Miami Beach tide gauge according to USACE guidance. Curves were adjusted to a 2020 baseline resulting in the following changes by 2070 for the three scenarios: low, 0.39 feet; intermediate, 0.86 feet; and high, 2.36 feet. These rates are within the range identified in the 2019 update to the Unified Sea Level Rise Projection for Southeast Florida for most projects within a short-term planning horizon (up to 2070) (Southeast Florida Regional Climate Change Compact Sea Level Rise Work Group, 2020). The analysis showed that there was little effect anticipated on project performance across the three sea-level rise scenarios. The benefits of the project are generally greater in the dry season. This use of hydrodynamic modeling of the Northwest Fork of the Loxahatchee River and the estuary to evaluate sea-level rise scenarios represents an important advance in analyses for project planning compared to prior CERP efforts.
Non-CERP Project Benefits to the Northern Estuaries and Lake Okeechobee
The CERP is just one of a broad array of state and federal programs intended to benefit the condition of Lake Okeechobee and the northern estuaries through improvements in water quality and quantity (Table 3-6). In terms of water quantity, the ongoing revision of the Lake Okeechobee System Operating Manual, a non-CERP effort, has the potential to substantially change these volumes and
TABLE 3-6 Partial List of Management Initiatives, Responsible Agency, and Intended Purpose Affecting the Northern Estuaries
| Program or Initiative | Responsible Agency | Intended Purpose, Related to Estuaries |
|---|---|---|
| Central Everglades Restoration Plan | USACE and SFWMD | Improve the ecological and input flow conditions of the estuaries |
| Implement Clean Water Act in Florida, including National Pollutant Discharge Elimination System (NPDES) and Section 404 permits, water quality criteria, Section 303(d) listings and total maximum daily loads (TMDLs), basin management action plan (BMAP) to meet TMDLs, and nonpoint-source management | Florida Department of Environmental Protection (FDEP) and U.S. Environmental Protection Agency (EPA) | Protect water quality and designated uses of Florida surface waters, including estuaries, beaches, and coastal waters; impose limitations on point-source discharges to and non-point-source pollution of Florida’s surface waters, including the estuaries and coastal waters out to 3 miles |
| Program or Initiative | Responsible Agency | Intended Purpose, Related to Estuaries |
|---|---|---|
| Best management practices | FDEP and Florida Department of Agriculture and Consumer Services (FDACS), with impetus and funding from U.S. Department of Agriculture | Reduce agricultural loads of regulated pollutants, including the nutrients nitrogen (N) and phosphorus (P) in both organic and inorganic forms, pesticides, and sediment/turbidity, including to Florida estuaries |
| Lake Okeechobee System Operating Manual | U.S. Army Corps of Engineers (USACE) | Reexamine the opportunities to balance the authorized project purposes for flood control, water supply, navigation, recreation, and preservation of fish and wildlife resources |
| Northern Everglades and Estuaries Protection Program | South Florida Water Management District (SFWMD), FDEP, FDACS | Develop protection plans for the Caloosahatchee and St. Lucie River watersheds and coordinated state restoration efforts in these basins and in the Lake Okeechobee watershed |
| Dispersed Water Management | SFWMD | Provide water storage and nutrient removal north of Lake Okeechobee |
| Lake Okeechobee Watershed Construction Project | SFWMD | Improve quality to achieve the TMDL for Lake Okeechobee and thereby improve the quality of water discharged to the northern Everglades ecosystem |
| Minimum Flows and Minimum Water Levels | SFWMD and other regional Water Management Districts | Establish flows for rivers, streams, and estuaries and levels for lakes, wetlands, and aquifers below which further withdrawals would be significantly harmful to the water resources or ecology of the area |
| Climate Change Resilience Efforts | USACE, FDEP, SFWMD, counties, cities | Strengthen planning efforts for climate change adaptation and mitigation, which includes planning for sea-level rise and changes to coastal features |
| Coastal Zone Management Planning pursuant to the federal Coastal Zone Management Act | EPA, National Oceanic and Atmospheric Administration, FDEP | Plan coastal development in order to protect key natural features while still allowing multiple uses along the coast, including energy development, recreation, and fisheries |
| National Estuary Program (NEP) in Florida—Coastal and Heartland National Estuary Partnership; Indian River Lagoon NEP; Sarasota NEP; Tampa Bay NEP | EPA, FDEP, local partners | Protect and restore estuaries of national significance |
timing of lake discharges and affect the benefits that can be provided by CERP projects. Of the non-CERP programs affecting water quality, Florida’s implementation of total maximum daily loads (TMDLs) and basin management action plans (BMAPs) through the Clean Water Act is particularly important to the estuaries of South Florida and Lake Okeechobee (Box 3-1). Progress in these efforts is discussed in this section.
Water Quantity: Lake Okeechobee System Operating Manual
In 1930, Congress authorized the Herbert Hoover Dike, which now encircles most of Lake Okeechobee with 143 miles of embankment, five inlets/outlets, nine navigation locks, and nine pump stations. The capacity of water to flow into the lake greatly exceeds the capacity to flow out, and after large rain events, runoff can result in a rapid increase in lake level. Water levels in the lake are regulated by the USACE based on a regulation schedule that is a set of seasonally varying rules guiding lake operations. If lake level exceeds an upper boundary set by the regulation schedule, water must be released to reduce the risk of failure of the Herbert Hoover Dike. Lake level is allowed to rise prior to the winter dry season to ensure that the amount of water is adequate to supply downstream agricultural irrigation and urban uses in South Florida. The lake level is lowered before the summer wet season to provide for maximal storage capacity to accommodate heavy rain events and tropical storms that may occur. Extreme rain events, however, can quickly push the lake level above what is considered safe at a particular time of the year. Failure of the embankment would cause massive damage and loss of life. In 2004, the USACE classified the Herbert Hoover Dike as Level 1 (i.e., highest risk) with regard to safety, and a major rehabilitation project has been under way since 2007 to improve its condition. The project is expected to be completed by 2022, with an estimated cost of more than $1.8 billion in total (USACE, 2019c).6 The Lake Okeechobee System Operating Manual (LOSOM), authorized under Section 1106 of WRDA 2018, is an effort by the USACE to reevaluate and establish an operations regime for management of Lake Okeechobee and is intended to coincide with the Hebert Hoover Dike rehabilitation in 2022. The overall aim of the project is to incorporate flexibility in Lake Okeechobee operations in a way that balances the congressionally authorized project purposes of flood control, water supply, navigation, recreation, and preservation of wildlife. More specifically, objectives include enhancing ecological conditions for the lake, estuaries, and the South Florida system, improving water supply, continuing to meet authorized purposes for navigation, recreation, and flood control, and managing risk to public health,
___________________
6 See http://www.saj.usace.army.mil/Missions/Civil-Works/Lake-Okeechobee/Herbert-Hoover-Dike.
safety, and property (T. Gysan, USACE, personal communication, 2020). The USACE will evaluate the alternatives through 2021.
The upcoming Lake Okeechobee Regulation Schedule revision (anticipated in December 2022) will provide an opportunity to evaluate the feasibility and the benefits and risks of allowing higher or lower water levels in the lake once the Herbert Hoover Dike repairs are complete to recapture some water storage, potentially benefiting the northern estuaries and the remnant Everglades ecosystem. Recent reports (Graham et al., 2015; NASEM, 2016) have emphasized the importance of water storage to meet the original Everglades restoration goals and to adapt to possible future changes in precipitation.
Water Quality
Given the importance of water quality to meeting CERP’s objectives for the estuaries (see Chapter 5), recent patterns in water quality in Lake Okeechobee and the northern estuaries are discussed.
Lake Okeechobee water quality.
The nutrient of greatest water quality concern within Lake Okeechobee historically has been phosphorus, although the lake is also an important source of water and nutrients to the northern estuaries (see Chapter 5). The TMDL for total phosphorus of 140 metric tons/year was established in 2001 (FDEP, 2001). Over the most recent 5-year interval (WY 2015-2019) the average annual load of total phosphorus to the lake was 600 metric tons (Zhang et al., 2020), far exceeding the TMDL. Phosphorus loads are highly variable from year to year, with no clear trend over time, despite programs implemented in the watershed to reduce phosphorus runoff from agricultural land parcels and small basins. This pattern is attributed to legacy phosphorus from past sources that has accumulated in soils and sediments (Reddy et al., 2011).
The TMDL was established to achieve a concentration of total phosphorus below 40 µg/L to improve the structure and function of the lake ecosystem. Annual concentrations of total phosphorus in Lake Okeechobee have increased from the earliest measurements in the 1970s in a general upward trend continuing through WY 2019, with notable peaks associated with hurricane activity (see Figure 3-17). Recent (WY 2019) concentrations were nearly four times greater than the TMDL target of 40 µg/L. Over the long term, total phosphorus concentrations have greatly increased in the lake due to the high concentrations in inflowing waters coupled with a decline in the phosphorus retention capacity of lake sediments (Havens et al., 2009; Zhang et al., 2020). These increasing concentrations in Lake Okeechobee have adverse impacts on the northern estuaries, which receive periodic high-volume discharges when lake levels are elevated (see Chapter 5). The increasing concentrations have implica-
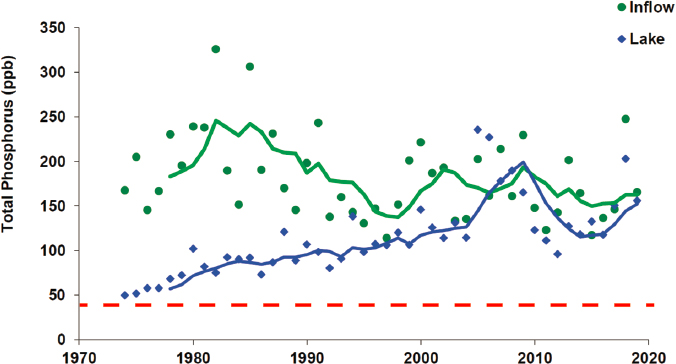
SOURCE: Zhang et al., 2020.
tions for the CERP and its plans to move more Lake Okeechobee water south into the remnant Everglades, because higher total phosphorus concentrations could challenge the capacity of STA infrastructure to meet the water quality discharge standards.
Evidence from prior studies in Lake Okeechobee (Aldridge et al., 1995; Phlips and Ihnat, 1995) together with new data from recent algal blooms (Kramer et al., 2018) indicate that cyanobacteria and algal blooms within Lake Okeechobee and the estuaries are promoted by both excessive phosphorus and nitrogen loading (Havens, 1995; Paerl et al., 2019). There have been long-term increases in total phosphorus concentrations in the lake related to sediment retention, coupled with slight decreases in total nitrogen concentrations, which may be driven by decreases in nitrogen inputs (Figures 3-17 and 3-18). However concentrations of both nutrients remain high. No TMDL has been set for nitrogen for Lake Okeechobee.
St. Lucie watershed nutrient loading.
Annual total nitrogen and phosphorus loads to the St. Lucie Estuary vary greatly based on hydrologic conditions (Figure 3-19). FDEP (2008) set a TMDL for total nitrogen (summed from the individual contributing basins) of 544 metric tons/year to achieve an average daily nitrogen concentration of 0.72 mg/L in the St. Lucie Estuary. In 2006, this
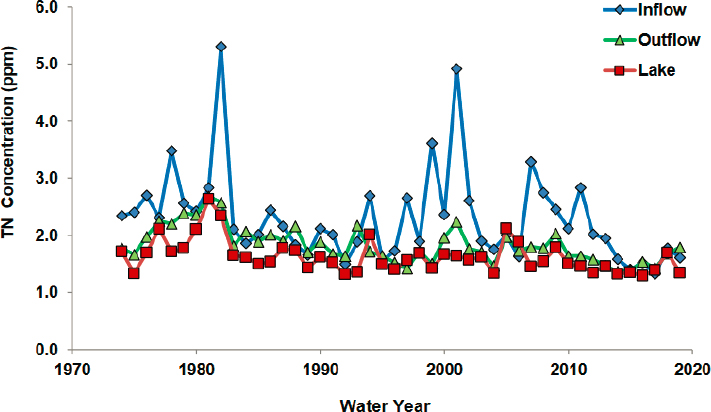
SOURCE: Zhang et al., 2020.
value represented a 47 percent reduction in the overall nitrogen loading across the basins. Recent more typical precipitation years have had total nitrogen loads nearly 2.5 times the TMDL, and in WY 2018, a high-flow year, the total nitrogen loading was nearly six times the TMDL (Figure 3-19b; Serna et al., 2020).
The TMDL for total phosphorus from all contributing basins was established at 61 metric tons/year to attain a target concentration of 81 µg/L phosphorus in the estuary. This TMDL was a 68 percent reduction in total phosphorus loading for the period of record at the time the TMDL was developed. Annual phosphorus loading in recent years has been at least three times the TMDL (Figure 3-19c).
Caloosahatchee River Estuary nutrient loading.
FDEP (2009) established a TMDL for total nitrogen of 4,120 metric tons per year for the Caloosahatchee River Estuary Basin (FDEP Rule 62-304.800(2)), which required a 23 percent reduction in nitrogen loads to the estuary. The long-term average (1997-2019) for total nitrogen loading to the Caloosahatchee River Estuary was below the TMDL (Figure 3-20). However, during 2018 when algal blooms adversely impacted the local economy, the total nitrogen load was substantially higher at 5,300 metric tons/year (Figure 3-20b; Serna et al., 2020).
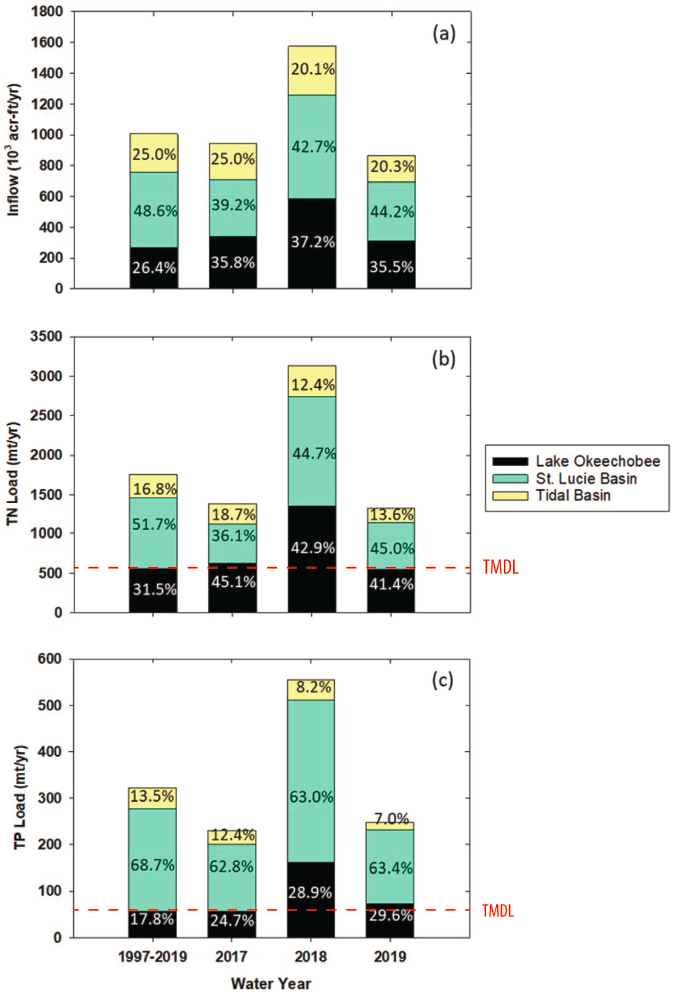
SOURCE: Serna et al., 2020.
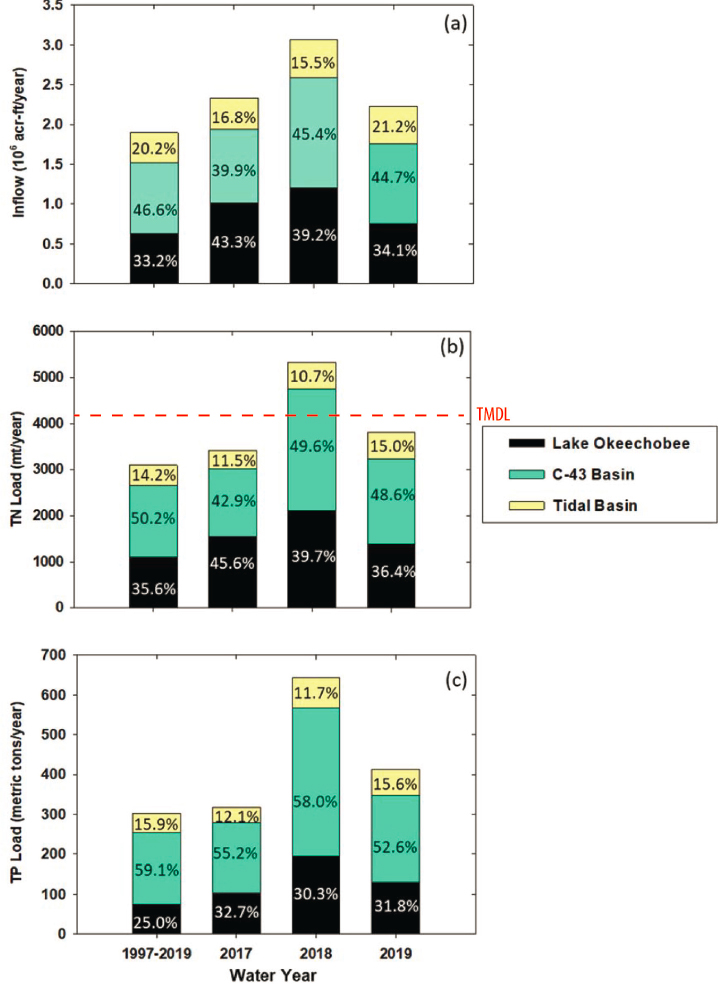
SOURCE: Modified from Serna et al., 2020.
There is no TMDL for total phosphorus for the Caloosahatchee River Estuary. In contrast to the St. Lucie Estuary, which showed variable phosphorus loads in recent years, in the Caloosahatchee River Estuary, recent annual phosphorus loads have exceeded the long-term average (Figure 3-20).
Nutrient management for the estuaries.
Over the long term in both estuaries, significant fractions of the total loads of nitrogen and phosphorus are supplied both by the local watersheds and Lake Okeechobee (Figures 3-19 and 3-20). Thus, meeting estuarine water quality goals will require substantial nutrient reductions from local watersheds in addition to reduction of loading from Lake Okeechobee. Efforts are under way through BMAP to reduce nutrient loading (see Box 3-1).
The nitrogen loading challenges in the northern estuaries have increased interest in the capacity of STAs to treat nitrogen inflows (e.g., Graham et al., 2020;
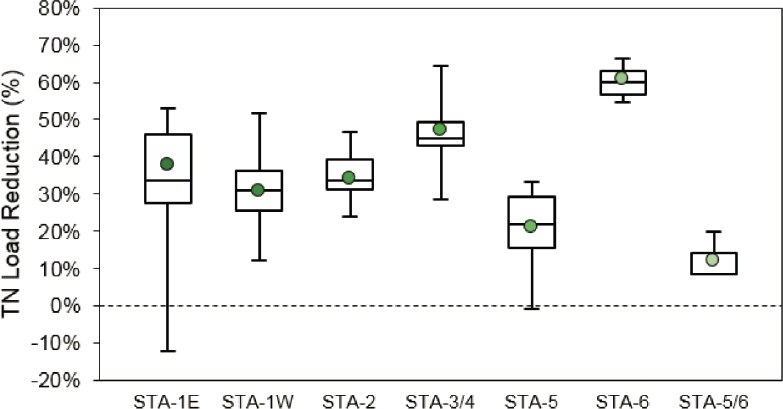
NOTES: Box plot legend: horizontal line within box = median of data distribution (50th percentile); top of box = 75th percentile; bottom of box = 25th percentile; spreader bars = minimum and maximum removal values. Solid circles are average removal values over the period of record for each STA. Periods of record are 2007-2016 (STA-1E), 2004-2016 (STA-1W), 2003-2016 (STA-2), 2006-2016 (STA-3/4), 2004-2012 (STA-5), 2002-2007 (STA-6), and 2014-2016 (STA-5/6). In 2013 the flows from STA-5 and STA-6 were combined.
SOURCE: Chimney, 2017b.
Janicki Environmental, 2003). Chimney (2017b) found that the currently operating STAs, which are optimized for phosphorus removal, provide only modest reductions of influent total nitrogen. Over the period of record, the reduction in nitrogen loads for all STAs was 38 percent, with the extent of reduction ranging from 12 percent at STA-5/6 to 47 percent at STA-3/4 (Figure 3-21). A greater reduction in total nitrogen load was evident for STA-6 (61 percent), but this was attributed to large seepage losses between the inflow and outflow (Chimney, 2017b). STAs, in general, are most effective in removing dissolved inorganic fractions of nitrogen (ammonium, nitrate). The composition of total nitrogen in STA effluent, therefore, primarily comprises particulate nitrogen and dissolved organic nitrogen. Pisani et al. (2017) found that dissolved organic nitrogen dominated total nitrogen in the Caloosahatchee River. Moreover, they determined that only a mean of 15 percent of the dissolved organic nitrogen was biologically available, with the highest bio-available fraction associated with drainage from Lake Okeechobee. The SFWMD is investigating approaches to remove dissolved organic nitrogen associated with the C-43 Reservoir (SFWMD, 2016a). This work includes bioassays to quantify the dissolved organic nitrogen in the estuary and mesocosms to assess nitrogen removal rates by different plants. The most successful treatments observed in the mesocosms will be scaled up in field cells. A more detailed understanding of removal of nitrogen species by STAs will be critical to inform decisions about the use of STAs in controlling nitrogen loads to coastal areas.
CERP Projects in Planning in the Northern Estuaries: Lake Okeechobee Watershed Restoration Project
One project with impacts for the northern estuaries is in the late stages of planning as of December 2020—the Lake Okeechobee Watershed Restoration Project (LOWRP). Located north of the lake, the Lake Okeechobee Watershed Restoration Project (Figure 3-3, No. 14) was designed to capture, store, and redistribute water entering the northern part of Lake Okeechobee to “improve lake stage levels, improve discharges to the Caloosahatchee and St. Lucie estuaries, restore/create wetland habitats, re-establish connections among natural areas that have become spatially and/or hydrologically fragmented, and increase available water supply” (USACE and SFWMD, 2019). A revised draft of the project implementation report was released in July 2019 (USACE and SFWMD, 2019), and a final project implementation report was released in August 2020 (USACE and SFWMD, 2020d). As of December 2020, the project had not been submitted to Congress for authorization.
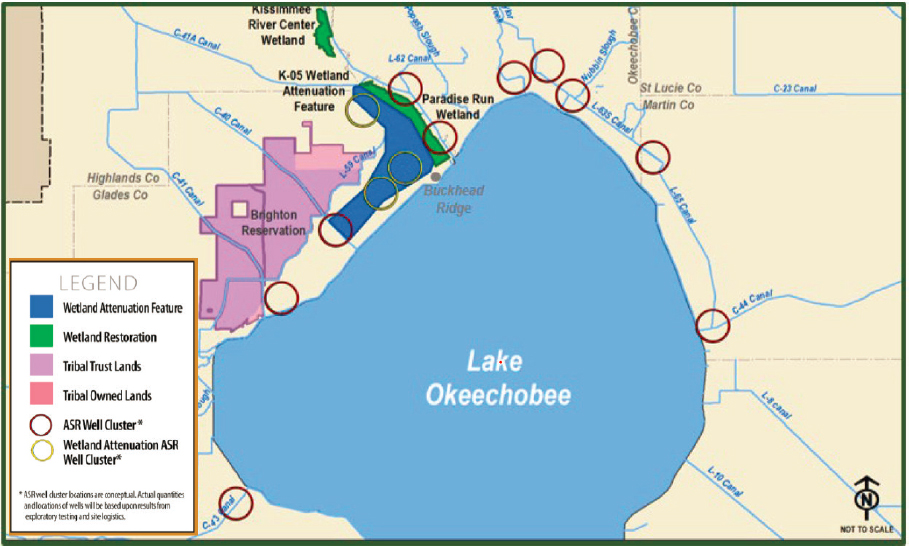
SOURCE: USACE and SFWMD, 2020d.
The major project components in the final recommended plan include
- A shallow wetland attenuation feature with a storage volume of approximately 46,000 AF;
- 80 ASR wells with a total storage volume of approximately 448,000 AF per year; and
- Two wetland restoration sites, encompassing 4,800 acres (Figure 3-22).
The total first cost estimate (2020 price level) of the plan is $1.96 billion (USACE and SFWMD, 2020d).
The LOWRP is expected to provide a smaller increment of additional storage north of Lake Okeechobee relative to that originally envisioned under the CERP (200 ASR wells and 250,000 AF of surface storage) (USACE and SFWMD, 1999). Implementation of the project is expected to reduce total flows to the St. Lucie Estuary by 17 percent and to the Caloosahatchee River Estuary by 36 percent
(USACE and SFWMD, 2020d). By lowering the frequency, volume, and duration of freshwater released from Lake Okeechobee, the LOWRP should reduce turbidity, sedimentation, nutrients, and salinity fluctuations that are detrimental to submerged aquatic vegetation, oyster communities, and fish habitat of the northern estuaries (see also Chapter 5). The project also increases the acreage of wetland habitat north of Lake Okeechobee.
The anticipated benefits of the LOWRP to Lake Okeechobee ecology appear to be more modest. The percentage of time Lake Okeechobee is expected to be within the ecologically preferred stage envelope is 31.2 percent under the tentatively selected plan compared to 27.7 percent under the future-without-project scenario, which includes the CEPP, Indian River Lagoon-South, and the C-43 Reservoir (USACE and SFWMD, 2020d).
The LOWRP planning process was unable to identify viable options for aboveground storage at depths envisioned by the CERP (>11.5 feet), so greater than 90 percent of the storage in the LOWRP will be provided by 80 ASR wells completed within the Upper Floridan Aquifer and the deeper Avon Park Permeable Zone. Fifty-five ASR wells will be grouped in several clusters that are distributed along various tributaries of the Lake Okeechobee watershed, while the remaining 25 ASR wells will be grouped into three clusters that are co-located with the wetland attenuation feature. The purpose of combining ASR wells with the wetland attenuation feature is to enable more dynamic storage because ASR could be operated to recharge when the wetland attenuation feature is full. The benefits of the wetland attenuation feature without ASR or ASR wells with no aboveground storage feature were not presented. Whether the wetland attenuation feature, given its small size, could increase storage enough to meaningfully influence Lake Okeechobee water levels or discharges to the estuaries is unclear.
The planned LOWRP ASR system will be much larger than established Florida ASR systems, which have relied on fewer than 22 wells. Critical uncertainties remain with application of ASR at the large scale considered by the plan. The National Research Council (NRC, 2015) highlighted concerns regarding ecotoxicology that were not resolved in the ASR Regional Study (USACE and SFWMD, 2015) and suggested further field-scale research to address these questions. NRC (2015) also noted that disinfection permitting requirements were not uniformly achieved during the ASR pilot studies and recommended additional work to develop appropriate treatment strategies. Moreover, ASR recovery efficiencies exhibit considerable heterogeneity, and those areas within the LOWRP footprint with aquifer attributes suitable for supporting high recoveries have yet to be identified. These uncertainties can be effectively addressed by phased implementation of ASR using clusters of three to five wells. Consistent with the recommendations of NRC (2015), the final project implementation report
proposes a phased approach to ASR construction. USACE and SFWMD (2020d) also proposes a schedule that delays construction of the wetland attenuation feature until the 55 watershed ASR wells are constructed, which is appropriate because the benefits of this aboveground storage feature are closely linked to performance of the co-located ASR wells.
Southern Estuaries
As discussed in more detail in Chapter 5, several CERP and non-CERP projects designed to improve the flow and distribution of water in the central Everglades also increase flows to the southern estuaries. Because the natural system benefits of the CEPP and the C-111 Spreader Canal projects to date are discussed earlier in this chapter, this information is not repeated here. This section focuses on the documented restoration benefits of the CERP Biscayne Bay Coastal Wetlands Project, with a brief discussion of non-CERP efforts and the recently launched Biscayne Bay and Southeastern Everglades Ecosystem Restoration planning effort.
CERP Projects: Biscayne Bay Coastal Wetlands (Phase 1)
The primary goal of the Biscayne Bay Coastal Wetlands (BBCW) Project is to reduce nearshore salinity and improve the ecological condition of wetlands, tidal creeks, and other habitats by increasing freshwater flows to Biscayne Bay and Biscayne National Park. As a consequence of historical hydrologic alteration and development, freshwater delivery to Biscayne Bay has been greatly reduced, particularly in the dry season, resulting in loss of wetlands and an increase in salinity along the western margin of the bay. The full BBCW Project, as outlined in the Yellow Book (USACE and SFWMD, 1999), envisioned restoration of wetland hydroperiods to 11,300 acres of the total 22,500 acres of wetlands through freshwater inputs; the project was not designed to reduce nutrient inputs. The footprint of Phase 1 of the BBCW Project is small; its goals are to restore about 400 acres of freshwater wetlands and increase water flows in another approximately 2,000 acres in three geographically distinct components: the Deering Estate Component, just north of the Biscayne Bay National Park, and the Cutler Wetlands and L-31E Flow-way components, portions of which are within the national park (Figure 3-23; USACE and SFWMD, 2012).
Project implementation includes construction of pump stations, spreader canals, and culverts, and the reestablishment of flow-ways (USACE, 2019e). The Deering Estate Component was completed in 2012. In the past 2 years, the remainder of the 10 planned culverts in the L-31E Flow-way were also completed
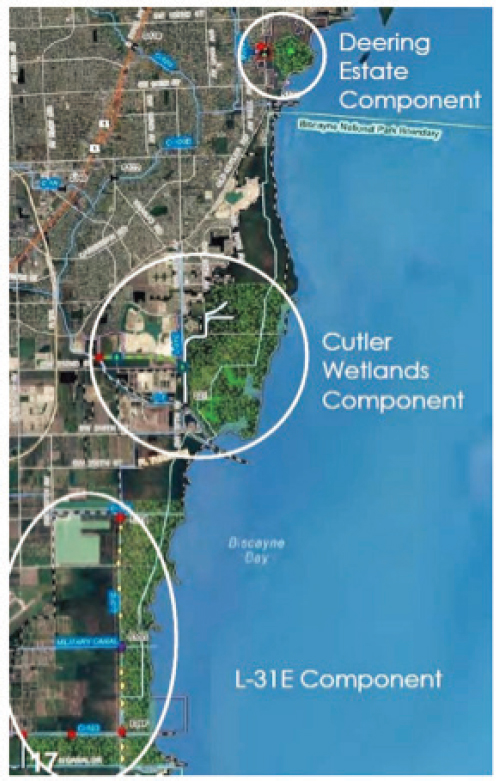
SOURCE: USACE and SFWMD, 2012.
and were made operational in WY 2019. From August 2018 to mid-2020, the SFWMD operated a 40-cfs interim pump to increase water levels in the L-31E Canal to the optimal level of 2.2 feet National Geodetic Vertical Datum of 1929 (NGVD29) in order to increase water flow through the culverts to coastal wetlands east of the L-31E levee. The pump could operate only as long as there was excess freshwater to be diverted, which was often lacking. A critical challenge for each component, looking forward, is whether there will be an adequate supply of freshwater, especially during the dry season, to achieve established targets.
The USACE is expected to finish construction of the L-31E Component in 2024, which will include a total of five pump stations. Construction of the Cutler Wetlands Component is scheduled for 2021 (USACE, 2019e). Planning for Phase 2 of the BBCW has been incorporated into an integrated planning effort—the BBSEER (USACE and SFWMD, 2020b), which is beginning in summer
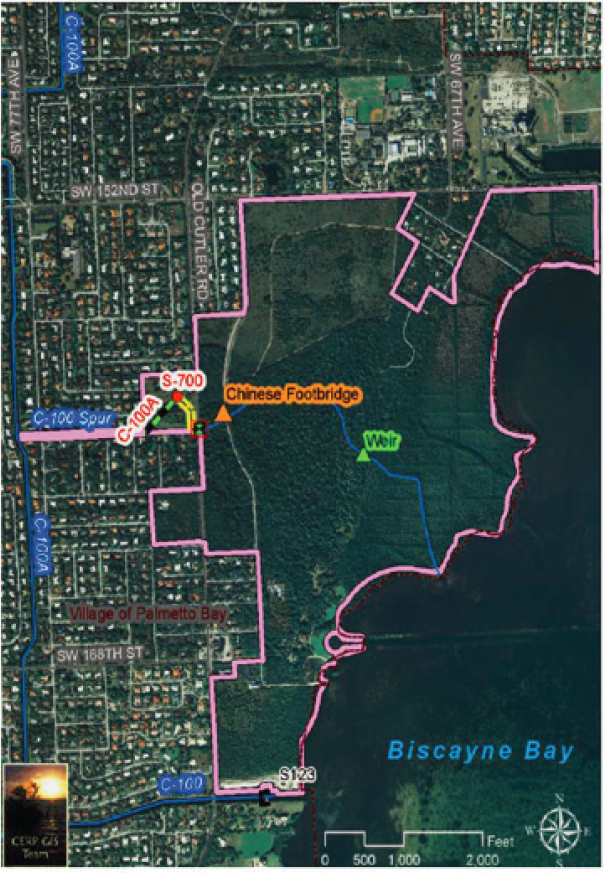
SOURCE: Charkhian, 2020.
2020. The documented restoration benefits to date from the project components implemented are discussed below.
Deering Estate.
The S-700 pump station on the C-100A spur canal within the Deering Estate is designed to restore historic freshwater flows through the Cutler Drain Slough and into the coastal wetlands, reducing nearshore salinity. The hydrologic goal was to redirect up to 100 cfs of water from the C-100A spur canal, that would otherwise flow through the S-123 structure, to the coastal wetlands (Figure 3-24), thereby reducing point-source freshwater discharges from S-123. To alleviate the hydrologic flashiness that occurred with intermittent pumping, the SFWMD moved to continuous pumping at a minimum rate of 25 cfs to maintain water flows to the coast. This change was slow to be implemented and was only initiated in WY 2019 (Charkhian, 2019; see also NASEM, 2018).
Monitoring results show clear improvement of hydrologic conditions in response to pumping. In WY 2019, which had greater than average rainfall, the S-700 pump station diverted 24,414 AF of freshwater (up from 17,150 AF in WY 2018) to the coastal wetlands (Charkhian, 2020) with 10,851 AF discharged through S-123 at the southern edge of the estate (down from 40,686 AF in WY 2018). These results demonstrate progress toward one project objective, which is to minimize discharge of water through the S-123 structure. When the S-700 pump station is operating, both ground- and surface-water salinity at wetland monitoring stations decrease markedly, to less than 1 practical salinity unit (PSU). Median salinity in Deering Estate Creek water decreased from 24.3 in WY 2014-2018 to 18.1 in WY 2019 (Charkhian, 2020). Vegetation within the vicinity of the Deering Estate component is responding to improved hydrology, as indicated by die-off of upland vegetation, the emergence of wetland species, and a modest expansion of sawgrass (Cladium jamaicense) (Charkhian, 2020).
The L-31E Component.
The goal of the L-31E Component is to improve habitat conditions by diverting water that would normally be released through the L-31E Canal to the adjacent coastal wetlands, thereby lowering nearshore salinities. A chronic challenge for the project is an insufficient supply of freshwater that limits flows from the canal through the L-31E culverts and into the wetlands (Figure 3-25). This condition has been in part due to the lack of pumps to move water into the canal and raise and maintain canal stage high enough (canal stage target level is 2.2 feet NGVD29) to promote outflow through the culverts. In WY 2019, the interim pump met the target canal stage in the wet season, but due to lack of water, canal stages were 1.9 feet NGVD29 in the WY 2018 dry season. The USACE began construction on the five L-31E pump stations, spreader swales, and recreation features in 2020.
The SFWMD has set a performance target to divert 4 percent of the total coastal discharges to the wetland as freshwater flow from the L-31E Canal,
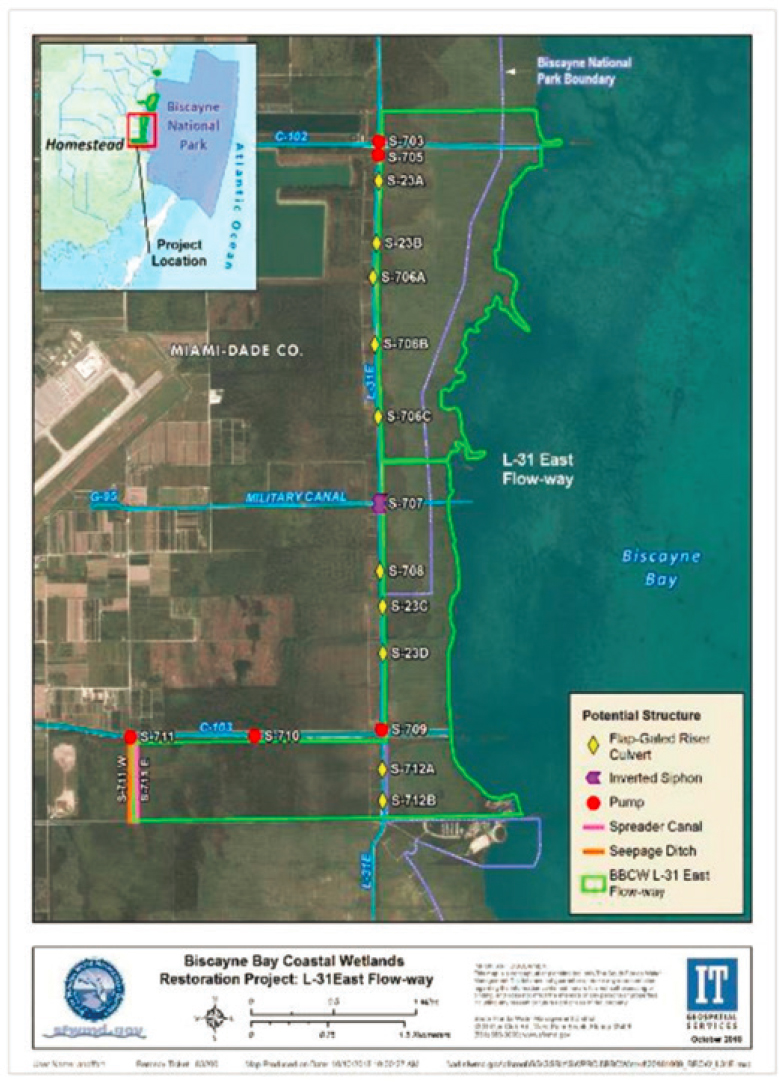
SOURCE: Charkhian, 2020.
although this diversion is not specifically tied to ecological targets. Between water years 2012 and 2017, the project met the flow target in only 24 of the 84 months. In WY 2019, after the interim pump was installed, an average of 5.8 percent of water flow was diverted (5.3 percent of wet season flows and 6.3 percent of dry season flows). Pump operations have raised water levels in the canal, resulting in 35 weeks of inundation in the vicinity of the pumps. When the pump is running, salinity decreased to less than 5 PSU in the coastal wetlands 100 m downstream of the culverts (Charkhian, 2020), which meets the salinity target range of less than 20 PSU in tidal wetlands (USACE and SFWMD, 2012).
The ecological impact of the project is promising but remains limited by the availability of freshwater to move to the Bay. Sawgrass recruitment has been observed east and west of the L-31E Canal within the coastal wetlands, and since 2013 the total cover of sawgrass increased by more than 9 acres east of the L-31E levee (Charkhian, 2020).
Non-CERP Projects
The non-CERP Combined Operational Plan (COP), which establishes the operating rules for the C-111 South Dade and Modified Waters Deliveries to Everglades National Park projects, increases flows to eastern Florida Bay, and these benefits are discussed in detail in Chapter 4. Information on the collective benefits of planned restoration projects for the southern estuaries is also synthesized in Chapter 5. One additional non-CERP effort to evaluate the benefits of a seepage barrier on the eastern boundary of Everglades National Park is just beginning a public planning process, and is too early in its planning process to evaluate.
CERP Projects in Planning: Biscayne Bay and Southeastern Everglades Ecosystem Restoration
In September 2020, a 3-year planning process was launched for the large, multicomponent project BBSEER (USACE and SFWMD, 2020b). As with the CEPP, BBSEER is combining planning for multiple CERP components into an integrated planning process, including Biscayne Bay Coastal Wetlands (beyond Phase 1), C-111 Spreader Canal (Eastern Phase), South and West Miami Dade Reuse, and North Lake Belt. The committee did not review this effort, because it was launched late in the study process. Future needs for the southern estuaries are discussed in Chapter 5.
CONDITIONS AT A SYSTEMS SCALE
The RECOVER System Status Report (SSR) is compiled approximately every 5 years to present a systemwide update on the overall ecological condition of the Everglades ecosystem by synthesizing monitoring data as they relate to systemwide hypotheses and restoration goals, providing a description of the status and trends of system condition. The SSRs were envisioned as a key step in the CERP systemwide adaptive management process, by providing a measure of the extent to which the goals and objectives of the CERP are being met and identifying corrective actions for any major unanticipated findings (RECOVER, 2007b).
For the first time, the 2019 SSR (RECOVER, 2019) includes an Everglades Report Card; a stand-alone summary report of the status of the Everglades from 2012 to 2017 using ecosystem indicators and performance measures of the CERP. The Report Card uses clear and easy-to-understand graphics to describe the status of each of five reporting units including the entire Everglades system and its four geographic subregions: the northern estuaries, Lake Okeechobee,
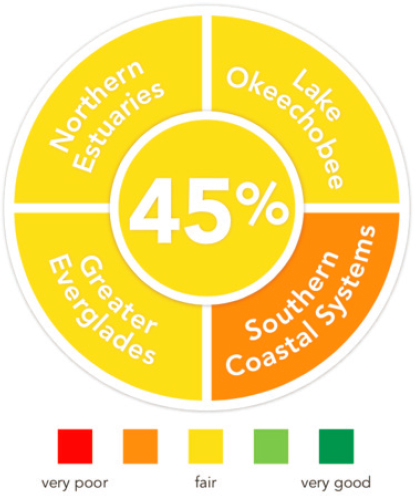
SOURCE: RECOVER, 2019.
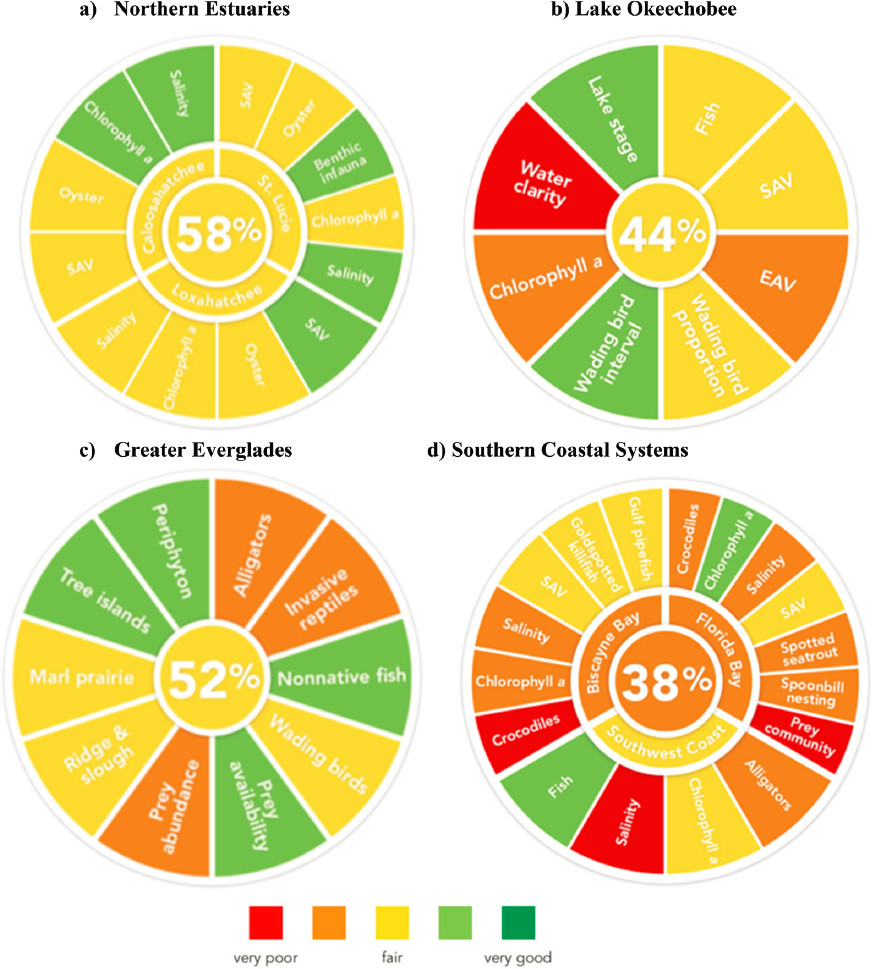
SOURCE: RECOVER, 2019.
the greater Everglades, and the southern coastal systems. Indicator scores were developed and combined to communicate the Everglades’ ecological condition to the public. Much of the SSR is structured around the Report Card results, with explanations of the indicators used and a discussion of monitoring data from the past 5 years.
The SSR and Report Card paint an alarming picture of the Everglades’ condition, concluding that the Everglades ecosystem is in fair condition (Figure 3-26; Report Card scores for the four subregions of the Everglades are shown in Figure 3-27 and described in more detail in Box 3-2). The narrative accompanying the Report Card describes the Everglades as providing only minimal ecosystem functions, leaving it vulnerable to further ecological degradation, with essential ecosystem functions degraded and unsustainable. The South Florida Ecosystem Restoration Task Force came to a similar conclusion in its most recent System-Wide Indicators report (Brandt et al., 2018), stating that “none of the indicators have shown improvement over this reporting period and none have met restoration targets.” The indicators reported on by the Task Force are a subset of the systemwide indicators used by RECOVER and confirm the findings of the SSR. The SSR goes on to say that “the Florida Everglades is struggling to survive in the face of sustained pressure from human activities and the increasing impacts of climate change.” The poor to fair scores for the subregions indicate that the “anticipated ecological benefits of restoration are still to be realized.” Although CERP project components implemented to date—Picayune Strand, C-111 Spreader Canal, and Biscayne Bay Coastal Wetlands—are beginning to deliver ecological benefits, they are relatively small in scale (compared to other pending CERP projects) and geographically disconnected, limiting the ability to detect benefits at a systemwide scale. Both the SSR and the Task Force call for continued, rapid action to implement the CERP and reverse the ongoing decline of the ecosystem to prevent impacts to tourism, recreation, and the economy of South Florida.
The creation of the Report Card shows a concerted effort by RECOVER to develop a means to effectively communicate progress on Everglades restoration to the public. A large amount of data was compiled and used to evaluate the status for each of the Everglades subregions and for the system as a whole—a valuable exercise that brings attention to a wealth of monitoring data. Results are presented in clear, easy-to-interpret graphics. However, some of the approaches used to analyze data and calculate Report Card indicator scores lead to questionable findings. As an example, salinity in the St. Lucie Estuary fluctuates widely, with levels that are often lower or higher than the target salinity range. These extreme conditions have contributed to five major oyster die-offs in the St. Lucie Estuary. However, in calculating the salinity indicator, the high and low values are averaged, resulting in a “moderate” mean salinity and an indicator score of
“good”—a far more optimistic assessment of the system than conditions on the ground warrant. Interestingly, the RECOVER team acknowledges this, saying that some indicator scores belie the high variability in the system. It seems likely that some of the Report Card scoring methods will need to be revised before the next SSR is produced.
The SSR is valuable in its compilation of data on different regions of the system, but it does not employ rigorous analytical methods that could illustrate trends and cause-and-effect relationships on restoration targets as CERP projects come online. As a result, the SSR fails to leverage the potential value of the data for adaptive management, project planning, and operation. The data are presented one variable at a time (e.g., chlorophyll a, algae, SAV, water levels), with little exploration of the relationships among various factors. Time-series data (typically for 2012-2017) are shown for many variables (e.g., wading bird nesting), but generally not in the context of restoration goals, and no analysis of long-term trends is performed (although some of this is presented in the Task Force Systemwide Indicators report [Brandt et al., 2018]). Older versions of the SSR contained more detailed analysis, but were sometimes criticized for being difficult for decision makers to digest. For example, NRC (2008) stated:
The highly technical nature of much of the [2007] status report is a consequence of the focus on establishing baselines and change detection for the performance measures. As a result, the document is primarily of interest to scientists working on similar problems. Nonetheless, this type of analysis is critical to future assessments of changes in response to the CERP. For future system status reports with objectives that reach far beyond establishing baselines, this high degree of technical detail alone is unlikely to satisfy the needs of project managers and decision makers. Managers will need information relevant to the interim and ultimate restoration goals. To maximize the usefulness of future status reports for adaptive management, those reports should contain succinct summaries that clearly address whether the interim and longer-term goals are being met; if not, why; and what CERP operations or design changes are most likely to move ecosystem response closer to the interim goals.
In striving for more “user-friendly” documents, the 2019 SSR and Report Card (RECOVER, 2019) may have tipped the balance too far, by omitting critical analysis and synthesis of information to inform decision making. As increasingly more CERP and non-CERP projects are constructed and operated, CERP decision makers would benefit from analyses of long-term trends in monitoring data and more sophisticated analysis of multiple factors on system responses relative to restoration goals. There will be an increased need for information on the integrated system response so that decision makers and the public can understand
the progress toward restoration goals and issues that may pose challenges toward meeting those goals to provide support for adaptive management.
Although the intent of the 2019 SSR is described as informing adaptive management, no recommendations are made to reverse the ongoing degradation and ensure that restoration is on track to meet interim goals. RECOVER (2019) acknowledges threats of climate change—particularly the impacts of sea-level rise, which has risen 11 inches at Key West over the past 105 years—as major influences on current and future system conditions that restoration planning must take into account. However, no guidance is given on what adjustments might be made in restoration planning and implementation in support of CERP goals. RECOVER could provide better support for adaptive management in future SSRs by providing specific recommendations of management options based on the analyses of monitoring data at a systems scale.
CONCLUSIONS AND RECOMMENDATIONS
State and federal funding for the CERP has increased significantly in recent years, which expedites the pace of project construction. Following a period of historically low state and federal funding for the CERP (2012-2016), state funding for the CERP has approximately doubled to more than $200 million per year. With federal CERP funding of $247 million in FY 2020, CERP funding has exceeded the original vision of $200 million per year from both the state and the federal government for the first time since the program’s inception, and similar funding levels are anticipated in FY 2021. With this increased funding, CERP projects can be completed more quickly, resulting in faster restoration benefits and potentially mitigating ongoing ecosystem degradation.
The 2019 Integrated Delivery Schedule (IDS) does not effectively communicate likely restoration schedules and priorities consistent with realistic funding constraints. The 2019 IDS is based on the fastest possible construction schedule, given project dependencies, regardless of budget; the IDS assumes an average funding of more than $800 million per year for the first 5 years (nearly double the record budget in FY 2020). These assumptions may be acceptable for the purpose of explaining the benefits of increased funding, but they fail to support the difficult decisions that must be made when future funding is inadequate to meet these optimistic projections. CERP planners, in some simple alternative scenarios, assume that reduced funding simply stretches the timeline of the IDS proportionally. However, an optimal project prioritization is likely to be time dependent. In light of ongoing degradation of the system and peat collapse in the southern Everglades, it is probably unwise for all projects to be delayed equally with reduced funding. Rather, some projects should be prioritized based
on project benefits in relation to ongoing system degradation. Uncertainty of funding (which occurs on a regular basis) necessitates evaluation of realistic and alternative levels of funding with consideration of the many time-dependent factors that may affect an optimal project prioritization. Development of the IDS could serve as a means to debate these challenging decisions with the multiple CERP agencies and stakeholders, as well as communicate the effects of schedule changes on the nature and timing of anticipated ecosystem benefits in the context of current ecosystem trends and ongoing pressures such as sea-level rise and harmful algal blooms.
Signs of restoration progress are evident from three CERP project increments operating to date, but limitations in monitoring, analysis, and communication of results have impeded quantitative assessment and communication of restoration benefits. Increments of the Picayune Strand and Biscayne Bay Coastal Wetlands (Phase 1) projects and nearly all of the envisioned C-111 Spreader Canal (Western) Project have been operating for years, providing an important opportunity to learn from those results and communicate those incremental benefits to the public. Results from monitoring in Biscayne Bay Coastal Wetlands and Picayune Strand show positive trends and qualitative evidence of effects from implementation. Operations have been refined in the Biscayne Bay Coastal Wetlands Project to improve restoration outcomes (although some benefits remain limited by lack of available freshwater for the project). Assessments of restoration progress continue to be stymied by a lack of systematic analyses of quantitative results from early indicators of restoration relative to expected outcomes. Without this information, it is difficult to assess and communicate progress. This limitation applies to all three projects in some dimension, but is most evident in the C-111 Spreader Canal and Picayune Strand Projects, and improvements are needed. Understanding the challenges and opportunities for improved monitoring will lead to better restoration assessment.
Important opportunities for learning from monitoring at Picayune Strand are being missed that could inform current and future project management decisions across CERP and non-CERP agencies. Understanding the response of vegetation and fauna to restoration at Picayune Strand is hindered by invasive species and fire management. Widespread drainage of the area allowed invasive species to become established. Project managers should revisit the project goals and expectations, potentially shifting the ecological objectives toward improving conditions for desirable species and increasing resilience across the region to respond to climate change. Improved coordination across CERP and non-CERP agencies regarding fire management is needed. The monitoring plan should also be redesigned to support adaptive management of the project. An acknowledgment that hydrologic restoration is unlikely to replicate predrainage
ecology could help agencies prioritize additional management actions, including fire management, necessary to achieve these revised goals.
STAs have been an effective approach to mitigate total phosphorus inputs to the Everglades Protection Area, but recent high concentrations in STA-2 effluent, several years after implementation of Restoration Strategies features for the central flow-way, raise concerns. The SFWMD 2018 Science Plan provides recommendations for evaluating factors to improve the performance of STAs that could be helpful in achieving lower effluent concentrations of total phosphorus and guide future operations. The SFWMD is planning to complete Restoration Strategies by 2025, and has until 2027 to demonstrate compliance. However, intensive efforts now to analyze and optimize performance and address shortfalls could help avoid delays in meeting the water quality criteria and delivering new water from the CEPP. With heightened concerns about elevated nutrient loading and harmful algal blooms in the northern estuaries, the state is increasingly interested in water quality management of contaminants beyond phosphorus, especially for nitrogen. A preliminary analysis suggests limited removal of nitrogen by STAs. Therefore, research to improve understanding of nitrogen retention and loss in STAs and the potential to enhance nitrogen removal would inform decisions on the management of harmful algal blooms.
Phased implementation of major features of the Lake Okeechobee Watershed Restoration Project (LOWRP) will help accommodate the numerous uncertainties associated with aquifer storage and recovery (ASR), a technology that remains unproven at the proposed scale of deployment. The objectives of the LOWRP include reducing damaging discharges to the northern estuaries and improving lake levels in Lake Okeechobee. The tentatively selected plan proposes reduced aboveground water storage relative to the original CERP vision with the bulk of water storage provided by ASR wells. To address critical unknowns while moving forward with restoration, installation should proceed in increments of two to five ASR wells, with postinstallation monitoring to address outstanding questions related to the quality of recharged and recovered waters, ecological effects, and recovery efficiencies. Because aboveground storage provided by the wetland attenuation feature is small and its benefits are largely linked to the performance of ASR, the recently proposed schedule that postpones construction of the wetland attenuation feature until the ASR uncertainties are resolved is appropriate. Prior to construction, the contributions of the wetland attenuation feature to the LOWRP’s objectives of regulating lake water levels and estuary discharges should also be clarified and considered in the context of its cost.
The Everglades overall remain vulnerable to continuing degradation. The RECOVER 2019 System Status Report noted the dire condition of the Everglades
ecosystem, with a “fair” rating of conditions systemwide and “poor” conditions in the southern coastal systems. Overall, the CERP projects operating to date have been limited and are disconnected on the landscape, leading to limited detectable responses of restoration at a systems scale. However, with several large reservoirs under construction in the northern everglades and the Combined Operational Plan in place in the southern part of the ecosystem, substantial restoration benefits are expected in the years ahead.
The System Status Report (SSR) provides a useful compilation of data, but the lack of reporting of long-term trends and influencing factors limits its value to adaptive management and operational decision making. In the 2019 SSR, RECOVER compiles and presents a substantial amount of data to document the status and trends of the Everglades restoration for the period 2012-2017. Rigorous long-term trend analysis was not completed, making it more difficult to assess restoration progress and the causes of any observed changes. Synthesis of the findings of more rigorous multivariate analyses are needed in future system status reports to effectively leverage the results and develop improved systems-level understanding that can be used to inform future decisions. The Everglades Report Card, included as a stand-alone graphical summary of ecological conditions, represents a positive step in public communications, although methodological issues in some of the scoring approaches will need to be remedied in future reports.
This page intentionally left blank.


