
3
Demography and Public Attitudes of Sexual and Gender Diverse Populations
This chapter reviews demographic patterns and trends among sexual and gender diverse (SGD) populations. In any assessment of the demographic characteristics of these groups, visibility and the coming out process are critical considerations in interpretations of findings, particularly those focused on historical trends. Nearly all research in this area has focused on sexual orientation or same-sex sexual behavior or relationships. More recently and to a lesser extent there has been demographic research on transgender populations. There are still almost no demographic data on people with differences of sex development (DSD) in the general population or on people who might identify as intersex. This is a significant gap in terms of identifying and understanding the well-being of intersex populations.
This chapter focuses on overall prevalence estimates of sexual and gender diverse populations and provides some detail on geographic variation, age, race and ethnicity, and child-rearing practices of these populations. This does not represent an exhaustive list of important demographic traits. Information relating to economic status, immigration status, disability, and religion are discussed in greater detail in other chapters in this report.
The decision to disclose one’s sexual orientation, gender identity, or intersex status in any data collection setting can be affected by factors that include a sense of social acceptance, the presence of nondiscrimination protections, and perceptions of confidentiality and privacy. In the absence of affirming and protective environments, policies, and practices, some who consider themselves to be lesbian, gay, bisexual, or transgender (LGBT), who have intersex traits/DSD, or who otherwise identify as not cisgender or
heterosexual may decide not to disclose details of their sexual orientation, gender identity, or intersex status. Those decisions introduce a potentially inherent bias into assessments of SGD communities. Thus, it is important to understand that knowledge of the demographic characteristics of SGD populations is largely limited to information about those willing to disclose aspects of identity, behavior, or medical history that have been or still are stigmatized as non-normative.
PREVALENCE
Findings from both the General Social Survey (GSS) and Gallup show substantial increases in LGBT identification over the last decade. In combined GSS data for 2008–2012, 3.0 percent of adults identified as lesbian, gay, or bisexual. That figure increased by 60 percent, to 4.8 percent, in combined data for 2014–2018. In 2012, Gallup reported that 3.5 percent of U.S. adults identified as LGBT. That figure increased by almost 30 percent, to 4.5 percent, in the 2017 Gallup data. The GSS and Gallup figures imply that an estimated 11.4–12.2 million U.S. adults identify as LGBT: see Figure 3-1.1 This number is roughly equivalent to the population of Ohio. Analyses of Gallup data suggest that virtually all of the change in LGBT identification is among younger age cohorts.2
Findings from 10 states using population-based data from the state-level Youth Risk Behavior Surveillance System show increases in adolescents aged 14–18 identifying as non-heterosexual, from 7.3 percent in 2009 to 14.3 percent in 2017. These data also show increases in same-sex sexual contact, from 7.7 percent in 2009 to 13.1 percent in 2017 (Raifman et al., 2020).
A lack of historical data on the transgender population limits the ability to consider changes to population estimates over time. In studies that rely on clinical records, primarily from Europe, estimates of the transgender population size range between 1 and 30 people per 100,000 (0.001 to 0.03 percent) (Goodman et al., 2019). Studies that focus instead on self-report among nonclinical populations find estimates that range between 0.1 and 2.0 percent (Goodman et al., 2019). A 2016 nationwide estimate using population data from the Behavioral Risk Factor Surveillance System (BRFSS) estimated that 0.6 percent of U.S. adults identify as transgender (Flores et al., 2016), along with 0.7 percent of adolescents aged 13–17 (Herman et
___________________
1 These numbers are based on a calculation by Gary J. Gates using Census Bureau estimates that there are nearly 254,000,000 adults aged 18 and older in the United States (see https://www.census.gov/data/tables/time-series/demo/popest/2010s-national-detail.html), of whom 4.5–4.8 percent are LGBT.
2 See https://news.gallup.com/poll/201731/lgbt-identification-rises.aspx.
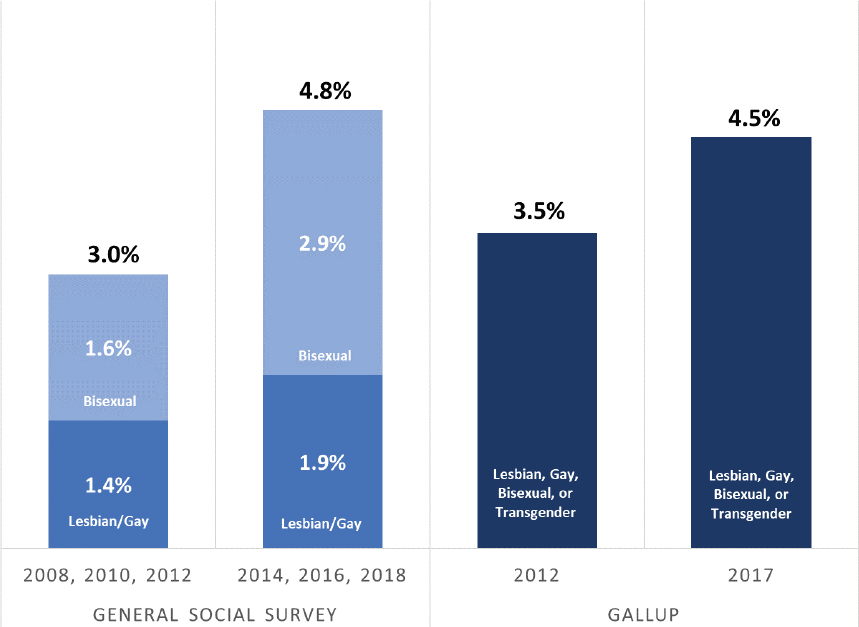
SOURCE: Data from the General Social Survey and Gallup Poll, 2008–2017.
al., 2017). This estimate implies that approximately 1.4 million adults3 and 150,000 adolescents aged 13–17 identify as transgender in the United States (Herman et al., 2017). A meta-analysis of multiple data sources from 2007 to 2015 found a similar estimate of approximately 1 million transgender people (0.39 percent of the U.S. population), with higher proportions among younger age groups (Meerwijk and Sevelius, 2017). In California, findings from a population-based sample of high school students found that 1.1 percent identified as transgender (Perez-Brumer et al., 2017). Of note, many surveys that ask about gender identity simply add a “transgender” option to an existing binary (male/female) sex question, which has been shown to result in substantial undercounts of transgender individuals in comparison with a two-step question design that asks about both current gender identity and sex assigned at birth (Tate, Ledbetter, and Youssef, 2013; Tordoff et al., 2019).
Increases have also been found in reported same-sex sexual behavior, though more so among women. In the 2002 National Survey of Family
___________________
3 This figure is based on a calculation by Gary J. Gates using Census Bureau estimates that there are nearly 254,000,000 adults age 18 and older in the United States (see https://www.census.gov/data/tables/time-series/demo/popest/2010s-national-detail.html), of whom 0.6 percent are transgender.
Growth (NSFG), 11.2 percent of women aged 15–44 reported having had same-sex sexual contact (Mosher, Chandra, and Jones, 2005); in the 2011–2015 NSFG, that figure had increased to 17.6 percent.4 That pattern does not hold for men. Among men aged 15–44, 6.0 percent reported any same-sex anal or oral sexual activity in the 2002 NSFG (Mosher, Chandra, and Jones, 2005), compared with 5.1 percent in 2011–2015.5 Findings from the GSS show increases across birth cohorts in the proportion of adults who have had sex with both men and women since age 18: among those born prior to 1965, less than 5 percent of both men and women report such sexual activity; among those born between 1984 and 2000, the figure is more than 20 percent for women and 12 percent for men (Mishel et al., 2020).
The NSFG has also reported increases in same-sex sexual attraction. Among women aged 18–44 in the 2006–2010 data, 4.4 percent report being equally attracted to both men and women or mostly or exclusively attracted to women. In the 2011–2015 data, that figure was 5.5 percent. Women who said they were mostly rather than exclusively attracted to men also increased, from 12.1 percent to 12.7 percent. Among men aged 18–44, those who reported equal attraction to men and women or mostly or exclusively attracted to men increased in the two surveys from 2.7 percent to 3.1 percent. The proportion of men who said they were mostly rather than exclusively attracted to women increased from 3.5 percent to 4.0 percent.6
Recent estimates from the Current Population Survey (CPS) suggest that there are 1,012,000 same-sex couples in the United States, of whom 543,000 (54%) are married (U.S. Census Bureau, 2019). In comparison, estimates from the 2010 census found approximately 650,000 same-sex couples (O’Connell and Feliz, 2011).7 Estimates based on Gallup data from June 2016 to June 2017 suggest that 23.3 percent of all LGBT-identified adults are married, with 10.2 percent married to a same-sex spouse and 13.1 percent married to a different-sex spouse. An additional 10.8 percent are cohabiting with a partner: 6.6 percent are cohabiting with a same-sex partner and 4.2 percent with a different-sex partner (Jones, 2017). It is important to note that many bisexuals, who account for more than half of adults who identify as LGBT, report cohabitation with different-sex partners and spouses, likely accounting for many of the LGBT adults who report living with different-sex partners or spouses.
___________________
4 See https://www.cdc.gov/nchs/nsfg/key_statistics/s.htm#sexualfemales.
5 See https://www.cdc.gov/nchs/nsfg/key_statistics/s.htm#oralanal.
6 Key Statistics from the National Survey of Family Growth: see https://www.cdc.gov/nchs/nsfg/key_statistics/s.htm#sexualattraction.
7 Of note, there are methodological differences in how the CPS and the 2010 census identify same-sex couples. Also, the 2010 figure is adjusted from original census tabulations to account for measurement error due to potential sex miscoding among different-sex couples.
Increases in LGBT identification are likely a result of more people in SGD populations being willing and able to self-identify and be visible. Analyses of several population-based data sources, however, show that these increases are not uniform by sexual orientation identity, age, race, or ethnicity. In particular, the evidence suggests that increases in LGBT identification are more prominent among bisexual people, women, younger adults, and racial and ethnic minorities.8 Unfortunately, research explaining why particular groups have become more willing to disclose their LGBT identification remains sparse.
THE ROLE OF PUBLIC ATTITUDES
Historic trends in national LGBT prevalence estimates offer evidence of a link between social acceptance and LGBT identification. In 1972 the GSS reported that 73 percent of American adults believed that homosexuality was always wrong, while 11 percent believed that homosexuality was not wrong at all. In 2008, only a small majority, 52 percent, said such relationships were always wrong, while 38 percent said that same-sex sexual relationships are not wrong at all. By 2018, only 32 percent said homosexuality was always wrong, and 58 percent said it was not wrong at all (Gates, 2017): see Figure 3-2.
Gallup analyses show similar trends. In 2008, 55 percent of U.S. adults thought that gay and lesbian relationships between consenting adults should be legal. By 2019, that figure had risen to 73 percent (Gallup, 2019). There
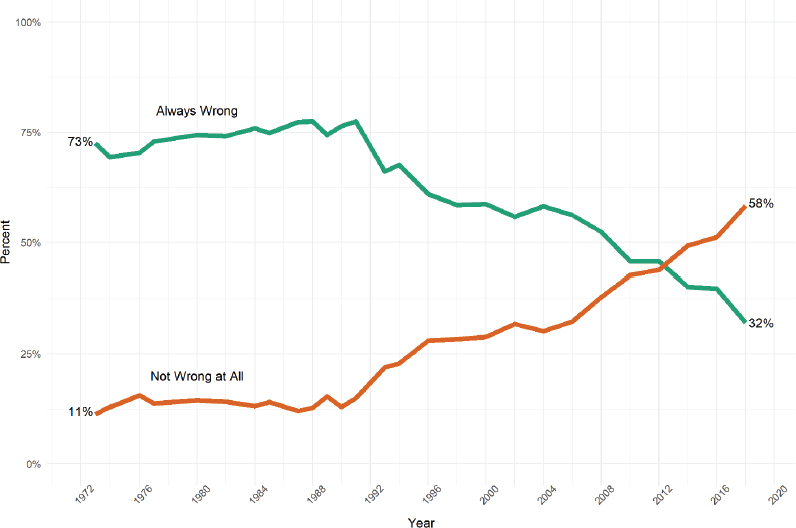
SOURCE: Data from the General Social Survey cumulative data file, 1972–2018.
___________________
8 See https://news.gallup.com/poll/201731/lgbt-identification-rises.aspx.
are insufficient longitudinal data to draw conclusions about historical trends in public attitudes about transgender people, but the growing visibility of transgender people in the media and in public life over the past 10 years may indicate a social climate of growing acceptance. For example, Jones and colleagues (2019b) found that, from 2017 to 2019, people favorable attitudes toward transgender rights markedly increased. Almost half (49%) of U.S. adults across all age groups and partisan affiliations in a 2020 poll from the Kaiser Family Foundation (KFF) believed U.S. society had not gone far enough in accepting people who are transgender, compared with only 15 percent who said society has gone too far (Kirzinger et al., 2020). The percentage who say society has not gone far enough has increased by 10 points since a similar poll conducted in 2017 (Horowitz, Parker, and Stepler, 2017).9
In a 2019 poll, 63 percent of all respondents said that lesbian, gay, and bisexual people experience “a great deal” or “a fair amount” of discrimination in the United States today, and 69 percent said the same about transgender.10 In a recent poll, large majorities of the American public said that there is at least some discrimination against lesbian, gay, and bisexual people (74%) and transgender people (79%) in the United States today, which is comparable to the proportion who believe discrimination exists against Black (84%) and Hispanic people (77%) (Kirzinger et al., 2020). In the KFF poll, the proportion of respondents who said there is “a lot” of discrimination against transgender people in the United States today was comparable to those who said the same about Black people (45% and 53%, respectively) (Kirzinger et al., 2020).
In tandem with awareness of ongoing discrimination against SGD people, there is also widespread support for policies that address discrimination. A recent study found that 71 percent of U.S. adults supported nondiscrimination protections for LGBT people in employment, public accommodations, and housing (Jones et al., 2019a). Although support varied by partisan and individual demographic characteristics, it is rare to find less than a majority of any demographic group supporting nondiscrimination protections. For example, 56 percent of Republicans, 70 percent of Mormons, 60 percent of Muslims, 54 percent of white evangelical Protestants, and 65 percent of Southerners supported broad nondiscrimination protections (Jones et al., 2019a). In a 2016 poll on education, 86 percent said they believed laws should be in place to protect transgender children from bullying (Taylor et al., 2018). Public attitudes about transgender people
___________________
9 See https://www.pewresearch.org/fact-tank/2017/11/08/transgender-issues-divide-republicans-and-democrats/.
10 See https://d25d2506sfb94s.cloudfront.net/cumulus_uploads/document/x3neaunoh2/econTabReport.pdf.
serving openly in the military tend to also be broadly supportive: a 2016 survey found 68 percent of adults favored allowing transgender people to serve openly (Taylor et al., 2018; see also Lewis et al., 2017). Among active-duty military personnel, 66 percent supported transgender military service (Dunlap et al., 2020). In health care, a 2020 poll found that large majorities said it should be illegal for doctors and other health care providers to refuse to treat people because they are lesbian, gay, or bisexual (89 percent) or transgender (88%) (Kirzinger et al., 2020). Eighty-five percent of respondents agreed that health insurance companies should not be able to discriminate against transgender people in health insurance coverage (Kirzinger et al., 2020).
The public appears more divided on other policies, such as including gender identity protections in public accommodations (e.g., public restrooms), and whether businesses and others should be allowed to deny services to LGBT people on the grounds of a sincerely held religious belief (Taylor et al., 2018). In a recent poll, however, majorities of the public opposed allowing a range of entities to invoke religious exemptions to avoid serving gay and lesbian people, including small business owners (5%), licensed professionals (67%), adoption agencies (60 percent), and companies providing wedding services (55%) (Jones et al., 2019b). In a 2015 poll, two-thirds of respondents agreed that government officials should be obligated to serve everyone the same regardless of their religious beliefs.11 Adults were ambivalent about permitting transgender people to participate in sex-segregated sports according to their current gender identity: a 2015 survey found that about one-third approved of transgender people playing sports in accordance with their gender identity, about one-third disapproved, and about one-third did not approve or disapprove (Flores et al., 2020).
Acceptance has not grown uniformly among American adults. A variety of studies have shown that five demographic characteristics and personal experiences lead people to be more accepting than others (Baunach, 2011, 2012). One factor that contributes to an individual’s accepting attitudes about SGD people and their rights is demographic characteristics (lesbian women and gay men: Baunach, 2011, 2012; Becker, 2012; Becker and Scheufele, 2011; transgender people: Flores, 2015; Norton and Herek, 2013; Taylor et al., 2018). A second factor is values, such as egalitarianism, traditionalism, and authoritarianism (lesbian women and gay men: Brewer, 2003a, 2003b, 2007; Gaines and Garand, 2010; transgender people: Miller et al., 2017; Taylor et al., 2018). A third factor is religion (lesbian women
___________________
11 See https://theharrispoll.com/as-kentuckys-rowan-county-clerk-kim-davis-may-nowrealize-most-americans-believe-that-government-officials-should-not-allow-their-religious-beliefs-to-stand-in-the-way-of-issuing-marriage-li/.
and gay men: Olson, Cadge, and Harrison, 2006; transgender people: Taylor et al., 2018). A fourth factor is emotional predispositions (lesbian women and gay men: Gadarian and van der Vort, 2018; Harrison and Michelson, 2017; transgender people: Michelson and Harrison, 2020; Miller et al., 2017). The fifth factor is personal experiences, such as knowing individual SGD people (lesbian women and gay men: Herek and Capitanio, 1996; Lewis, 2011; transgender people: Jones et al., 2018; Tadlock et al., 2017). Table 3-1 presents a summary of these patterns. It is worth noting that adults in the United States tend to more often report they personally know at least one LGB person (82%; MTV, 2017) than they know at least one transgender person (36%; Kirzinger et al., 2020).
TABLE 3-1 Characteristics that Relate to Attitudes toward Sexual and Gender Diverse Populations
| Trait | Less Support | More Support | Citation |
|---|---|---|---|
| Demographic Characteristics | |||
| Sexual Orientation | Heterosexuals | Lesbians, Gay Men, and Bisexuals | Haider-Markel and Miller (2017) |
| Gender Identity | Cisgender | Transgender | Flores et al. (2020) |
| Age | Older individuals | Younger Individuals | Garretson (2015) |
| Gender | Males | Females | Herek (2002) |
| Educational Attainment | High School or less | College degree or more | Flores (2015) |
| Race | Indeterminate | Indeterminate | Abrajano (2010); Lewis et al. (2017) |
| Ethnicity | Indeterminate | Indeterminate | Abrajano (2010); Lewis et al. (2017) |
| Values | |||
| Moral Traditionalism | More traditionalist | Less traditionalist | Flores et al. (2020); Gaines and Garand (2010) |
| Authoritarianism | More authoritarian | Less authoritarian | Flores et al. (2020); Miller et al. (2017) |
| Religion | Evangelical Christians | Agnostics and Atheists | Olson, Cadge, and Harrison (2006); Taylor et al. (2018) |
| Religiosity | Strong adherents | Weak adherents | Olson, Cadge, and Harrison (2006) |
| Emotion | |||
| Disgust | More sensitive | Less sensitive | Gadarian and van der Vort (2018); Miller et al. (2017) |
| Context | |||
| Region | Residing in the South | Residing not in the South | Lewis and Galope (2014) |
| LGB Population Density | Fewer LGB People | More LGB People | Flores (2014) |
GEOGRAPHIC VARIATION
Assessments of geographic differences in LGBT identification also offer evidence of the associations among social acceptance, legal protections, and willingness to disclose. Even with changing public attitudes about SGD populations, there remain regional differences in levels of acceptance. Rural locations, locations with smaller SGD populations, and locations with larger socially conservative religious communities all show higher levels of stigma and less acceptance (Eldridge, Mack, and Swank, 2006; Flores, 2014; Snively et al., 2004; Taylor, Lewis, and Haider-Markel, 2018; Taylor et al., 2018). A Williams Institute analysis of 2017 data from Gallup showed that LGBT identification was higher in the Northeast and along the West coast, which are areas that tend to have higher levels of social acceptance and legal protections for SGD populations: see Figure 3-3.
Although there may be some differences in the mobility patterns of LGBT individuals—for example, some LGBT people with the ability and resources to relocate may disproportionately move to places with greater social acceptance and legal protections—evidence from the GSS suggests that this likely does not account for most of the geographic differences observed in the Gallup data. Analysis of combined GSS data from 2014, 2016, and 2018 suggests that 37 percent of respondents who identified as
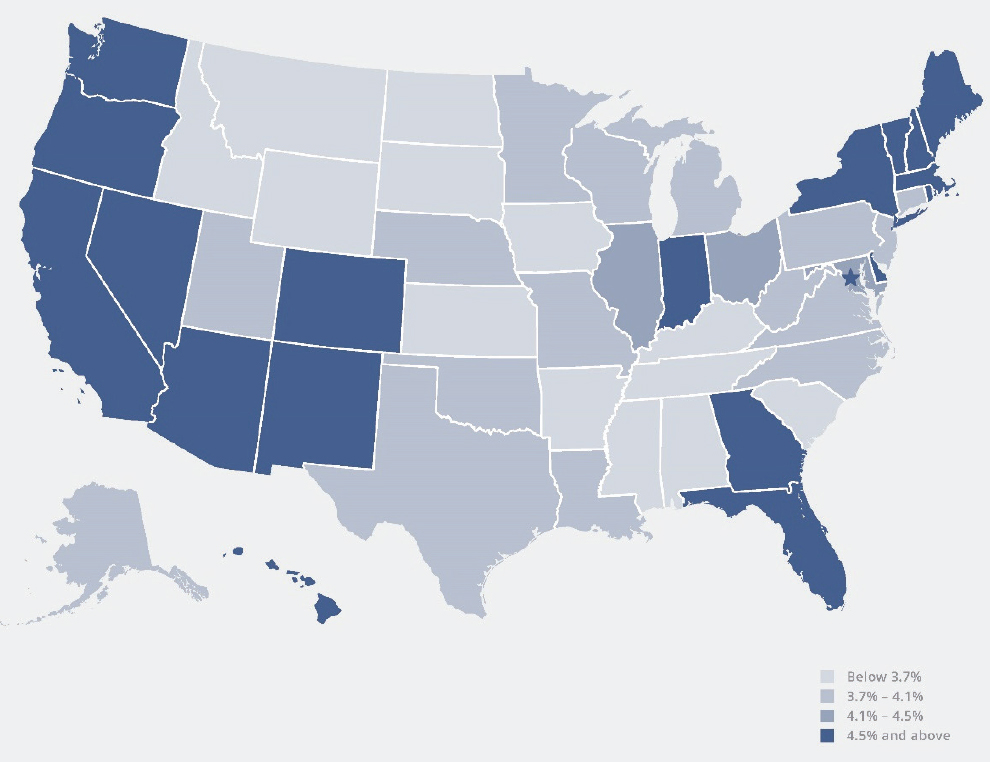
SOURCE: Williams Institute. (2019). LGBT Demographic Data Interactive. UCLA School of Law.
lesbian, gay, or bisexual say that they live in a state that differs from the state where they lived when they were 16 years old, which is not statistically different from the 35 percent of heterosexual respondents with the same response.12 Even if the mobility patterns of lesbian, gay, and bisexual people differ from those of heterosexuals, the similarity between the two groups in the probability of moving likely means that there is not enough mobility among the former group to explain substantial state-level variation in LGBT population sizes. It is more likely that higher levels of social acceptance and legal protections are associated with increased willingness among LGBT people to identify as such on surveys.
In a statewide estimate of support for legal marriage recognition for same-sex couples, Flores and Barclay (2015) found that each state increased in level of support between 1992 and 2014, though some states are far more accepting than others: see Figure 3-4. In 2014 the District of Columbia was notably the most favorable at 86 percent, while southern states such as Alabama remained less approving at 35 percent. Thus, regional differences in
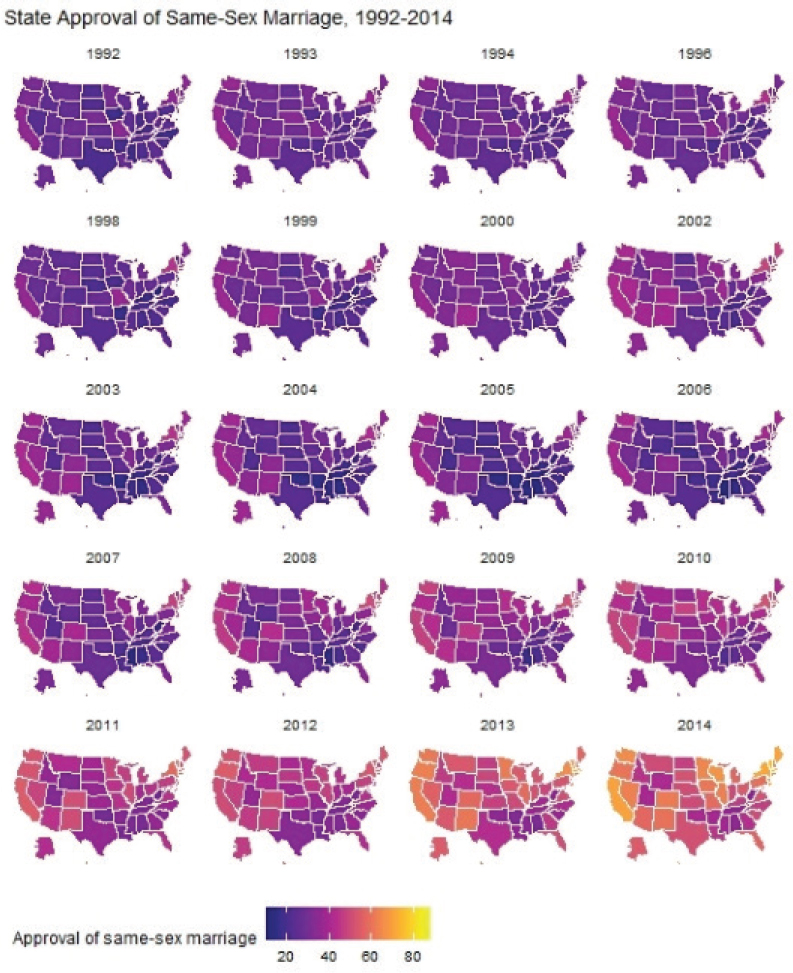
SOURCE: Created by committee with data from Flores and Barclay (2015).
___________________
12 Information retrieved from analyses of General Social Survey data by Gary Gates in 2018, using the Survey Documentation and Analysis online tool maintained by the Institute for Scientific Analysis, San Francisco, CA, under a licensing agreement with the University of California. Tool is available at https://sda.berkeley.edu/sdaweb/analysis/?dataset=gss18.
societal stigma and acceptance both at the state and local levels characterize the variety of contexts in which SGD populations live. In 2019, however, the majority of residents in every state supported sexual orientation and gender identity nondiscrimination protections in employment, accommodations, and housing (Jones et al., 2019a).
GENDER AND SEXUAL ORIENTATION
Analyses of data from the GSS and the National Health Interview Study (NHIS) show a consistent pattern in which increases in lesbian, gay, and bisexual identification have been more pronounced among women and bisexual people: see Figure 3-5. In the 2008–2012 GSS, women comprised 59 percent of the sample of such self-identified adults, with 37 percent of the LGB sample identifying as bisexual women. In the 2014–2018 data, the share of women increased to 66 percent, with 46 percent of the LGB adult sample identifying as bisexual women. The pattern is similar in the NHIS, although the changes are somewhat more modest. In 2013, 53 percent of self-identified lesbian, gay, and bisexual adults on the NHIS were female; by 2018, that proportion had increased to 56 percent. The proportion of NHIS respondents identifying as bisexual also increased over the 5-year
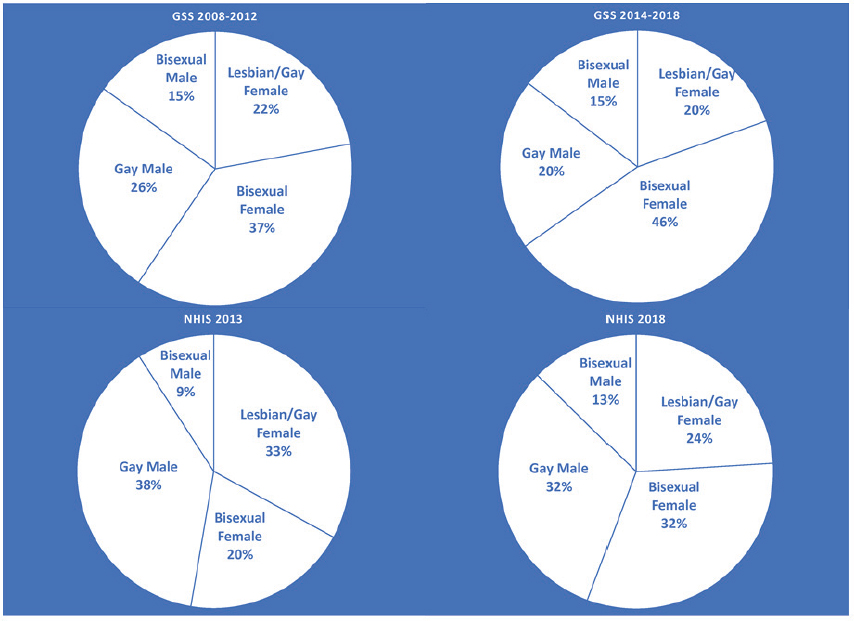
NOTES: GSS, General Social Survey; NHIS, National Health Interview Survey.
period, from 20 percent to 32 percent among women and from 9 percent to 13 percent among men. Women also represent a majority of same-sex couples. Analyses of Census Bureau data show that 54 percent of cohabiting same-sex couples are female (Williams Institute, 2019).
Among transgender people, 46 percent of all transgender respondents on the 2015–2016 California Health Interview Study (CHIS) reported that they were assigned female at birth, and 54 percent were assigned male. Among all transgender respondents, 7 percent identified their current gender as male, 32 percent as female, 46 percent as transgender, and 15 percent indicated that they identified as a gender not listed (Herman, Wilson, and Becker, 2017). Analyses of multiyear pooled BRFSS data from the jurisdictions that fielded the sexual orientation and gender identity module between 2014 and 2016 indicate that approximately half (48%) of transgender BRFSS respondents identified as transgender women, almost one-third (31%) identified as transgender men, and one-fifth (20 percent) identified as gender nonconforming (Downing and Przedworski, 2018).
In the BRFSS sample, 74.6 percent of transgender women identified as heterosexual, compared with 69.8 percent of transgender men and 52.3 percent of gender-nonconforming respondents. The group with the highest proportion of bisexual respondents was gender-nonconforming people (22.9%) compared with 11.5 percent of transgender women and 10.2 percent of transgender men. Among transgender women, 4 percent identified as lesbian or gay, compared with 11.1 percent of transgender men and 2.0 percent of gender-nonconforming respondents.
In the 2015 U.S. Transgender Survey (USTS), a nationwide purposive sample of almost 28,000 transgender and non-binary adults, 57 percent of respondents said they were assigned female at birth, and 43 percent were assigned male at birth (James et al., 2016). Gender identity was assessed differently on the CHIS, the BRFSS, and the USTS, but in the USTS, 29 percent of respondents identified as transgender men, 33 percent as transgender women, 35 percent as non-binary, and 3 percent as crossdressers. Among USTS respondents, 21 percent identified their sexual orientation as queer; 18 percent as pansexual; 16 percent as gay, lesbian, or same-gender-loving; 15 percent as straight; 14 percent as bisexual; and 10 percent as asexual.
AGE
Increases in LGBT identification are more pronounced in younger age cohorts. Gallup analyses show that virtually all the growth in the proportion of the U.S. population identifying as LGBT between 2012 and 2017 can be attributed to increases among those born between 1980 and 1999, often called the millennial generation. The proportion of that group identifying as LGBT was 5.8 percent in 2012 and 8.2 percent in 2017. Other age cohorts were
virtually unchanged (Newport, 2018). In the 2013 NHIS, 1.9 percent of those aged 18–44 identified as lesbian or gay, and 1.1 percent identified as bisexual. In the 2018 NHIS, those figures were 1.8 percent and 2.2 percent, respectively. Among those aged 45–64, there was virtually no change: in 2013, 1.8 percent identified as lesbian or gay and 0.4 percent identified as bisexual; in 2018 the percentages were 1.8 percent and 0.6 percent, respectively.13
Analyses of the GSS data show similar patterns. Among those born between 1980 and 1999, 1.7 percent identified as lesbian or gay, and 2.8 percent identified as bisexual in combined data from 2008, 2010, and 2012. In the 2014, 2016, and 2018 combined data, those figures rose to 2.8 percent and 5.4 percent, respectively. Among all other respondents, the proportions went from 1.4 percent lesbian or gay and 1.2 percent bisexual in the earlier data to 1.5 percent lesbian or gay and 1.5 percent bisexual in the later data, a much more modest increase.
The prevalence of transgender identity is also slightly higher in younger populations, although age differences are less pronounced than for sexual orientation. Estimates from the BRFSS show that 0.7 percent of both 13-to 17-year-olds and 18- to 24-year-olds identify as transgender, compared with 0.6 percent of those aged 25–64 and 0.5 percent of those aged 65 and older (Flores et al., 2017).
RACE AND ETHNICITY
In general, the racial and ethnic characteristics of the LGBT population are similar to those of the general population, and changes over the last decade have mirrored changes in the general population. Data from the 2010 census showed that 36.3 percent of individuals in same-sex couples identified their race or ethnicity as something other than non-Hispanic white (Humes, Jones, and Ramirez, 2011). That figure had increased to 39.6 percent in 2018 (U.S. Census Bureau, 2018). In the 2012 Gallup data, 33 percent of LGBT-identified respondents indicated they were something other than non-Hispanic white. That figure increased to 42 percent in the 2017 Gallup data.14 In the GSS, the proportion changed from 34 percent to 38 percent between the combined 2008–2012 data and the 2014–2018 data. In the NHIS data, the numbers were 31 percent in 2013 and 34 percent in 2018 (Gates, 2018).15 By comparison, Census Bureau statistics from
___________________
13 See https://www.cdc.gov/nchs/nhis/data-questionnaires-documentation.htm.
14 See https://news.gallup.com/poll/201731/lgbt-identification-rises.aspx.
15 Information retrieved from data analyses of the General Social Survey by Gary Gates in 2018, using the Survey Documentation and Analysis online tool maintained by the Institute for Scientific Analysis, San Francisco, CA, under a licensing agreement with the University of California. Tool is available at https://sda.berkeley.edu/sdaweb/analysis/?dataset=gss18.
2019 show that 39.6 percent of the U.S. population identifies as something other than non-Hispanic white.16
In general, data providing detail on the race and ethnicity of sexual and gender diverse populations remain rare, often due to small sample sizes. One exception is Gallup data, which in 2016 showed higher rates of LGBT identification among non-Hispanic Black (4.6%), Hispanic (5.4%), non-Hispanic Asian (4.9%), and non-Hispanic individuals of other races (6.3%), than among non-Hispanic whites (3.6%).17
Analyses of the 2014 BRFSS data suggest that transgender adults in the United States are more likely to be nonwhite than the general population: 55 percent of transgender adults identified as white, compared with 66 percent in the general adult population. On a more detailed level, 16 percent of transgender adults identified as African American or Black, 21 percent as Hispanic or Latino, and 8 percent as another race or ethnicity. In the general population, the corresponding numbers are 12 percent, 15 percent, and 8 percent, respectively (Flores, Brown, and Herman, 2016).
CHILD REARING
Based on analyses of 2014–2018 GSS data, an estimated 37 percent of lesbian, gay, and bisexual individuals report having ever had a child. By comparison, 74 percent of heterosexual adults in those data report the same, making heterosexuals twice as likely to report having a child (Gates, 2018).18 This dynamic is discussed further in Chapter 8.
Estimates from 2017 Gallup data suggest that 29 percent of LGBT adults aged 25 and older are currently living with a child under age 18 (Williams Institute, 2019). Among same-sex couples, 2010 Census Bureau data suggest that 19 percent are raising a child under age 18 (Gates, 2013). The comparable figure for different-sex couples was 41 percent.19 LGBT-identified women and women in same-sex couples in Gallup and U.S. Census Bureau data, respectively, are much more likely than their male counterparts to be raising children (Gates, 2013). A review of 51 studies focused on transgender parenting suggests that between a quarter and a half of transgender individuals report parenthood. This compares with 65 percent of adult males and 74 percent of adult females in the U.S. general
___________________
16 See https://www.census.gov/quickfacts/fact/table/US/PST045219.
17 See https://news.gallup.com/poll/201731/lgbt-identification-rises.aspx.
18 Information retrieved from data analyses of the General Social Survey by Gary Gates in 2018, using the Survey Documentation and Analysis online tool maintained by the Institute for Scientific Analysis, San Francisco, CA, under a licensing agreement with the University of California. Tool is available at https://sda.berkeley.edu/sdaweb/analysis/?dataset=gss18.
19 See https://www2.census.gov/programs-surveys/demo/tables/same-sex/time-series/sschouse-characteristics/ssex-tables-2011.xls.
population (Stotzer, Herman, and Hasenbush, 2014). There are no statistics available on parenting among the intersex population.
SUMMARY AND CONCLUSIONS
The available data on sexual and gender diverse populations show a picture of dynamic and rapidly evolving populations. SGD populations are becoming younger, more female, and more racially and ethnically diverse, and they include an increasing proportion of bisexual individuals. Many lesbian, gay, and bisexual people also have children. It seems possible that similar trends are occurring among transgender and other gender diverse populations, though data to track population-wide trends among these groups are not yet available. Population-based data on intersex populations are generally not available at all.
One challenge in assessing SGD population demographics is that many currently used demographic data collection instruments do not measure sexual orientation, gender identity, or intersex status at all. Instruments that do measure sexual orientation tend to assess only sexual orientation identity; they do not cover other important aspects of sexual diversity, most notably sexual attraction and sexual behavior. Moreover, instruments that measure gender identity tend to use a single-item approach that may result in undercounts of transgender respondents.
Social acceptance of sexual and gender diversity has been increasing. A majority of Americans approve of same-sex relationships and support federal discrimination protections for LGBT people. Taken together, the available evidence suggests that changes in LGBT populations may be a product of factors that include growing societal awareness and acceptance of diverse sexual and gender identities; expansion of laws, policies, and practices that protect and support communities and individuals regardless of sexual orientation or gender identity; and an increasing willingness and ability among LGBT and other SGD populations to self-identify or disclose their transgender identity or same-sex attraction, behavior, identity, or relationship.
Although the possibility that the underlying distribution of SGD people has changed or is changing cannot be ruled out, it is clear that the evolving societal and political context has created new possibilities for diverse sexual and gender identities to be understood and claimed by growing
numbers of people. The demographic shifts observed in SGD populations challenge researchers and policy makers to collect more and better data and to consider the degree to which research questions, media discussions, and policy proposals reflect the most pressing needs of these populations and the contemporary challenges they face.
REFERENCES
Abrajano, M. (2010). Are Blacks and Latinos responsible for the passage of Proposition 8? Analyzing voter attitudes on California’s proposal to ban same-sex marriage in 2008. Political Research Quarterly, 63(4), 922–932. doi: 10.1177/2F1065912910373555.
Baunach, D.M. (2011). Decomposing trends in attitudes toward gay marriage, 1988-2006. Social Science Quarterly, 92(2), 346–363. doi: 10.1111/j.1540-6237.2011.00772.x.
Baunach, D.M. (2012). Changing same-sex marriage attitudes in American from 1988 through 2010. Public Opinion Quarterly, 76(2), 364–378. doi: 10.1093/poq/nfs022.
Becker, A.B. (2012). What’s marriage (and family) got to do with it? Support for same-sex marriage, legal unions, and gay and lesbian couples raising children. Social Science Quarterly, 93(4), 1007–1029. doi: 10.1111/j.1540-6237.2012.00844.x.
Becker, A.B., and Scheufele, D.A. (2011). New voter, new outlook? Predispositions, social networks, and the changing politics of gay civil rights. Social Science Quarterly, 92(2), 324–345. doi: 10.1111/j.1540-6237.2011.00771.x.
Brewer, P.R. (2003a). The shifting foundations of public opinion about gay rights. Journal of Politics, 65(4), 1208–1220. doi: 10.1111/1468-2508.t01-1-00133.
Brewer, P.R. (2003b). Values, political knowledge, and public opinion about gay rights: A framing-based account. Public Opinion Quarterly, 67(2), 173–201. doi: 10.1086/374397.
Brewer, P.R. (2007). Value War: Public Opinion and the Politics of Gay Rights. Lanham, MD: Rowman & Littlefield Publishers, Inc.
Downing, J.M., and Przedworski, J.M. (2018). Health of transgender adults in the U.S., 2014–2016. American Journal of Preventive Medicine, 55(3), 336–344. doi: 10.1016/j. amepre.2018.04.045.
Dunlap, S.L., Holloway, I.W., Pickering, C.E., Tzen, M., Goldbach, J.T., and Castro, C.A. (2020). Support for transgender military service from active duty United States military personnel. Sexuality Research and Social Policy. doi: 10.1007/s13178-020-00437-x.
Eldridge, V.L., Mack, L., and Swank, E. (2006). Explaining comfort with homosexuality in rural America. Journal of Homosexuality, 51(2), 39–56.
Flores, A.R. (2014). Reexamining context and same-sex marriage: The effect of demography on public support for same-sex relationship recognition. International Journal of Public Opinion Research, 26(3), 283–300.
Flores, A.R. (2015). Attitudes toward transgender rights: Perceived knowledge and secondary interpersonal contact. Politics, Groups, and Identities, 3(3), 398–416. doi: 10.1080/21565503.2015.1050414.
Flores, A.R., and Barclay, S. (2015). Trends in Public Support for Marriage for Same-Sex Couples by State. Williams Institute, UCLA School of Law. Available: https://escholarship.org/content/qt7d66v2mt/qt7d66v2mt.pdf.
Flores, A.R., Brown, T.N.T., and Herman, J.L. (2016). Race and ethnicity of adults who identify as transgender in the United States. Williams Institute, UCLA School of Law. Available: https://williamsinstitute.law.ucla.edu/wp-content/uploads/Race-and-Ethnicityof-Transgender-Identified-Adults-in-the-US.pdf.
Flores, A.R., Herman, J.L., Brown, T.N.T., Wilson, B.D.M., and Conron, K.J. (2017). Age of Individuals Who Identify as Transgender in the United States. Williams Institute, UCLA School of Law. Available: https://williamsinstitute.law.ucla.edu/wp-content/uploads/TransAgeReport.pdf.
Flores, A.R., Herman, J.L., Gates, G.J., and Brown, T.N.T. (2016). How many adults identify as transgender in the United States? Williams Institute, UCLA School of Law. Available: https://williamsinstitute.law.ucla.edu/wp-content/uploads/How-Many-Adults-Identify-asTransgender-in-the-United-States.pdf.
Flores, A.R., Haider-Markel, D.P., Lewis, D.C., Miller, P.R., Tadlock, B.L., and Taylor, J.T. (2020). Public attitudes about transgender participation in sports: The roles of gender, gender identity conformity, and sports fandom. Sex Roles, 83, 382–398. doi: 10.1007/s11199-019-01114-z.
Gadarian, S.K., and van der Vort, E. (2018). The gag reflex: Disgust rhetoric and gay rights in American politics. Political Behavior, 40(2), 521–543. doi: 10.1007/s11109-017-9412-x.
Gaines, N.S., and Garand, J.C. (2010). Morality, equality, or locality: Analyzing the determinants of support for same-sex marriage. Political Research Quarterly, 63(3), 553–567. doi: 10.1177%2F1065912909333132.
Gallup. (2019). Gay and Lesbian Rights. Available: https://news.gallup.com/poll/1651/gaylesbian-rights.aspx.
Garretson, J.J. (2015). Exposure to the lives of lesbians and gays and the origin of young people’s greater support for gay rights. International Journal of Public Opinion Research, 27(2), 277–288. doi: 10.1093/ijpor/edu026.
Gates, G.J. (2013). LGBT Parenting in the United States. Williams Institute, UCLA School of Law. Available: https://williamsinstitute.law.ucla.edu/wp-content/uploads/LGBTParenting-US-Feb-2013.pdf.
Gates, G.J. (2017). In U.S., More Adults Identifying as LGBT. Gallup. Available: https://news.gallup.com/poll/201731/lgbt-identification-rises.aspx.
Goodman, M., Adams, N., Corneil, T., Kreukels, B., Motmans, J., and Coleman, E. (2019). Size and distribution of transgender and gender nonconforming populations. Endocrinology and Metabolism Clinics of North America, 48, 303–321.
Haider-Markel, D.P., and Miller, P.R. (2017). Equality of transformation? LGBT political attitudes and priorities and the implications for the movement. In M. Brettschneider, S. Burgess, and C. Keating (Eds.), LGBTQ Politics: A Critical Reader (pp. 270–294). New York: NYU Press.
Harrison, B.F., and Michelson, M.R. (2017). What’s love got to do with it?: Emotion, rationality, and framing LGBT rights. New Political Science, 39(2), 177–197. doi: 10.1080/07393148.2017.1301311.
Herek, G.M. (2002). Gender gaps in public opinion about lesbians and gay men. Public Opinion Quarterly, 66(1), 40–66. doi: 10.1086/338409.
Herek, G.M., and Capitanio, J.P. (1996). “Some of my best friends”: Intergroup contact, concealable stigma, and heterosexuals’ attitudes toward gay men and lesbians. Personality and Social Psychology Bulletin, 22(4), 412–424. doi: 10.1177/0146167296224007.
Herman, J.L., Wilson, B.D.M., and Becker, T. (2017). Demographic and health characteristics of transgender adults in California: Findings from the 2015–2016 California health interview survey. Williams Institute, UCLA School of Law. Available: https://williamsinstitute.law.ucla.edu/wp-content/uploads/CHIS-Transgender-Adults-Oct-2017.pdf.
Horowitz, J.M., Parker, K., and Stepler, R., 2017. Wide Partisan Gaps in U.S. Over How Far the Country Has Come on Gender Equality. Available: https://www.pewsocialtrends.org/2017/10/18/wide-partisan-gaps-in-u-s-over-how-far-the-country-has-come-on-gender-equality/
Humes, K.R., Jones, N.A., and Ramirez, R.R. (2011). Overview of race and Hispanic origin: 2010. 2010 Census Briefs. U.S. Census Bureau, U.S. Department of Commerce, Economics and Statistics Administration. Available: https://www.census.gov/prod/cen2010/briefs/c2010br-02.pdf.
James, S.E., Herman, J.L., Rankin, S., Keisling, M., Mottet, L., and Anafi, M. (2016). The Report of the 2015 U.S. Transgender Survey. National Center for Transgender Equality. Available: https://transequality.org/sites/default/files/docs/usts/USTS-Full-Report-Dec17.pdf.
Jones, J.M. (2017). In U.S., 10.2% of LGBT Adults Now Married to Same-Sex Spouse. Gallup. Available: https://news.gallup.com/poll/212702/lgbt-adults-married-sex-spouse.aspx.
Jones, P.E., Brewer, P.R., Young, D.G., Lambe, J.L., and Hoffman, L.H. (2018). Explaining public opinion toward transgender people, rights, and candidates. Public Opinion Quarterly, 82(2), 252–278. doi: 10.1093/poq/nfy009.
Jones, R.P., Najle, M., Bola, O., and Greenberg, D. (2019a). After Stonewall, Widespread Support for LGBT Issues: Findings from the 2018 American Values Atlas. Washington, DC: Public Religion Research Institute. Available: https://www.prri.org/wp-content/uploads/2019/03/PRRI-Mar-2019-American-Values-Atlas.pdf.
Jones, R.P., Jackson, N., Najle, M., Bola, O., and Greenberg, D. (2019b). America’s Growing Support for Transgender Rights. Public Religion Research Institute. Available: https://www.prri.org/research/americas-growing-support-for-transgender-rights.
Kirzinger, A., Kates, J., Dawson, L., Muñana, C., and Brodie, M. (2020). Majorities Support Policies Banning Discrimination Against LGBTQ Individuals’ Health Care Access. Kaiser Family Foundation. Available: https://www.kff.org/other/poll-finding/majoritiessupport-policies-banning-discrimination-against-lgbtq-individuals-health-care-access.
Lewis, D.C., Flores, A.R., Haider-Markel, D.P., Miller, P.R., Tadlock, B.L., and Taylor, J.K. (2017). Degrees of acceptance: Variation in public attitudes toward segments of the LGBT community. Political Research Quarterly, 70(4), 861–875.
Lewis, G.B. (2011). The friends and family plan: Contact with gays and support for gay rights. Policy Studies Journal, 39(2), 217–238. doi: 10.1111/j.1541-0072.2011.00405.x.
Lewis, G.B., and Galope, R.V. (2014). Support for lesbian and gay rights: How and why the South differs from the rest of the country. American Review of Politics, 34, 271–297. doi: 10.15763/issn.2374-779X.2014.34.0.271-297.
Meerwijk, E.L., and Sevelius, J.M. (2017). Transgender population size in the United States: A meta-regression of population-based probability samples. American Journal of Public Health, 107(2), e1–e8. Available: https://www.ncbi.nlm.nih.gov/pmc/articles/PMC5227946.
Michelson, M.R., and Harrison, B.F. (2020). Transforming Prejudice: Identity, Fear, and Transgender Rights. New York: Oxford University Press.
Miller, P.R., Flores, A.R., Haider-Markel, D.P., Lewis, D.C., Tadlock, B.L., and Taylor, J.K. (2017). Transgender politics as body politics: Effects of disgust sensitivity and authoritarianism on transgender rights attitudes. Politics, Groups, and Identities, 5(1), 4–24. doi: 10.1080/21565503.2016.1260482.
Mishel, E., England, P., Ford, J., and Caudillo, M.L. (2020). Cohort increases in sex with same-sex partners: Do trends vary by gender, race, and class? Gender and Society, 34(2), 178–209. doi: 10.1177/0891243219897062.
Mosher, W., Chandra, A., and Jones, J. (2005). Sexual behavior and selected health measures: Men and women 15–44 years of age, United States, 2002. Advance Data from Health and Vital Statistics, No. 362. U.S. Department of Health and Human Services, Centers for Disease Control and Prevention, National Center for Health Statistics. Available: https://www.cdc.gov/nchs/data/ad/ad362.pdf.
MTV. (2017). MTV Poll: July 2017 (Version 2) [Dataset]. Ithaca, NY: Cornell University, Roper Center for Public Opinion Research.
Newport, F. (2018). In U.S., Estimate of LGBT Population Rises to 4.5%. Gallup. Available: https://news.gallup.com/poll/234863/estimate-lgbt-population-rises.aspx.
Norton, A.T., and Herek, G.M. (2013). Heterosexuals’ attitudes toward transgender people: Findings form a national probability sample of U.S. adults. Sex Roles, 68(11–12), 738–753. doi: 10.1007/s11199-011-0110-6.
O’Connell, M., and Feliz, S. (2011). Same Sex Couple Household Statistics from the 2010 Census. Working Paper Number 2011-26. Social, Economic and Housing Statistics Division, U.S. Bureau of the Census. Available: https://www.census.gov/library/workingpapers/2011/demo/SEHSD-WP2011-26.html.
Olson, L.R., Cadge, W., and Harrison, J.T. (2006). Religion and public opinion about same-sex marriage. Social Science Quarterly, 87(2), 340–360. doi: 10.1111/j.1540-6237.2006.00384.x.
Perez-Brumer, A., Day, J.K., Russell, S.T., and Hatzenbuehler, M.L. (2017). Prevalence and correlates of suicidal ideation among transgender youth in California: Findings from a representative, population-based sample of high school students. Journal of the American Academy of Child and Adolescent Psychiatry, 56(9), 739–746.
Raifman, J., Charlton, B.M., Arrington-Sanders, R., Chan, P.A., Rusley, J., Mayer, K.H., Stein, M.D., Austin, S.B., and McConnell, M. (2020). Sexual orientation and suicide attempt disparities among U.S. adolescents: 2009–2017. Pediatrics 145(3), e20191658. doi: 10.1542/peds.2019-1658.
Snively, C.A., Kreuger, L., Stretch, J.J., Watt, J.W., and Chadha, J. (2004). Understanding homophobia: Preparing for practice realities in urban and rural settings. Journal of Gay and Lesbian Social Services, 17(1), 59–81.
Stotzer, R.L., Herman, J.L., and Hasenbush, A. (2014). Transgender Parenting: A Review of Existing Research. Williams Institute, UCLA School of Law. Available: https://williamsinstitute.law.ucla.edu/wp-content/uploads/transgender-parenting-oct-2014.pdf.
Tadlock, B.L., Flores, A.R., Haider-Markel, D.P., Lewis, D.C., Miller, P.R., and Taylor, J.K. (2017). Testing contact theory and attitudes on transgender rights. Public Opinion Quarterly, 81(4), 956–972. doi: 10.1093/poq/nfx021.
Tate, C.C., Ledbetter, J.N., and Youssef, C.P. (2013). A two-question method for assessing gender categories in the social and medical sciences. Journal of Sex Research, 50(8), 767–776. doi: 10.1080/00224499.2012.690110.
Taylor, J.K., Lewis, D.C., and Haider-Markel, D.P. (2018). The Remarkable Rise of Transgender Rights. Ann Arbor: University of Michigan Press.
Taylor, J.K., Lewis, D.C., Haider-Markel, D.P., Flores, A.R., Miller, P.R., and Tadlock, B.L. (2018). The factors underlying public opinion of transgender rights. In J.K. Taylor, D.C. Lewis, and D.P. Haider-Markel (Eds.), The Remarkable Rise of Transgender Rights (pp. 61–86). Ann Arbor: University of Michigan Press.
Tordoff, D.M., Morgan, J., Dombrowski, J.C., Golden, M.R., and Barbee, L.A. (2019). Increased ascertainment of transgender and non-binary patients using a 2-step versus 1-step gender identity intake question in an STD clinic setting. Sexually Transmitted Diseases, 46(4), 254–259. doi: 10.1097/OLQ.0000000000000952.
U.S. Census Bureau. (2018). Quick Facts, United States. U.S. Census Bureau, U.S. Department of Commerce. Available: https://www.census.gov/quickfacts/fact/table/US/IPE120218.
U.S. Census Bureau. (2019). U.S. Census Bureau releases CPS estimates of same-sex households. Release Number CB19-TPS.51. U.S. Census Bureau, Department of Commerce. Available: https://www.census.gov/newsroom/press-releases/2019/same-sex-households.html.
Williams Institute. (2019). LGBT Demographic Data Interactive. UCLA School of Law. Available: https://williamsinstitute.law.ucla.edu/visualization/lgbt-stats/?topic=LGBT#density.


