
C
Measuring the Impact of Worrying About STIs on Quality of Life
Authored by: Zachary Wagner1 and Matthew Crane,2 October 2020
INTRODUCTION AND BACKGROUND
Sexually transmitted infections (STIs) have a heavy burden on those who are infected. The reductions in quality of life (QoL) for many different STIs are well documented (Chesson et al., 2017). These estimates are based on the fact that people infected with these illnesses live fewer quality-adjusted life-years (QALYs). However, the burden from STIs is underestimated if people who are not currently infected experience QoL reductions simply because they are at risk of acquiring STIs. For example, people might worry about getting an STI in the future or about past exposure, which could reduce their well-being in the present. Concerns about STI risk could also lead people to have fewer sexual partners than they would otherwise prefer or to have less enjoyable sexual experiences. Research has not addressed the impacts of worrying about STI risk on well-being. The goals of this paper are to (1) explore the usefulness of a research agenda aimed at identifying the effects of STI risk on QoL for those at risk and (2) introduce a methodology for estimating the burden of STI risk.
The application of QoL measures outside of direct health impacts has been limited in the literature. One tool is the Adult Social Care Outcomes Toolkit, which examines utility weights across varied domains of social care–related QoL and has been extended for use in carers (Malley et al., 2012; Rand et al., 2015; Towers et al., 2016). The ICEpop CAPability
___________________
1 RAND Corporation.
2 Johns Hopkins University School of Medicine.
measure for older people is comparable in some settings to that toolkit, measuring both QoL and capability through attributes of attachment, security, role, enjoyment, and control (Flynn et al., 2011; van Leeuwen et al., 2015). The Lupus Patient-Reported Outcome tool employs a similar concept; it identifies health-related QoL (HRQL) and also explicitly investigates non-health-related QoL through the domains of desires and goals, social support, coping, and satisfaction with treatment (Jolly et al., 2012, 2019). Despite exploring topics beyond direct health impact, these tools remain constrained to specific settings and measurement outcomes. Some STI research has discussed the negative impact on QoL that may arise due to mental stress or other life effects associated with STI screening or positive STI tests (Cvejic et al., 2020; Jackson and Roberts, 2016; Qi et al., 2014). However, these results have not been translated beyond tools that concentrate on health domains of QoL and may fail to capture broader considerations of well-being.
This pilot study examines the impact of STIs on QoL for those who are at risk of contracting an STI. In Phase 1, the share of the population that worries about STIs was estimated. This quantifies the population whose well-being is likely to be impacted by STI risk. In Phase 2, a survey was piloted with 1,732 participants to examine the impact of STI risk on wellbeing using the time trade-off (TTO) method, a standard technique for measuring HRQL (Muennig and Bounthavong, 2016; Torrance and Feeny, 1989) that allows us to create utility weights for a state in which people have current levels of STI risk compared to a state with no STI risk. These utility weights are comparable to HRQL scores and thus can be used to estimate the impact of STI risk on QALYs. In Phase 3, we combined estimates from Phases 1 and 2 to estimate the impact of STI risk on QALYs in the United States.
Phase 1: Estimating the Share of the U.S. Population That Is Worried About Contracting an STI
Data from a nationally representative Kaiser Family Foundation (KFF) survey that asked respondents “how worried are you about contracting an STI in the next year?” were used. Table C-1 presents the results: 8 percent of the public is very or somewhat worried. These are the people whose well-being is likely to be most affected by STI risk. This percentage is larger for younger people; 20 percent of people aged 18–29 express concern. While this is a useful way of assessing the extent to which population well-being is affected by STI risk, people who are “not very worried” might also experience an improvement in well-being if there were not STI risk (e.g., if they would have more partners or better sex without that risk).
TABLE C-1 How Worried Are You That You May Contract a Sexually Transmitted Infection in the Next Year?
| Full Sample | |
|---|---|
| Very worried | 3% |
| Somewhat worried | 5% |
| Not very worried | 15% |
| Not at all worried | 77% |
NOTE: Data available by request via the project Public Access File via email at publicac@ nas.edu.
SOURCE: Kaiser Family Foundation.
Phase 2: Pilot Survey and TTO Method
In Phase 2, an online pilot survey with two main objectives was implemented:3
- Collect information on respondents, such as demographics, sexual history, and level of worry about getting an STI.
- Assess how many years of life respondents would be willing to sacrifice to live in a world with no STI risk.
Pilot Survey Platform and Quality Control
The pilot survey was performed on Mechanical Turk (M-Turk), an online platform where workers complete surveys in exchange for a small fee. Workers were paid $1.00–$1.50 for completing the survey, which took 7–12 minutes. Most workers take many surveys in one sitting and use this site as a source of income. The payment was consistent with an hourly wage of about $8. While clearly not representative, the pool of workers includes people from a wide range of ages, demographic backgrounds, and geographies. Respondents have a strong incentive to complete surveys quickly, which can diminish data quality. Several quality control measures were applied, including restrictions on who could complete the survey and which surveys were included in the analysis. Only workers with 98 percent quality ratings and who had successfully
___________________
3 The pilot survey questions are available by request via the project Public Access File online at https://www8.nationalacademies.org/pa/managerequest.aspx?key=HMD-BPH-18-11 (accessed November 16, 2020) or via email at publicac@nas.edu.
completed more than 1,000 other surveys were allowed to participate. An “attention check” question was presented in the beginning and locked out the 7 percent of respondents who failed. This helps ensure that the sample includes people who intend to provide deliberate and thoughtful responses. In addition, surveys that exhibited patterns consistent with “clicking through” were dropped—some people always clicked the same response in the TTO exercise, some reported a number of partners that was illogical, and some reported indifference between painful cancer and perfect health. This removed an additional 40 percent of surveys, leaving 944 for analysis.
Description of Sample
Table C-2 presents demographics and STI risk characteristics of the remaining respondents. Data from this study include respondents from 48 states, covering 766 zip codes. The average age was 38, and 58 percent of the sample was male. More than 40 percent of the sample earned less than $50,000 per year, and 18 percent earned more than $100,000. Most of the sample was white (80 percent), but Hispanic, Black, and Asian Americans had substantial representation. Only 38 percent of the sample was married, but an additional 15 percent was living with a partner. We expected that these individuals will be less impacted by STI risk. Only 3 percent of the sample was men who have sex with men, and it had only one transgender woman. These groups are particularly high risk for many STIs; however, the small sample sizes prohibit analyzing them separately. Nearly all (90 percent) of respondents were sexually active in the last 12 months, with an average of 0.28 casual sexual partners in that time. Seventeen percent of the sample was previously diagnosed with an STI.
While most of the sample was not worried about getting an STI (53 percent, see Table C-3), a substantial portion was somewhat or very worried (10.4 percent); we expect that subset’s well-being to be most sensitive to changes in STI risk. Substantial variation was found in the likelihood that a respondent would have more sexual partners (26 percent said it was likely or very likely) and better sexual experiences (49 percent said likely or very likely) without STI risk.
TTO Exercise
The TTO exercises asked respondents to compare two scenarios, one with STI risk at current levels and one with it set to zero (see Figure C-1 for example). They were then asked to compare different durations of life under the two scenarios and choose which they preferred (e.g., 10 years of life with their current STI risk or 7 years of life with no STI risk). Five
TABLE C-2 Sample Summary (n = 944)
| Means/Proportions (standard errors) | |
|---|---|
| Age | 38.1 |
| (0.368) | |
| Male (%) | 58.3 |
| (1.60) | |
| Income | |
| Under $50,000 (%) | 41.9 |
| (1.61) | |
| $50,000–$99,999 (%) | 40.4 |
| (1.60) | |
| More than $100,000 (%) | 17.6 |
| (1.24) | |
| Race/Ethnicity | |
| White only (%) | 79.8 |
| (1.30) | |
| Hispanic (%) | 8.26 |
| (0.896) | |
| Black (%) | 8.47 |
| (0.906) | |
| Asian (%) | 9.11 |
| (0.936) | |
| Relationship Status | |
| In relationship, living with partner (%) | 17.0 |
| (1.22) | |
| In relationship, not living with partner (%) | 14.8 |
| (1.16) | |
| Married (%) | 37.5 |
| (1.58) | |
| Single (%) | 30.5 |
| (1.50) | |
| STI Risk | |
| MSM (%) | 2.75 |
| (0.532) | |
| Sexually active in last year (%) | 90.2 |
| (0.977) | |
| Number of casual partners | 0.277 |
| (0.038) | |
| Ever diagnosed with an STI (%) | 17.7 |
| (1.24) |
TABLE C-3 Worry About STI and Change in Sex Life If No STI
| Proportions | |
|---|---|
| Worried About Getting an STI | |
| Not at all worried | 52.7% |
| Not very worried | 36.7% |
| Somewhat worried | 9.1% |
| Very worried | 1.3% |
| More Partners If No STI Worry | |
| Very unlikely | 41.3% |
| Unlikely | 32.9% |
| Likely | 18.1% |
| Very likely | 7.6% |
| Better Sex If No STI Worry | |
| Very unlikely | 26.8% |
| Unlikely | 24.2% |
| Likely | 31.4% |
| Very likely | 17.4% |
NOTE: All questions refer to the next 12 months.
years was used as the starting point for the first 100 surveys, and then it switched to 7 years. No difference in results was found based on the starting point. After the respondent made a choice, a new comparison of life-years for the same scenarios appeared that narrowed or widened the gap in life-years between the two options depending on the response. This process continued until respondents were indifferent between the two options. The number of years of life with current levels of STI risk at which they are indifferent divided by 10 is their utility weight. For example, if they are indifferent between 10 years of life with current levels of risk and 10 years of life with no risk, then their utility weight is 1, and eliminating STIs will have no effect on QoL. However, if someone is indifferent between 8 years with current STI risk and 10 years with no risk, then their utility weight is 0.8, implying that eliminating STI risk would add 0.2 QALYs each year.
Several TTO tasks for STIs of interests were conducted—all STIs, HIV, human papillomavirus (HPV), and chlamydia/gonorrhea/syphilis (combined)—but also for “painful cancer.” Respondents completed TTO exercises that compared having the illness versus perfect health and their
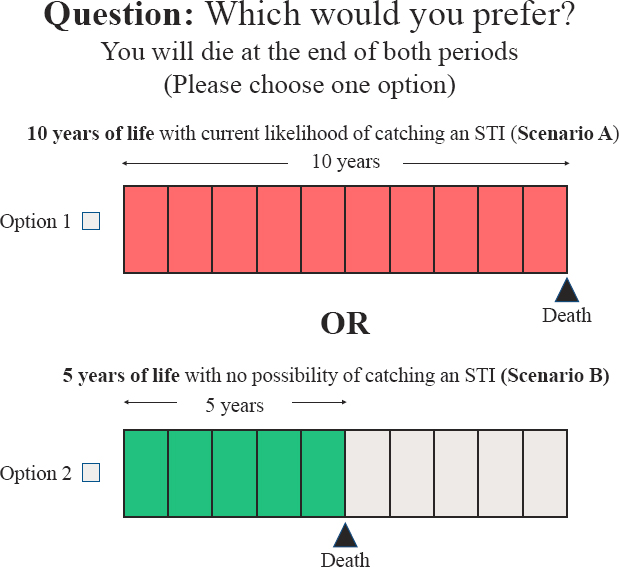
NOTES: The length of time in Option 2 fluctuated based on which response was chosen, and this exercise was repeated until the respondent changed their choice. If they first chose Option 2, the next screen would show Option 2 as having 4 years of life. If they chose Option 1, the next screen would show 6 years of life for Option 2.
current level of risk to no risk. This section began with instructions for how to think about the exercise, followed by a practice with a clearly logical choice (10 years of life with perfect health versus 8 years of life with painful cancer). Respondents had to get the practice correct before proceeding.
Table C-4 shows the average utility weight for each illness category compared to perfect health. Painful cancer, the most severe of the illnesses presented, had the lowest utility weight (0.296), followed by HIV (0.613). The estimated utility rates are in the range of those estimated in the literature. Prior studies document utility weights (or HRQL scores) for HIV of 0.5–0.9 depending on the stage of the illness (Tran et al., 2015); HRQL scores for chlamydia are 0.57–0.9, and scores for HPV are 0.74–0.86 (Jackson et al., 2014; Ong et al., 2019).
TABLE C-4 Utility Weights for Having Illness Versus Perfect Health
| Utility Weight (average) | 95% Confidence Interval | |
|---|---|---|
| Painful cancer | 0.296 | 0.282–0.311 |
| HIV | 0.613 | 0.589–0.637 |
| Chlamydia | 0.729 | 0.706–0.752 |
| HPV | 0.776 | 0.753–0.798 |
As expected, preference weights for risk elimination were closer to 1 (i.e., less pronounced) than those for actually having the illness. Current STI risk produced a utility weight of 0.890 compared to no STI risk. This implies that, on average, people were indifferent between 8.9 years of life with no STI risk and 10 years with their current levels of STI. Figure C-1 shows the distribution of utility weights for STI risk. Utility weights for individual STIs should be higher than for all STIs because “all STIs” encompasses each individual STI. While HPV risk is higher, the utility weights for chlamydia/gonorrhea/syphilis and HIV are lower. This could be because these illnesses are more salient for some people than general STIs.
A final question was included to help validate the STI risk utility weight, asking respondents directly how many years of life they would be willing to give up (assuming they had 20 years left to live) if they had no risk of getting an STI in the remaining years. The number of years that they reported divided by 20 and subtracted from 1 gives an alternative utility weight that can be used to compare against the TTO utility weight. These measures were found to perform very similarly (see Figure C-2, Panel B); the mean of the validation measure was 0.86.
As expected, utility weights for STI risk were highly correlated with the reported level of STI worry. Figure C-3 shows that the utility weight for people who reported “not at all worried” was 0.92 compared to 0.88, 0.78, and 0.61 for people who reported “not very worried,” “somewhat worried,” and “very worried,” respectively.
While the analysis shows the level of STI worry appears to be most predictive of STI risk utility weights, other characteristics were found to be associated with these weights (see Figure C-4); people who had sex without a condom with a casual sex partner in the last year had lower weights than those who did not (0.85 versus 0.90), and men had slightly lower weights than women (0.88 versus 0.91). Age and marital status did not appear to impact utility weights.
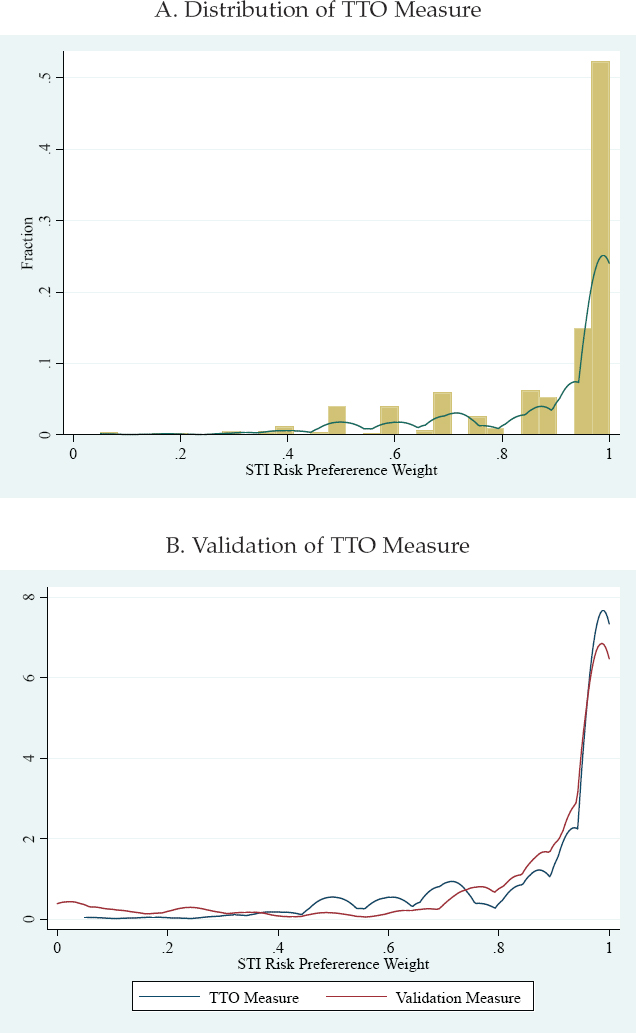
NOTE: The validation measure asks people directly how many years they would be willing to give up if they had no STI risk in their remaining years (assuming they have 20 years remaining).
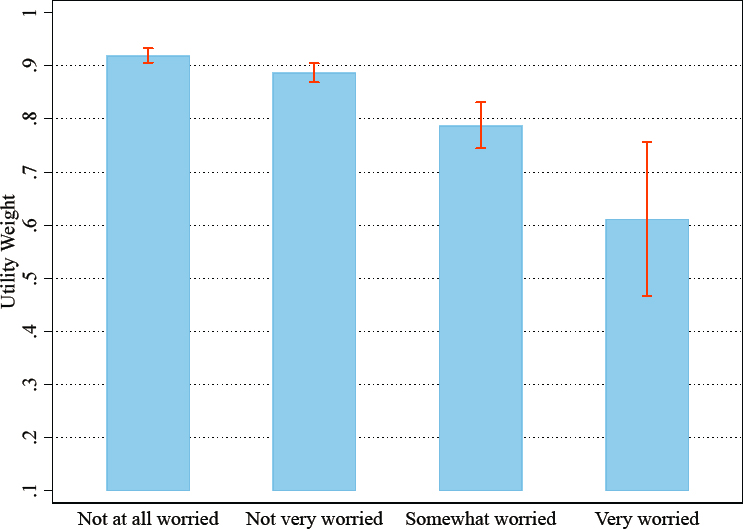
NOTE: Error bars are 95% confidence intervals.
Phase 3: Estimating Impact of STIs on the Well-Being of the Uninfected Population
To assess the impact of STIs on QALYs, the utility weights from Phase 2 were used with the share of the U.S. population with each level of worry from Phase 1. Because the sample is not representative of the U.S. population, we used its applied utility weights that correspond to each level of worry (see Figure C-3) to the real number of people with each level of worry in the United States. The estimated total number of people with each level of worry was based on the total 18 and over population in the country (see Table C-5, column 2), and the share of the population with each level of worry was estimated from the KFF data (see Table C-5, column 1). This gives a “weighted” utility weight that serves as a proxy for the average utility weight in the population (0.899). This can then be used to estimate the number of QALYs lost each year due to STI risk. Table C-6 presents these calculations. With an over-18 population of 268 million and an average utility weight of 0.899, roughly 27 million QALYs are lost each year due to STI risk compared to a world in which there was no STI risk.
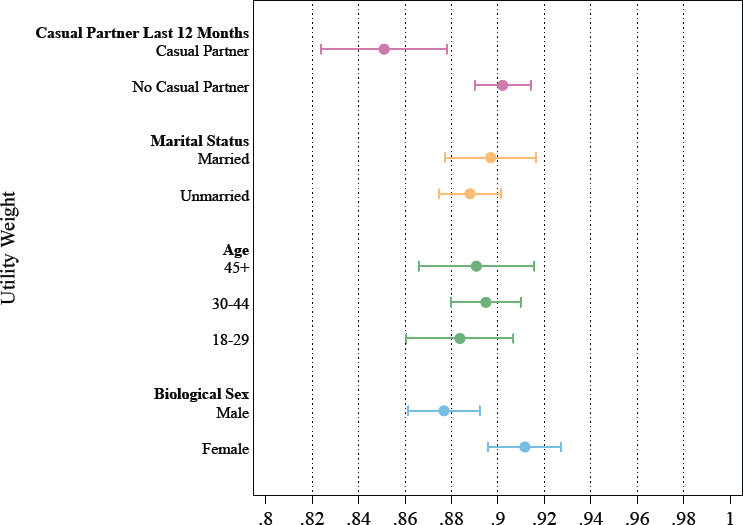
NOTE: Error bars are 95% confidence intervals.
TABLE C-5 Utility Weights for Current Risk of Getting Illness Versus No Risk
| Utility Weight (average) | 95% Confidence Interval | |
|---|---|---|
| Risk of painful cancer | 0.769 | 0.755–0.782 |
| Risk of STI | 0.890 | 0.879–0.901 |
| Risk of HIV | 0.871 | 0.859–0.884 |
| Risk of chlamydia, gonorrhea, and syphilis | 0.888 | 0.877–0.900 |
| Risk of HPV | 0.913 | 0.902–0.923 |
TABLE C-6 Calculation for Annual Number of QALYs Lost as a Result of STI Worry
| (1) | (2) | (3) | (4) | (5) | |
|---|---|---|---|---|---|
| Level of Worry About Getting an STI Next 12 Months | Share (from KFF Survey) | Population (over 18) | Utility Weight for STI Risk | QALYs Under Current Conditions | QALYs Lost Due to STI Concerns |
| Very worried | 3% | 8,040,000 | 0.612 | 4,916,770 | 3,123,230 |
| Somewhat worried | 5% | 13,400,000 | 0.788 | 10,556,395 | 2,843,605 |
| Not very worried | 15% | 40,200,000 | 0.887 | 35,647,089 | 4,552,911 |
| Not at all worried | 77% | 206,360,000 | 0.920 | 189,764,178 | 16,595,822 |
| Total | 100% | 268,000,000 | 0.899* | 240,884,432 | 27,115,568 |
* Weighted average.
Interpretation
While this research is exploratory, it provides a framework for understanding the full impact of STIs on population well-being in the United States. This work suggests that worrying about the risk of STIs has a nontrivial impact on population well-being and leads to millions of QALYs lost each year.
Limitations and Guidance for Future Research
This work was exploratory and intended to provide a proof of concept for measuring the extent to which worrying about illness risks can reduce well-being. A variety of limitations can be improved on in future research. First, the utility weights are smaller than expected across the board. For example, people that were not at all worried about STI risk had a utility weight of 0.92. Although some of them would have better sex or more partners with no STI risk, this still seems rather low. If these are underestimated, this would inflate the estimates of the number of QALYs lost. However, even if the estimates are inflated, it would have to be by orders of magnitude for the impact of worrying about STIs to cease to be meaningful. For example, even if the average utility weight for STI risk was 0.99, this would still result in more than 2 million QALYs lost each year. Future work should validate these measures to get more precise utility weight estimates. Using in-person enumerators and ex-post qualitative interviews could help ensure respondents are understanding and thinking deeply about the exercise. Second, the sample includes a very small number of men who have sex with men and one trans woman, two groups that are highly affected by STIs and could be the most worried about infection. Future work should oversample these and other high-risk groups to better understand how they are affected. Third, M-Turk could produce less accurate results than other survey modalities; its respondents are hurrying to complete as many tasks as possible. The TTO exercises required careful attention, and it is possible that people in a rush did not completely understand the survey.
REFERENCES
Chesson, H. W., P. Mayaud, and S. O. Aral. 2017. Sexually transmitted infections: Impact and cost-effectiveness of prevention. In Major infectious diseases, edited by K. K. Holmes, S. Bertozzi, B. R. Bloom, and P. Jha. Washington, DC: The International Bank for Reconstruction and Development/The World Bank. Pp. 203–232.
Cvejic, E., I. M. Poynten, P. J. Kelly, F. Jin, K. Howard, A. E. Grulich, D. J. Templeton, R. J. Hillman, C. Law, and J. M. Roberts. 2020. Psychological and utility-based quality of life impact of screening test results for anal precancerous lesions in gay and bisexual men: Baseline findings from the Study of the Prevention of Anal Cancer. Sexually Transmitted Infections 96(3):177-183.
Flynn, T. N., P. Chan, J. Coast, and T. J. Peters. 2011. Assessing quality of life among British older people using the ICEPOP capability (ICECAP-O) measure. Applied Health Economics and Health Policy 9(5):317-329.
Jackson, L. J., and T. E. Roberts. 2016. Measuring health and quality of life for women undergoing testing and screening for chlamydia: A systematic review. Sexually Transmitted Diseases 43(3):152-164.
Jackson, L. J., P. Auguste, N. Low, and T. E. Roberts. 2014. Valuing the health states associated with Chlamydia trachomatis infections and their sequelae: A systematic review of economic evaluations and primary studies. Value in Health 17(1):116-130.
Jolly, M., A. S. Pickard, J. A. Block, R. B. Kumar, R. A. Mikolaitis, C. T. Wilke, R. A. Rodby, L. Fogg, W. Sequeira, T. O. Utset, T. F. Cash, I. Moldovan, E. Katsaros, P. Nicassio, M. L. Ishimori, M. Kosinsky, J. T. Merrill, M. H. Weisman, and D. J. Wallace. 2012. Disease-specific patient reported outcome tools for systemic lupus erythematosus. Seminars in Arthritis and Rheumatism 42(1):56-65.
Jolly, M., W. Sequeira, J. A. Block, S. Toloza, A. Bertoli, I. Blazevic, L. M. Vila, I. Moldovan, K. D. Torralba, D. Mazzoni, E. Cicognani, S. Hasni, B. Goker, S. Haznedaroglu, J. Bourre-Tessier, S. V. Navarra, C. C. Mok, M. Weisman, A. E. Clarke, D. Wallace, and G. Alarcón. 2019. Sex differences in quality of life in patients with systemic lupus erythematosus. Arthritis Care & Research 71(12):1647-1652.
Malley, J. N., A.-M. Towers, A. P. Netten, J. E. Brazier, J. E. Forder, and T. Flynn. 2012. An assessment of the construct validity of the ASCOT measure of social care-related quality of life with older people. Health and Quality of Life Outcomes 10(1):21.
Muennig, P., and M. Bounthavong. 2016. Cost-effectiveness analyses in health: A practical approach. 3rd edition. San Francisco, CA: Jossey-Bass.
Ong, K. J., M. Checchi, L. Burns, C. Pavitt, M. J. Postma, and M. Jit. 2019. Systematic review and evidence synthesis of non-cervical human papillomavirus-related disease health system costs and quality of life estimates. Sexually Transmitted Infections 95(1):28-35.
Qi, S.-Z., S.-M. Wang, J.-F. Shi, Q.-Q. Wang, X.-S. Chen, L.-J. Sun, A. Liu, N. Zhang, N. Jiang, and P. Siva. 2014. Human papillomavirus-related psychosocial impact of patients with genital warts in China: A hospital-based cross-sectional study. BMC Public Health 14(1):739.
Rand, S. E., J. N. Malley, A. P. Netten, and J. E. Forder. 2015. Factor structure and construct validity of the Adult Social Care Outcomes Toolkit for carers (ASCOT-carer). Quality of Life Research 24(11):2601-2614.
Torrance, G. W., and D. Feeny. 1989. Utilities and quality-adjusted life years. International Journal of Technology Assessment in Health Care 5(4):559-575.
Towers, A.-M., N. Smith, S. Palmer, E. Welch, and A. Netten. 2016. The acceptability and feasibility of using the Adult Social Care Outcomes Toolkit (ASCOT) to inform practice in care homes. BMC Health Services Research 16(1):523.
Tran, B. X., L. H. Nguyen, A. Ohinmaa, R. M. Maher, V. M. Nong, and C. A. Latkin. 2015. Longitudinal and cross sectional assessments of health utility in adults with HIV/AIDS: A systematic review and meta-analysis. BMC Health Services Research 15(1):7.
van Leeuwen, K. M., J. E. Bosmans, A. P. Jansen, E. O. Hoogendijk, M. W. van Tulder, H. E. van der Horst, and R. W. Ostelo. 2015. Comparing measurement properties of the EQ-5D-3L, ICECAP-O, and ASCOT in frail older adults. Value in Health 18(1):35-43.


