
2
Drivers of Change
INTRODUCTION
While it is difficult to anticipate how they will interact, or predict which ones will predominate, we can readily identify a number of social, technical, and economic forces that hold the potential to bring about change in the U.S. power system.
Beyond the possibilities being created by new technical capabilities (discussed in Chapters 5 and 6), drivers of change in the electricity system include the following:
- Possible large growth in future demand for electricity.
- Efforts to decarbonize the U.S. economy, and eliminate the emission of conventional pollutants, both by transitioning power generation to low- or zero-emission sources and by making much greater use of decarbonized electricity as a substitute for fossil fuels in transportation, buildings, and industry.
- Developments at the edge of the grid such as distributed generation, storage, microgrids, energy-management resources, and energy efficiency measures.
- Grid stability challenges arising as a result of high penetrations of nondispatchable sources of generation such as wind and solar.
- A desire to reduce social inequities.
- Concerns about the impacts of the energy transition on employment.
- A changing international environment including powerful market forces arising from globalization, shifts in the locus of electricity-relevant innovation, and growing concerns about state-sponsored competition and disruption.
In this chapter, each of these drivers is described, and the chapter concludes with a discussion of how they might shape the U.S. (and other) grids in the future.
DRIVER 1: EVOLVING DEMAND FOR ELECTRICITY
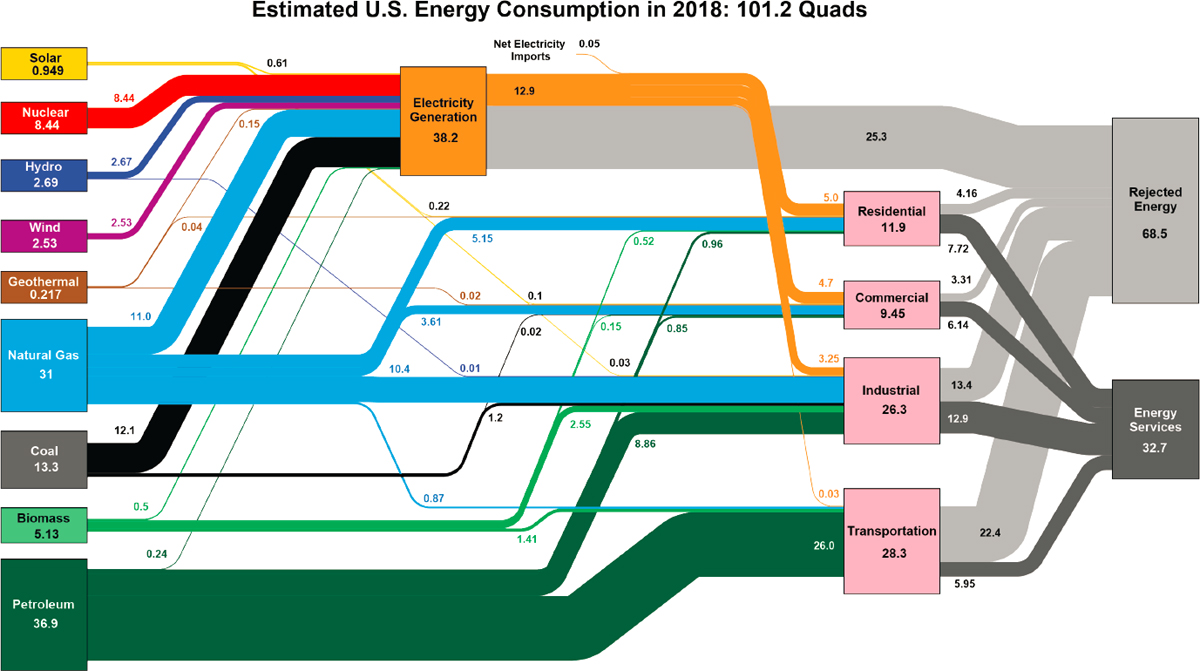
While growth in electricity demand has been flat in recent decades, the future will probably not be like the past. The broadly anticipated push for deeper electrification of energy end-uses in a variety of sectors (e.g., buildings, transportation, and industry) could lead to very different patterns and levels of electricity demand over
the next few decades. Even though only 0.1 percent of current transportation energy use comes from electricity (LLNL, 2018) (Figure 2.1), it is widely thought that growing fractions of transportation will be electrified in order to reduce GHG emissions in the United States. Although only 12 percent of energy used by industry came from electricity in 2019, almost all deep-decarbonization studies suggest that electrification of certain industrial end uses will be important (Lempert et al., 2019; NREL, 2018a; Rissman et al., 2020). These trends toward greater electrification may be offset in part through the introduction of more efficient appliances and building envelopes. Efficiency measures on the supply side will be limited by fundamental thermodynamic constraints, but advances in the performance of heat pumps and combined heat and power platforms could reduce the amount of energy currently being lost to waste heat.
Critical Unknowns About Levels and Locations of Future Demand
Utilities and grid operators have historically had relatively good success in estimating near-term electricity demand from year to year over the totality of their service areas. In the future, however, it may be harder to predict demand as new electricity-demanding and electricity-producing technologies gain widespread acceptance. Furthermore, different groups of electricity consumers have different objectives and expectations from the electricity system, and consumers in different parts of the United States face dramatically different conditions—geographies, resources, risks, demands, and rate structures—that will affect the adoption of new technologies. For more on the diverse interests of electricity consumers, see Annex 2.A.)
Three examples—electric vehicles (EVs), the digital economy, and energy efficiency technologies—illustrate the kinds of changes that could shape future electricity demand.
Electric Vehicles
While the transportation sector currently accounts for a relatively small portion of total U.S. electricity usage, federal and state policies that are aiming increasingly at reducing GHG emissions have supported the introduction of electric light-duty vehicles. If it continues, this policy trend will have large impacts on future electricity demand, along the lines of the impact that the adoption of air conditioning has had on the planning and operation of power systems in the 20th century (IEA, 2018).
The near-term outlook for EV deployment is uncertain, in part as a result of the 2020 pandemic and its impacts on household incomes, coupled with the low price of gasoline (owing, in part, to lower demand) (WTO, 2020). Daniel Yergin (2020) reports that the range of predictions about the penetration of EVs over the next few decades “can be very wide.” A leading investment bank forecasts that electrics could constitute anywhere between 10 and 90 percent of new car sales in 2050, depending on regulations and “technology development.” Widespread adoption of EVs may also depend, in part, on the availability of charging infrastructure across varying geographies and for all socioeconomic groups (AAA, 2020a,b).
A 2019 survey of EV owners found that the cost of EV ownership was only 8 percent higher than a similar ICE vehicle but with lower operating costs (Edmonds, 2019). In the same 2019 survey, 96 percent of respondents said they would purchase or lease an EV again, which is indicative of customer appeal. More than 40 million Americans report interest in owning an EV for their next car, and states like California are leading the way with ambitious policy goals to encourage 100 percent of new car sales to be zero-emission vehicles by 2035 (California EO-N-79-20).
Efforts to electrify medium- and heavy-duty vehicles could present a notable increase in electricity demand for charging, with the amount of capacity additions greatly affected by the timing and location of charging activities. Large-scale adoption of EVs may necessitate the use of Level 2 charging, which would increase loads at the charging point, as well as the system load profile.
From a residential perspective, EV charging could rival the magnitude of electricity load from heating/ventilation/air-conditioning (HVAC) (Figure 2.2). Intelligent coordination of these two loads—HVAC and EV charging—could have a large impact on the amount of electric supply, interconnection, and delivery infrastructure
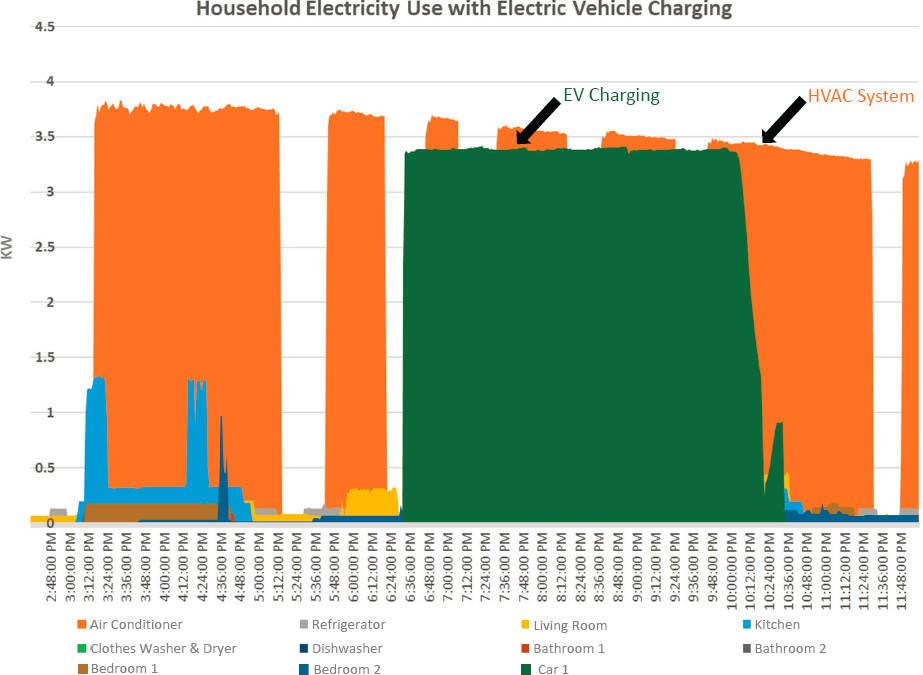
needed at a residence and on the ability of households to shift loads during appropriate times of day in response to economic or technical signals.
Most analyses show that electrical energy usage will not be a limiting constraint for EV adoption, even at high penetration levels, while analysis of strategies for coordinated price-dependent charging suggests that there are no expected resource adequacy issues (Kintner-Meyer, 2019). As the industry moves toward broad adoption of DC fast charging for electric cars, trucks, and semis (see Chapter 5), the peak power needed, as a fraction of maximum system generation capacity, may be challenging to source from the grid unless significant changes are made. Time of charging may therefore prove to be critical in driving capacity additions to serve EV demand.
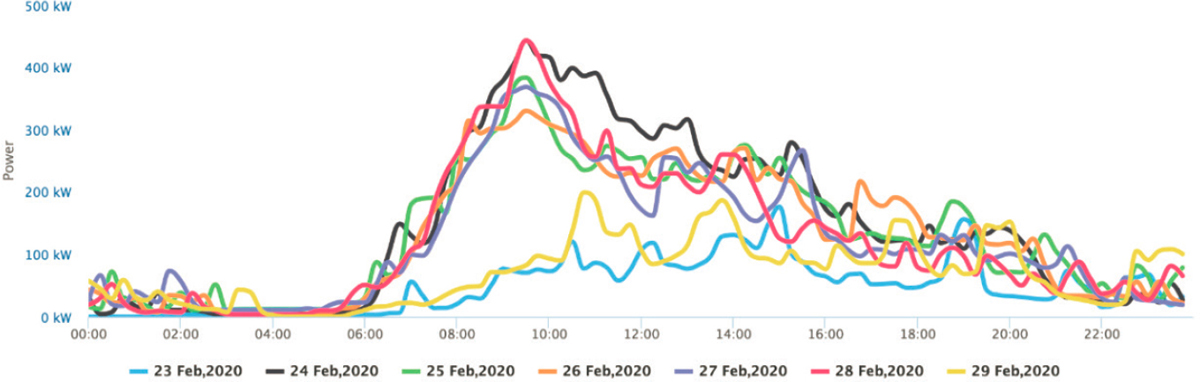
Many states and utilities provide electricity rate offerings and other incentives for homeowners and businesses to install Level 2 chargers and to charge vehicles at specific times of the day. Many institutions are testing incentive mechanisms to shift the timing of EV charging away from peak demand hours. For example, experience at the University of California, San Diego (UCSD), with its large-volume EV charging network (supplied by a private vendor, ChargePoint), reveals highly variable charging patterns during the day and between weekdays and weekends. Data show a strong ramp up in charging at the start of the workday, tapering off during early afternoon (which, ironically, is when solar generation is strongest) (Figure 2.3). Price incentives are one possible mechanism to better align charging with periods of abundant renewable supply (e.g., NREL, 2020).
While today EVs are more common than hydrogen-fueled vehicles, California is moving aggressively to create infrastructure for the latter (CEC, 2020). The relative role that the two alternative technologies will play is unclear (Yergin, 2020). If hydrogen vehicles become widespread, green hydrogen production through electrolysis
of water, either at centralized facilities or distributed at fueling sites, could still have a significant impact on electricity demand.
Growth of Data Centers and the Digital Economy
All the energy used to maintain an increasingly digitally interconnected world is provided as electricity. The rapid increase in digitization has transformed the energy-using behaviors of individuals as well as every organization that connects to the Internet, a fact that has become more evident during the coronavirus pandemic.
A multitude of factors has spurred the digital revolution: declining costs of sensors coupled with increasing ability to store data; rapid progress in advanced analytics; greater connectivity of people and devices through social media and other platforms; and faster and cheaper data transmission (Hodson et al., 2018). The increased use of digital technologies for communication and entertainment, data collection and management (e.g., microprocessors and computers, cloud computing), and general living (e.g., GPS, smart appliances) accounts for an increasing electricity demand for computing and data centers.
Worldwide, data centers and networks consumed around 380 terawatt hours (TWh) of electricity in 2014–2015, about 2 percent of total electricity demand (IEA, 2017). Providing credible estimates of long-term growth in electricity use by digital technologies is difficult, as future outcomes will depend on the tug of war between growth in data demand and continued opportunities and pressures for efficiency improvements (Andrae, 2017; IEA, 2017; Jones, 2018; Masanet et al., 2020). Further, how much of this demand will be met by traditional suppliers, or by dedicated distributed resources, is unclear.
Another source of growing demand has been blockchain technology, which uses digital cryptographic networks to create distributed ledgers of information (World Bank, 2018; Howson, 2019) and requires substantial electricity use to track and authenticate digital transactions. Bitcoin, a digital currency supported by blockchain technology, has been reported to have an annual electricity consumption of up to 45.8 TWh, which is more than all the power used by all consumers in Nevada in 2019 (EIA, 2020b). Estimates indicate that the resulting GHG emissions of such uses exceed those of entire nations (Stoll et al., 2019). Growth in the use of blockchain technology could significantly increase demand for electricity.
Energy Efficiency
Buildings, including the appliances, lighting, and heating/cooling systems in them use around 28 percent of total end-use energy in the United States, not accounting for electrical energy system losses (EIA, 2019a). A critical benefit of energy efficiency is the potential shaving off of peak load demand. In this way, improvements in efficiency can act as a modulator for demand growth, thus reducing difficulties of reliability and resilience presented by growing electricity demand.
Regulatory requirements at both the federal and state level (e.g., CEC, 2016; DOE, 2016), as well as technological developments such as LEDs, efficient heating and cooling, and efficient building envelopes, have the potential to cut U.S. energy-related emissions in half by 2050 (ACEEE, 2020). Recent years have seen great improvements in the efficiency of electricity end-use in appliances, buildings, and industrial processes, and 26 states have set Energy Efficiency Resource Standards (EERS)—long-term energy savings targets for utilities. Several, such as Vermont, have created institutions to support and encourage widespread adoption of more efficient technologies and practices (Efficiency Vermont, 2020). The percentage of electricity sales covered and enforcement details, however, vary notably across states (Berg et al., 2019). Some rural communities make use of federal programs such as the U.S. Department of Agriculture Rural Utility Service Energy Efficiency and Conservation Loan Program (RUS-EECLP) to finance meter-tied efficiency improvements installed by local contractors, recovering the investment via an on-bill tariff to repay the original loan (NASEM, 2016).
Since energy savings for large facilities can be substantial, investing in efficiency can result in long-term financial savings for large energy consumers. Energy savings performance contracts are a mechanism used by the U.S. government, states, counties and municipalities, and other nongovernmental building owners to achieve these types of savings. Building owners sign contracts with third parties (and/or their energy providers), who pay
for efficiency upgrades up front, with energy cost savings providing the basis for paying back the loans over a specified time frame.
Other Developments That Could Increase Demand in the Longer Term
Production of green hydrogen through water electrolysis would create a substantial increase in electricity demand in a scenario where hydrogen is used to replace fossil fuels in industrial processes and where hydrogen fuel cells are used for transportation. Levene et al. (2005) indicate that electricity requirements for hydrogen refueling stations could exceed 20.4 GWh/year. Green hydrogen produced via water electrolysis can also be used as a strategy for long-term energy storage, either as a compressed gas, or in materials (e.g., metal-organic frameworks) or chemicals (e.g., ammonia). Although electrolysis is an energy-intensive process, it could be used to increase demand at times of high supply (e.g., during sunny periods providing significant electricity supply from solar resources) and thus prevent uneconomic curtailments of supply that might otherwise occur. These ideas are discussed in greater depth in Chapter 5.
Direct air capture (DAC) of CO2 could potentially provide meaningful greenhouse gas (GHG) reductions, while also increasing demand for electricity (NASEM, 2019). An estimated 300 to 500 MWh could be required to capture 1 Megaton of CO2 per year using a direct air capture plant (Wilcox, 2019). Extensive deployment of this technology (~1.5 GtCO2/year) by 2100 has been estimated to require electricity on the magnitude of 300 EJ/year (Realmonte et al., 2019). This scenario would require an enormous energy input—more than half of current global electricity demand.
Increases in electricity demand may also occur from growth in indoor agriculture. Concerns over growing conditions and land for agriculture have spurred indoor cultivation using artificial lights and climate control systems. These technologies are quite energy intensive: “vertical farming” requires approximately 3,500 kWh per year for a square meter of lettuce production, compared with 250 kWh per square meter estimated for traditionally heated greenhouse lettuce production in the United Kingdom (Jenkins, 2018). Indoor cannabis growing operations are one of the fastest growing loads in areas where such practices have become legalized, sometimes causing localized power disruptions and blackouts (APPA, 2018).
Where Will People Live in the Future?
Our current grid has evolved over time in response to and in anticipation of where people live. Many economic, social, and other forces have shaped the geography of the grid. For example, the map of the U.S. transmission grid (see Figure 1.3) depicts the reality that electricity system infrastructure patterns greatly reflect population densities in different parts of the country.
In the future, that grid will likely change, not only in ways that connect regions with rich renewable resources (e.g., in the Plains states, where transmission infrastructure and population density is relatively sparse) to where people live, but also with shifts in the location of population by region. At present, a high percentage of the population lives in coastal states, but trends in recent decades (and potentially in the future) indicate that the Southern and Southwest regions of the country have experienced and will continue to realize relatively high population (and load) growth. Additionally, it is unclear whether the effects of the pandemic will create long-lived or permanent shifts in load usage, such as could result from more work occuring in homes rather than in office buildings.
Demographers and economists spend considerable effort forecasting where people will live in the future. A new wildcard has entered the picture in the form of climate change. Rising sea levels along the coasts, flooding along river ways, wildfires, extreme heat, and drought will undoubtedly affect where people live in as-yet unknown ways. A recent analysis by ProPublica and the New York Times Magazine describes profound future disruptions to habitation patterns and likely climate-related migrations (Shaw et al., 2020). Electricity system planners will need to pay attention to how people are responding to these trends in terms of where they live, and then react to such shifts in infrastructure plans.
Finding 2.1: Future electricity demand will be shaped by the widespread adoption of a variety of potential electricity-intensive and/or demand-modulating technologies (e.g., EVs, digital technologies, energy efficiency). The likely extent and timing of adoption of these technologies is uncertain.
DRIVER 2: EFFORTS TO DECARBONIZE THE U.S. ECONOMY AND ELIMINATE CONVENTIONAL POLLUTANTS
Efforts to eliminate the emission of GHGs (“deep decarbonization”) will require two sets of transitions: (1) a dramatic shift away from generating electricity with conventional fossil fuel technologies to zero- or low-carbon technologies; and (2) replacing the use of conventional fossil fuel technology in buildings, transportation, and industry with zero-emission electricity or net-zero fuels. In parallel, many of these same activities will also help to dramatically reduce the many conventional pollutants that are associated with the present energy system (NRC, 2010). Today, the largest immediate externality from electricity generation are the negative health effects from air pollution. Although emissions of air pollutants have been declining, damages from particulate matter exposure (PM 2.5) from the power sector in the United States in 2017 have been estimated to result in about 6,500 premature deaths, which comes to just under $60 billion in 2017 (2014 dollars) (Holland et al., 2018).
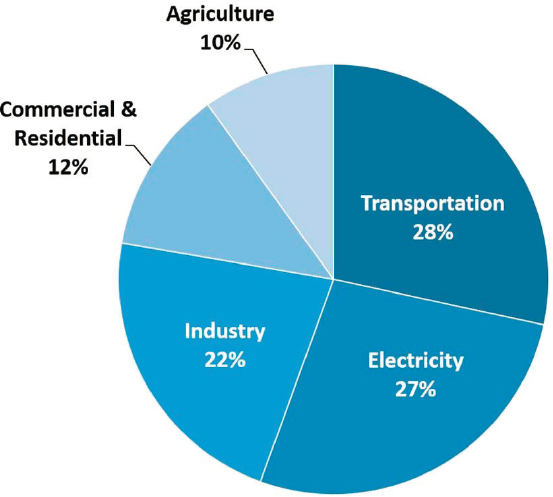
The electric power sector is implicated in the challenge of slowing global warming in two ways:
- Although the transportation sector is now a larger and faster growing source of emissions, the power sector is still a prodigious source of emissions of GHGs, accounting for about one-quarter of the U.S. total (Figure 2.4). Within the sector, most emissions take the form of carbon dioxide, the result of burning coal and natural gas. The sector is also responsible for emissions of methane, from venting associated with production of coal, and from leaks at wellheads and pipeline systems related to the production and delivery of natural gas for ultimate combustion in power plants. Methane is a potent GHG: although its residence time in the atmosphere is shorter than carbon dioxide (a few decades rather than more than a century), methane is more efficient at trapping radiation and is therefore ~30 times as potent as carbon dioxide. The power sector is responsible for emissions of other gases such as SF6 (used in high-voltage switchgear) that, while released only in tiny volumes, has ~24,000 times the potency of carbon dioxide, and has an atmospheric lifetime on the scale of civilizations.
- Essentially every major review of deep decarbonization scenarios, such as in the most recent major global assessment by the Intergovernmental Panel on Climate Change (Clarke et al., 2015) along with recent assessments of U.S. policy strategies (Jereza, 2019; Larson et al., 2020; SDSN, 2020; Wilson, 2019), suggests that least-cost strategies for decarbonization involve massive electrification using low- or zero-emission generation across many (if not most) sectors of the economy. Technologically and economically (and probably also politically), it is easier to electrify as many emitting applications as practical, and then supply them with clean electricity, compared with other approaches. An economy that decarbonizes is an economy that electrifies.
These twin, reinforcing logics for decarbonizing the electric power sector have inspired a large amount of research into technological options for decarbonizing the power sector (IEA, 2020), and numerous studies suggest it should be possible, at reasonable cost, to nearly fully decarbonize the electric power system over the coming two to three decades (Lempert et al., 2019; Steinberg et al., 2017). This logic has also inspired many different political jurisdictions to experiment with various policy instruments. (See Box 2.1.) As of the end of 2020, electric utility companies that provide electricity to more than two-thirds of the nation’s electricity consumers have committed to reducing GHG emissions. Additionally, with pressure from their stakeholders, 37 investor-owned and publicly owned utilities—including many of the nation’s largest electric companies—have committed to reaching net-zero emissions by 2050 (and in some cases, earlier). As of the end of 2020, 62 utilities across the United States have publicly stated carbon or emission reduction goals. Of those, 38 have goals of carbon-free or net-zero emissions by 2050 (Smart Electric Power Alliance, 2020).
Achieving a dramatic reduction in emissions of GHGs from the electricity sector is a key step needed to stabilize climate change and associated global warming. A variety of technologies are available and under development to do this, including generation from wind and solar and other renewable energy sources; employing carbon
capture and sequestration (CCS) to reduce or eliminate emissions from fossil generation; switching to fuels such as hydrogen that can produce low- or net-zero emissions of carbon dioxide; generation using conventional large nuclear reactors; generation using small modular and micro (factory-manufactured) nuclear reactors; and perhaps, in the future, generation using fusion. All of these options are further discussed in Chapter 5.
So far, the United States is making modest progress in decarbonizing its power sector primarily through the replacement of coal with natural gas—sometimes called “shallow decarbonization”—but the path to deep decarbonization is not yet widely agreed upon. A careful study by Shearer et al. (2020) finds that between 2000 and 2018, the carbon intensity of U.S. electricity production (CO2 per unit of electricity generated) has declined by 34 percent. Other research aligns with these findings and points to three major factors explaining decarbonization in electricity: replacement of coal by natural gas, replacement of coal by renewables, and increased energy efficiency (Houser, 2019). The rise of natural gas has been particularly striking. In 2005, only about 1 percent of U.S. gas production came from shale wells that used horizontal drilling and fracturing. Today, that approach dominates the industry. This new supply of shale gas has sent prices down, and inexpensive gas is now much more competitive than coal in much of the country. Inexpensive gas is also making it harder for many nuclear plants to compete in electricity markets—as those units close, the country loses large sources of carbon-free power.
Looking to the future, shallow decarbonization will not be enough. Indeed, the Shearer et al. (2020) study finds that the continued operation of the existing infrastructure in service, unless retired before the expected end of its economic lifetime under current market and policy conditions, will result in emissions that exceed the implied level of emission control effort that the United States might be expected to make under the Paris Agreement. The expected future emissions of this existing infrastructure, and the vexing policy challenges that creates, are just one example of how a business-as-usual policy approach is inadequate for addressing a longer-term problem such as climate change (Morgan, 2016).
Industrial energy uses will be one of the hardest sectors to decarbonize (Cunliff, 2019), but many studies indicate the importance of doing so as part of any deep decarbonization strategy (Abdel-Aziz et al., 2014). In 2018, 22 percent of U.S. GHG emissions occurred in the industrial sector (EPA, 2018). Many technological and cost barriers inhibit using electricity to meet industrial requirements for high-temperature heat (e.g., in iron-ore smelting or chemical manufacture). Research and pilot projects are looking at ways to use electrification to decarbonize industrial processes, and some of these processes involve technologies that are far along in their technology readiness levels, like carbon storage and hydrogen production and use. (See Chapter 5.)
While there are many options for decarbonizing the power sector, renewables have attracted the most attention politically and from investors. This preference reflects, in part, extraordinary technological progress globally with renewable power—progress that has far exceeded what most mainstream projections, even a few years ago, expected was feasible (Evans et al., 2020). It also reflects strong public enthusiasm for renewables. Thanks to the declining cost of wind and solar technologies, many individual consumers, businesses, and communities are beginning to view clean energy as a prudent economic investment, with environmental benefits as a mere bonus (McKinsey, 2019). Favorable market forces as well as favorable public views on environmental protection are now working in unison, especially for renewables (Ansolabehere and Konisky, 2014; McCarthy, 2019).
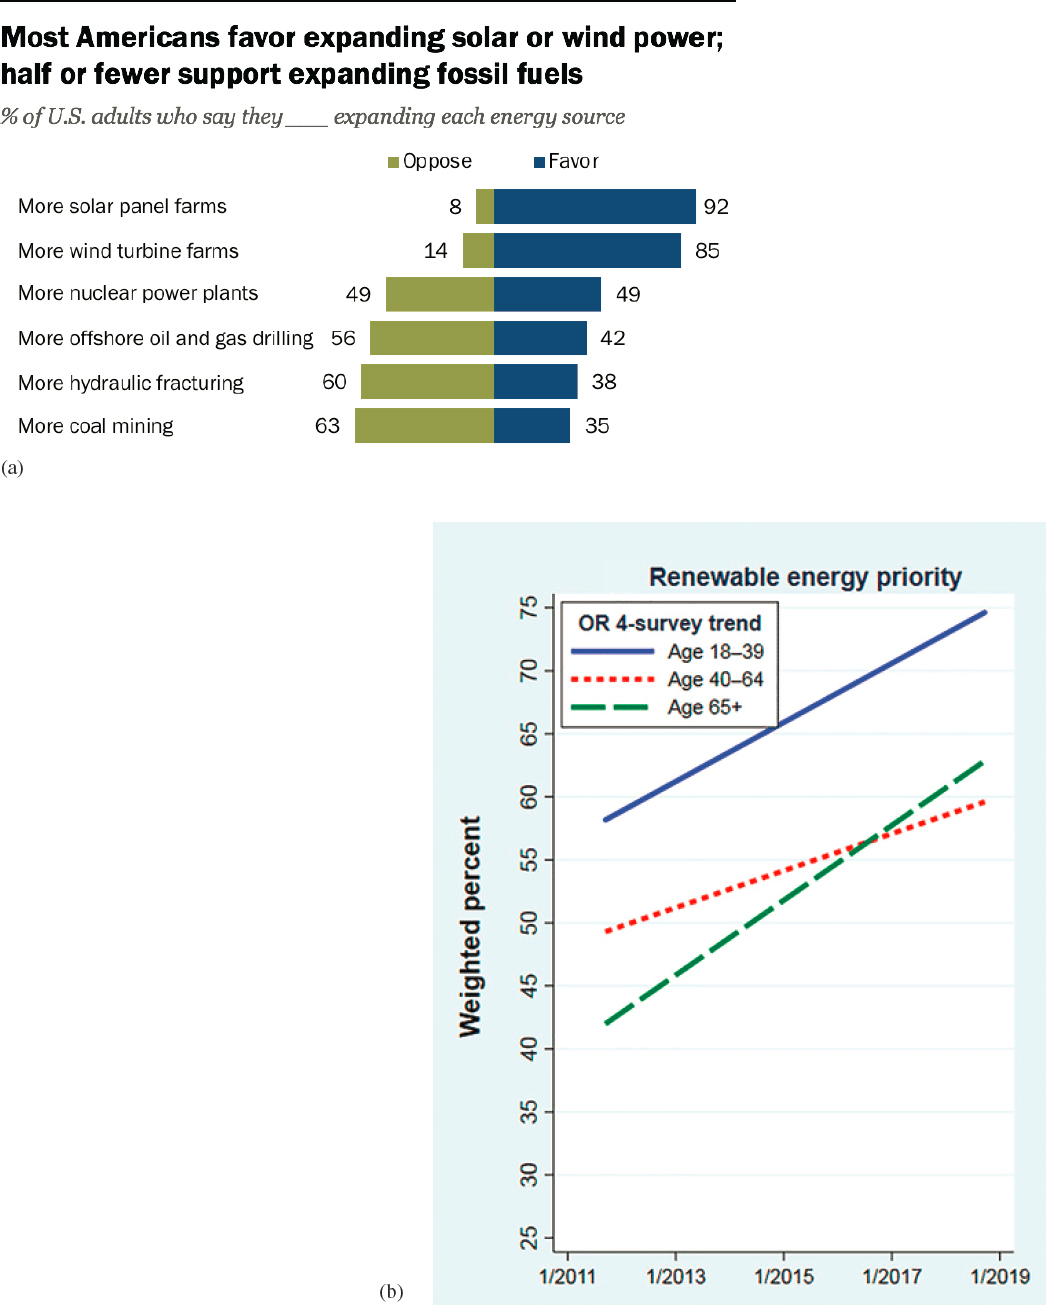
Americans support expanded reliance on renewable energy compared to other energy resources (Pew, 2018) (Figure 2.5a) and such public support has increased across different age groups (Hamilton et al., 2018) (Figure 2.5b). A study on public support of energy policies in the Western United States showed that higher income individuals with higher formal education are more likely to support renewable energy. Furthermore, geopolitical divides between different areas of the country, as well as between rural and urban areas, affect support for renewables (Wolters et al., 2020). High participation in green pricing programs correlates with higher income, homeownership, and home value, but is also indicative of a viable market-based mechanism for consumers to act on their preferences (Knapp et al., 2020).
A political perspective is an important complement to the techno-economic models that are typically used by analysts to identify the socially optimal, least-cost strategies for decarbonization. While techno-economic studies tend to find that “all of the above” approaches to decarbonization are best economically, the politics along with expectations of continued rapid technological advance suggest renewables will play even bigger roles in a decarbonizing future. This emphasis is particularly striking when looking to the hundreds of state, city, and county governments and large and small companies that have made climate commitments and seek to rely on renewable and/or zero-carbon resources for their power supply (Luskin Center for Innovation, 2019). These preferences align with the ubiquity of RPS policies, clean energy standards (CES), and other GHG-reduction policies across the states. RPS policies have spurred as much as half of U.S. renewable energy growth since their inception (Barbose, 2019). Many communities are setting various emissions-reduction targets in the power sector. Chapter 3 provides more background on these changes.
Recognizing the central role of political acceptability and attitudes raises important unknowns. For instance, Dryden et al. (2018) argue that while most Americans now understand that burning fossil fuel releases CO2 to the atmosphere, they do not understand its century-long residence time. While they overestimate the residence time of conventional air pollutants such as sulfur dioxide and the precursors to smog, most believe that the residence time of CO2 is identical to that of conventional air pollutants. They note that this “belief in a short residence time could lead people to the false conclusion that if and when the effects of climate change ever get serious, those effects could be reversed in just a few decades or less by reducing emissions of CO2.” They suggest that “voters and policy makers will be able to make more informed decisions about which policies to support if they understand that successful climate policy will require consistent attention to reducing CO2 emissions over the course of many decades, owing to the long-lived nature of CO2 and its persistent impact on climate” (Dryden et al., 2018).
Other important political uncertainties concern the durability of policy support for renewables when deployed at large scales, especially where it is highly visible and potentially conflicts with other land uses. These land use conflicts between high power density generation and lower density renewables have been the subject of extensive research. For example, replacing the zero-emission electricity generation from a 1,000 MW nuclear plant with wind can require the installation of ~500 to 1,000 new wind turbines, each of which requires a significant amount of land (Ausubel, 2007). This is one reason (in addition to retention of good-paying jobs at nuclear plants) that
several states, including New York and Illinois, have taken steps to find ways to sustain the existing nuclear fleet, which until recently supplied about 20 percent of U.S. generation. The Department of Energy (2008) provides a description of the requirements for replacing 20 percent of U.S. generation with wind power, which includes the construction of more than 100,000 turbines providing 300 GW of generation capacity, for which land use and other environmental impacts could be of issue (NAS-NAE-NRC, 2010). Whether such concerns will dampen public support for renewables has yet to be observed at scale. It has, however, led to growing attention to land use strategies that take into account other important public goals such as conservation (Wu et al., 2019).
With respect to preferences for technologies, there is no need to reiterate the long and very mixed history of public perception on nuclear power (Ford et al., 2017). Such concerns are reflected in Figure 2.5a, for example. CCS is another potentially controversial technology that could be used to reduce emissions from generation based on fossil fuel. Development and application of CCS systems face significant technology, policy, and cost challenges (Morgan and McCoy, 2012; Rubin et al., 2015). Because of those challenges, and because in most of the world there is little or no regulation that places a direct or indirect cost on emitting CO2 to the atmosphere, the global experience with CCS projects on power plants suggests that about 95 percent of the projects that have been envisioned have failed before attracting large-scale investment (Abdulla et al., 2021). In some locations, CCS is also constrained by a lack of suitable storage. While there have been a variety of studies of public perceptions of CCS (Siego et al., 2014), to date, so little CCS has been implemented that it is premature to judge its acceptance if it were to be implemented at scale. The introduction of hydrogen as an alternative fuel is also very new. To date, there has been only limited work on assessing public perceptions (e.g., Ricci et al., 2008), and as with CCS, until hydrogen infrastructure becomes more widespread it is premature to judge its acceptance.
Finding 2.2: The electric power sector is a prodigious source of GHG emissions and conventional pollutants. At the same time, electrification has been identified as critical for many decarbonization scenarios, making emission reduction even more important. Although policy instruments that encourage decarbonization are ubiquitous, existing infrastructure may need to be retired before the end of its economic lifetime to meet emission reduction targets.
DRIVER 3: THE CHANGING GRID EDGE
Recent years have witnessed dramatic changes in distribution systems and on the customer side of the meter in at least some parts of the United States. These changes are being driven by
- Regulatory and ratemaking policies, along with subsidies, that have promoted consumer adoption of such technologies on consumers’ premises;
- Availability of commercially ready technologies, such as roof-top photovoltaics (PVs), battery storage, and highly efficient heat pumps, with equipment sellers offering consumer-friendly services and pricing;
- Innovation among manufacturers and sellers of devices and consumer products that can control the timing and/or magnitude of electricity use by appliances or other equipment in customer buildings;
- Interest among industrial and other large energy users to increase energy efficiency and decrease electricity costs through deployment of combined heat and power (CHP);
- Promising technologies including advanced refrigerants, the use of microwaves to enhance catalysts in chemical production, and various potential developments in other industrial processes using plasma or ultraviolet light;
- A desire to supply local generation to service new high-demand facilities such as data centers and fast charger sites for EVs;
- The adoption of advanced automation by distribution utilities;
- Concerns about climate change and the need to achieve deep decarbonization;
- Customer concerns about supply vulnerability in the face of potential natural and human-induced disruptions; and
- A desire among a few to become completely self-sufficient and disconnected from the grid.
Chapter 3 explains how many of these developments are being encouraged or constrained by state and federal regulations and by direct and indirect subsidies. Key technical capabilities that are making these developments possible are described in Chapter 5.
These drivers do not always push in the same direction. For example, because of intermittent supply of solar PV power and the high cost and limited capacity of storage systems, if can be difficult to operate a freestanding microgrid using just those technologies. But acquiring small-scale generation based on diesel works against the objective of achieving deep decarbonization. Similarly, depending on how rates are designed, grid-edge developments can work against the objective of improved energy equity. When customers with the means to adopt advanced local control, generation, and storage do so, it could mean that lower income customers will be left to cover the cost of supporting the wires.
Behind-the-Meter Technologies (BtM) and Other Distributed Energy Resources (DER)
DER include technologies that are connected to the distribution system, and can be located either BtM on customers’ premises or more directly connected to the local grid. In the latter category are community solar gardens and utility-scale solar projects, whose output is fully injected into the grid.
By contrast, some BtM technologies, such as rooftop solar PV, serve at least part of the energy load of a building, with any surplus supply feeding into the grid (or conversely, with the grid providing electricity when the PV system does not produce enough power to supply the building’s load). BtM resources also include energy storage, as with batteries, and heat in water heaters, emergency generators, and Internet of Things (IoT) technologies that adjust the energy use of devices in buildings in response to set boundaries or signals that lead to flexible demand.
Rapid growth in customer-owned BtM DER is being driven by many factors, including lower costs as well as state regulatory policies such as net metering and time-of-use rates (Hart, 2017; Lawson, 2019; Zinaman et al., 2020). Buildings provide opportunities for flexible consumption through appliance loads, HVAC, and lighting.
BtM storage systems offer the ability for electricity consumers to reduce their peak load by managing storage options and in so doing, take advantage of within-day changes in electricity prices (Fitzgerald et al., 2015; NREL, 2017). Much BtM storage is used by larger commercial and industrial customers who see time-of-use (TOU) electricity rates and arbitrage rate differences by filling BtM storage systems when rates are low and discharging power when rates are high.
With the exception of water heaters that operate during off-peak hours, the economic case for residential BtM storage is not yet compelling for most applications. That said, sales of BtM batteries and small-scale emergency generators spiked in California after the 2019 public safety power shutoffs (Luery, 2019; Sylvia, 2019). Largely motivated by reliability and resilience benefits, as well as the state’s Self-Generation Incentive Program (SGIP), sales of residential BtM batteries are growing in California. Some BtM systems, such as solar PV with small short-duration batteries, are net cost-effective to households that can afford the investment (Neubauer and Simpson, 2015). Although BtM technologies enable value-stacking,1 the technological and regulatory frameworks required to make BtM mutually beneficial to diverse parties remain a challenge.
A small but growing percentage of total retail customers can see and respond to real-time prices and changes in system conditions. Technologies, policies, and economic incentives to enable such demand-response capabilities as well as energy conservation measures are widely available to large commercial and industrial consumers, and to some residential consumers in some states. These technologies can range from automated demand-response systems (Bushby and Holmberg, 2009) and IoT technologies (Shrouf and Miragliotta, 2015) to less-sophisticated energy conservation technologies like motion sensor lights (Yang et al., 2012). In the context of demand-response, the greatest transformational means to reduce energy consumption is through digitalization and communications, which in turn can lead to more efficient energy services and improved integration of renewables. In the larger context of
___________________
1 Value stacking refers to capturing multiple economic benefits simultaneously through some combination of such things as reduction in a consumer’s demand charges, deferral of the utility’s distribution capacity upgrades, and potential revenues from participating in competitive markets for energy, capacity, and ancillary services.
BtM improvements, there are many types of measures—including switching from gas heating systems to electric heat pumps, or installing efficient lighting equipment (as well as non-electric technologies such as insulation or energy efficient windows) that embed efficiency into the equipment used, and therefore reduce energy use without necessarily requiring price-responsive demand.
BtM technologies, however, can also introduce vulnerability for security and privacy. Data collected for communications purposes can be exploited in various ways, introducing cybersecurity concerns. Also, consumers’ privacy issues need to be addressed, as power consumption patterns can reveal sensitive and personal information. R&D efforts in privacy preservation, cybersecurity, and resilience are discussed further in Chapters 5 and 6.
Another form of DER that is primarily used by industrial and corporate consumers involves the use of micro-cogeneration, a localized form of CHP. With CHP, the waste heat produced by electricity generation or industrial processes can be put to productive use (e.g., for direct heat applications, or to produce more electricity), resulting in a more efficient use of fuel. Electricity can also be generated from processes normally intended to produce only heat (e.g., space and water heating). Micro-CHP installations can allow some of the energy from localized heat generation to be converted to electricity (DOE, 2013). The availability of commercially viable DER, combined with tax and ratemaking policies, has increased growth in demand for rooftop solar, energy storage, fuel cells, and diesel/gas generators, all of which can be assembled into microgrids to serve customers as well as communities.2
There are several microgrid and energy-service companies whose business models are designed to help larger customers design, deploy, and manage BtM technologies and other DER to realize savings. There is significant interest in the use of microgrids especially within clusters of buildings on university, commercial, and industrial campuses. While regulatory constraints discussed in Chapter 3 may limit growth, this interest is predicted to grow in the future (MarketWatch, 2019), especially with the potential for integrating renewable generation with storage, increasing electricity supply reliability, and operating in off-grid areas (WBCSD, 2017). However, as discussed in Chapter 3, legal and regulatory constraints on who can build and operate microgrids complicates, and in many cases slows, their deployment.
Trends in Deployment of Distributed Energy Resources (DER)
The growth of DER technologies is resulting in major changes and challenges for both customers and utilities. The ability of customers to generate power at the grid-edge can change their relationship with their utility and introduce shifts in the grid’s operating and control paradigm. Because both BtM resources and demand-management measures can give rise to reductions in demand that would otherwise need to be supplied by the grid, these technologies and developments greatly affect the level, timing, and character of demand.
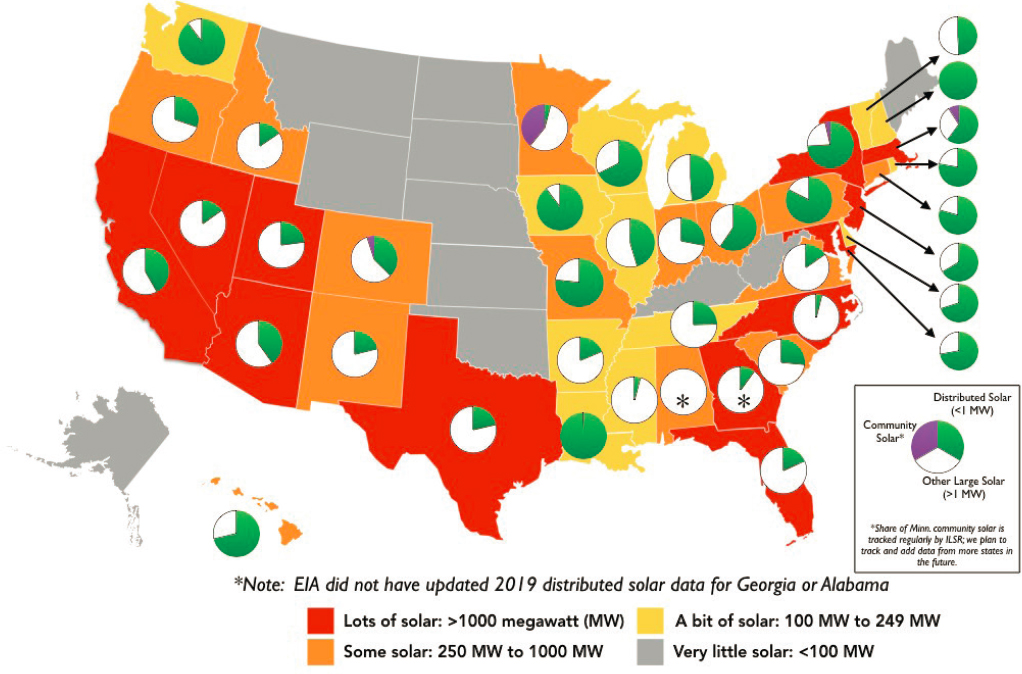
Distributed solar PV capacity has grown markedly across some parts of the United States and is now a mature technology with installed capacity by state, as shown in Figure 2.6. With federal solar tax credits expected to retire in 2020,3 distributed solar installations soared in 2019, giving developers the incentive to take advantage of maximum rebates. Additionally, given the rapid decrease in the cost of solar PV, the return on investment for solar for individuals and businesses has become increasingly attractive since the 2010s. Worldwide, one in three homeowners is interested in generating their own electricity within the next 5 years (Morgan Stanley Research, 2019), and in the United Kingdom, one-third of businesses now generate some of their electricity (Thorpe, 2019).
For utilities, growing public interest in adoption of DER fundamentally changes the centralized control paradigm at the distribution system level. As penetration of DER grows, utilities face the need to visualize, track, manage, and leverage electricity generated by many grid-edge resources. Several new control technologies pertaining to aggregation, coordination, and automation of these DER need to be developed to efficiently integrate them into the grid to ensure reliability and resilience. In this context, there are grand challenges for the industry,
___________________
2 However, see the discussion in Chapter 3 of regulatory and other constraints on the development of microgrids.
3 The economic stimulus/relief package enacted at the end of 2020 included several provisions relating to tax incentives for renewable energy, energy efficiency, and grid enhancements: a 1-year extension of the production tax credit and the investment tax credit (ITC) for onshore wind (at 60 percent of the investment value); a 2-year extension of the ITC for solar investment; a 1-year extension of tax credits for energy efficient homes; a new ITC for offshore wind projects; new tax incentives for various forms of energy storage; and $2.36 billion for smart grid technology (Morehouse, 2020).
its regulators, and broader policy makers regarding how such transitions can be accomplished while overcoming any vulnerabilities introduced through communications with various devices, ensuring costs remain low, and guaranteeing cybersecurity, protection, and safety. These issues are discussed in Chapter 5.
As described in Chapter 3, at present most operators of high-voltage grids are unable to assess conditions at the edge of the grid, particularly in real time, even though such conditions affect loads and system operations on the high-voltage, bulk power system. DER-induced bidirectional power flows require coordination with existing distribution-system operations and protection equipment, but also potentially with operators of bulk power systems. In this context, utilities are developing Distributed Energy Resource Management Systems (DERMS), platforms designed to offload the task of coordinating millions of DER to a third party. Even with this type of delegation, the complexity and cost associated with managing DER is immense, and extensive and coordinated planning will be necessary.
It is possible that increasing penetration of DER will increase the interest in, and pressure for, transitioning toward local distribution system markets, with the role for the utility being to manage the exchange of energy among many different actors and management systems, both small and large. In situations where customers and non-utility third parties buy and sell electricity on the local distribution system—a potential future situation often referred to as “transactive energy”—many changes will need to occur in the roles and responsibilities of the local
electric utility. (These issues are further discussed in Chapters 3 and 5, from a regulatory and technical point of view, respectively.)
Normally, DER would not be considered part of a black-start restoration plan, but that could change in the future. Typically following a disturbance, the power-system restoration process involves connecting undamaged components to adjacent portions of the grid that remained energized during the outage. Priority load during the restoration process is serving the balance-of-plant auxiliary systems associated with power generation facilities that were tripped offline during the event, so that they can be restarted to help pick up the remaining load. In a complete system collapse, a black-start restoration plan involves relying on power generation facilities that are able to start on their own without offsite power, and then use that electricity to feed the other power generation facilities (FERC and NERC, 2018).
During such a blackout, a system operator would want, and present regulations would require, all DER to be disconnected for safety reasons, preventing inadvertent energization of the distribution feeder. But ongoing research (Erickson and Olis, 2019; SEIA, 2020) is exploring the prospect of using DER to help support black-start restoration. To have black-start-capable DER would require at a minimum the same capabilities to operate independently of the grid, with the capability to regulate voltage and frequency. This involves additional expense for the owner/operator of the DER, beyond the specification of most DER today. Additionally, to serve as a black-start resource, the safety issues associated with connecting to the distribution feeder need to be coordinated. While this is a strategy that deserves continued study, leveraging DER is unlikely to be factored into many system operator’s black-start plans for the foreseeable future because there is an insufficient amount of DER suitable for this application.
Finding 2.3: DER are becoming increasingly popular as a means for consumers to become more self-reliant, to lower customer costs, and to address decarbonization goals. While today, the amount of power available from grid-edge devices and DER is likely to be insufficient as a sole source of generation to achieve black start should the bulk power system become completely de-energized, the situation could change in the future.
DRIVER 4: THE RISE OF NON-DISPATCHABLE WIND AND SOLAR
Because of policy initiatives (e.g., Box 2.1), coupled with technical innovations and expanded supply chains, in the European Union, China, and in the United States at both the federal and state levels, the cost of utility-scale wind and solar has fallen precipitously. Today, in much of the country, the cost per kW of new utility-scale solar and wind generation has fallen below that of new gas-fired generation, and well below that of coal and nuclear. These developments, which are further elaborated in Chapter 5, have resulted in major challenges for the industry.
Although public opinion surveys and scholarly studies indicate that there is strong support nationally for the adoption of renewable energy, these preferences play out in dramatically different ways across the country and among different groups. Attitudes about renewable energy development are tied generally to perceptions or expectations that it will produce economic benefits, including jobs tied to installation of the wind turbines and supporting equipment (Hamilton et al., 2018). In parts of the Midwest and Plains states with high-quality wind resources, many wind project developers have succeeded in siting their turbines on farmlands by giving the farmers a rental payment tied to output from the facilities (Bidwell, 2013). Offshore wind is gaining acceptance in many coastal states, driven in part by those states’ policies to reduce power-sector GHG emissions and by interest in hosting the jobs associated with those large-scale projects (Cape Wind Project, 2017; Love, 2014; Williams and Whitcomb, 2008).
Solar is popular in many states, often driven by state policies such as renewable portfolio standards and net-metering. Hawaii, California, and Arizona have the highest per-capita installation of small-scale PV systems on residential buildings.4 Residential electricity customers in Hawaii and California, which have the highest per-capita adoption rates in the United States, also have some of the highest electricity prices in the nation (EIA, 2019c).
___________________
4 The source of data for calculations of per-capita installations of small-scale PV systems on residential rooftops are U.S. Census Bureau data on state population estimates for 2019 (2019b); EIA data on small-scale solar PV capacity estimates (EIA, 2015); and EIA data on electricity prices by state (EIA, 2019c).
Arizona, one of the sunniest states in the nation, ranks third in terms of per-capita adoption rates, but has much lower electricity rates along with fierce consumer interest in advancing decentralized small-scale generation, often in pursuit of the “democratization” of ownership of power supply (Farrell, 2017).
Challenges
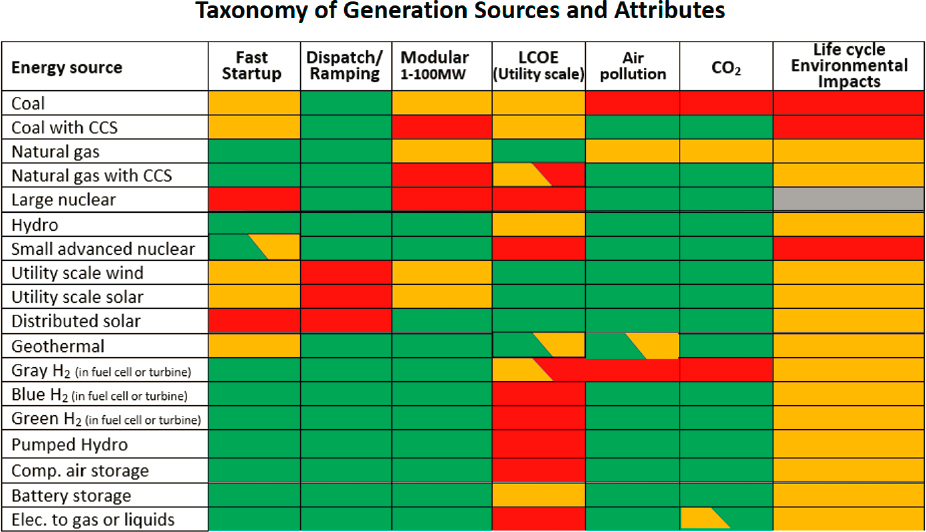
A major challenge associated with wind and solar generation is that at times generation can far exceed demand and require curtailment (intentional reduction of output), which is not an economic use of resources. At other times, renewables can underproduce and require easily dispatchable load-following from other energy resources (e.g., natural gas). Duke Energy, a large public utility, highlighted the importance of “ZELFRs”—zero-emitting load-following resources—in its 2020 report on achieving a zero-carbon future (Duke Energy, 2020). Curtailment is occurring at a growing rate in California, and will likely continue to grow given plans to build more renewable plants and install more DER to meet the state’s 50 percent renewable mandate (CAISO, 2017). Potential solutions to curtailment include energy storage (long and short duration; see Chapter 5), EV charging systems, demand response technologies, time-varying pricing, and flexible and hybrid resources. Managing the consequences of intermittency has implications for reliability, emissions reductions, and cost. Some of the challenges associated with various energy sources, including dispatchability and cost, are summarized in qualitative terms in Figure 2.7.
The term renewables is often used as a synonym for zero carbon emission technology. The two are not the same. As noted above, and in Chapter 5, there are other technologies that can produce electricity without emitting CO2 to atmosphere. Also, while the type of generation resources used for electricity have historically been in the spotlight in terms of analyzing sustainability and emissions reductions, the next frontier of the energy transition
will likely consider the footprint of entire supply chains: from mining practices; to maintenance requirements; to recycling and disposal of the variety of toxic components and materials involved in the production of solar panels, batteries, and wind turbines; to power plant decommissioning (Hendrickson et al., 2006; Infrastructure Investor, 2020). While there is a certain inevitability in the movement toward cleaner electricity, a deeper examination of the sustainability of full technology supply chains is necessary to ensure that a rapidly changing generation and transmission landscape delivers on the widely held expectation that it will provide truly clean energy.
Finding 2.4: The intermittent nature of wind and solar complicate the operation of power systems and create challenges of both insufficiency and excess that require solutions ranging from dispatchable zero-emission generation, long- and short-term storage, EV charging, demand response technologies, and integration of other flexible/hybrid resources.
DRIVER 5: A DESIRE TO REDUCE SOCIAL INEQUITIES
Poverty and wide disparities in income are broad problems in U.S. society that manifest in the electricity sector in several ways. Some challenges for low-income consumers include the following:
- Inability to pay electricity bills, with consequences for service disconnection.
- Constraints on the ability to use electricity more efficiently and to invest in more efficient appliances.
- Potential increased financial burdens imposed by shifting technology, tariffs, and regulations.
- Disproportionate exposure to pollution, negative environmental impacts, and other externalities of the energy system.
While electricity expenditures have declined as a share of average household income since 2007, many low-income households still struggle to pay their electricity bills. Energy poverty exists where people are unable to afford adequate energy and most commonly affects members of racial and ethnic minorities, groups affected by other poverty measures (Drehobl et al., 2020), immigrant communities, and those living in urban or rural areas (Brown et al., 2020). Brown et al. (2020) report that “After decades of weatherization and bill-payment programs, low-income households still spend a higher percent of their income on electricity and gas bills than any other income group. Their energy burden is not declining, and it remains persistently high in particular geographies such as the South[eastern United States], rural America, and minority communities.”
High energy bills do not necessarily correlate with high energy costs. From an equity point of view, the important issue is the size of the bill relative to a household’s ability to pay. Spending more than 5 to 10 percent of household income on energy is often a benchmark figure for home energy unaffordability. Many households below the poverty line experience up to three times the energy burden of non-low-income households owing to inefficient energy usage in low-quality housing (Lyubich, 2020). Despite upfront costs, energy efficiency and weatherization improvements ultimately decrease energy burden on a household (Drehobl and Ross, 2016). These upfront costs are part of a larger social justice issue that is becoming increasingly important to many utility planning efforts (Cha et al., 2020; Hernández, 2015; Morello-Frosch et al., 2011).
Low-income populations often find that the only places they can afford to live involve housing that does not make efficient use of energy, often leading to reliance on stoves or small appliances for heating, and the associated cost, health, and safety issues thereof. As Hernández et al. (2015) observe
Energy insecurity is associated with inefficiencies in the housing structure, such as drafty windows, poor insulation and less efficient heating systems and appliances. The resulting discomfort in extreme home temperatures and high energy costs are burdensome particularly for low-income households. … Poor building conditions and high energy costs also create a situation wherein families must negotiate competing priorities and expenses, such as having to choose whether to pay for their utility bills or for food or medical care. … Of particular concern in low-income housing is the occurrence of cumulative housing problems that include not only energy insecurity, but also health and safety risks.
Since tenants are generally responsible for energy bills, landlords often lack incentives to make energy-related improvements. In a study of similar issues in the UK, Middlemiss and Gillard (2015) find “the energy vulnerable have limited agency to reduce their own vulnerability.”
Federal programs like the Low Income Home Energy Assistance Program (LIHEAP) and Weatherization Assistance Program (WAP) have been developed to address the need to help low-income consumers lower their energy bills. LIHEAP/WAP are federal block-grant programs aimed at addressing energy poverty by providing assistance to states and localities to help consumers manage their energy costs. Perl (2018) found that LIHEAP has been consistently underfunded, with only 22 percent of eligible households served by the program each year. Clean energy policies should take into account the far-reaching value of increased funding and participation in programs like LIHEAP/WAP, not only to make electricity affordable, but to confer other health and resilience co-benefits through energy efficiency improvements (Reames, 2016).
The growth of distributed resources, advanced controls, and rate structures and transactive energy arrangements that encourage their adoption, are making it possible for many higher income customers to reduce their electricity bills. Nonetheless, somebody must continue to cover the costs of maintaining the wires. If policies and technology roll-outs are not structured carefully, they may unintentionally impose higher costs on disadvantaged groups. Oppenheim (2016) argues that
Utility regulation in the United States was founded partly on a consensus that raw marketplace economics ignored social justice, including universal service goals. The century-old “regulatory compact” in most jurisdictions offers “just and reasonable rates” in exchange for investment in public services. Justice has come to justify such low-income supports as discounted rates, arrearage forgiveness, limitations on service termination, and low/no cost energy efficiency. The consensus for regulation has now evolved to encompass carbon reduction, and has led to, amongst other things, the promotion of domestic forms of renewable energy known as “distributed generation” (DG). However, such technologies potentially threaten the current regulatory balance that includes ameliorating energy poverty, because DG reduces utility sales but not utility fixed costs and so contributes to higher bills for low-income households that cannot afford such DG investments as rooftop solar, solar domestic hot water, and cogeneration.
Some utility and regulatory policies to promote more efficient buildings, rooftop solar PV, or subsidies for EVs have been criticized as helping wealthy customers at the expense of poorer ones (Pociask, 2017; Emmott, 2018). Upfront costs for EVs or energy-efficiency improvements are often prohibitive for low-income groups, renters, and others that could otherwise benefit from incentives or programs that could alleviate long-term costs (ORNL, 2017; Pivo, 2014; Reames, 2016). Many electric cooperatives are working to address equity and decarbonization together through “beneficial electrification” that would provide space and water heating conversion to rural customers (Yanez et al., 2019).
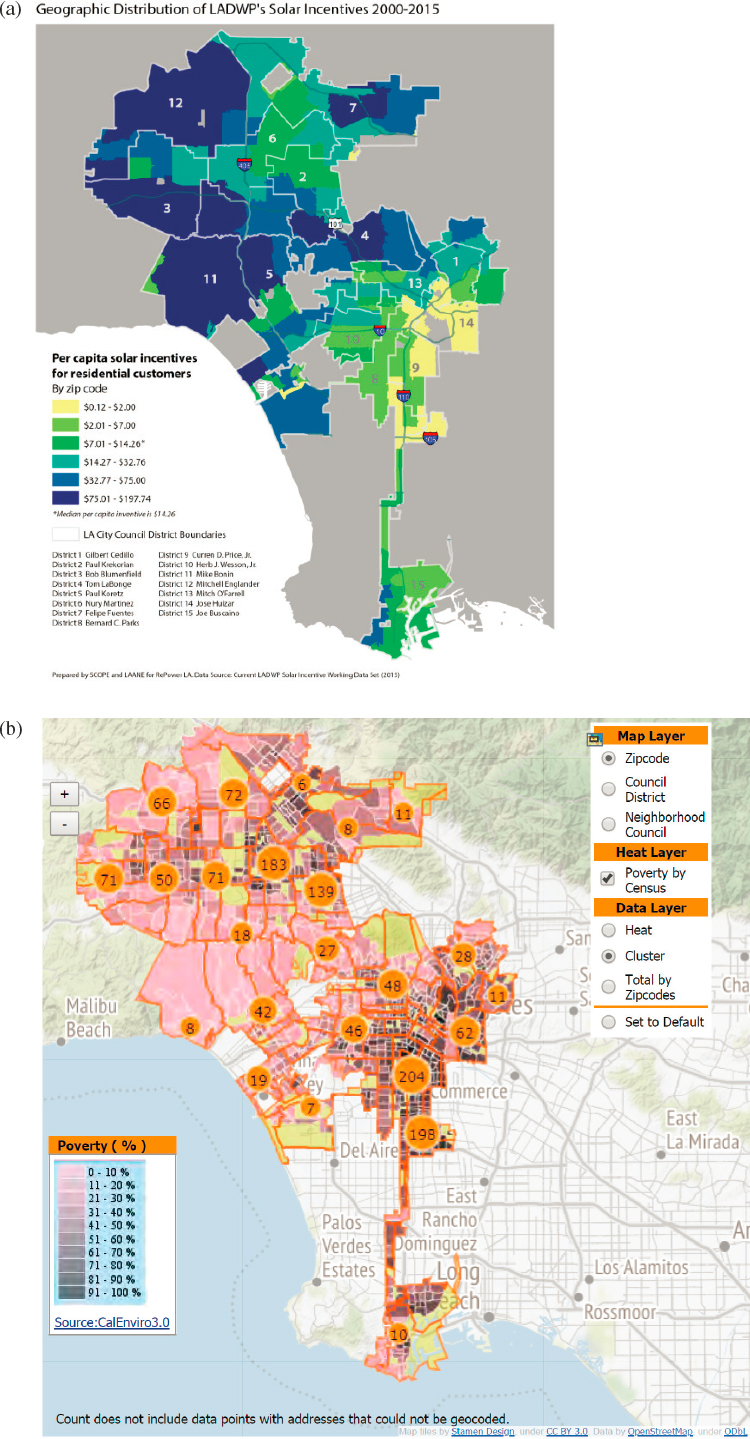
Illustratively, in Los Angeles, an inverse relationship exists between homes that receive energy assistance and homes that receive solar incentives (Figure 2.8), indicating disparity gaps in services and consumer benefits. Policies should consider such disparities to provide equitable access and broad economic benefits across socioeconomic groups.5
Energy issues are starting to be examined in the context of other societal inequities, with the poorest 20 percent of U.S. citizens straining to afford basic necessities including housing, transportation, healthcare, and energy costs (Teller-Elsberg et al., 2016). In EIA’s 2015 Residential Energy Consumption Survey, one in three households reported challenges in paying their energy bills. Other increasing expenses for healthcare, education, and housing have squeezed household budgets and put pressure on the affordability of energy. The pandemic has underscored the central importance of electricity in society, for many households and businesses whose economic fundamentals were undermined by the pandemic have been unable to pay for basic electric services, and one of the most important policy responses has involved LSEs postponing actions such as shutoff and bill collection while society finds ways to work through the pandemic and its consequences.
___________________
5 For example, the Los Angeles Department of Water and Power’s Equity Data Metrics initiative was designed to address such concerning disparities.
Last, as Bullard et al. (2011, 2012) have extensively documented, many of the more negative environmental, aesthetic, and other externalities of industrial and energy infrastructure, such as power plants and associated fuel supply systems, fall disproportionately on minority and low-income populations. This results in part from a vicious cycle in which these facilities are located in places with low land and building costs, and often such places are the only locations in which minority and low-income populations have historically been allowed to live, or today, can afford to live.
Many existing fossil-fueled generating plants are located in environmental justice communities that have been disproportionately impacted by the negative health effects of their emissions—in some cases for decades. Although these generating plants may not always be the primary or even significant sources of local emissions, it will be critical to ensure that these communities are the first beneficiaries of the transition to a decarbonized future through improvements in local air quality, local jobs created, and the subsequent positive economic impacts, as well as other programs and incentives.
Finding 2.5: Affordability of electricity is a critical issue because energy costs are a heavy burden on many low-income households. Although bill-payment assistance can provide short-term help, investments in energy efficiency by governments, utilities, and consumers can reduce electricity demand and provide long-term savings on electricity bills. As the electricity system transitions, and new strategies and technologies are adopted by higher income customers, care should be taken to ensure that electricity is an essential service that is universally available and affordable, and that the externalities that arise from its production and use do not disproportionately burden those least able to deal with them.
DRIVER 6: CONCERNS ABOUT THE IMPACTS OF THE ENERGY TRANSITION ON EMPLOYMENT
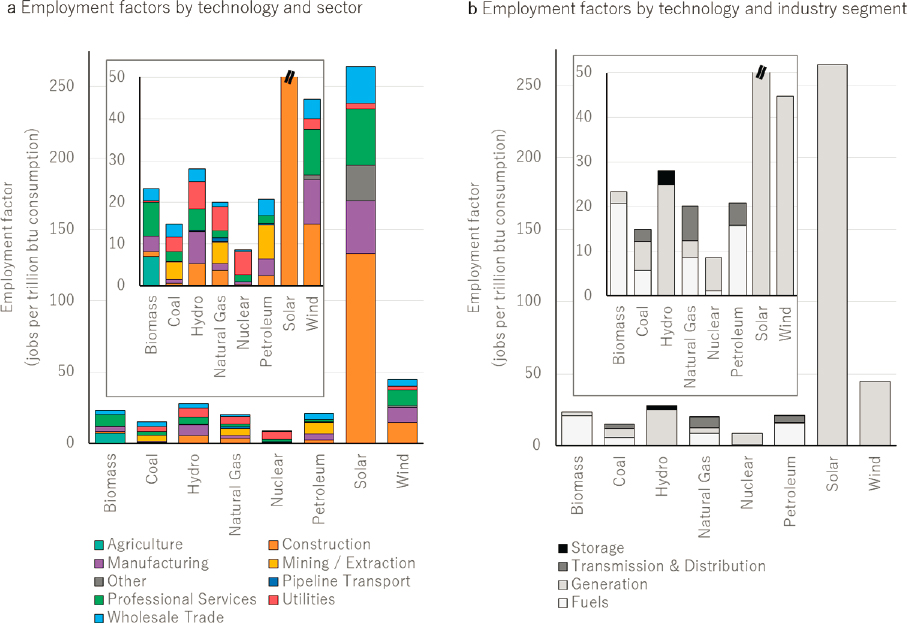
Labor movement across various technologies and sectors will be both a consequence and a driver of change during the electricity transition. The relationship between labor force growth and electricity demand is not clear-cut (Magazzino, 2014), but many parts of the electricity supply chain provide significant employment, and a large share of energy jobs are in the generation segment.
Figure 2.9 compares labor intensity across different generation resources in the United States by utilizing an employment factor—the normalized amount of labor per unit of energy consumed or produced. The diversity of employment opportunities within the energy space is indeed vast.
Many older electricity-system workers who have a great deal of tacit knowledge are retiring. The industry has been working with only mixed success to find ways to capture that knowledge and pass it on to new employees (Peña, 2013). At the same time, the skills needed for jobs in the electricity industry and in its supply chains have changed over time. The 2020 U.S. Energy and Employment Report (USEER) speaks to the changing nature of energy-related jobs, noting that traditional labor market data collection and modeling are insufficient to describe the diversity of jobs that are now related to energy and electricity (USEER, 2020). The U.S. Bureau of Labor Statistics (BLS) is unable to distinguish between employment in “traditional” energy industries (e.g., coal mining; jobs at coal-fired power plants) versus “new” fields (e.g., EV manufacture, which is currently combined with conventional vehicle manufacture). This insufficient categorization complicates an accurate employment analysis. Many activities (e.g., power generation, fuel extraction/refining/delivery, transmission, distribution) are indisputably energy-related, yet many other activities that are becoming relevant to the energy sector are difficult to separate from other economic sectors (e.g., battery and chemical storage, construction, civil/mechanical engineering, data analytics, information technology, software engineering, energy efficiency products and services).
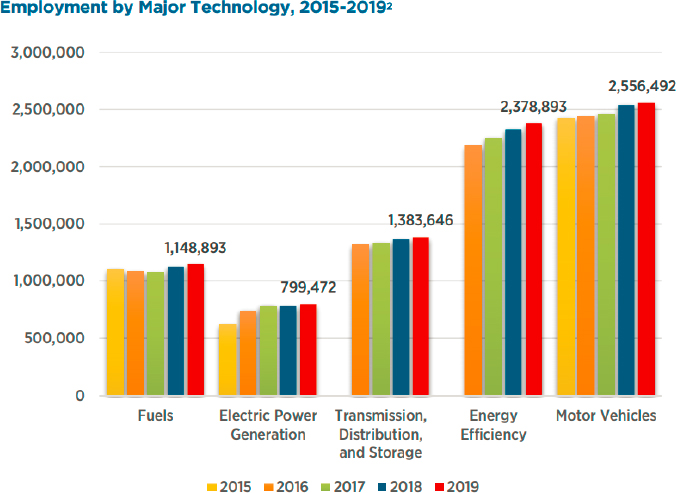
The USEER analysis includes employment in five main groups: (1) fuels; (2) electric power generation; (3) transmission, distribution, and storage (TDS); (4) energy efficiency; and (5) motor vehicles. All of these areas are relevant to the electricity industry. Figure 2.10 shows employment in each of these groups from 2015 to 2019. While only some of these jobs are directly within the electricity sector, all of the groups are part of the changing electricity landscape. Additionally, job creation through clean-energy focused economic recovery plans has the potential to be far-reaching. (See Box 2.2.)
Employment Trends
TDS jobs are predicted to grow according to the USEER and are less vulnerable to changes in generation resources. This is true for jobs in energy efficiency as well. Estimates of the number of jobs in renewable energy, natural gas, and coal vary according to assumptions about energy transitions (Hamilton, 2017). A meta-analysis on the net employment outcomes from renewable energy and energy efficiency transitions found that direct and indirect employment effects are generally positive, although the size of the estimated effect depends upon the estimation methodology relied upon (Stavropoulos and Burger, 2020). Although the BLS projects an overall –0.2 percent decline in power generation jobs over the next decade, solar PV installers and wind turbine service technicians are on the list of top 10 fastest growing occupations through 2028, and estimated output in power generation and supply is projected to grow by 1.4 percent over the next decade (Data USA, 2020).
Employment associated with natural gas-fired generation has grown substantially over the past 20 years, adding 9,100 jobs in 2019 (USEER, 2020). Although many in the workforce have transitioned from coal to natural gas industries, particular concern exists over an imminent workforce transition away from this relatively new sector (and related production and supply chains) and toward more renewables (USEER, 2020; Krauss, 2021).
The electricity sector employment landscape of the future will be determined by a combination of
- Jobs that exist today (e.g., grid operators, control technicians, reliability engineers, planners and modelers, transmission and distribution mechanics and crews, cable splicers, load dispatchers, environmental engineers, information technology personnel);
- Jobs that may be eliminated or reduced in numbers as the industry transitions toward more wind, solar, and storage facilities and demand-side activities, and away from employment at fossil-fuel steam plants
- Emerging jobs, or those likely to be created as the energy transition matures (e.g., battery technicians, wind plant operators and weather forecasters, data scientists, cybersecurity engineers, hydrogen plant operators and technicians, operations and maintenance, integration engineers, electrolysis operations and maintenance technicians, distribution system operators).
(e.g., including operators, assistants and mechanics, instrumentation and electrical technicians, fuel supply analysts, welders, environmental specialists, chemical engineers); and
The power-sector transition will likely depend upon new skills across the workforce, with some variability in job growth by region. The transition will also impact the number of workers, wages, and the types of workers in the energy sector. And often, planned changes in the power supply can create opportunities as well as setbacks for local labor. (For example, see Box 2.3.)
As an example of a transition-related workforce shift, jobs in energy efficiency tend to pay wages that exceed U.S. national average hourly wages, but also require greater levels of knowledge and technical skills than the average job in generation (Muro et al., 2019). Another example is the sheer number of jobs generated in solar-related industries—the number of employment opportunities appears to be an outlier, but, the quality, stability, and earning potential of jobs in solar lag behind other sectors, as many are in construction. Emphasis on creating “good jobs”—jobs that support at least a middle-class lifestyle—will be the keystone for labor policy and will likely require regional considerations as well as public-private collaboration (Rodrik and Sabel, 2019). Otherwise, the tension between losing high-quality jobs and the need for advanced technical skillsets in certain job sectors will continue to pose challenges into the foreseeable future. For a discussion on worker retraining and displacement, see Chapter 5.
Finding 2.6: Many traditional jobs in the electric sector (e.g., generation and TDS) will remain relevant as the grid evolves, and new opportunities related to increased renewables, increased efficiency and sensing, and increased security are expected to have generally positive energy-transition employment outcomes.
DRIVER 7: THE GLOBALIZATION OF SUPPY CHAINS
Until the final few decades of the 20th century, the locus of innovation in the electricity industry was in the United States. The United States continues to be a leading innovator in, and supplier of, technologies and systems for communications and controls, in large part because of spillovers from the rapid growth of related markets. However, much innovation and most suppliers of heavy electric equipment have moved to other countries.
The design and manufacturing of components, such as steam turbines, large high-voltage transformers and circuit breakers, and high-voltage DC transmission equipment, has moved overseas, notably to East Asia, and especially China. These changes in the heavy electric equipment industry have largely resulted from two factors: (1) the largest growth markets have moved to developing countries along with those countries who are rapidly expanding their electric system infrastructures, and (2) many Western suppliers chose to move their development and manufacturing to locations with both lower overall costs and increased market demand.
Changes in the manufacturing of heavy electric equipment have had a variety of impacts on the U.S. electricity system and those who rely on electric service. For example, while some very limited manufacturing of large transformers has returned to the United States, lead times to secure new transformers remain very long. The result has been continued and persistent concerns about electric system vulnerabilities and overall resilience in the event of disruptions arising from both natural events and a range of pernicious human actions that include cyber and physical attacks. These issues have been addressed in a variety of previous reports (DOE, 2017; NASEM, 2017) and are briefly recapped at the beginning of Chapter 6.
As the drivers of economic globalization have begun to intermix with growing geopolitical conflict, other concerns have begun to develop. An exemplar is provided by Executive Order 13920 (Securing the U.S. Bulk-Power System), that was promulgated on May 1, 2020. This order authorizes the U.S. Secretary of Energy, in collaboration with Federal partners and the energy industry, to work on reducing vulnerabilities that might arise from “the unrestricted acquisition or use in the United States of bulk-power system electric equipment designed, developed, manufactured, or supplied by persons owned by, controlled by, or subject to the jurisdiction or direction of foreign adversaries” that could augment “the ability of foreign adversaries to create and exploit vulnerabilities in bulk-power system electric equipment, with potentially catastrophic effects” (E.O. 13920).
Issues of cybersecurity and resilience that arise from both individual assailants and state actors are explored at length in Chapter 6. Chapter 4 argues that however the tensions play out between the forces of globalization and those resulting in increased international conflict, the overall health of the electricity industry will depend on continuing innovation in the United States, with international collaboration being a significant part of that process.
Finding 2.7: Many suppliers of electricity system equipment have chosen to move their manufacturing and development to locations with low overall costs that are closer to market demand (e.g., East Asia). Plans for expanding electricity infrastructure in the United States need to be cognizant of this changing geopolitical environment.
WHAT THE FUTURE MIGHT HOLD
Because of the large amount of long-lived physical infrastructure, and the many different jurisdictional, institutional, regulatory, and other factors, the basic architecture of the electricity system is very “sticky,” that is, slow and hard to change. For this reason, barring highly disruptive developments, there are some insights for the next 10 to 30 years about which the committee believes it can be reasonably confident.
The final sections of this chapter build on the discussion of the existing architecture of the power system laid out in Chapter 1 to discuss changes that could occur in bulk power generation, high-voltage transmission, distribution systems, end use and operational sensing, communications, and control.
The chapter concludes by introducing a framework for considering a range of future grid architectures and use it to illustrate a variety of ways in which the various drivers discussed in this chapter might shape both the U.S. grid, as well as other grids around the world, in the decades to come.
The Future of Generation Systems
The push to install more solar and wind can be expected to continue. Because of the need to fill the gaps in operational output that occur at particular times when the system relies significantly on these intermittent sources and short-duration bulk storage systems, for at least the next few years, natural gas is also likely to play a large role in supplying electricity. However, a variety of market and regulatory developments could influence both the absolute and relative role played by gas in future years. For example, while it is unclear just how seriously the U.S. federal government will pursue the decarbonization of generation, what is clear is that many states and regions will continue to push the system in that direction, while also pushing to electrify transportation and other sectors. The rising consumption of natural gas has allowed for modest decarbonization of the power sector. The EIA reports
From 2005 to 2017, [U.S.] coal-related CO2 emissions declined by 835 million metric tons (39 percent), and petroleum-related CO2 emissions declined by 289 million metric tons (11 percent). Natural gas emissions, however, increased by 285 million metric tons (24 percent) over that period. The underlying energy consumption trends that resulted in these changes—mainly because more electricity has been generated from natural gas than from other fossil fuels—have helped to lower the US emissions level since 2005 because natural gas is a less carbon-intensive fuel than either coal or petroleum. (EIA, 2018b)
The pace of carbon-emission reductions arising from the switch to gas has already tapered off and will continue to slow as the share of coal continues to decline. As noted above, under some technological pathways, deep decarbonization might be consistent with continued consumption of natural gas if plants are outfitted with CCS technology or if the gas supply is decarbonized, such as through increased utilization of biogas or blending of conventional natural gas with hydrogen gas that is produced using non-CO2 emitting methods.
For several reasons, it is probable that the fraction of power generated by nuclear plants will shrink over the next 10 to 30 years (Morgan et al., 2018). For example,
- While several states (e.g., New York, Illinois, New Jersey, Connecticut) have taken steps to help keep nuclear plants economically viable, pressure from low-cost natural gas and renewables, together with the large cost of plant life extension, will likely result in continued closure and decommissioning of older plants in other locations.
- Because of a history of cost overruns on current and recent nuclear facilities and the likelihood that conventional natural gas will remain inexpensive, it would be quite surprising to see a U.S. utility or independent power company willing to commence permitting or construction of a new, large, light-water reactor in the next decade. And given the time it takes to build such plants, only the two reactors currently under construction are likely to come on line in the next decades (IAEA, 2020).
- Through power purchase agreements and other strategies, DOE is working to help jump start a U.S. industry for small modular reactors. A dramatic change will be needed in power system cost structures and the nation’s regulatory process for licensing new reactors for the number of deployed SMRs to grow to the point that they contribute more than a few percent to total power generation in the next 30 years.
- There are many advanced nuclear reactor designs under development by both private players and through the DOE National Laboratories. As with SMRs, the considerable design, economic, and regulatory hurdles such plants must overcome before they can become commercially available suggest that it is unlikely that these will make a significant contribution to total U.S. generation in the next 30 years.
As described further in Chapter 3, many states’ clean-energy and rate-design policies, combined with federal tax incentives and declining costs of renewable technologies, have opened up options for customers to buy from the grid and/or to self-supply some portion of their electricity use with on-site power.
Notably, the policies of states and the commitments of major utility companies and other corporate power buyers introduce different incentives for renewable and low-carbon electric resources; many major U.S. corporations have been signing long-term contracts for renewable energy credits and/or power (Renewable Energy World, 2019). While there is an overlap, the objectives of decarbonizing the electricity system and promoting a greater role for wind, solar, and other renewable sources of generation are not the same. There are a variety of ways to decarbonize the system with technologies other than wind and solar. As the fraction of generation produced by wind and solar pushes higher, the complications arising from the variable and intermittent nature of these sources must be addressed. Chapter 3 provides a map showing states that have renewable generation standards and clean energy goals, and Chapter 5 discusses the strategies for integrating increasing levels of intermittent renewables.
Nevertheless, it seems safe to assume that the next several decades will see a greater portion of power generation coming from wind and solar. How much of that generation will be in the form of utility-scale generation versus smaller-scale and distributed generation is less clear. The economics, at present, strongly favor utility-scale solar and wind generation over output from rooftop and small-scale solar and wind facilities. There are likely to be countervailing pressures that lead in both directions at once: Economies of scale will likely lead to utility-scale projects, although regulatory and legal changes, concerns about resilience, technical change, and changing consumer preferences could also push for greater decentralization. Polling data suggest there is particularly strong bipartisan support for locally generated renewables, notably rooftop solar.6 With favorable technical, economic, and regulatory developments, large- and small-scale solar in the Southwest and offshore wind along the East and West coasts and in the Great Lakes could become major contributors to bulk electric power generation on time scales of the next few decades. The offshore wind will most likely include technologies that allows such systems to be installed in very deep water.
Table 2.A.1 in this chapter’s Annex lists a variety of policy, technology, and other changes that, if they occur, might shape the future of the bulk generation system in the United States over the next several decades.
Finding 2.8: The proportion of power generated by utility-scale plants compared to that generated by distributed sources will probably decrease over the next several decades, but for much of the nation, commercial-scale power plants will continue to generate the majority of electricity. Over the next several decades, it is highly likely that the fraction of bulk power generated from coal will continue to decrease. This decline might be blunted by new policies and investment around CCS, but that is unlikely to alter the fundamental erosion in market share for coal.
The Future of Transmission Systems
Of three major components in the electricity supply chain (generation, transmission, distribution), in 2019 transmission costs made up 13 percent of every consumer dollar currently spent on electricity (EIA, 2020).
Today’s transmission grid is composed of a significant number of facilities that were originally designed and built for different purposes than those for which they are now being used to enable the purchase, sale, and delivery of wholesale power transactions. This repurposing places stress on the system, and in some cases means there is either an excess of capacity, or a need for new transmission capacity in specific regions of the country.
___________________
6 See poll data in Yale Program on Climate Change Communication and George Mason University Center for Climate Change Communication, 2019, Politics and Global Warming.
Although transmission mileage in the United States is generally increasing, information on the total length and age of transmission lines in the United States varies significantly depending on analysis (NERC, 2020), making it difficult to fully understand its current status or estimate necessary investments. A few new transmission facilities have been built, largely to address reliability problems arising on specific parts of the grid, and occasionally to open up access to power supplies in low-cost regions and to ensure secure operations in the event of a closure of an existing power plant. In light of relatively flat demand for electricity, the transmission system has been able to continue to operate without any major degradation in overall reliability. However, because of regulatory obstacles and public opposition to the siting and building of new transmission lines—especially for transmission facilities that cross state lines and that are designed to enable more efficient power trades and access to distant supplies of, say, large-scale wind—is difficult, and indeed, sometimes even impossible to construct the needed facilities.
A high-voltage transmission system containing facilities sited to support delivery of large amounts of power from optimally located renewables would look different from today’s grid, because of the need for new interstate power lines (e.g., MacDonald et al., 2016). And yet, the challenges for siting transmission facilities appear to be particularly acute for lines that could cross multiple states—from locations that are rich in renewable resources to distant load centers with increasing demand for renewable resources. Changes to transmission siting may occur on a fast time scale and will require cooperation among customers, utilities, and policy makers to overcome any “Not In My Backyard” (NIMBY) issues that arise. This is likely to be true even if other factors work to promote more distributed generation.
As discussed in Chapter 3, many states have policy commitments to add renewable and other zero-carbon electrical resources, and in many places expansion of the bulk power system to connect regions with high-quality wind and solar resources with high-density load centers could help enable those transitions. Many studies have shown that interstate power lines are essential to optimize least-cost physical location of renewables, but building new lines could be constrained by the challenges of siting multistate transmission. As bulk renewable generation grows, the need to interconnect low-capacity factor nondispatchable generation is likely to require new transmission. The lack of control of wind and solar can cause transmission congestion or even curtailment at peak generation times.
As noted in Table 2.A.2 in this chapter’s Annex, several technologies and legal and regulatory developments hold the potential to change whether and how much transmission capacity will be expanded in the next three decades. Examples include easing siting constraints by finding ways to make greater use of existing rail and road rights of way; reconductoring existing high-voltage, alternating current (HVAC) lines with new, more efficient conductors so that the same line can carry more power; converting some existing HVAC lines to high-voltage, direct current (HVDC) lines (or adding new HVDC lines); and changes in state siting policies that explicitly align their reviews of transmission lines with the need to provide access to remote renewable generating resources and larger regional power markets (Reed et al., 2020). (See further discussion in Chapter 3.)
As discussed in Chapter 5, the development of new and more efficient solid-state power electronics also holds the potential to dramatically transform the character of the transmission system, making new HVDC applications cost effective at shorter distances, allowing intermediate “tap offs” from HVDC lines that have traditionally only made sense for long-distance point-to-point bulk transfers, facilitating HVAC to HVDC conversion (Reed et al., 2019), and making greater use of high-voltage DC cables to serve offshore wind and address onshore siting constraints.
Table 2.A.2 lists a variety of policy, technology, and other changes that, if they occur, might shape the future of the high-voltage transmission system in the United States over the next several decades.
Finding 2.9: While the system continues to operate reliably, most of the nation’s existing high-voltage transmission infrastructure dates to an earlier era and was designed to be used in a different manner from today’s grid. It is likely that future grids will have much larger penetration of renewables. To accommodate the addition of such resources economically and reliably, it is possible that significant upgrades and expansion will be needed to connect new geographical locations (i.e., areas of high-quality wind and solar) into the system. Because it is unclear how the system will evolve (e.g., massive HVAC build out, nation-wide HVDC overlay, dramatic move to DC with less reliance on the high-voltage grid), the committee cannot quantify the magnitude of cost of possible expansion. Legal and policy changes (e.g., greater use of rail and highway rights-of-way)
and changes in technologies (e.g., power electronics and DC) can help to increase the capacity and facilitate the expansion of the high-voltage transmission system.
The Future of Distribution Systems and End Use
Changes are likely to occur on the distribution-side and the customer’s side of the retail meter. On average, distribution costs account for approximately 25 percent of every dollar spent on electricity (EIA, 2020).
Currently, virtually everywhere in the United States, a single utility holds the legal ability to provide distribution service using its wires within a specific geographic service territory. Some exceptions exist, but exceptions are quite narrow, and they are specifically carved out as a matter of state policy. The vast majority of distribution systems are radial, feeding users off branches from distribution facilities.
Local utilities have planned and invested in a set of distribution facilities with different expectations than now exist for the performance of those delivery systems. Previously, the expectation was that power would flow in one direction, from supply sources through high-voltage transmission facilities, and then be delivered to retail customers. With rapid growth in decentralized power systems (such as rooftop solar systems) on customer premises, distribution-system flows are changing rapidly, and the industry’s planning methods, performance standards, and operational requirements are under pressure for rapid change and accommodation to new customer preferences. Given the growth in decentralization, there has also been growth in the number of distribution system operators, who operate the distribution system but do not own the physical elements of the power system.
As described in more detail in Chapter 3, unlike bulk generation and transmission systems and services, which have undergone massive restructuring and deregulation over the course of the past two decades, investor-owned and publicly owned utilities own and operate distribution systems. In most states, these utilities have a “franchise” to serve a particular geographic area, and in exchange for their exclusive authority to deliver power in that area, they must serve all customers on a nondiscriminatory basis. This long-standing regulatory compact sits at the historical foundation of utility service.
The structure of electric distribution service varies substantially from state to state. In states like New York, Illinois, or Texas, where electricity customers choose their supplier of power, the power is delivered over facilities owned by the local utility (similar to federally ordered open-access policy for transmission facilities). In other states without such customer choice, the utility provides bundled electricity service. But, again, in virtually all cases, only the local utility has permission to own and operate distribution facilities.
Given the powerful political pressures to retain state responsibility and authority over distribution systems, it is unlikely that the same sort of restructuring that has been observed at the national level will occur broadly at the distribution level. That said, the structure of federal/state jurisdiction over the electric industry allows for the practical reality that states serve as “policy laboratories” (Manski, 2013; Morgan, 2017). It is possible, if not likely, that a variety of experiments might be supported and encouraged in states that are willing to explore a range of legal, regulatory, and other innovations. Some illustrative examples include changes in state law that allow and facilitate small microgrids owned by third parties and connected to the utility-operated distribution system; incentives for the adoption of EVs, charging systems, rooftop solar, and small-scale storage technologies; and new rate designs that allow customers to take advantage of real-time changes in power prices. In the future, using innovations at the states as policy laboratories might help motivate changes to elements of the grid that have long been thought to be essential functions of a single, government-regulated (or owned) power grid.
The discussion of Driver 3 above describes the wide range of developments under way on the customer side of the meter that holds the potential to provide more efficient and cost-effective services. A growing number of larger and small users of electricity are “flexing their preferences” for energy supply and services that align with their values as well as their financial interests. While the standard offering from utilities—a blended supply portfolio delivered through customer class-consistent tariffs—is still the predominant pathway for customers to receive their electricity, this model is being challenged by customers.
A fast-emerging driver of this change is coming from corporate customers and investors. The demand pull from this powerful segment of customers will likely increase in the future. With the clout of America’s largest
corporations guiding demand for clean energy, the models that have influenced the character of utility service for decades are due to change: clean energy is becoming an increasingly profitable industry.
Customers are increasingly demanding a faster trajectory to net-zero carbon through energy choices; however, this trajectory must remain aligned with public interest principles. The core principles guiding utility service—that it is safe and secure, affordable and equitable, reliable and resilient, and clean and sustainable—are the central tenets of serving the public. Balancing the trade-offs among all of these principles is an ongoing challenge for utilities and regulators as they seek to safeguard the public interest, while enabling more energy resource choices and acceleration of innovation and technology deployment.
In the face of a changing climate and the increased possibility of extreme weather events, planning for resilience is growing in importance. For example, in anticipation of the combination of extreme heat and dryness and very high winds in Northern California during the 2019 fire season, California utilities instituted their “Public Safety Power Shutoff” program to turn off electricity service to lower the wildfire risk and they pre-positioned temporary small-scale generating units at critical facilities. As they face other types of climate-related extreme events, other communities around the country may decide that they need take action to protect electric infrastructure and/or electricity service to consumers.
At a minimum, many people with the means to do so are adding backup generators (which happened after Hurricane Sandy), and this may have implications for hardships on those customers who are unable to do so. Recent years have also seen an increased interest in DER, which have the potential to enable small microgrids to coexist with traditional energy generation and distribution systems. Planning for and integrating these new types of electricity systems is complex, but can be a way to address issues of resilience. A microgrid strategy for resilience has frequently been discussed, but has only been implemented at small scales. Doing so at a larger regional scale requires both technical and regulatory innovations, as well as innovations in cost recovery and community governance.
Further discussion of these and other policy innovations that might be tried by states is provided in Chapter 3, with Chapter 4 focusing more explicitly on the pathways and barriers to innovation processes that support the performance of the nation’s electric industry.
Table 2.A.3 in this chapter’s Annex lists a variety of policy, technology and other changes that, if they occur, might shape the future of electric power distribution systems and end uses.
Finding 2.10: Unlike generation and transmission, most of the United States has seen only modest selective restructuring at the level of distribution systems. While major technical and operational changes are possible on both sides of the customer meter (smart control, new strategies for pricing and cost recovery, distributed generation, storage, microgrids, transactive energy, etc.), many such developments have yet to be widely realized. In addition to improved, more cost-effective technology, realizing the full potential of these capabilities will require a variety of legal, regulatory, market and other changes.
The Future of Operational Sensing, Communications, and Control
Reliable and secure electricity service depends upon having multiple complex systems in place and operating at a high-level and consistent standard of performance.
Fifty years ago, most generators were controlled by mechanical governors (with the exception of automated safety devices such as circuit breakers), substations were operated by people who opened and closed switches (either through physical presence or through remote control), transmission lines had relatively little instrumentation, and distribution systems and substations had virtually no instrumentation or automation. If a distribution system needed to be modified, linemen had to drive out and climb poles to do that. The 60 Hz wave form was used to control and keep the entire system operating smoothly.
Today, that has all changed. There has been a proliferation of systems that sense and control almost all aspects of the power system. These many systems are allowing for more efficient operation and control. In some cases, they also allow the bulk power system to be operated “closer to the edge” so as to extract maximum output and benefit from existing assets.
For example, while most transmission systems are still in the early stages of figuring out how to make full and effective use of the data they produce, phasor measurement units (PMUs) that measure voltage, current, and the phase angle between them, have become widespread. Most substations are now heavily instrumented and increasingly contain automated systems. High-speed telecommunication systems transport large volumes of data to central supervisory control and data acquisition (SCADA) systems. Distribution automation is allowing growing numbers of distribution circuits and other parts of the system to be remotely monitored and reconfigured. Smart meters are allowing utilities to monitor and increasingly to control end uses. The customer side of the meter is also witnessing the development of automated systems (e.g., to control things like customer-side distributed generation and storage) as well as the early growth of many smart devices, often called the Internet of Things (IoT).
Many of these sensing, communications, and control systems were initially introduced in a piecemeal way with insufficient attention to considerations of cyber vulnerabilities. Many use unencrypted wireless communication, Windows operating systems with known vulnerabilities, difficult to modify access controls, and communication via the public Internet. The lack of cybersecurity controls in the design and build phases was exacerbated by the desire of equipment manufactures to gain early market penetration.
Today, there is widespread awareness that such practices have introduced serious vulnerabilities to the entire energy system. Aggressive measures are being pursued to make the system secure in the face of potential and potentially increasing accidental and pernicious cyber disruptions. At the same time, pressure to add ever more sensing, automation, and digital control will continue over the coming decades. The communications backbone for the system is also increasing reliance on commercial networks that brings additional vulnerabilities. The challenge of balancing those pressures against the need to ensure a robust and secure electric power system at reasonable cost is discussed in Chapter 6.
Finding 2.11: Computing and communications technologies have become integral to the planning and operation of today’s electric system. While this has resulted in efficiency gains and other benefits, the adoption of these technologies has simultaneously increased the vulnerability of electricity systems to cyber disruptions and rapid obsolescence. Balancing the pressures for expanded use of such technologies with the need to ensure a robust and secure electric power system will be an ongoing challenge over the coming decades.
A FRAMEWORK FOR CONSIDERING IMPLICATIONS OF THESE MANY DRIVERS OF CHANGE FOR THE CHARACTER OF FUTURE GRID ARCHITECHTURES
There is, of course, a very large number of ways in which a modern power system could be structured and controlled, especially to accommodate the many types of changes that could occur in the future. Rather than simply choose and discuss a set of scenarios, the committee first built a taxonomy of possible structural characteristics of the system and then discussed various scenarios in which such characteristics may unfold. In contrast to some other scenario efforts that incorporate institutional, regulatory, and other issues (e.g., Brown et al., 2013), here the focus is on the physical and logical structure and control of the system. Figure 2.11 presents three dimensions of the evolution of the grid that could be used to help choose and describe a set of different grid scenarios.
The first dimension in Figure 2.11 addresses the extent to which society uses electrification with emission-free electricity as a strategy to decarbonize the energy system. The second involves the locus and nature of control of the power system, ranging from completely centralized to completely autonomous and decentralized. As a grid becomes more complex and more dependent on decentralized assets, communication latencies make it increasingly difficult to centrally monitor and control all functions. Control in today’s grid is hierarchical, with some control being centralized but much of it distributed out across the system. The third dimension involves the extent to which DC and power electronics plays different or expanded roles in the future grid. This third dimension is distinct from the second because DC could play much a much bigger role in a highly centralized grid—for example, the DC lines that carry bulk power and back-to-back DC interties that make it feasible to subdivide and manage large grids reliably. DC and power electronics could also facilitate highly reliable local microgrids that integrate large numbers of decentralized devices and storage.
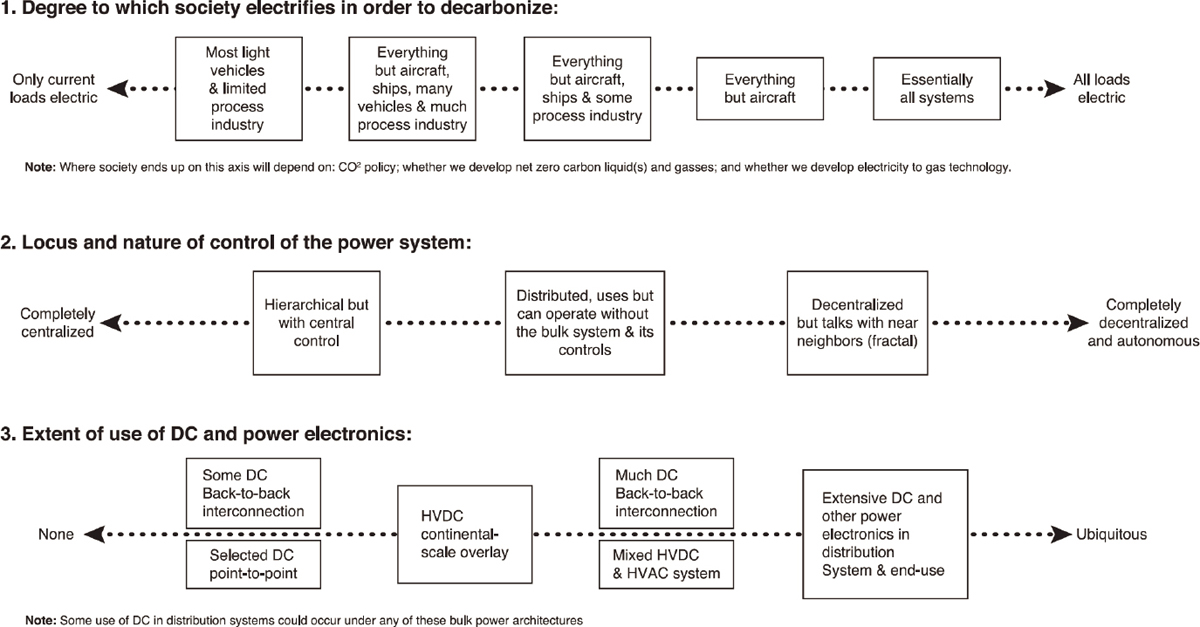
While several other dimensions could be added, such as the extent and nature of energy storage, the mix of generation and the degree of decarbonization, or the extent to which measures are taken to ensure resilient supply to meet critical social services, these three are sufficient for the purpose here of illustrating and exploring the approach of a variety of grid structures—some of which involve incremental changes from today’s grid, and some of which involve fundamentally different architectures.
Figures 2.12 and 2.13 combine the three axes from Figure 2.11 to present six example scenarios of possible grid structures. These are not predictions, nor is there any timeline implied concerning whether and how today’s grid might evolve to achieve these alternative structures. Note too that these scenarios do not represent different
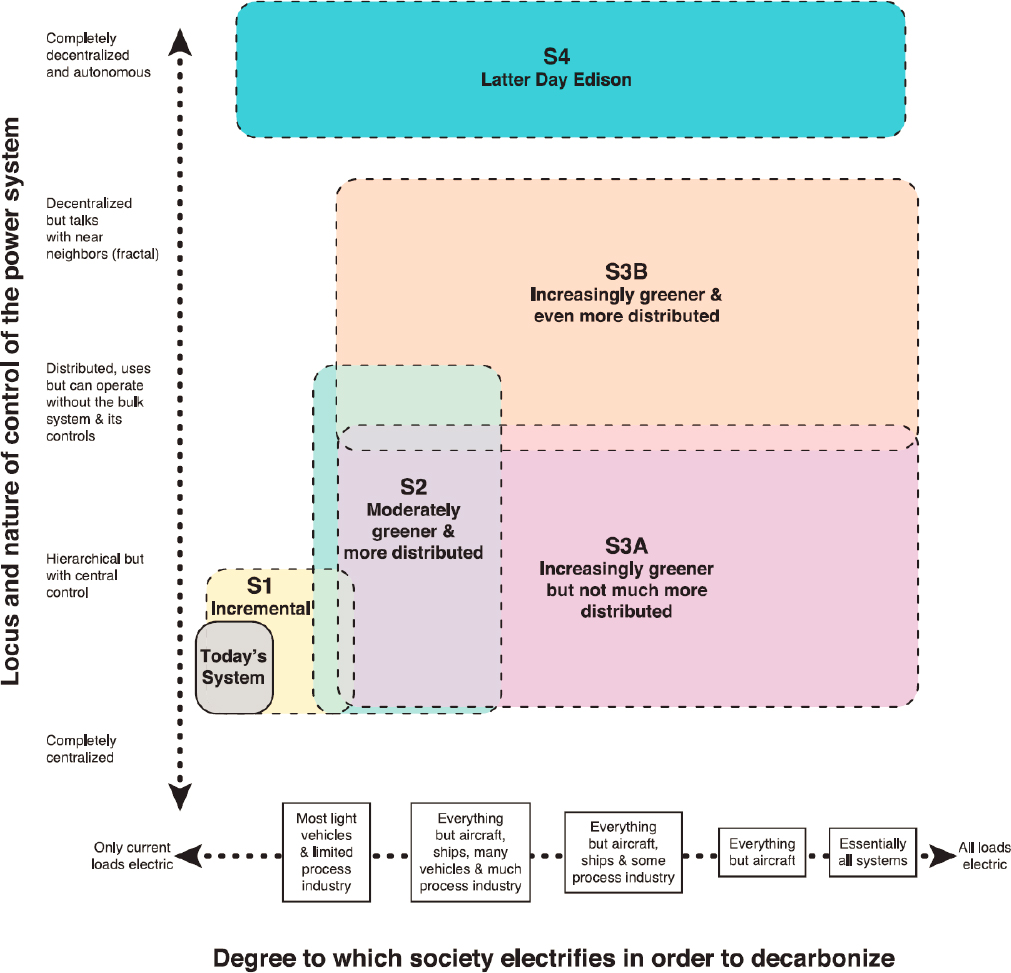
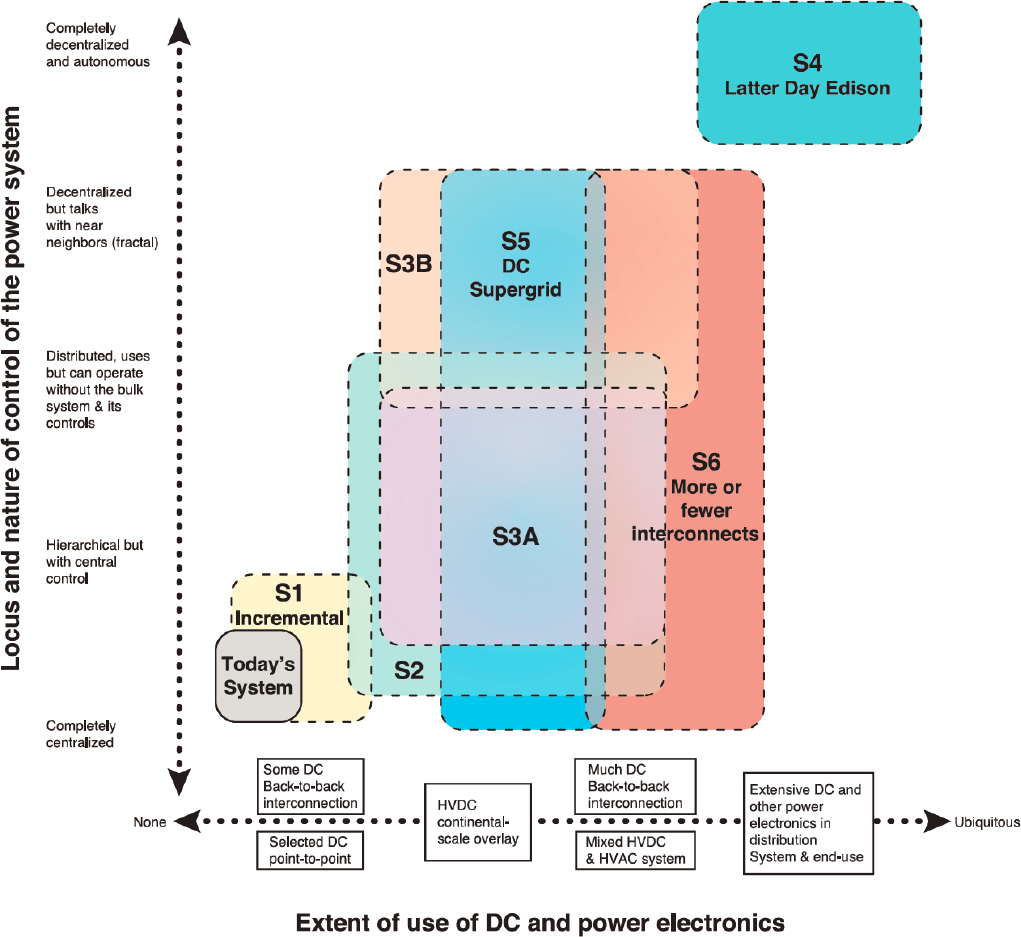
ways of achieving the same goals. Some might be reached more easily than others as today’s grid changes. These different scenarios likely represent very different future costs and GHG emissions intensity. Some of the scenarios are likely compatible with aggressive actions against climate change, while others would result in the electricity sector playing a far smaller role in decarbonization efforts. Different members of the committee view the alternatives as more or less likely descriptions of what a future grid might look like and as more or less desirable.
Scenarios 1 and 2 reflect systems that could easily evolve from the system as it exists today, with Scenario 1 (“Incremental”) projecting business as usual with a centralized paradigm. Scenario 2 (“Moderately greener and more distributed”) maintains a centralized paradigm but postulates investment in substantial additional long-duration grid-scale storage as well. Scenario 3 (realized as either S3A: “Increasingly greener but not much more distributed,” or S3B: “Increasingly greener and even more distributed”) is predicated on decarbonization of the macrogrid—that is, implied in the visions being implemented by regulators in some states already, such as New York and California. This outcome may be realized in a way that maintains the largely centralized organization of the grid (S3A), or in a way which embraces fast-moving, distributed technologies on several fronts (S3B)—perhaps with decentralized microgrids with renewables. Last, Scenario 4 (“Latter day Edison”) visualizes a highly decentralized system without a macro-grid. When Thomas Edison opened the Pearl Street Station in Manhattan in 1882, he supplied just franchise customers within a quarter square mile, entirely with DC power. The technologies of the day did not scale—not least because local coal combustion was polluting and dangerous (a major fire decimated the plant in 1890)—but technological advances more recently (as discussed in Chapters 4 and 5) may transform the picture today. These four scenarios should be considered only representatives of an infinite number of potential alternative grid structures. Figure 2.13 adds two more scenarios: Scenario 5 (“DC supergrid”) and Scenario 6 (“Changes in the number of regional interconnects”). These various scenarios are explained in greater detail below.
Scenario S1 (“Incremental”) is a system that is structurally very much like the present U.S. power system, with incremental changes in energy mix, limited use of HVDC, control, and electrification of loads. The energy mix might include a higher penetration of utility-scale and decentralized renewables (notably rooftop solar), continued availability of power generators that use easily stored fuel (e.g., natural gas or hydrogen), and modest additional amounts of electricity storage and demand response for power balance and reliability. Control might include some advanced distribution management systems to accommodate distributed energy resources. Electrification could include some growth in EVs and building electrification in parts of the country that make aggressive efforts to cut CO2, accompanied by gains in efficiency and incentives for demand response.
Scenario S2 (“Moderately greener and more distributed”) is a system similar to Scenario S1 in all respects but with a larger investment in renewables and probably utility-scale storage or fast ramping low-emission generation at the bulk level to help integrate those renewables into the grid. While the grid remains centralized, there is incremental introduction of distributed control with inverters; breakthroughs in decentralized storage facilitate decentralization of control and resilience. However, this scenario retains the existing operational paradigm—centered on the macro-grid with some additions to the high-voltage interstate transmission system—but achieves modestly lower emissions.
Scenario S3A (“Increasingly greener but not much more distributed”) and S3B (“Increasingly greener and even more distributed”) are systems in which emissions of conventional pollutants and GHGs from the electricity sector are substantially decreased. In Scenario S3A, reductions in power system emissions are obtained while maintaining a largely centralized system. This outcome could be realized through the installation and integration of utility-scale renewable generation sources, CCS, or conversion of net-zero gaseous or liquid fuels. Some distributed technologies would still be integrated into the system (for example, rooftop PV), but the system would retain a largely centralized paradigm.
In Scenario S3B, grid control is more distributed, with a major shift in the roles of the transmission and distribution layers. In this scenario, the distribution system would derive more of its reliability and resiliency locally
and would use the bulk power system primarily for access to low-cost low-carbon generation when available. The penetration of renewables could be high, but low emissions could be achieved, as well, with dramatic cost reductions in SMRs, microreactors, and generation based on hydrogen or other net-zero carbon fuel. This grid would likely operate with millions of controllable end-point nodes, each capable of monitoring, communicating, and enabling decisions—decentralized systems enmeshed in the macro-grid but operating independently. This system could have elements making it more robust at mitigating cascading failures (Talukdar et al., 2009; Talukdar et al., 2005). A suitable collection of these smart grid-edge devices would collaborate, enabled by the deployment of sensors, actuators, and communication devices en masse, at generators, along transmission lines, at substations, in renewable energy sites, in power-electronic devices, in storage devices and EVs.
Scenario S4 (“Latter day Edison”) shows a grid in which technologies and ultra-automation is integrated into virtually all edge devices. It also shows what might be possible if such advances are so profound that investment in a decentralized vision eclipses the use of a central grid. While it is unlikely that the U.S. grid would evolve to this point, such an architecture might be possible in future green-field grids (e.g., in the developing world). Some analysts see this system as technically possible with technologies known today or plausibly available in the next decade. Power balance and supply at high reliability could be ensured over a wide range of conditions, facilitated by flexible loads, such as EV charging, buildings, data centers, and other facilities with local generation as an integral part of the flexible ecosystem.
Scenario S5 (“DC supergrid”): A number of authors have proposed the development of a high-voltage DC power system that would sit on top of the existing AC system (DOE, 2008; MacDonald et al., 2016) as well as an expansion of DER in local systems. The motivation for developing such a system would be to efficiently move large amounts of power from remotely located sources of industry-scale wind and solar power generation.
Scenario S6 (“Changes in the number of regional interconnects”): Today’s bulk power system in the United States consists of three synchronous systems interconnected with DC back-to-back systems that allow at least some transfer of power. In the future, those asynchronous connections could be eliminated, or the capacity of the DC back-to-back interconnections could be increased. In both cases, the objective would be to share power over a wider region. Alternatively, it would also be possible to break the existing three systems into an additional number of synchronous systems with DC back-to-back interconnections between them. Controlled islanding could be employed as a strategy to limit how far large cascading disruptions could propagate (Xu et al., 2011).
These six scenarios are sufficient to illustrate the basic idea of a strategy to lay out a range of alternative different architectures to which either the current U.S. grid might evolve, or which might be adopted as new grids are designed and implemented to provide power to millions of unserved communities across the developing world.
The main attributes that any grid should possess, no matter which portions of the scenarios above are realized, are that it should be (A) safe and secure, (B) affordable and equitable, (C) reliable and resilient, and (D) clean and sustainable. Various drivers and their combined effects may control the direction of the specific move from Scenario S1 to any other. For example, a greater emphasis of Attribute D may take us from S1 vertically up, while Attributes A and C may oppose this move. Attribute B may have a mixed impact on the grid evolution. Keeping it affordable even as renewables increase may be a challenge and may occur only by relaxing equity, necessitating a cap on the distributed nature of control.
The connection between the technologies described in Chapters 5 and 6 and these scenarios is apparent. All three axes used to illustrate the scenarios form the substrate for all of the pivotal technologies and tools in these chapters.
It should be noted that movement of any grid from Scenario S1 to any other scenario is not likely to be uniform across the physical and ICT layers of the grid. It is quite likely that the transmission and distribution layers may move slightly vertically, with direct dependence, as to how much of a move occurs, on associated technological advances in power electronics and DC (both low and high voltage), respectively. In contrast, the ICT layer,
especially for the distribution system, may get transformed, with huge and direct changes occurring from power electronics, and supported by technologies in communication, computing, sensing and actuation, simulation, and data analytics. Such enhancements may be crucial in realizing the best trade-offs between Attributes B and D.
REFERENCES
AAA (American Automobile Association). 2020a. “Electric Vehicle Ownership: Cost, Attitudes, and Behaviors.” https://www.oregon.aaa.com/content/uploads/2020/01/True-Cost-of-EV-Ownership-Fact-Sheet-FINAL-1-9-20.pdf.
AAA. 2020b. “AAA: Owning an Electric Vehicle Is the Cure for Most Consumer Concerns.” AAA NewsRoom. https://newsroom.aaa.com/2020/01/aaa-owning-an-electric-vehicle-is-the-cure-for-most-consumer-concerns/.
Abdel-Aziz, A., A. Acquaye, J. Allwood, J. Ceron, Y. Geng, H. Kheshgi, A. Lanza, et al. 2014. “Industry.” In Climate Change 2014: Mitigation of Climate Change. Contribution of Working Group III to the Fifth Assessment Report of the Intergovernmental Panel on Climate Change. Cambridge, UK: Cambridge University Press.
Abdulla, A., R. Hanna, K.R. Schell, O. Babacan, D. Victor. 201. Explaining successful and failed investments in U.S. carbon capture and storage using empirical and expert assessments. Environmental Research Letters 16:014036.
ACEEE (American Council for an Energy-Efficient Economy). 2020. “2020 Utility Energy Efficiency Scorecard.” Americans for an Energy Efficient Economy. https://www.aceee.org/sites/default/files/pdfs/u2004%20rev_0.pdf.
Ambort, L. 2020. “The State(s) of Distributed Solar—2019 Update.” Institute for Local Self-Reliance. April. https://ilsr.org/the-states-of-distributed-solar-2019.
Andrae, A. 2017. “Total Consumer Power Consumption Forecast.” Presented on behalf of Huawei, Nordic Digital Business Summit, Helsinki, Finland, October 5, 2017. https://www.researchgate.net/publication/320225452_Total_Consumer_Power_Consumption_Forecast.
Ansolabehere, S., and D. Konisky. 2014. Cheap and Clean: How Americans Think About Energy in the Age of Global Warming. Cambridge, MA: MIT Press.
APPA (American Public Power Association). 2018. Utilities grapple with growth in cannabis legalization. https://www.publicpower.org/periodical/article/utilities-grapple-with-growth-cannabis-legalization.
Ausubel, J.H. 2007. Renewable and nuclear heresies. International Journal of Nuclear Governance, Economy and Ecology 1(3):229–243.
Barbose, G. 2019. “US Renewables Portfolio Standards: 2019 Annual Status Update.” LBNL Electricity Markets and Policy. https://emp.lbl.gov/publications/us-renewables-portfolio-standards-2.
Beacon Economics. 2020. “Economic Impact Analysis of the SONGS Decommissioning Project.” https://www.songscommunity.com/internal_redirect/cms.ipressroom.com.s3.amazonaws.com/339/files/20181/Full%20Economic%20Impact%20Analysis%20by%20Beacon%20Economics.pdf.
Berg, W., S. Vaidyanathan, E. Junga, E. Cooper, C. Perry, G. Relf, A. Whitlock, et al. 2019. “The 2019 State Energy Efficiency Scorecard.” American Council for an Energy-Efficient Economy. https://aceee.org/research-report/u1908.
Bidwell, D. 2013. The role of values in public beliefs and attitudes towards commercial wind energy. Energy Policy 58. https://www.sciencedirect.com/science/article/abs/pii/S030142151300164X?via%3Dihub.
Bird, L., and T. Clevenger. 2019. “2019 Was a Watershed Year for Clean Energy Commitments from US States and Utilities.” World Resources Institute. https://www.wri.org/blog/2019/12/2019-was-watershed-year-clean-energy-commitments-us-states-and-utilities.
Brown, M.A., L. Cibulka, and A. Von Meier. 2013. Grid Futures through Scenario Planning. California Institute for Energy and Environment. https://escholarship.org/uc/item/08s64656.
Brown, M.A., A, Soni, M.V. Lapsa, K.A. Southworth, and M. Cox. 2020. High energy burden and low-income energy affordability: Conclusions from a literature review. Progress in Energy 2. https://dx.doi.org/10.1088/2516-1083/abb954.
Bruckner, T., I.A. Bashmakov, Y. Mulugetta, H. Chum, A. de la Vega Navarro, J. Edmonds, A. Faaij, et al. 2014. “Energy Systems.” In Climate Change 2014: Mitigation of Climate Change. Contribution of Working Group III to the Fifth Assessment Report of the Intergovernmental Panel on Climate Change (O. Edenhofer, R. Pichs-Madruga, Y. Sokona, E. Farahani, S. Kadner, K. Seyboth, A. Adler, et al., eds.). Cambridge, UK, and New York: Cambridge University Press. https://www.ipcc.ch/site/assets/uploads/2018/02/ipcc_wg3_ar5_chapter7.pdf.
Bullard, R.D., G.S. Johnson, and A.O. Torres. 2011. Environmental Health and Racial Equity in the United States: Strategies for Building Environmentally Just, Sustainable, and Livable Communities. Washington, DC: American Public Health Association.
Bullard, R.D., and B. Wright. 2012. The Wrong Complexion for Protection. New York University Press.
Burlig, F., C. Knittel, D. Rapson, M. Reguant, and C. Wolfram. 2019. Machine Learning from Schools About Energy Efficiency.
Bushby, S.T., and D.G. Holmberg. 2009. “Advancing Automated Demand-Response Technology.” 2009 ASHRAE Winter Conference. American Society of Heating, Refrigerating and Air-Conditioning Engineers. https://tsapps.nist.gov/publication/get_pdf.cfm?pub_id=861516.
California EO. 2020. N-79-20. https://www.gov.ca.gov/wp-content/uploads/2020/09/9.23.20-EO-N-79-20-text.pdf.
CAISO (California Independent System Operator). 2017. “Impacts of Renewable Energy on Grid Operations.” https://www.caiso.com/documents/curtailmentfastfacts.pdf.
Cape Wind Project. 2017. “Timeline of the Cape Wind Project.” https://www.ack.net/news/20171202/timeline-of-cape-wind-grams/cleanproject.
CEC (California Energy Commission). 2016. “Voluntary California Quality Light-Emitting Diode (LED) Lamp Specification 3.0.” CEC-400-2016-024-SF. https://ww2.energy.ca.gov/business_meetings/2016_packets/2016-12-14/Item_09.pdf.
CEC. 2020. “Hydrogen Vehicles & Refueling Infrastructure.” https://www.energy.ca.gov/programs-and-topics/programs/clean-transportation-program/clean-transportation-funding-areas-1.
Cha, J.M., M. Wander, and M. Pastor. 2020. Environmental justice, just transition, and a low-carbon future for California. Environmental Law Reporter 50:10216.
Clarke, L.E., K. Jiang, K. Akimoto, M. Babiker, G.J. Blanford, K. Fisher-Vanden, J. Hourcade, et al. 2015. Chapter 6 Assessing Transformation Pathways. In: Climate Change 2014: Mitigation of Climate Change. Contribution of Working Group III to the Fifth Assessment Report of the Intergovernmental Panel on Climate Change. United Kingdom. https://www.osti.gov/biblio/1562891.
Clean Coalition. 2019a. “Community Microgrid Initiative.” https://clean-coalition.org/community-microgrid-initiative/.
Clean Coalition. 2019b. “Goleta Load Pocket Community Microgrid (GLPCM).” https://clean-coalition.org/community-microgrids/goleta-load-pocket/.
Cullenward, D., and D. Victor. 2020. Making Climate Policy Work. Hoboken, NJ: John Wiley & Sons.
Cunliff, C. 2019. An Innovation Agenda for Hard-to-Decarbonize Energy Sectors. Information Technology & Innovation Foundation. https://itif.org/publications/2019/11/11/innovation-agenda-hard-decarbonize-energy-sectors.
Data USA. 2020. “Electric Power Generation, Transmission, and Distribution.” https://datausa.io/profile/naics/electric-power-generation-transmission-distribution#growth.
DOE. 2008. “20-percent Wind Energy by 2030—Increasing Wind Energy’s Contribution to US Electricity Supply.” EERE. Washington, DC.
DOE. 2013. “Opportunities for Combined Heat and Power in Data Centers.” https://www.energy.gov/sites/prod/files/2013/11/f4/chp_data_centers.pdf.
DOE. 2016. “Saving Energy and Money with Building Energy Codes in the United States.” DOE/EE-1087. https://www.energy.gov/sites/prod/files/2016/08/f33/Codes%20Fact%20Sheet%208-25-16.pdf.
DOE. 2017. “Transforming the Nation’s Electricity System: The Second Installment of the QER.” https://www.energy.gov/sites/prod/files/2017/01/f34/Chapter%205%20The%20Electricity%20Workforce%20Changing%20Needs,%20New%20Opportunities_0.pdf.
DOL (U.S. Department of Labor). 2019. “US Department of Labor Awards Workforce Development Demonstration Grants of $29.2 Million to 18 Organizations in Appalachian and Delta Regions.” September 30. https://www.dol.gov/newsroom/releases/eta/eta20190930.
Drehobl, A., and L. Ross. 2016. Lifting the High Energy Burden in America’s Largest Cities: How Energy Efficiency Can Improve Low Income and Underserved Communities. American Council for an Energy-Efficient Economy. https://trid.trb.org/view/1417907.
Drehobl, A., L. Ross, and R. Ayala. 2020. “An Assessment of National and Metropolitan Energy Burden Across the United States.” Americans for an Energy Efficient Economy. https://www.aceee.org/sites/default/files/pdfs/u2006.pdf.
Dryden, R., M.G. Morgan, A. Bostrom, and W. Bruine de Bruin. 2018. Public perceptions of how long air pollution and carbon dioxide remain in the atmosphere. Risk Analysis 38(3):525–534.
Duke Energy. 2020. “Achieving a Net-Zero Carbon Future.” https://www.duke-energy.com/_/media/pdfs/our-company/climate-report-2020.pdf?la=en.
Edmonds, E. 2019. “Why Aren’t Americans Plugging In to Electric Vehicles?” AAA NewsRoom. May 9. https://newsroom.aaa.com/2019/05/why-arent-americans-plugging-in-to-electric-vehicles/.
EEI Customer Solutions. 2019. “Highlights of EEI Member Residential/Commercial/Industrial Efficiency, Demand Response and Renewable Energy Programs.” https://www.eei.org/issuesandpolicy/efficiency/Documents/EfficiencyandDemandResponsePrograms.pdf.
Efficiency Vermont. 2020. https://www.efficiencyvermont.com.
EIA (U.S. Energy Information Administration). 2015. “Residential Energy Consumption Survey (RECS).” https://www.eia.gov/consumption/residential/index.php.
EIA. 2018a. “EIA’s Residential Energy Survey Now Includes Estimates for More Than 20 New End Uses.” Today in Energy. June 5. https://www.eia.gov/todayinenergy/detail.php?id=36412&src=%E2%80%B9%20Consumption%20%20%20%20%20%20Residential%20Energy%20Consumption%20Survey%20(RECS)-b1.
EIA. 2018b. “Use of Energy in Commercial Buildings.” Use of Energy Explained. September 28. https://www.eia.gov/energyexplained/use-of-energy/commercial-buildings.php.
EIA. 2018c. “U.S. Energy-Related CO2 Emissions Expected to Rise Slightly in 2018, Remain Flat in 2019.” https://www.eia.gov/todayinenergy/detail.php?id=34872#.
EIA. 2019a. “How Much Energy Is Consumed in US Residential and Commercial Buildings?” Frequently Asked Questions. May 14. https://www.eia.gov/tools/faqs/faq.php?id=86&t=1.
EIA. 2019b. “State Electricity Profiles.” https://www.eia.gov/electricity/state/.
EIA. 2019c. “Use of Energy in Homes.” Use of Energy Explained. April 8. https://www.eia.gov/energyexplained/use-of-energy/.
EIA. 2020a. “Annual Energy Outlook 2020 with Projections to 2050.” https://www.eia.gov/outlooks/aeo/pdf/AEO2020%20Full%20Report.pdf.
EIA. 2020b. Annual Electric Power Industry Report. “Form EIA-861 Detailed Data Files, Early Release Data for 2019.” https://www.eia.gov/electricity/data/eia861/.
EIA. 2020c. “Form EIA-861M (Formerly EIA-826) Detailed Data.” May 26. https://www.eia.gov/electricity/data/eia861m/#solarpv.
Emmott, C. 2018. “Do Solar Power Subsidies Benefit Rich Homeowners at the Expense of the Poor?” The Conversation. http://theconversation.com/do-solar-power-subsidies-benefit-rich-homeowners-at-the-expense-of-the-poor-26612.
EPA (U.S. Environmental Protection Agency). 2018. “Sources of Greenhouse Gas Emissions.” Overviews and Factsheets. https://www.epa.gov/ghgemissions/sources-greenhouse-gas-emissions.
EPA. 2020a. “Green Power Partnership Fortune 500® Partners List.” Overviews and Factsheets. July 27. https://www.epa.gov/greenpower/green-power-partnership-fortune-500r-partners-list.
EPA. 2020b. “Green Power Partnership National Top 100.” Overviews and Factsheets. July 27. https://www.epa.gov/greenpower/green-power-partnership-national-top-100.
Ericson, S., and D. Olis. 2019. “A Comparison of Fuel Choice for Backup Generators.” National Renewable Energy Laboratory. https://www.nrel.gov/docs/fy19osti/72509.pdf.
Evans, et al. 2020. “Solar Is Now Cheapest Electricity in History, Confirms IEA.” Carbon Brief. October 13. https://www.carbonbrief.org/solar-is-now-cheapest-electricity-in-history-confirms-iea.
Farrell, J. 2017. “Energy Democracy in 4 Powerful Steps.” Renewable Energy World. https://www.renewableenergyworld.com/2017/08/23/energy-democracy-in-4-powerful-steps/#gref.
Feldman, D., A. Ebers, and R. Margolis. 2019. “Q3/Q4 2018 Solar Industry Update.” January. https://www.nrel.gov/docs/fy19osti/73234.pdf.
FERC (Federal Energy Regulatory Commission) and NERC (North American Electric Reliability Corporation). 2018. Report on the FERC-NERC-Regional Entity Joint Review of Restoration and Recovery Plans. https://www.ferc.gov/sites/default/files/2020-05/bsr-report.pdf.
Fitzgerald, G., J. Mandel, J. Morris, and H. Touati. 2015. “The Economics of Battery Energy Storage.” Rocky Mountain Institute. https://rmi.org/wp-content/uploads/2017/03/RMI-TheEconomicsOfBatteryEnergyStorage-FullReport-FINAL.pdf.
Ford, M., A. Abdulla, M.G. Morgan, and D. Victor. 2017. Energy policy expert assessments of the state of US advanced fission innovation. Energy Policy 108:194–200. https://www.sciencedirect.com/science/article/abs/pii/S0301421517303506.
Gallucci, M. 2019. “Energy Equity: Bringing Solar Power to Low-Income Communities.” Yale Environment 360. April 4. https://e360.yale.edu/features/energy-equity-bringing-solar-power-to-low-income-communities.
Girod, B., S. Mayer, and F. Nägele. 2017. Economic versus belief-based models: Shedding light on the adoption of novel green technologies.” Energy Policy 101:415–426. https://doi.org/10.1016/j.enpol.2016.09.065.
Hamilton, K. 2017. “How Can We Ensure the Energy Transition Leaves No Worker Behind?” World Economic Forum. https://www.weforum.org/agenda/2017/11/energy-transition-leave-no-worker-behind-skills-jobs/.
Hamilton, L.C., E. Bell, J. Hartter, and J. Salerno. 2018. A change in the wind? US public views on renewable energy and climate compared.” Energy, Sustainability, and Society 8(11). https://link.springer.com/article/10.1186/s13705-018-0152-5.
Hart, J. 2017. “Behind-the-Meter Energy Storage.” Center for Sustainable Energy. https://energycenter.org/thought-leadership/blog/unlocking-value-behind-meter-energy-storage.
Hernández, D. 2015. “Sacrifice Along the Energy Continuum: A Call for Energy Justice.” Environmental Justice. https://www.ncbi.nlm.nih.gov/pmc/articles/PMC4819332/.
Hendrickson, C.T., L.B. Lave, H.S. Matthews, and A. Horvath. 2006. Environmental Life Cycle Assessment of Goods and Services: An Input-Output Approach. Resources for the Future.
Hibbard, P., S. Tierney, P. Darling, and S. Cullinan. 2018. “The Economic Impacts of the Regional Greenhouse Gas Initiative on Nine Northeast and Mid-Atlantic States: Review of RGGI’s Third Three-Year Compliance Period (2015–2017).” https://www.analysisgroup.com/globalassets/uploadedfiles/content/insights/publishing/analysis_group_rggi_report_april_2018.pdf.
Hines, P., J. Apt, and T. Talukdar. 2009. Large blackouts in North America: Historical trends and policy implications. Energy Policy 37:5249–5259.
Hirsh, R.F., and J.G. Koomey. 2015. Electricity consumption and economic growth: A new relationship with significant consequences?” Electricity Journal 28(9). https://law.stanford.edu/wp-content/uploads/2016/06/Electricity-Consumption-and-Economic-Growth.pdf.
Hodson, R. 2018. Nature outlook: Digital revolution. Nature 568(7733). https://www.nature.com/articles/d41586-018-07500-z.
Holland, S.P., E.T. Mansur, N. Muller, and A.J. Yates. 2018. Decompositions and policy consequences of an extraordinary decline in air pollution from electricity generation. American Economic Journal: Economic Policy 12(4):244–274. https://www.aeaweb.org/articles?id=10.1257/pol.20190390.
Houser, T., H. Pitt, and H. Hess. 2019. Final US Emissions Estimates for 2018. Rhodium Group/US Climate Service. https://rhg.com/research/final-us-emissions-estimates-for-2018/.
Howson, P. 2019. Tackling climate change with Blockchain. Nature Climate Change 9:644–645. https://www.nature.com/articles/s41558-019-0567-9?proof=t.
Hurlbut, D., S. Haase, C. Barrows, L. Bird, G. Brinkman, J. Cook, M. Day, et al. 2016. “Navajo Generating Station and Federal Resource Planning.” National Renewable Energy Laboratory. https://www.nrel.gov/docs/fy17osti/66506.pdf.
IAEA (International Atomic Energy Agency). 2020. “Power Reactor Information System: United States of America.” October 12. https://pris.iaea.org/PRIS/CountryStatistics/CountryDetails.aspx?current=US.
ICLEI. 2020. “Three Decades of Local Sustainability: ICLEI Celebrates 30 Years Since Our Founding.” https://www.iclei.org/.
IEA (International Energy Agency). 2017. “Digitization and Energy.” Paris. https://www.iea.org/reports/digitalisation-and-energy.
IEA. 2018. “Air Conditioning Use Emerges as One of the Key Drivers of Global Electricity-Demand Growth.” https://www.iea.org/news/air-conditioning-use-emerges-as-one-of-the-key-drivers-of-global-electricity-demand-growth.
IEA. 2020. Energy Technology Perspectives 2020. September. https://www.iea.org/reports/energy-technology-perspectives-2020.
Infrastructure Investor. 2020. “Energy Transition: Beyond Generation Investors Turn Their Attention to New Markets.” April.
Jenkins, A. 2018. “Food Security: Vertical Farming Sounds Fantastic Until You Consider Its Energy Use.” Conversation. September 10. http://theconversation.com/food-security-vertical-farming-sounds-fantastic-until-you-consider-its-energy-use-102657.
Jereza, K. 2019. “Project 2X to 2050: Accelerating the Clean Energy Transition Reliably and Affordably.” Presented at the NASEO Annual Meeting. https://annualmeeting2019.naseo.org/data/energymeetings/presentations/Jereza--Project-2X-to-2050.pdf.
Jones, N. 2018. The information factories. Nature 561:163–166.
Jordan, P. 2020. “Memorandum: US Energy Employment Initial Impacts from the COVID-19 Economic Crisis.” BW Research Partnership. https://bwresearch.com/covid/docs/BWResearch_EnergyJobsCOVID19Memo_June2020.pdf.
Joyce, E. 2012. “San Onofre Layoffs: 730 Employees to Lose Jobs at Nuclear Plant.” https://www.scpr.org/news/2012/08/21/33962/layoffs-700-employees-lose-jobs-san-onofre-nuclear/.
Kintner-Meyer, M., et al. 2019. “EV-Grid Impact Study (Preliminary results), 5th EVs and the Grid Conference,” Los Angeles, California, October 1-3.
Knapp, L., E. O’Shaughnessy, J. Heeter, S. Mills, and J.M. DeCiccoe. 2020. Will consumers really pay for green electricity? Comparing stated and revealed preferences for residential programs in the United States. Energy Research and Social Science 65:101457. https://www.sciencedirect.com/science/article/abs/pii/S2214629620300347.
Krauss, C. 2021 “‘A Slap in the Face’: The Pandemic Disrupts Young Oil Careers.” New York Times. https://www.nytimes.com/2021/01/03/business/oil-industry-careers.html.
Larson, E., C. Greig, J. Jenkins, E. Mayfield, A. Pascale, C. Zhang, S. Pacala, et al. 2020. Net-Zero America by 2050: Potential Pathways, Deployments, and Impacts. Princeton, NJ: Princeton University Press.
Lawson, A. 2019. “Net Metering: In Brief.” Congressional Research Service. https://fas.org/sgp/crs/misc/R46010.pdf.
Lempert, R., B.L. Preston, J. Edmonds, L. Clarke, T. Wild, M. Binsted, E. Diringer, and B. Townsend. 2019. “Pathways to 2050: Alternative Scenarios for Decarbonizing the US Economy.” Center for Climate and Energy Solutions. May. https://www.c2es.org/site/assets/uploads/2019/05/pathways-to-2050-scenarios-for-decarbonizing-the-us-economy-final.pdf.
Levene, J.I., M.K. Mann, R.M. Margolis, and A. Milbrandt. 2005. “An Analysis of Hydrogen Production from Renewable Electricity Sources.” NREL/CP-560-37612. National Renewable Energy Laboratory. https://www.nrel.gov/docs/fy05osti/37612.pdf.
LLNL (Lawrence Livermore National Laboratory). 2018. “Energy US 2018.” https://flowcharts.llnl.gov/content/assets/images/energy/us/Energy_US_2018.png.
Love, C. 2014. “Case Study: Cape Wind Project.” National Geographic. https://www.nationalgeographic.org/article/case-study-cape-wind-project/.
Luery, M. 2019. “Generator Sales Rise Due to PG&E Power Shutoff Concerns.” KCRA. https://www.kcra.com/article/generator-sales-rise-pgande-power-shutoffs-northern-california/28500394.
Luskin Center for Innovation. 2019. “Progress Toward 100% Clean Energy in Cities and States Across the US.” University of California, Los Angeles. https://innovation.luskin.ucla.edu/wp-content/uploads/2019/11/100-Clean-Energy-Progress-Report-UCLA-2.pdf.
Lyubich, E. 2020. “The Race Gap in Residential Energy Expenditures.” Energy Institute WP 306. https://haas.berkeley.edu/wp-content/uploads/WP306.pdf.
MacDonald, A.E., C.T. Clack, A. Alexander, A. Dunbar, J. Wilczak, and Y. Xie. 2016. Future cost-competitive electricity systems and their impact on US CO2 emissions. Nature Climate Change, 6(5):526–531.
Magazzino, C. 2014. Electricity demand, GDP and employment: Evidence from Italy. Frontiers in Energy 8:31–40.
Manski, C.F. 2013. Public Policy in an Uncertain World: Analysis and Decisions. Cambridge, MA: Harvard University Press.
Mantas, H. 2019. “SRP Confirms Navajo Generating Station Closure Set This Week, Layoffs or Transfers in the Works.” Bizjournals. https://www.bizjournals.com/phoenix/news/2019/11/10/srp-confirms-navajo-generating-station-closure-set.html.
MarketWatch. 2019. “Microgrid Market to Witness Heavy Growth Prospects from Commercial and Industrial Sectors.” https://www.marketwatch.com/press-release/microgrid-market-to-witness-heavy-growth-prospects-from-commercial-industrial-sectors-abb-ge-eaton-siemens-schneider-electric-caterpillar-inc-honeywell-alstom-grid-lockheed-martin-2019-04-12.
Masanet, E., A. Shehabi, N. Lei, S. Smith, and J. Koomey. 2020. Recalibrating global data center energy-use estimates. Science 367(6481):984–986.
McCarthy, J. 2019. “Most Americans Support Reducing Fossil Fuel Use.” Gallup. https://news.gallup.com/poll/248006/americans-support-reducing-fossil-fuel.aspx.
McKinsey. 2019. “The Decoupling of GDP and Energy Growth: A CEO Guide.” https://www.mckinsey.com/industries/electric-power-and-natural-gas/our-insights/the-decoupling-of-gdp-and-energy-growth-a-ceo-guide.
Middlemiss, L., and R. Gillard. 2015. Fuel poverty from the bottom-up: Characterising household energy vulnerability through the lived experience of the fuel poor. Energy Research & Social Science 6:146–154.
Milčiuvienė, S., J. Kiršiene, E. Doheijo, R. Urbonas, and D. Milčius. 2019. “The Role of Renewable Energy Prosumers in Implementing Energy Justice Theory.” https://doi.org/10.3390/su11195286.
Morehouse, C. 2020 “Federal Stimulus Includes Wind, Solar Tax Credit Extensions, Adds First US Offshore Wind Tax Credit.” Utility Dive. https://www.utilitydive.com/news/federal-stimulus-includes-wind-solar-tax-credit-extensions-adds-first-us/592572/#:~:text=The%20omnibus%20legislation%20will%20extend,through%20Dec.%2031%2C%202025.
Morello-Frosch, R., M. Zuk, M. Jerrett, B. Shamasunder, and A.D. Kyle. 2011. Understanding the cumulative impacts of inequalities in environmental health: Implications for policy. Health Affairs 30(5):879–887.
Morgan, M.G. 2016. Climate policy needs more than muddling. Proceedings of the National Academy of Sciences U.S.A. 113(9):2322–2324.
Morgan, M.G. 2017. Theory and Practice in Policy Analysis. Cambridge University Press.
Morgan, M.G., A. Abdulla, M.J. Ford, and M. Rath. 2018. US nuclear power: The vanishing low-carbon wedge. Proceedings of the National Academy of Sciences U.SA. 115(28):7184–7189.
Morgan Stanley Research. 2019. “Power to the People: The Shift Toward-Consumer-Driven Energy.” Morgan Stanley. October 7. https://www.morganstanley.com/ideas/consumer-generated-electricity.
Morrow, D., and H. Garz. 2015. “ESG Spotlight: Fossil Fuel Divestment—A Shareholder Perspective.” Sustainalytics. https://www.financite.be/sites/default/files/references/files/esg_spotlight_fossil_fuel_divestment.pdf.
Muro, M., A. Tomer, R. Shivaram, and J.W. Kane. 2019. “Advancing Inclusion Through Clean Energy Jobs.” Brookings Institution. https://www.brookings.edu/research/advancing-inclusion-through-clean-energy-jobs/.
NAS-NAE-NRC (National Academy of Sciences, National Academy of Engineering, National Research Council). 2010. Electricity from Renewable Resources: Status, Prospects, and Impediments. Washington, DC: National Academies Press.
NASEM (National Academies of Sciences, Engineering, and Medicine). 2016. Electricity Use in Rural and Islanded Communities: Summary of a Workshop. Washington, DC: The National Academies Press. https://doi.org/10.17226/23539.
NASEM. 2017. Enhancing the Resilience of the Nation’s Electricity System. Washington, DC: National Academies Press.
NASEM. 2019. Gaseous Carbon Waste Streams Utilization: Status and Research Needs. Washington, DC: National Academies Press. https://doi.org/10.17226/25232.
Neubauer, J., and M. Simpson. 2015. “Deployment of Behind-the-Meter Energy Storage for Demand Charge Reduction.” NREL/TP--5400-63162, 1168774. National Renewable Energy Laboratory. https://doi.org/10.2172/1168774.
NERC. 2020. “2020 State of Reliability: An Assessment of 2019 Bulk Power System Performance.” https://www.nerc.com/pa/RAPA/PA/Performance%20Analysis%20DL/NERC_SOR_2020.pdf.
NRC (National Research Council). 2010. Hidden Costs of Energy: Unpriced Consequences of Energy Production and Use. Washington, DC: National Academies Press.
NRC. 2012. Terrorism and the Electric Power Delivery System. Washington, DC: National Academies Press.
NREL (National Renewable Energy Laboratory). 2017. “Identifying Potential Markets for Behind-the-Meter Battery Energy Storage: A Survey of US Demand Charges.” White Paper. https://www.nrel.gov/docs/fy17osti/68963.pdf.
NREL. 2018. “Electrification Futures Study: Industrial Sector Analysis.” https://www.nrel.gov/docs/fy18osti/72311.pdf.
NREL. 2020. “Electric Vehicle Pricing and Payments.” https://www.nrel.gov/about/ev-charging-stations-pricing.html.
O’Halleran. 2019. “O’Halleran Introduces Legislation to Support Communities, Tribes Affected by NGS Closure.” Office Press Release. https://ohalleran.house.gov/newsroom/press-releases/ohalleran-introduces-legislation-support-zcommunities-tribes-affected-ngs.
Oppenheim, J. 2016. The United States regulatory compact and energy poverty. Energy Research and Social Science 18:96–108.
ORNL (Oak Ridge National Laboratory). 2017. Evaluation of the US Department of Energy Weatherization Innovation Pilot Program (2010–2014). ORNL/TM-2017/245.
Pahle, M., D. Burtraw, C. Flachsland, N. Kelsey, E. Biber, J. Meckling, O. Edenhofer, et al. 2018. Sequencing to ratchet up climate policy stringency. Nature Climate Change 8:861–867.
Peña, A. 2013. “Institutional Knowledge: When Employees Leave, What Do We Lose?” HigherEd Jobs. https://www.higheredjobs.com/articles/articleDisplay.cfm?ID=468.
Perl, L. 2018. “LIHEAP: Program and Funding.” Congressional Research Service. https://fas.org/sgp/crs/misc/RL31865.pdf.
Pivo, G. 2014. Unequal access to energy efficiency in US multifamily rental housing: Opportunities to improve. Building Research and Information 42(5):551–573.
Pociask, S. 2017. “Electric Vehicle Subsidies: Environmentally-Friendly or Just Welfare for the Rich?” Forbes. https://www.forbes.com/sites/stevepociask/2017/02/22/electric-vehicles-environmentally-friendly-or-just-welfare-for-the-rich/#7d30c9456c76.
PowerTechnology. 2020. “REBA Aims 60 GW of Corporate Renewables by 2025.” https://www.power-technology.com/news/reba-aims-60gw-renewables/.
Rastler, D. 2012. “Electric Energy Storage Systems for the Electric Enterprise Trends and Opportunities.” Presented at the Future of Energy Summit, Electric Power Research Institute, June 8. https://www.slideshare.net/webgoddesscathy/emerging-energy-generation-and-storage-technology-by-mark-tinkler.
Realmonte, G., L. Drouet, A. Gambhir, J. Glynn, A. Hawkes, A.C. Köberle, and M. Tavoni. 2019. An inter-model assessment of the role of direct air capture in deep mitigation pathways. Nature Communications 10(1):1–12. https://doi.org/10.1038/s41467-019-10842-5.
Reames, T.J. 2016. Targeting energy justice: Exploring spatial, racial/ethnic, and socioeconomic disparities in urban residential heating energy efficiency. Energy Policy 97:549–558.
Reed, L., G.M. Morgan, P. Vaishnav, and D.E. Armanios. 2019. Converting existing transmission corridors to HVDC is an overlooked option for increasing transmission capacity. Proceedings of the National Academy of Sciences U.S.A. 116(28):13879–13884.
Reed, L., M. Dworkin, P. Vaishnav, and G.M. Morgan. 2020. Expanding transmission capacity: Examples of regulatory paths for five alternative strategies. The Electricity Journal 33(6):106770.
Renewable Energy World. 2019. “REBA: Corporate Renewable Energy Buyers Set New Record in 2019.” https://www.renewableenergyworld.com/2019/10/29/reba-corporate-renewable-energy-buyers-set-new-record-in-2019/#gref.
Ricci, M., P. Bellaby, and R. Flynn. 2008. What do we know about public perceptions and acceptance of hydrogen? A critical review and new case study evidence. International Journal of Hydrogen Energy 33(21):5868–5880.
Rinaldi, K.S., and E. Bunnen. 2018. “Redefining Home Performance in the 21st Century.” Home Performance Coalition. http://www.homeperformance.org/sites/default/files/HPC_Smart-Home-Report_201810.pdf.
Rissman, J., C. Bataille, E. Masanet, N. Aden, W.R. Morrow III, N. Zhou, N. Elliott, et al. 2020. Technologies and policies to decarbonize global industry: Review and assessment of mitigation drivers through 2070. Applied Energy 266:114848.
Rodrik, D. and C. Sabel. 2019. “Building a Good Jobs Economy.” https://drodrik.scholar.harvard.edu/files/dani-rodrik/files/building_a_good_jobs_economy_april_2019_rev.pdf.
Rubin, E.S., J.E. Davison, and H.J. Herzog. 2015. The cost of CO2 capture and storage. International Journal of Greenhouse Gas Control 40:378–400.
Ryan, C. 2018. “New York to Provide No-Cost Community Solar for 10,000 Low-Income Residents.” PV Tech. December 6. https://www.pv-tech.org/news/new-york-to-provide-no-cost-community-solar-for-10000-low-income-residents.
SDSN (Sustainable Development Solutions Network). 2020. Zero Carbon Action Plan. New York.
Seigo, S., S. Dohle, and M. Siegrist. 2014. Public perception of carbon capture and storage (CCS): A review. Renewable and Sustainable Energy Reviews 38:848–863.
SEIA (Solar Energy Industries Association). “Let Solar Compete in California.” July. https://www.seia.org/sites/default/files/2020-05/CA-SplitRoll-Solar-Impact-Factsheet_0.pdf.
Shaw, A., A. Lustgarten, and J.W. Goldsmith. 2020. “New Climate Maps Show a Transformed United States.” ProPublica. https://projects.propublica.org/climate-migration/.
Shearer, C., D. Tong, R. Fofrich, and S.J. Davis. 2020. Committed emissions of the US power sector, 2000–2018. AGU Advances 1(3):e2020AV000162.
Shin, J., Y. Park, and D. Lee. 2018. Who will be smart home users? An analysis of adoption and diffusion of smart homes. Technological Forecasting and Social Change 134:246–253. https://doi.org/10.1016/j.techfore.2018.06.029.
Shrouf, F., and G. Miragliotta. 2015. Energy management based on Internet of Things: Practices and framework for adoption in production management. Journal of Cleaner Production 100:235–246. https://doi.org/10.1016/j.jclepro.2015.03.055.
Sierra Club. 2020. “Ready for 100.” June. https://www.sierraclub.org/ready-for-100.
Smart Electric Power Alliance. 2020. “Utilities Path to a Carbon-Free Energy System by 2050.” https://sepapower.org/utility-transformation-challenge/utility-carbon-reduction-tracker/.
Soliman, A.M., and A.M. Al-Kandari. 2010. Electrical Load Forecasting: Modeling and Model Construction. Butterworth-Heinemann. https://www.sciencedirect.com/book/9780123815439/electrical-load-forecasting.
Stavropoulos, S., and M.J. Burger. 2020. Modelling strategy and net employment effects of renewable energy and energy efficiency: A meta-regression. Energy Policy 136. https://www.sciencedirect.com/science/article/pii/S0301421519306342.
Steinberg, D., D. Bielen, J. Eichman, K. Eurek, J. Logan, T. Mai, C. McMillan, et al. 2017. Electrification and Decarbonization: Exploring US Energy Use and Greenhouse Gas Emissions in Scenarios with Widespread Electrification and Power Sector Decarbonization. Technical Report NREL/TP-6A20-68214. National Renewable Energy Laboratory. https://www.nrel.gov/docs/fy17osti/68214.pdf.
Stoll, C., L. Klaaßen, and U. Gallersdörfer. 2019. The carbon footprint of bitcoin. Joule 3(7):1647–1661. https://doi.org/10.1016/j.joule.2019.05.012.
Sylvia, T. 2019. “Power Shutoffs Cause a Battery Boom in CA.” PV Magazine. https://pv-magazine-usa.com/2019/10/31/power-shutoffs-cause-a-battery-boom-in-california/.
Talukdar, S., D. Jia, P. Hines, and B.H. Krogh. 2005. “Distributed Model Predictive Control for the Mitigation of Cascading Failures.” In Proceedings of the 44th IEEE Conference on Decision and Control. https://ieeexplore.ieee.org/abstract/document/1582861.
Teller-Elsberg, J., B. Sovacool, T. Smith, and E. Laine. 2016. Fuel poverty, excess winter deaths, and energy costs in Vermont. Energy Policy 90:81–91.
Thompson, J. 2017. “What the Navajo Generating Station Will Leave Behind.” https://www.hcn.org/issues/49.5/what-the-navajo-generating-station-will-leave-behind.
Thorpe, E.K. 2019. “A Third of UK Businesses Are Now Generating Their Own Power.” Alphr. https://www.alphr.com/energy/1010075/third-of-uk-businesses-generating-renewable-energy.
U.S. Census Bureau. 2019. “Population, Population Change, and Estimated Components of Population Change: April 1, 2010 to July 1, 2019 (NST-EST2019-Alldata).” https://www.census.gov/data/tables/time-series/demo/popest/2010s-state-total.html.
USEER. 2020. 2020 US Energy and Employment Report. Joint Report of the National Association of State Energy Officials and the Energy Futures Initiative. https://static1.squarespace.com/static/5a98cf80ec4eb7c5cd928c61/t/5ee78423c6fcc20e01b83896/1592230956175/USEER+2020+0615.pdf.
Victor, D., F.W. Geels, and S. Sharpe. 2019. “Accelerating the Low Carbon Transition.” Brookings Institute. https://www.brookings.edu/research/accelerating-the-low-carbon-transition/.
WBCSD (World Business Council for Sustainable Development). 2017. “Microgrids for Commercial and Industrial Companies.” https://docs.wbcsd.org/2017/11/WBCSD_microgrid_INTERACTIVE.pdf.
Wilcox, J. 2019. “Direct Air Capture.” Presented at the Deployment of Deep Decarbonization Technologies Workshop, National Academies of Sciences, Engineering, and Medicine, July 23.
Williams, W., and R. Whitcomb. 2008. “Cape Wind: Money, Celebrity, Energy, Class, Politics, and the Battle for Our Energy Future.” Public Affairs.
Wilson, T. 2019. “Perspectives on the Future of Electric Power in the US.” Presented at the Future of Electric Power in the United States: Committee Meeting #3, August 14, Chicago. https://www.nationalacademies.org/event/08-14-2019/the-future-of-electric-power-in-the-united-states-committee-meeting-3.
Wolters, A., B.S. Steel, and R.L. Warner. 2020. Ideology and value determinants of public support for energy policies in the US: A focus on western states. Energies 13(8):1890.
World Bank. 2018. “Blockchain and Distributed Ledger Technology (DLT).” April 12. https://www.worldbank.org/en/topic/financialsector/brief/blockchain-dlt.
World Bank. 2020. “State and Trends of Carbon Pricing 2020.” https://openknowledge.worldbank.org/bitstream/handle/10986/33809/9781464815867.pdf?sequence=4&isAllowed=y.
WTO (World Trade Organization). 2020. “Trade Set to Plunge as COVID-19 Pandemic Upends Global Economy.” https://www.wto.org/english/news_e/pres20_e/pr855_e.htm.
Wu, G., E. Leslie, D. Allen, O. Sawyerr, D.R. Cameron, E. Brand, B. Cohen, et al. 2019. Power of Place Land Conservation and Clean Energy Pathways for California. https://www.scienceforconservation.org/assets/downloads/Technical_Report_Power_of_Place.pdf.
Xu, G., V. Vittal, A. Meklin, and J.E. Thalman. 2011. Controlled islanding demonstrations on the WECC system. IEEE Transactions on Power Systems 26(1):334–343.
Yanez, M., L. Veazey, R. Evans, and N. Shepherd. 2019. “Equitable Beneficial Electrification (EBE) for Rural Electric Cooperatives: Electrifying Residential Space and Water Heating.” Environmental and Energy Study Institute.
Yang, Z., N. Li, B. Becerik-Gerber, and M. Orosz. 2012. “A Multi-Sensor Based Occupancy Estimation Model for Supporting Demand Driven HVAC Operations.” In Proceedings of the 2012 Symposium on Simulation for Architecture and Urban Design, 1–8. SimAUD ’12. Orlando, FL: Society for Computer Simulation International.
Yergin, D. 2020. The New Map: Energy, Climate and the Clash of Nations. New York: Penguin Press.
Zinaman, O., T. Bowen, and A. Aznar. 2020. An Overview of Behind-the-Meter Solar-Plus-Storage Regulatory Design: Approaches and Case Studies to Inform International Applications. National Renewable Energy Laboratory. https://www.osti.gov/servlets/purl/1606152.
ANNEX 2.A: THE DIVERSE INTERESTS OF ELECTRICITY CONSUMERS
Planning of generation and delivery assets has traditionally relied on little more than population and economic growth, with little consumer differentiation beyond grouping customers as residential, commercial, and industrial (Soliman and Al-Kandari, 2010). This “one size fits all” approach for estimating demand is changing as certain customers start to generate their own power, manage their electricity use patterns, or express preferences in other ways. The electricity consumer base is not homogeneous; some consumers have the desire and resources to invest in energy efficiency retrofits, energy management technologies, and self-generation and resilience; others do not. Additionally, electricity consumers in different parts of the United States are faced with dramatically different geographies, resources, risks, demands, and rate structures that impact the adoption of technologies. Even so, many consumers have little time or interest to think about electricity service: they simply expect electric power to be safe, affordable, and available when they flip the switch.
Small Electricity Users
“Residential electricity consumers” are actually a quite diverse group: they live in regions with different climates and in urban, suburban, and rural environments, which in turn affects the size of their homes and the ways they use electricity. They vary by education, income, homeownership, and other socioeconomic factors. Other small electricity users—such as small office buildings, retail shops, municipal buildings, and restaurants—represent a highly heterogeneous group. What residential and small business consumers expect from their utility service is changing as the availability of new consumer-facing technologies and new generation resources increase to meet various decarbonization goals.
Many utilities have plans and programs that help residential customers take advantage of clean energy offerings through varying rate structures, energy efficiency incentives, and other incentives to adopt on-site generation. Across many states, for example, “net energy metering” (NEM) ratemaking policy has been a common approach to encourage the adoption of on-site solar. Under NEM, all on-site output is a credit to the kWh consumed by the household: any excess power produced by a rooftop solar installation will be sold to the local utility at the full retail rate.
In some regions, the prevalence of residential solar programs is changing customers’ relationships with utilities as many are becoming “prosumers”—customers that produce some or all of their electricity (Milčiuvienė, 2019). Growing numbers of residential customers are installing smart devices, such as smart thermostats, lighting apps, and other smart-home phone applications, that control energy use (Girod et al., 2017; Shin et al., 2018) and global leading companies are launching smart home services/products based on the IoT. However, the spread of smart homes has been slower than expected, and analysis of smart homes from a demand perspective is required. This study suggests implications for promoting the smart home market by analyzing factors affecting adoption and diffusion of smart homes. A technology acceptance model was used to describe the adoption of smart homes, and a multivariate probit model was used to describe the diffusion of smart homes. The characteristics of smart homes such as network effects between services/products and the importance of personal information protection were considered in addition to demographic variables. The results of this study show that compatibility, perceived ease of use, and perceived usefulness have significant positive effects on purchase intention. In terms of purchase timing, unlike other information and communication technology (ICT), according to the Smart Energy Consumer Collaborative’s 2020 State of the Consumer report, participation in smart-energy programs increases with perceived convenience: when utilities create user-friendly technological interfaces and help customers understand the financial benefits they will receive, adoption of smart technology increases (Rinaldi and Bunnen, 2018; SECC, 2020). Better estimates of exactly how new technologies or new pricing regimes affect consumer behavior are needed (Burlig et al., 2019).
The 2020 State of the Consumer report concluded that the majority of consumers who use smart appliances prefer time-of-use (TOU) plans over traditional flat cent/kWh rates (SECC, 2020). This is in contrast with the findings of the Residential Consumers and the Electric Utility of the Future (2016), prepared for the American Public Power Association and representing the views of residential ratepayer advocates, which focused on the
need to maintain the affordability of essential electric service and cautioned against the adoption of rate designs that might have regressive impacts on low-income residential customers. Ratemaking policy and rate designs that recover the costs of fixed infrastructure through usage-based rates, when combined with NEM, lead to a system in which wealthy customers with DER installations buy less power from the utility and in which other customers must pay more to cover the costs of distribution systems.
Large Electricity Users
Large factories, corporate office buildings and campuses, universities, and others use significant amounts of power around the clock. By virtue of their large electricity demand, it is not uncommon for such big users of electricity to have a strong voice in influencing electricity policy, whether in terms of being offered special economic development rates, pushing for greater choice of power supply, advocating for the ability to install on-site power systems, or by demanding particular levels of power quality. Large industrial energy users have played key roles historically in gaining access to such outcomes.
Such trends have long been important in the context of a large electricity customer’s demands on the provision of service by the local utility. More broadly, large corporate electricity users with a presence in many states have begun to take a more active role in demanding new electricity services and clean-energy offerings. Many large corporations, including Fortune 500 companies with buildings and facilities located around the United States, are signing up for “green power.”1 The Renewable Energy Buyers Alliance (REBA), a group of businesses that advance access to renewable energy in states where these customers do not otherwise have the option to buy power from a competitive retail supplier, projects that commercial and industrial customers will procure 60 GW of renewable energy by 2025 (PowerTechnology, 2020). In 2019, the Edison Electric Institute reported on the wide variety of renewable programs regulated utilities have created in response to nonresidential customers across the country; these programs include subscription tariffs as well as custom deals to provide capital for the investments the utilities need to increase their renewable portfolio (EEI Customer Solutions, 2019).
Electricity supply will also be shaped by the increasing appetite of large and small institutional investors and portfolio managers for investments featuring environmental, social, and governance (ESG) attributes. ESG is becoming a large consideration for companies and investors in terms of financial performance, business needs, and sustainability criteria. ESG investing gives preference to companies that take care of their employees, provide products and services that are safe for consumers and the environment, and promote sustainability and transparent business practices. Companies that value these efforts are seen as reducing future risk. The utilities sector in particular has been identified as an ESG investment opportunity with high potential business and sustainability impacts (Morrow and Garz, 2015). The extent to which electricity system transformation capitalizes on increased investor interest remains to be seen, although the increasing focus on ESG presents a potentially valuable financing opportunity.
Communities and Municipalities
Many states and communities are demanding that the local utility adopt more aggressive GHG emissions reduction targets (Figure 2.A.1). More than 150 cities have pledged that 100 percent of their electric energy comes from renewables (Sierra Club, 2020), with varying target dates from 2025–2050 (Figure 2.A.2). Other communities are working to decarbonize their energy systems through coalitions like the Local Governments for Sustainability effort (ICLEI, 2020). Many states’ and localities’ GHG emissions-reduction targets overlap with company-wide GHG emission targets adopted by local utilities. A large portion of the electricity system is subject to either state-adopted emissions-reductions targets or utility commitments to do the same.
Municipal utilities and cooperatives are allowing their members to directly invest in the development of renewable resources, with some of these resources targeted to low-income customers (Gallucci, 2019; Ryan, 2018). Some communities are reshaping the types of electricity services available in their communities through policies known as community choice aggregation (CCA) or municipal aggregation. CCA programs enable communities to
___________________
1 For example, see the EPA Green Power Partnership, National Top 100 and Fortune 500 Partners (EPA, 2020a,b).
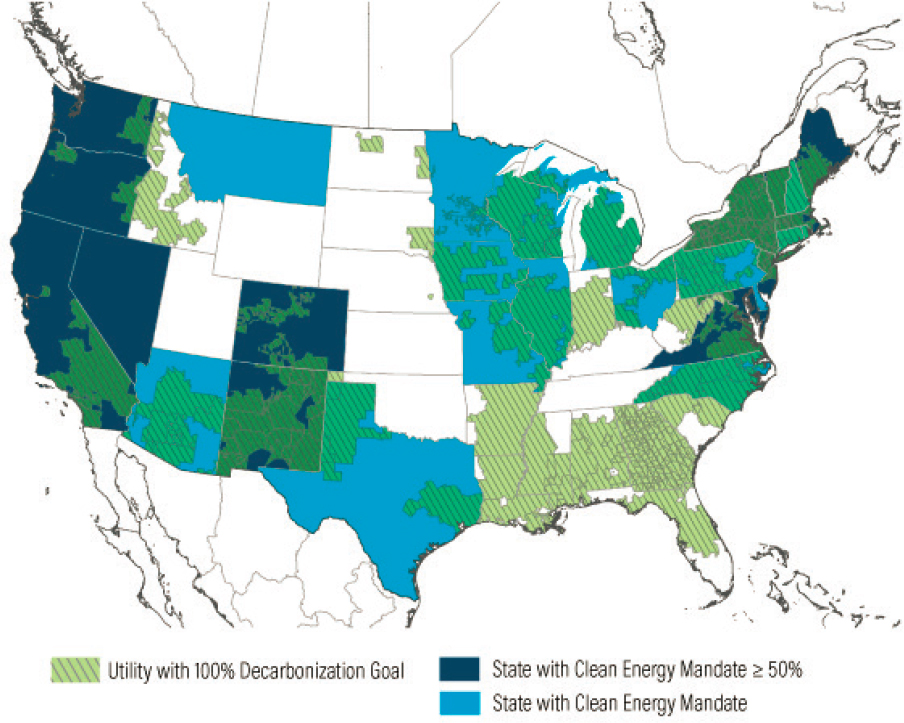
procure power from alternative suppliers in order to obtain an energy supply portfolio consistent with community goals, all while still receiving electric-delivery service from the local utility. The concept of CCA was enabled through legislation in several states starting in the late 1990s through 2014, including in California, Illinois, Ohio, Massachusetts, New Jersey, New York, and Rhode Island.
A community microgrid is a localized area typically served by and interconnected to a single distribution system, and that takes advantage of high penetrations of renewables, DER, energy storage, and demand response. This is in contrast to CCA efforts and cooperatives that buy utility-scale renewables. It is also in contrast to a traditional microgrid, which may cover only a single location (e.g., a corporate or university campus plus closely adjacent buildings). A microgrid that can provide up to 25 percent of a community’s electricity lowers the need for investments in new transmission and distribution infrastructure, and potentially has resiliency benefits. This new approach to electric grid design provides renewable coverage to entire neighborhoods and communities, and can lower the cost of DER and help deploy such solutions more broadly. For example, the Clean Coalition champions the creation of community microgrids across the country. One of their recent efforts includes the Goleta Load Pocket Community Microgrid in Southern California, which is a renewables-driven community in a disaster-prone and transmission-vulnerable area, serving as a test for the resiliency aspects of microgrids (Clean Coalition, 2019a,b).
Tables 2.A.1 to 2.A.3 provide technology and policy examples that might shape elements of the future grid.
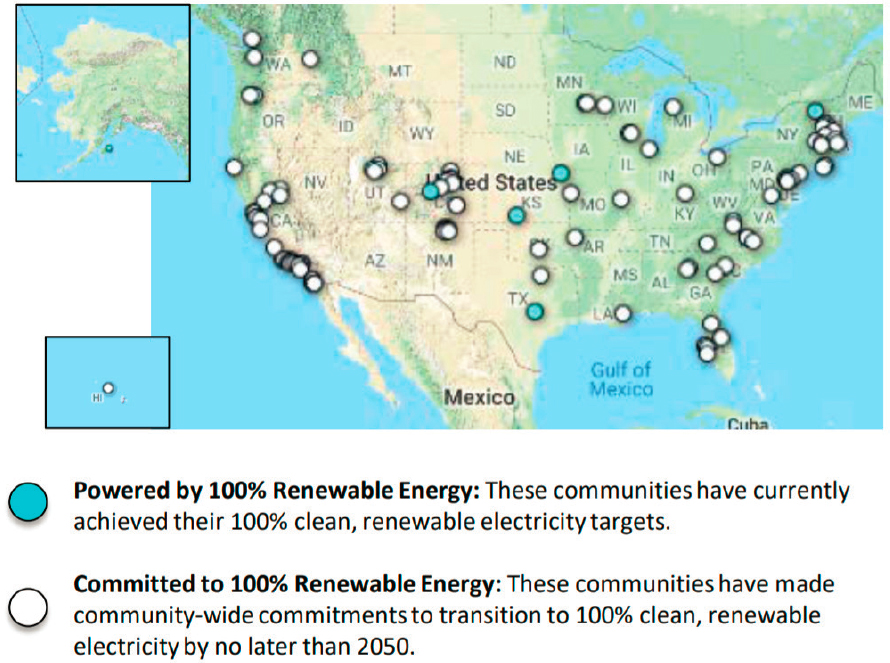
TABLE 2.A.1 Examples of Policy, Technology, Environmental, and Other Changes That, if They Were to Occur, Might Shape the Future of Bulk Power Generation in the United States over the Next Several Decades
Fossil Generation
|
|
Natural Gas Supply and Interstate Pipelines
|
Nuclear
|
Renewables and Storage
|
Climate Impacts on the Generation System
|
TABLE 2.A.2 Examples of Policy, Technology, Environmental, and Other Changes That, if They Occur, Might Shape the Future of High-Voltage Electric Power Transmission in the United States over the Next Several Decades
|
TABLE 2.A.3 Examples of Policy, Technology, Environmental, and Other Changes That, if They Occur, Might Shape the Future of Electric Power Distribution Systems and End Use on Both the Power Company and the Customers’ Sides of the Meter
|


