
6
A Framework for Developing Explanations of Working-Age Mortality Trends
Part I of this report describes the trends in mortality in the United States over the past few decades. This chapter provides a framework developed by the committee to guide its development of potential explanations regarding the drivers of these trends. The term “drivers” refers to causes in the broadest sense, encompassing both upstream or distal and more proximal causes—factors at different stages in the chain of causation. Also considered are how factors at various levels may interact. For example, low socioeconomic status may place individuals at higher risk of drug use, but use may occur only in the context of greater access to prescription opioids. In this case, the more proximate low socioeconomic status can be thought of as comprising “vulnerability” factors and the more distal contextual drug availability as comprising “precipitating” factors.
This chapter begins by describing the conceptual framework used by the committee to frame its broad discussion of the drivers of mortality trends. It then reviews the considerations used by the committee in developing potential explanations for the observed trends.
A CONCEPTUAL FRAMEWORK FOR U.S. WORKING-AGE MORTALITY
Figure 6-1 depicts the committee’s framework for the general set of factors that may have contributed to high and rising mortality among U.S working-age adults. The factors involved are shown to operate at three different levels: macro or societal, meso or community (including family), and individual (Braveman, Egerter, and Williams, 2011; Hertzman and Boyce,
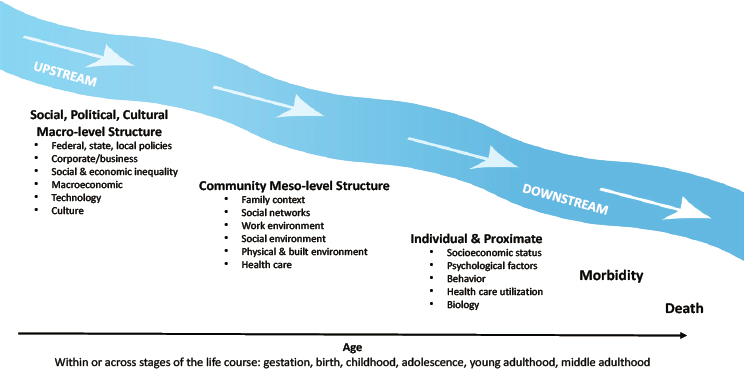
2010). As noted above, these factors can also be categorized as distal (factors that affect health through long causal chains and many intermediary factors) or more proximal (factors that impact health more directly). Age represents the time dimension across which the multilevel factors operate, which can span the entire life course, from conception to death, or the set of ages within specific life stages—gestation, birth, childhood, adolescence, young and middle adulthood—that shape working-age mortality. In addition, although not explicitly shown in the figure, factors can interact or act synergistically such that the presence of two or more factors is necessary for morbidity and mortality outcomes to occur. In such cases, one factor, such as low socioeconomic status, may make individuals vulnerable to the presence of another, such as increased drug availability.
The most distal factors are referred to as “upstream” drivers, which generally fall within the category of “social, political, and cultural macro-level structure.” Intermediate factors, those that are influenced by the macrostructural factors and represent the community-level contexts in which individuals live their daily lives, fall within the category of “meso-level structure” in the figure. Upstream and intermediate factors are considered structural by virtue of their higher order or aggregate level of measurement and analysis (e.g., social and economic inequality, institutional or governmental policies, neighborhood, social networks). The more proximal factors (through which the macro- and meso-level structural factors exert health effects on individuals) include individual-level psychosocial and behavioral characteristics, as well as the biological consequences of
behaviors or environmental exposures. These “downstream” consequences of the more distal macro- or meso-level factors are important to fully understand the causality involved in working-age morbidity and mortality risk, but are not necessarily the main drivers that have changed in society to bring about the increase in working-age mortality during the 1990–2017 study period documented in Part I of this report.
While the committee uses the theoretical language of causality in describing this multilevel conceptual model, the framework is not necessarily deterministic. Rather, it organizes the “causes” of working-age mortality in a multilevel order of their proximal distance from the event of death. Death occurs at an individual level, and the proximate cause (e.g., drug overdose, cardiac failure) is identified at the individual level, but this proximate cause is often the result of higher-order upstream macrostructural and environmental influences (e.g., decisions by the pharmaceutical industry, the obesogenic environment, health care access). Focusing greater attention on the upstream drivers of mortality enables policy makers to intervene on these factors, alter their influences on health outcomes, and reduce mortality risks and disparities.
In addition, not all causal processes flow downstream from the macrostructural to the individual level in one direction or in this order. Causal factors can be introduced at any point in the process and create feedback loops, and the causal direction may flow upstream temporarily. For example, the changing composition of families in a particular community or state (e.g., a higher percentage of low-income or single-parent families) may shift social policies in that location to be more supportive of those families (e.g., Medicaid expansion, higher minimum wage). In addition, exogenous factors can intrude at any point. For example, the effect of natural disasters (e.g., hurricanes, floods, pandemics) can adversely impact meso-level environmental conditions and, in turn, individual risks of mortality. A disaster may then have lagged effects that alter upstream social inequality and policies (e.g., insurance disparities, government assistance) in the disaster locations, and changes in these factors can flow downstream to influence individual-level risks of morbidity and mortality.
While structural features of the environment are correlated with individual mortality risks, these structural features are often the result of individual characteristics and actions.
For example, high-income individuals can afford to live in neighborhoods with green space for physical activity, healthy food choices, health care resources, and high-quality schools for children. Similarly, individuals may choose to live in certain states based on family networks, occupational opportunities, or quality-of-life issues. Adults of lower socioeconomic status tend to have less choice in where they live and work, and these characteristics, which are correlated with state-level policies (e.g., Medicaid
expansion, taxes) and state-level characteristics (e.g., proportion of the population that is poor, pollution), may also determine health outcomes.
Macro-Level Upstream Factors in Working-Age Mortality
Increasing awareness of the importance of upstream factors in health and mortality grew out of a research emphasis on the social determinants of health, conceptualized as the conditions under which people are born, grow, live, work, and age (World Health Organization [WHO], 2008). Social determinants of health represent nonmedical factors influencing health and the risk of death, including upstream social structural influences on health and health systems; government policies; and the social, economic, political, cultural, and environmental factors that determine health, often through downstream health-related knowledge, attitudes, beliefs, and behaviors (Braveman, Egerter, and Williams, 2011). Upstream structural factors affect lifestyle choices and behaviors and are shaped by public policies, which in turn are modifiable and subject to change. Thus, research evidence on this set of factors provides important opportunities for reducing mortality risks and disparities by intervening to change these factors that harm health through downstream mechanisms.
Federal, State, and Local Policies
The most upstream drivers include features of the social, political, and economic structure. These factors (and their health consequences) can, to a certain extent, be affected by public policies, including those at the federal, state, and local levels (Institute of Medicine and National Research Council [IOM and NRC], 2013). For example, federal policies determine spending on safety net programs, environmental regulations for clean air and water, housing, gun safety, taxes, and health care. Similar policies are implemented by state governments (e.g., welfare eligibility and benefits, Earned Income Tax Credit, cigarette taxes, Medicaid expansion for health care via the Affordable Care Act, transportation services, family planning). Local political and administrative units (e.g., school districts, counties, cities) are governed by federal and state policies but also have autonomy to establish their own policies that influence community resources and mortality risks through spending on education; health care services; mental health and substance use programs; local health-related infrastructure, such as parks and sidewalks; and more. Together, these federal, state, and local policies are thought to drive subgroup and geographic differences in social and economic inequality, environmental conditions affecting health, and health care access (Hummer and Hamilton, 2019; Montez, Hayward, and Wolf, 2017).
Corporate/Business Organizations
A second set of macro-level factors involves corporate/business organizations, such as pharmaceutical and drug manufacturing companies, the insurance business, the tobacco industry, and the food and beverage industries. Business interests may align with public health priorities (Adams, 2019) but may also run counter to family and individual health interests. Examples include beverage companies’ investments in and marketing of sugary and alcoholic drinks, food companies’ investments in and marketing of unhealthy foods, and pharmaceutical companies’ production and marketing of pain medications. Corporate goals tend to be focused primarily on increasing profit margins and satisfying shareholders, motivating heavy promotion of their products. Some companies—such as those that cater to a growing market for health-oriented products and services or invest in strategies to promote the health and safety of their employees and the communities in which they live—find a business case that aligns with public health. Other companies that profit from unhealthy or unsafe products (e.g., tobacco companies, opioid manufacturers) have strong incentives to minimize or even intentionally hide adverse health effects associated with their products.
Social and Economic Inequality
Social and economic inequality limit the degree of economic opportunity and social mobility that exists in national, state, and local contexts. Much attention has been given to the high levels and continued growth of income and wealth inequality in the United States compared with other industrialized nations (Piketty and Saez, 2014). As a smaller and smaller proportion of the population (e.g., “the 1 percent”) owns the vast majority of America’s wealth, economic opportunities become cemented into the social hierarchy, constraining intergenerational mobility for most. Social inequality further defines differential access to opportunities and resources that promote longevity and prevent premature mortality according to such attributes as gender, race and ethnicity, nativity, LGBTQ status, and educational attainment, and those disparities are exacerbated as this structurally based inequality widens (Hayward, Hummer, and Sasson, 2015; Phelan and Link, 2015; Phelan, Link, and Tehranifar, 2010).
Macroeconomic Trends
Macroeconomic trends are another set of upstream structural influences on health involving broad aggregate shifts in the economy that can have population-wide effects, positive or negative. For example, the decline
of manufacturing jobs and growth of the service sector beginning in the 1970s altered the demand for a specific set of worker training and skills and caused the collapse of major industries that provided employment security. The economic and social impact of this trend, which unfolded over decades, had potentially long-term negative effects on the health, health behaviors, and longevity of workers, especially those with less education, and on their communities’ ability to provide health-promoting services and resources. The economic downturn during the 2008 Great Recession affected population subgroups differentially according to age, gender, race and ethnicity, and socioeconomic status, with short- and long-term implications for health.
Technology Developments
Another set of macro-level factors comprises technology developments, which can impact mortality trends in multiple ways. Most obvious are innovations in drug development and drug potency, advanced screening for disease risks, and innovative treatments for disease. Technology, furthermore, affects individuals’ work, lifestyle, and behavior. For example, machines have replaced humans in certain jobs, computers and smartphones have replaced some forms of human interaction and increased sedentary work environments, and access to the Internet has now reached most of the population. Many of these technological developments result in important cultural shifts that have implications for work, health behaviors, and health. The growth of the Internet and social media, in particular, has resulted in profound cultural changes affecting the way people communicate, learn, share information, and seek help, accelerating cultural change on a global scale.
Cultural Factors
Changing cultural factors can also be important for health and mortality risk. They can include, for example, changes in the importance of religious institutions and societal norms regarding family formation (e.g., marriage, cohabitation, divorce, nonmarital childbearing). For example, changes in the societal-wide importance of religion (i.e., secularization) could be associated with changing health and mortality patterns, given the health protection that religious belonging affords (Ellison and Hummer, 2010). Some cultural factors, including racism, sexism, xenophobia, and homophobia, can be especially influential for health and health disparities. For example, discrimination on the basis of social characteristics harms health and longevity through differential access to socioeconomic resources and through chronic stress processes, both of which are especially salient
in the meso-level structures that individuals experience on a daily basis (Williams, Lawrence, and Davis, 2019).
Meso-Level Factors
Meso-level factors encompass the local contexts in which people live their daily lives—in families, with friends and other social networks, at work, in the neighborhood, and through experiences with the health care system.
Family Context
The family is one of the most important meso-level contexts relevant to health, impacting behaviors, stressors, and health care access. Family characteristics are in turn affected by the upstream factors discussed above, including policies, culture, inequality, and macroeconomic trends. For example, societal increases in educational and labor market opportunities for women led to dramatic increases in and cultural acceptance of women, even mothers of young children, working outside the home. Through work, an increasing number of women gained economic independence, eroding the traditional exchange system on which marriage was based—that the man was the breadwinner and the woman a homemaker. At the same time, macroeconomic shifts related to the decline of manufacturing jobs reduced marriage rates as men’s economic position faltered, especially among those with less education. Structural changes, furthermore, led to cultural shifts in the acceptance of divorce, cohabitation, single-mother families, and nonmartial childbearing, profoundly altering the family contexts in which children are born and raised in America. These synergistic structural and cultural shifts may affect health and mortality risk in multiple ways. For example, women’s greater independence, higher status, and higher incomes could lead to improved health and lower mortality risk, especially for those with high educational attainment and higher-paying, professional jobs. On the other hand, low-income women who are single parents may be especially vulnerable to poor health and mortality risk, particularly in a period like the Great Recession or the COVID-19 pandemic, given the greater stresses of being in a low-socioeconomic structural position in the context of a weakened social safety net (e.g., limited unemployment benefits and dwindling food, housing, and health care benefits) (Montez et al., 2015).
Social Networks
Social networks are another important meso-level factor undergoing change that may be associated with increases in working-age mortality.
There is a large literature on the importance of social connections for health and longevity. Social ties, embeddedness in social networks, and engagement in social life help lower mortality risks, whereas social isolation and a lack of social connections are harmful to health (e.g., Berkman et al., 2000; Cacioppo and Hawkley, 2003; Cohen and Janicki-Deverts, 2009; Holt-Lundstad et al., 2015; House, Landis, and Umberson, 1988; Yang et al., 2016). Social networks may include immediate- and extended-family relations, friends, neighbors, workmates, and coworkers, as well as engagement in local institutions, including religious, political, sports, or civic organizations. Research indicates that social networks benefit health when social ties provide social support, knowledge, and coping skills to deal with daily stresses, but can harm health when those ties cause strain or added stress. Thus, both the quantity and quality of social networks matter in relation to premature mortality risks. Social network connections may also provide valued social capital resources, such as information about training or job opportunities, community health care access, and other local resources. To the extent that engagement in social networks reinforces common goals and interests and promotes positive and supportive social interaction, feelings of social cohesion and social integration are protective from mortality risks.
Work Environment
The work environment is another important meso-level structure that is influenced by upstream economic, social, and cultural macrostructural factors and is associated with working-age mortality (Johnson, Sorlie, and Backlund, 1999). Some work environments pose risks to workers because of physical conditions that include inadequate ventilation, heights, demanding physical labor, access to harmful drugs, or hazardous chemical exposures. Other work environments pose risks to workers through lack of autonomy or control, thus increasing stress, boredom, and frustration. Employers also influence workers’ access to health care services and employer-based health insurance.
Neighborhood Environment
The neighborhoods and communities in which individuals live and the resources they provide can promote health and reduce risks of premature mortality. When the neighborhood context includes high-quality schools, transportation services, access to medical care, and employment resources, mortality risks may be reduced. Similarly, neighborhoods characterized by social cohesion, social organization (e.g., environmental volunteer groups, parent–teacher organizations, local sporting or cultural clubs), low poverty rates, housing stability, and low unemployment are likely to benefit health
and reduce mortality. The same is true for health-promoting physical and built environments. The physical characteristics of neighborhoods and communities that influence health and mortality risks include air and water quality; proximity to facilities that produce or store hazardous substances; exposures to lead paint, chemicals, mold, dust, or household pest infestation; access to nutritious foods; and safe and convenient places to exercise, such as sidewalks, running trails, and parks and recreation centers.
Health Care
Availability of and access to health care within the community in which people live or work is vital to health promotion; disease prevention; and the treatment of medical conditions, mental health, and injuries—each of which can prevent premature death. Thus, access to care (the number and proximity of providers and health care facilities, and insurance coverage) and the quality of care are key environmental factors that may mediate upstream influences on downstream health behaviors and outcomes. Unlike other industrialized countries, the United States lacks universal access to health care; has fewer physicians, hospitals, and acute care beds per capita relative to comparable countries; has a larger percentage of the population that must defer or delay care because of costs; and relies on a fragmented care delivery system characterized by large disparities in quality of care (Schneider et al., 2017). Such heterogeneity in health care access and quality was on full display during the COVID-19 pandemic. The closing of medical facilities within rural areas has been a long-standing issue, not only for the lack of access to care but also because these facilities are often one of the largest employers within the region (Lindrooth et al., 2018). State variation in Medicaid expansion through the Affordable Care Act is another example of the geographic variation in health care access, especially among the low-income population across the United States.
Individual-Level Factors
Many characteristics of individuals are relevant to health and working-age mortality. Some (e.g., education and income) are the individual-level manifestations of the social and economic structures discussed above; others reflect the downstream consequences of those more distal factors. These more proximal individual-level factors include socioeconomic status, psychological characteristics, behavior, health care utilization, and biology (one’s biological and genetic makeup).
The socioeconomic gradient in health and mortality has been widely documented across birth cohorts, time, and place, with consistent evidence of widening educational disparities, in particular, since the 1970s
(Case and Deaton, 2017; Hummer and Hernandez, 2013; Preston and Elo, 1995; Wolfe, Evans, and Seeman, 2012). Like neighborhood or work contexts, individual-level socioeconomic factors affect health and mortality risk through a number of more proximal individual-level processes related to stress, behaviors, and health care access and use. Extensive research has also focused on the role of behavior in mortality trends in general and in the recent rise in mortality among working-age adults in particular. Health behaviors, including tobacco use, alcohol and drug use, violence, exercise, and diet, have a direct relation to deaths from multiple causes, including drug poisoning, alcohol use, suicide, cancer, and cardiometabolic diseases. Psychological factors, such as self-esteem, confidence, conscientiousness, mastery, sense of control, depression, and anxiety, have also been linked to a number of health outcomes, including those responsible for high and increasing working-age mortality. Insured individuals are more likely than those without health insurance to have regular access to and use of health care services.
Biological factors are most proximate to the cause of death, for they define the pathophysiologic processes that cause disease and produce fatal complications. Changes in biological processes reveal how what happens outside the body (e.g., such macrostructural forces as inequality, work environments, and economic recession; exposure to environmental threats, such as pollution or lead; social relationship stresses, such as social isolation or interpersonal violence; health behaviors, such as substance use or consumption of sugary beverages and fatty foods) affects what happens inside the body (e.g., tissue damage; dysregulation of stress response systems; and pathological changes to metabolic, endocrine, neurological, cardiovascular, immune, and other body systems), leading to acute fatalities (e.g., drug overdose, suicide) or chronic illnesses (e.g., diabetes, hypertension) that can cause death (Harris and McDade, 2018).
The ascribed demographic attributes of sex, race, and ethnicity are not explicitly shown in Figure 6-1 as individual-level characteristics. As demonstrated by the committee’s analysis in Part I of this report, these attributes define fundamental historical and contemporary disparities in mortality. Explanations for these disparities therefore involve the multilevel processes elaborated by the committee’s conceptual framework that are unique to each subgroup defined by sex, race, and ethnicity and their combinations.
The Role of Life-Course Stage
The macro-, meso-, and individual-level factors discussed above can operate at various stages across the life course, beginning in gestation (or even the preconception period for mothers) and continuing at birth and during childhood, adolescence, and early adulthood with the potential to
shape health and mortality outcomes among working-age adults at every stage (Ben-Shlomo and Kuh, 2002; Hertzman and Boyce, 2010; Kuh and Ben-Shlomo, 2004). Key stages in individuals’ lives can have particular relevance for working-age mortality. For example, research increasingly documents the importance of early life, including gestation and birth, for the emergence of chronic diseases in later life (Almond and Currie, 2011; Barker, 2004; Gluckman et al., 2008). This body of research points to exogenous shocks experienced early in life (e.g., exposure to an influenza pandemic or nutritional deficits) as having latent, long-lasting effects on health and development that heighten the risk of premature mortality. Other factors operating in childhood, such as early adverse life experiences or low socioeconomic status, can affect mental and physical health later in adulthood (Felitti et al., 1998). Behaviors established in childhood and adolescence (e.g.,smoking, diet, or physical activity) can track into adulthood, with long-term consequences for health (Harris, 2010; Harris et al., 2006). Long-term exposures operating over the life course (e.g., a lifetime history of being overweight or obese) also can affect chronic disease risk later in life.
In addition, causal pathways involving upstream and downstream factors can operate across a range of ages within specific life stages to affect morbidity and mortality in that life stage. For example, the upstream decision by pharmaceutical companies to flood the market with opioids was a macrostructural effect that operated through specific community contexts (areas of manufacturing and mining job losses) and affected individuals with certain socioeconomic and psychological characteristics (e.g., those experiencing long-term unemployment or physical or emotional pain), leading to drug overdose deaths. All of these multilevel processes can operate within the life stage of young or middle adulthood to affect an individual’s risk of dying from drug poisoning.
CONSIDERATIONS IN DEVELOPING EXPLANATIONS FOR TRENDS IN WORKING-AGE MORTALITY
In developing possible explanations regarding the causes of changes in working-age mortality over time, the committee employed a set of considerations to help prioritize those explanations most aligned with the observed trends and also, importantly, to rule out explanations that were clearly incompatible with those trends. These considerations also highlight the types of additional data and future research that may be useful in supporting or refuting competing explanations. Of course, rigorous testing of the explanations developed on the basis of these considerations may require data that are very different from those routinely available in nationally
representative mortality studies but are necessary to draw robust causal inferences.
Single Versus Multiple Explanations
An important consideration is whether the observed mortality trends over the 1990–2017 study period (which, as described in Part I of this report, can be multifaceted) reflect a common causal process that manifested in different causes of death and across different population groups, or whether multiple causal processes happened to be operating simultaneously or in tandem to generate the observed trends. For example, one could hypothesize that decreases in stable, well-paid employment opportunities led to increased stress and related mental health consequences, with implications for drug use and overdose deaths, suicide, and the heavy alcohol consumption associated with alcohol-related deaths. Thus, a common causal process could underlie trends observed with all three of these causes of death, which, as discussed in Chapter 3, have been increasing in recent decades and for a wide range of population groups and geographic areas.
Alternatively, the drivers of increases in drug poisoning deaths, suicides, and alcohol-related deaths could be distinct, although perhaps somewhat correlated in terms of the timeframe during which they unfolded. For example, increases in drug poisoning deaths may be attributable primarily to drug supply issues, corresponding with Food and Drug Administration approval of Purdue Pharma’s OxyContin® and other opioids in the mid-1990s. Increases in suicide mortality may reflect trends in depression related to economic or social trends that occurred during roughly the same period. And increasing heavy alcohol use that causes increases in alcohol-related deaths could be responsive to changing social norms regarding access to and accessibility of alcohol over the past few decades.
Although parsimony is desirable in developing potential explanations, it was important to keep in mind as the data were examined that in cases of multiple mortality trends in different subgroups, a range of correlated factors could be operating simultaneously. The data at hand may not allow full identification of the underlying processes, and it is also possible that a common process coexists with multiple additional causal processes.
Interactions or Synergies and Dynamic Relations Among Factors
In developing explanations for trends in working-age mortality, it was also important to keep in mind that various types of factors may interact or act synergistically. For example, economic disadvantage (and the psychological distress it induces) may place individuals at greater risk of drug use and addiction. But the psychological distress they experience may culminate in
drug use and addiction only in the context of easy access to drugs, amplified by the marketing efforts of pharmaceutical companies. Thus, the economic disadvantage resulting from macrostructural factors can be viewed as a vulnerability, whereas the easy access to drugs can be viewed as a trigger or precipitating factor. Both the vulnerability (economic disadvantage) and the precipitating factor (easy drug access) may be necessary for drug poisoning deaths to increase. Note that the concept of vulnerability and precipitating factors is distinct from the concept of distal and proximal factors. The distinction between distal and proximal factors emphasizes their distance from the event of death and their location in chains of causation: A leading to B leading to C. In contrast, the distinction between vulnerability and precipitating factors refers to how different factors interact: A and B together are necessary for C to occur (but A does not necessarily lead to B).
Many schematic conceptual models of population health focus primarily on long causal chains and linear relations, but fewer emphasize interactions or synergies and dynamic relations among factors. Dynamic relations encompass feedbacks and dependencies. For example, drug use may be facilitated by drug availability, and drug availability may be reinforced by increased demand, creating a reinforcing cycle (feedback). In addition, the behaviors of individuals may affect the behaviors of others in their social networks through social norms or contagion-like processes (dependencies). These types of relations characterize the complex systems that may give rise to observed mortality trends, so understanding their key features may be important to developing comprehensive explanations for those trends.
This chapter has introduced the concept of vulnerability, which may be relevant in explanations for rising working-age mortality and disparities therein. In the context of this report, vulnerability refers to physical, economic, social, or environmental factors that place an individual at heightened risk of morbidity and mortality. Such factors can operate at multiple levels. For example, individual-level characteristics (e.g., socioeconomic disadvantage, membership in a racial minority) can make one more vulnerable to working-age mortality by limiting access to social, economic, and health care resources. A particular environment (e.g., residential segregation, single-mother family) may create vulnerability through limited access to high-quality schools or green space for physical activity. Macro-level policies may create vulnerabilities for some population groups or geographic areas through regulations on the prescribing of pain medication or placement of toxic waste sites. Vulnerabilities also can make one more susceptible to working-age morbidity and mortality in particular contexts. For example, those with comorbidities (e.g., cancer, arthritis, injuries) are at greater risk of experiencing pain, which makes them more susceptible to easy access to and widespread availability of opioids, and in turn to death from drug overdose. Similarly, those with chronic diseases are
more susceptible to COVID-19 infection and death. Vulnerability is also created when macro- and meso-level contexts (e.g., regulations regarding clean air and water, obesogenic factors such as the proximity and quantity of fast food restaurants and alcohol outlets) or individual behaviors (e.g., substance use, diet) present threats to health and longevity.
Socioeconomic Inequality at All Levels
Socioeconomic inequality is defined as a social and/or economic state of unequal access to opportunity, resources, or means in a process leading to health and longevity (Braveman and Tarimo, 2002; Link and Phelan 1995; Phelan, Link, and Tehranifar, 2010). It is important to consider how socioeconomic inequality operates at the macro, meso, and individual levels in its influence on changes in mortality trends and disparities. While the committee’s framework specifically identifies social and economic inequality as a key macrostructural factor and socioeconomic status as a fundamental individual-level characteristic, socioeconomic inequality is an implicit characteristic of the midstream meso-level contexts in the framework. For example, socioeconomic inequality in neighborhoods can be characterized according to neighborhood levels of social and economic disadvantage (e.g., average income, proportion in poverty, composition of adults with a college degree, proportion of families receiving public assistance). The socioeconomic status of families is indicated by household income, poverty status, wealth, and household structure. Social networks can also be characterized by socioeconomic characteristics of network ties, such as the number or proportion of social connections with college degrees, or average earnings of network members. Thus, in seeking to explain the increase and disparities in working-age mortality, it is important to consider how socioeconomic inequality is experienced at all levels of society, is correlated across levels, and flows through and reinforces inequality at separate levels.
Differences Across Social Groups
Any explanation of the drivers of the mortality trends described in this report must also consider the reasons why those drivers manifested differently by age, gender, race and ethnicity, socioeconomic status, and geographic region during the study period. As discussed in Chapters 2 and 3, U.S. trends in working-age mortality during this period did not occur uniformly across the population but sometimes evolved in different ways across groups and in different places. For example, one cannot invoke the lack of job opportunities as an explanation for increases in working-age mortality among less-educated non-Hispanic Whites (Whites) living in rural areas without explaining why similar mortality trends were
not observed among other racial groups that have experienced unfavorable economic circumstances, such as low-educated urban non-Hispanic Blacks (Blacks). Explanations that are not sensitive to such heterogeneity in trends across social and geographic groups run the risk of being too general and thus much less useful than explanations that take such heterogeneity into account.
Consideration of vulnerability and precipitating factors may also help explain differences in mortality trends across social and geographic groups. For example, structural factors related to social inequality and disadvantage may consistently make low-educated, low-income, and racial/ethnic minority groups vulnerable to adverse health impacts through stress/mental disorders or other mechanisms. But the way in which the adverse health effects of structural disadvantage manifest (via what individual and biological processes, when, and at what ages) may differ depending on other contextual (and precipitating) factors. For example, structural disadvantages linked to racism and economic downturns were associated with increasing mortality and decreasing life expectancy among urban Blacks in the 1980s, due largely to increasing mortality from HIV/AIDS and homicide (Geronimus et al., 1996; Kochanek, Mauer, and Rosenberg, 1994). On the other hand, structural disadvantages related to inequality and economic factors may have placed low-educated Whites at particular risk of opioid- and alcohol-related deaths in the mid-1990s and early 2000s. The precipitating factors could also vary over time and across population groups depending on the social and historical context, although it could be argued that the fundamental cause (racial/socioeconomic disadvantage and lack of opportunities) is the same (Link and Phelan, 1995). For example, racial differences in the prescribing practices of physicians may have been an important precipitating factor for the especially rapid escalation of opioid-related deaths among Whites in the 1990s and 2000s (Pletcher et al., 2008), even if the economic vulnerability faced by Blacks and other minority groups was similar.
Levels Versus Trends
Although it may be tempting to assume that the causes of differences in mortality levels are similar to the causes of differences in mortality trends over time, this may not be the case. The mortality level at a certain point in time may be influenced by a multiplicity of multilevel factors interacting over the life course, but these factors may or may not be the ones driving changes in mortality over a particular calendar period. For example, the factors responsible for differences in mortality levels between Blacks and Whites may or may not be similar to those explaining changes in the Black–White mortality gap over time. Although the focus of this report is largely on changes over time, it is important to view such trends in the context of
what are often very large and persistent differences in health and mortality by such factors as race and ethnicity and socioeconomic status.
Time Lags
A critical issue in explaining the drivers of trends in working-age mortality pertains to the time lags involved. For example, trends in alcohol-related deaths (due to chronic liver disease, for example) may reflect increasing exposures to alcohol occurring across long periods. In such a case, explanations for the trend must consider changes in alcohol availability and/or use that potentially date back years, if not decades. In contrast, drug poisoning deaths may be more responsive to short-term changes in drug availability, such as those occurring with the approval and aggressive marketing of Purdue Pharma’s OxyContin and other opioids in the mid- to late 1990s (Van Zee, 2009). Moreover, rates of suicide may be responsive in the medium or short term to changes in social isolation and depression, while rates of cardiometabolic diseases involving obesity and diabetes may be more likely to reflect trends in long-term exposure to risk factors and their causes beginning much earlier in time and continuing over the life course. Sorting out the time lags involved in changing rates of cause-specific mortality poses serious challenges for researchers trying to explain such trends.
Attention to Period and Cohort Effects
Related to the issue of time lags, a final important consideration in identifying the drivers of mortality trends is attention to period and cohort effects. Researchers studying mortality trends often distinguish between period-based and cohort-based explanations of the trends. Period-based influences affect mortality change simultaneously for all age groups in a population in the same time period. For example, the obesity epidemic is a period-based phenomenon that began in the early 1980s and continues to the present day and has affected all ages in the U.S. population. The prevalence of obesity increased across the 1980s, 1990s, 2000s, and 2010s, and this upward trend likely reflects period-based changes in exposure to obesogenic environments and behaviors. In another example, the rapid increase in the supply of opioids in the mid-1990s may have led to increased mortality rates for all ages of a specific population, even if some age, social, or geographic groups were more vulnerable than others. On the other hand, cohort-based influences affect mortality change by influencing mortality risk for distinct cohort groups and in so doing, tend to affect change in certain age groups more than others. For example, persons born within a particular timeframe (e.g., 5 years or 10 years) constitute a “birth cohort,”
while persons who graduated high school and/or college and/or entered the job market at the same time might constitute an “education cohort” or “employment cohort,” respectively. An exposure that is specific to one or a few birth cohorts, such as exposure to a famine or cumulative socioeconomic disadvantage that originates at birth, may thus lead to cohort explanations for trends in working-age mortality. Differentiating period-based from cohort-based variation in U.S. mortality rates is therefore an important consideration for the committee in assessing the evidence for possible explanations for the recent trends in working-age mortality.
There are well-established descriptive approaches for evaluating whether and how period- and cohort-based factors are likely responsible for working-age mortality trends. Plots of age-specific mortality rates can indicate whether cohort-based variation in the rates likely exists beyond age- and period-based variation. A common approach plots all-cause or cause-specific mortality rates on the vertical axis by age (horizontal axis) for a set of either 5- or 10-year birth cohorts. To the extent that the age pattern of mortality differs across birth cohorts, one would conclude that there are different cohort patterns of mortality that change with age. However, evidence for cohort-based differences in an outcome does not constitute evidence for cohort-based mechanisms driving that outcome. Identifying cohort-based variation in mortality trends—and, by extension, cohort effects on mortality trends—is difficult. Cohort differences in the age pattern of mortality may be due to several mechanisms or a combination of mechanisms, and sorting out the simultaneous effects of age, period, and cohort influences is challenging because of the exact linear dependency among these influences, known as the identification problem (O’Brien, 2014; Yang and Land, 2013). A preferred descriptive approach for detecting cohort-based variation in mortality trends entails plotting age-specific mortality rates across time periods to observe the degree to which the period-based trends in mortality rates are parallel (Kupper et al., 1985). If the period-based trends in the age-specific death rates appear parallel to each other, the trends most likely reflect period-based sources of change. Conversely, if the period-based trends in the age-specific death rates appear to be nonparallel, the age-based variation in the period-based trends may reflect cohort-based sources of change.
The annex at the end of this chapter provides a more detailed description of these tools for exploring and interpreting period- and cohort-based variation in working-age mortality, including examples from simulated data. Some of the research reviewed by the committee in Part II of this report includes findings on cohort and period differences in patterns of working-age mortality and identifies specific period- and/or cohort-based explanations responsible for recent trends in U.S. working-age mortality. Within this report, the committee is therefore careful to indicate the method
used to analyze cohort- and period-based influences on working-age mortality trends in the research reviewed.
SUMMARY
Levels and trends in mortality are the manifestations of a large set of interacting processes, often occurring over long periods of time. Nevertheless, it is sometimes possible to identify the likely key drivers of the observed patterns, which is especially important for identifying the most effective policies and programs to promote health and reduce disparities in both health and mortality. The multilevel broad life-course framework proposed in this chapter and the set of considerations presented can be useful in this regard. In subsequent chapters, these ideas are applied in discussing potential explanations for recent mortality trends and in identifying research gaps in understanding the prominent mortality trends highlighted in Part I of this report.
ANNEX 6-1 Period- and Cohort-Based Examination of Trends in U.S. Working-Age Mortality
This annex provides a detailed description of how differences in age-specific mortality rates can be examined to evaluate whether and how period- and cohort-based factors are likely responsible for the trends in working-age mortality documented in this report. As noted in this chapter, evidence for cohort-based differences in an outcome is not evidence for cohort-based mechanisms driving that outcome. Thus, cohort differences in age-specific mortality rates do not necessarily mean that the differences arose from cohort effects on mortality. To illustrate this point, the committee generated hypothetical data (shown in Annex Table 6-1) on mortality trends from three data-generating processes (DGPs) involving age, period, and cohort effects. To simplify matters, the same age effects are assumed for all three datasets (i.e., Mx is elevated during midlife relative to early life, but lower than in old age). Any differences in the mortality rates thus entirely reflect the different period and/or cohort processes in the three scenarios:
ANNEX TABLE 6-1 Simulated Data Used in Annex Figures 6-1 to 6-6
| DGP1 b |
σ | DGP2 b |
σ | DGP3 b |
σ | |
|---|---|---|---|---|---|---|
| Age 1 | -10 | 1 | -10 | 1 | -10 | 1 |
| Age 2 | -10 | 1 | -10 | 1 | -10 | 1 |
| Age 3 | -8 | 1 | -8 | 1 | -8 | 1 |
| Age 4 | -2 | 1 | -2 | 1 | -2 | 1 |
| Age 5 | 0 | 0.5 | 0 | 0.5 | 0 | 0.5 |
| Age 6 | 0 | 0.5 | 0 | 0.5 | 0 | 0.5 |
| Age 7 | -6 | 1 | -6 | 1 | -6 | 1 |
| Age 8 | -12 | 1 | -12 | 1 | -12 | 1 |
| Age 9 | -18 | 1.5 | -18 | 1.5 | -18 | 1.5 |
| Age 10 | -20 | 1.5 | -20 | 1.5 | -20 | 1.5 |
| Period 1 | -35 | 1.5 | 1 | 1 | -35 | 1.5 |
| Period 2 | -35 | 1 | 0 | 1 | -35 | 1 |
| Period 3 | -20 | 1 | 1 | 1 | -20 | 1 |
| Period 4 | 0 | 0.5 | 0 | 1 | 0 | 0.5 |
| Period 5 | 10 | 1 | 1 | 1 | 10 | 1 |
| Period 6 | 27 | 1 | 0 | 1 | 27 | 1 |
| Cohort 1 | 0 | 3 | -25 | 3 | -25 | 3 |
| Cohort 2 | 0 | 2 | -25 | 2 | -25 | 2 |
| Cohort 3 | 0 | 2 | -23 | 2 | -23 | 2 |
| Cohort 4 | 0 | 2 | -20 | 2 | -20 | 2 |
| Cohort 5 | 0 | 1 | -13 | 1 | -13 | 1 |
| Cohort 6 | 0 | 1 | -6 | 1 | -6 | 1 |
| Cohort 7 | 0 | 1 | -2 | 1 | -2 | 1 |
| Cohort 8 | 0 | 1 | 0 | 1 | 0 | 1 |
| Cohort 9 | 0 | 1 | 2 | 1 | 2 | 1 |
| Cohort 10 | 0 | 1 | 0 | 1 | 0 | 1 |
| Cohort 11 | 0 | 1 | -2 | 1 | -2 | 1 |
| Cohort 12 | 0 | 1 | -6 | 1 | -6 | 1 |
| Cohort 13 | 0 | 1 | -8 | 1 | -8 | 1 |
| Cohort 14 | 0 | 2 | -8 | 2 | -8 | 2 |
| Cohort 15 | 0 | 2 | -6 | 2 | -6 | 2 |
| Intercept | 45 | 5 | 38 | 5 | 73 | |
| Random Component | 0 | 5 | 0 | 5 | 0 | |
| N | 100,000 | 100,000 | 100,000 | |||
| Simulations | 100 | 100 | 100 | |||
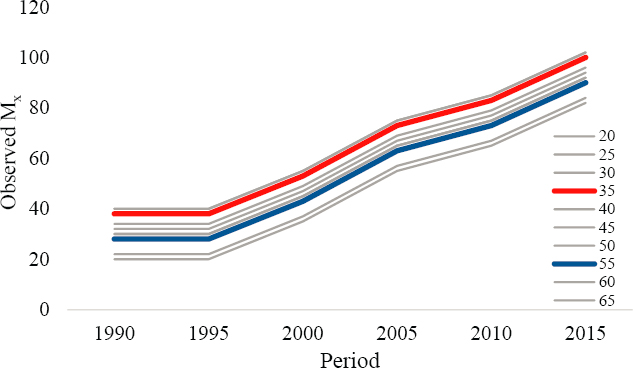
The cohort-based differences observed in Mx for each of the three DGPs are plotted in Annex Figures 6-1 through 6-3.
In DGP1 (Annex Figure 6-1), the age-specific mortality rates differ considerably by birth cohort, and the age patterns increase across cohorts. For example, the M40 rates in DGP1 are observed to be 35 deaths per 100,000 population for birth cohort 1956, 70 for birth cohort 1966, and 97 for birth cohort 1976. These large cohort differences in Mx reflect entirely the cohorts’ differential exposures to period effects in DGP1. That is, because no cohort-based variation exists in DGP1, the observed differences in Mx
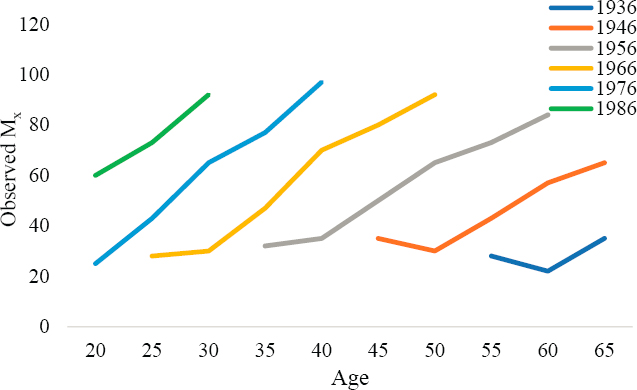
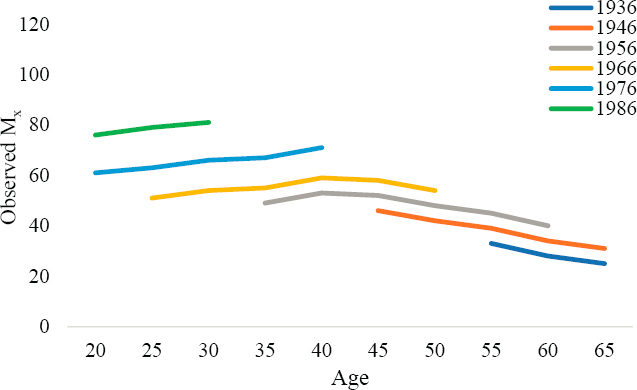
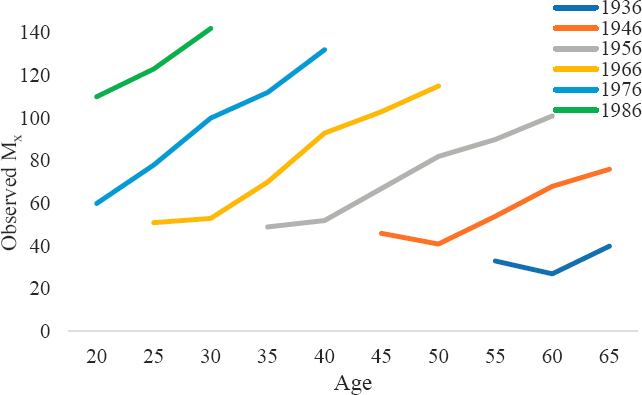
across the cohorts are due entirely to cohorts’ differing exposure to the period effects. In contrast, in DGP2 (Annex Figure 6-2), Mx differs by birth cohort, but the age patterns do not increase across cohorts. Rather, the level of Mx simply shifts up or down by cohort. As a result, the cohort-based differences are not as great as the differences observed in DGP1, and the cohorts’ age-based trends do not differ from each other. Finally, in DPG3 (Annex Figure 6-3), cohort patterns in Mx are similar to those in DGP1 (i.e., cohort-based differences are large, and the age patterns appear to increase across cohorts), but the differences in DGP3 are larger across cohorts because of both the cohort and period effects on mortality trends.
Thus, this descriptive approach of contrasting different cohorts’ age-specific death rates does not help detect cohort-based variation in mortality trends. As highlighted by Kupper and colleagues (1985), evidence for cohort effects in descriptive mortality plots is best detected via “nonparallelism” in the age-specific mortality curves. To find evidence for such “nonparallelism,” researchers plot age-specific mortality rates (Mx) across time periods. If the period-based trends in Mx appear to parallel each other, the trends most likely reflect period-based sources of change. Conversely, if the period-based trends in the age-specific death rates appear to be nonparallel, the age-based variation in the period-based trends may reflect cohort-based sources of change.
Annex Figures 6-4 to 6-6 plot the age-specific death rates generated from DGP1, DGP2, and DGP3 across time periods to depict the extent to which the mortality curves exhibit “nonparallelism.” M35 (red) and M55
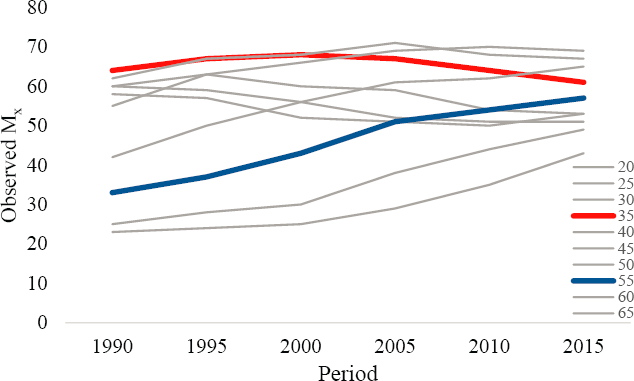
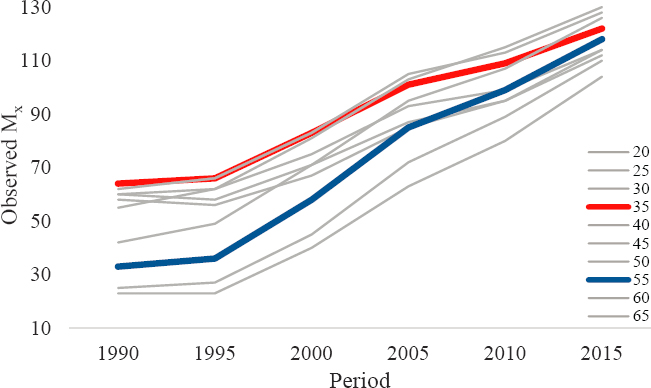
(blue) are highlighted to contrast clearly the variation in Mx trends across the three DGPs.
The Mx levels in Annex Figure 6-4 (DGP1) differ by age, and the values increase over time periods. However, the perfectly parallel trends strongly indicate that the age groups share the same mortality trends. Because the patterns exhibit no “nonparallelism,” the plots do not suggest cohort-based mortality effects in DGP1. This conclusion is consistent with what is known, in that all mortality variation in DGP1 was generated to be age- and period-based. In contrast, the cohort-based variation in DGP2 is strongly evident in the Mx curves in Annex Figure 6-5. The age-based differences in Mx vary considerably across time periods. For example, mortality among the 35–39 age group was the highest mortality in 1990, changed little between 1990 and 2005, and then declined slightly between 2005 and 2015. In contrast, mortality among the 55–59 age group was low in 1990 and increased steadily across the entire time span of 1990–2015. Because of the disparate mortality trends between these age groups, their Mx levels were comparable in 2015. And because the age groups experienced strikingly different trends across time periods, the “nonparallelism” in the plots suggests strong cohort-based variation in their mortality rates. This conclusion is consistent with what is known, in that all mortality variation in DGP2 was generated to be age- and cohort-based.
Finally, in DGP3 (Annex Figure 6-6), there is evidence for strong period-based increases in Mx that are similar to the period-based increases in DGP1 but also exhibit some key differences from DGP1 trends. The separate age groups all experience similar mortality increases, from 15–60 deaths
per 100,000 population in 1990 to about 90–125 deaths in 2015. However, some differences in the age groups’ increases are also evident. For example, age group 35–39 starts with relatively high mortality rates in 1990 (~60 deaths per 100,000 population) and increases across the time periods to about 110 in 2015. Age group 55–59 starts with relatively low mortality rates in 1990 (~30 deaths per 100,000 population) and increases rapidly across the time periods to about 110 in 2015. The age groups’ differential rates of mortality increases suggest cohort-based variation in addition to the strong period-based trends observed in Mx. This conclusion is consistent with what is known, in that mortality variation in DGP3 was generated to be age-, period-, and cohort-based.
Annex Table 6-1 shows the simulated data used in Annex Figures 6-1 through 6-6 above. Provided next are three examples of how the use of period and cohort analyses can shed light on the drivers of recent trends in U.S. working-age mortality. Age-specific death rates are plotted across time periods to explore period- and cohort-based variation in those trends. Cause-specific mortality rates are examined (1) for drug use among U.S. non-Hispanic Black (Black) and non-Hispanic White (White) men to illustrate Black–White differences in drug-related mortality trends; (2) for cardiometabolic diseases among U.S. White women and men to illustrate similar cohort-based trends among men and women; and (3) for alcohol use among U.S. Black and White men and women to illustrate race- and gender-based differences in period and cohort trends in U.S. mortality. Each example demonstrates how considering and possibly identifying the period- and cohort-based sources of U.S. mortality trends can help inform possible explanations for those trends.
With respect to U.S. men’s drug-related mortality rates, evidence overwhelmingly indicates that trends in the White male population likely reflect period-based effects. In contrast, evidence strongly indicates that both period- and cohort-based effects shaped trends in the U.S. Black male population. With respect to mortality rates for cardiometabolic diseases, the patterns of trends among the working-age U.S. White population suggest strong cohort-based variation that is especially pronounced among White women. And with respect to mortality rates for alcohol use, the evidence suggests that the trends among U.S. White and Black men and women were strongly affected by the Great Recession but also that cohort-based effects influenced deaths among both White men and women.
These varying patterns in the mortality trends among working-age Americans are worth considering when evaluating possible explanations for the recent mortality trends in the United States. Any explanation for rising mortality among U.S. adults would need to attend to the Black–White differences in period-based trends in U.S. men’s drug-related death rates, the similarities in the cohort-based mortality trends for cardiometabolic
diseases among White men and women, and how recent mortality trends for alcohol use appear to be both similar and different by race and ethnicity and gender.
DRUG-RELATED DEATH RATES AMONG U.S. BLACK AND WHITE MEN
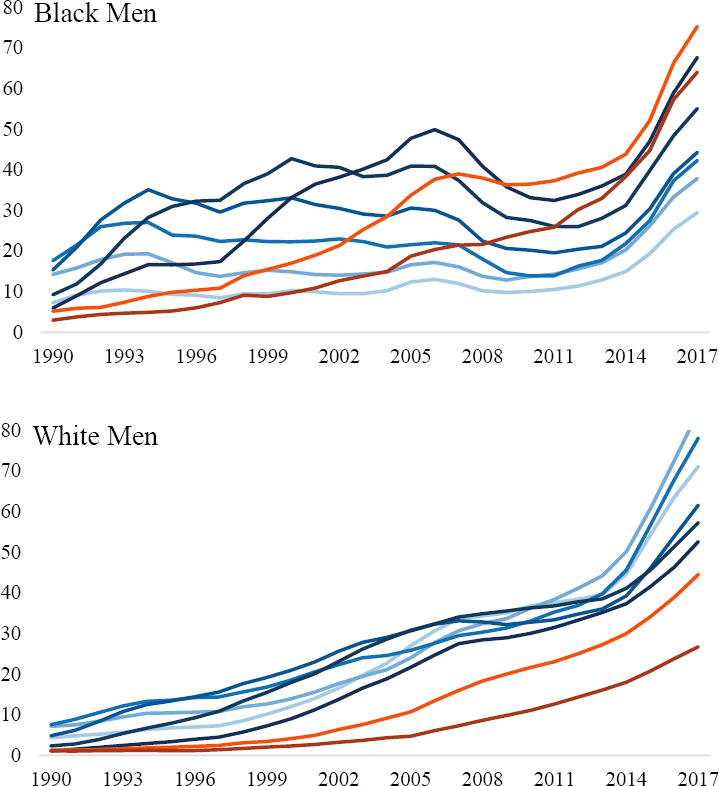
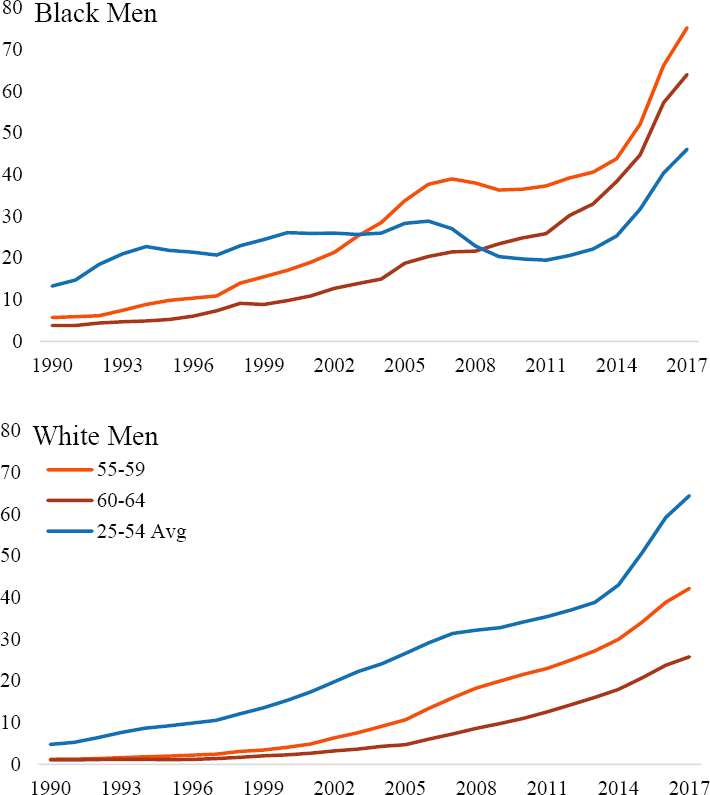
Annex Figure 6-7 plots age-specific mortality rates for drug-related deaths among Black men (top) and White men (bottom) ages 25–64. Blue lines indicate drug-related Mx for ages 25–54, and orange lines indicate Mx for ages 55–64. These ages are differentiated to highlight important race-based differences in drug-related mortality trends among U.S. men.
Drug-related mortality patterns among White men indicate strong period-based trends. There are no substantive differences in drug-related mortality trends for the age groups 25–54, with death rates increasing across time periods in nearly identical ways. Although death rates from drug use are lower among older White men, their trends are similar to those of younger White men. Trends in drug-related mortality rates among Black men exhibit strong period-based variation, but their rates differ from those of White men in two important ways. First, levels of drug-related mortality among U.S. Black men differ considerably by age. Second, the increases in death rates appear to differ by age group as well, indicating possible cohort-based variation in drug-related mortality among Black men. This can be seen most clearly by contrasting the mortality trends (orange lines) for older ages with the average mortality trends for ages 25–54 (blue lines) in Annex Figure 6-8.
The parallel increases in drug-related Mx for White men provide strong evidence that the rising death rates from drug use among this population are predominantly a period-based phenomenon. In contrast, the disparate increases in drug-related Mx for Black men provide evidence that drug-related deaths among this population reflect both period and cohort effects, whereby older Black men (i.e., earlier birth cohorts) experienced much more rapid increases in death from drug use relative to more recent birth cohorts. In fact, the rates of increase among older Black men are more similar to the large increases observed among all White men than to the trends among younger Black men.
DEATH RATES FROM CARDIOMETABOLIC DISEASES AMONG U.S. WHITE MEN AND WOMEN
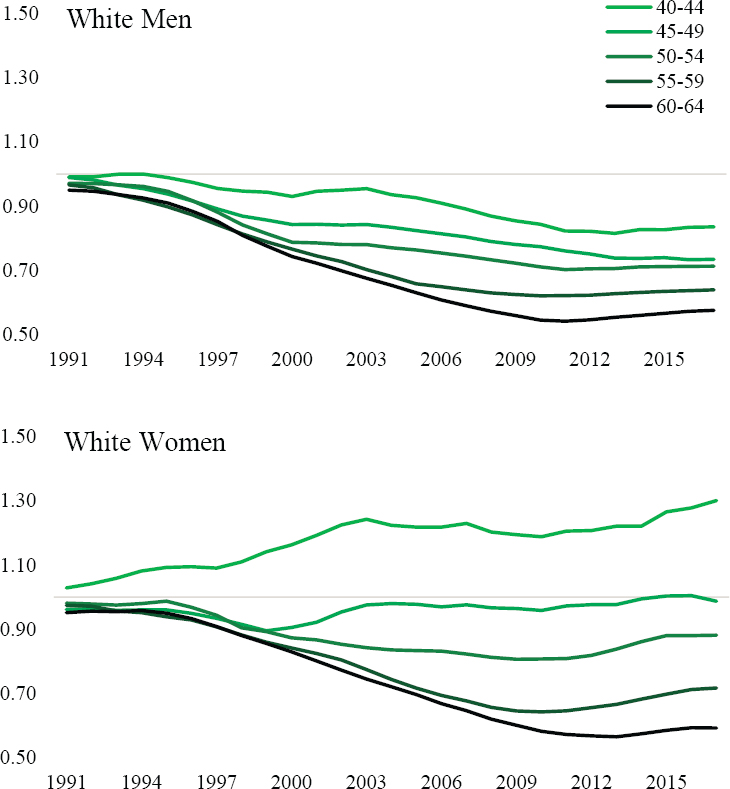
Changes in rates of mortality from cardiometabolic diseases (i.e., deaths from all heart diseases, hypertension, and diabetes) among U.S. White men and women exemplify evidence suggesting cohort-based variation in U.S.
NOTE: Blue lines indicate Mx for age groups 25–29, and 50–54, and orange lines indicate Mx for age groups 55–59 and 60–64.
SOURCE: Data from https://www.cdc.gov/nchs/nvss/nvss-restricted-data.htm.
mortality trends. The period-based trends in Mx are plotted on the relative scale because the absolute differences in mortality rates among the age groups and between White men and women are too large to compare on an absolute scale. Specifically, Annex Figure 6-9 plots the Mx from cardiometabolic diseases in each year 1991–2017 to the Mx in 1990.
Among both White men and women, steady relative reductions can be observed in mortality from cardiometabolic diseases among those ages 55–59 and 60–64 until a flattening and reversal occurs in the 2010s. Across the younger age groups, the reductions are less pronounced or even absent among White women. The disparate period-based trends in the age groups’ Mx provide clear “nonparallelism” and strong evidence for cohort-based variation in cardiometabolic mortality trends among U.S Whites. The patterns indicate a slowing or even a reversal of reductions in mortality from cardiometabolic diseases across young birth cohorts of White Americans.
DEATH RATES FROM ALCOHOL USE AMONG U.S. BLACK AND WHITE MEN AND WOMEN
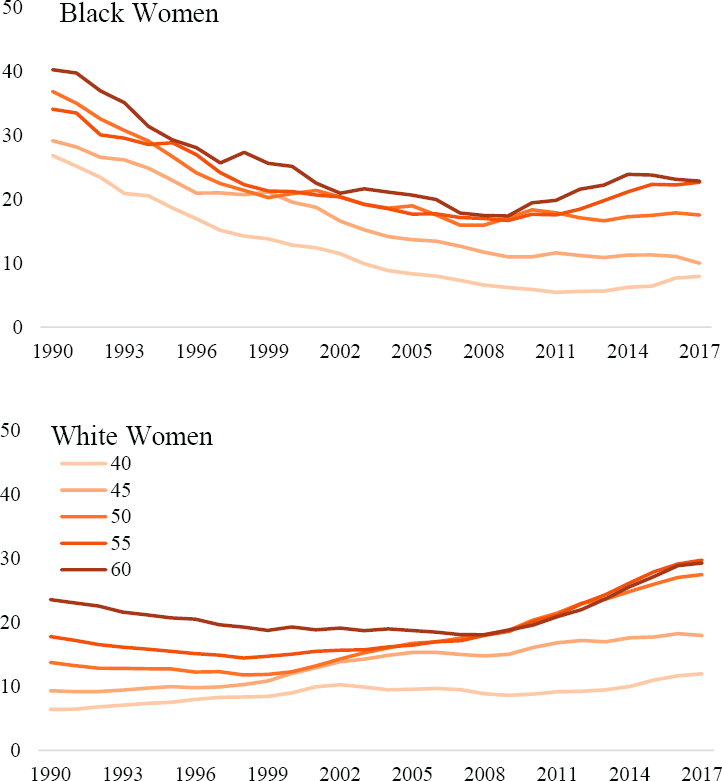
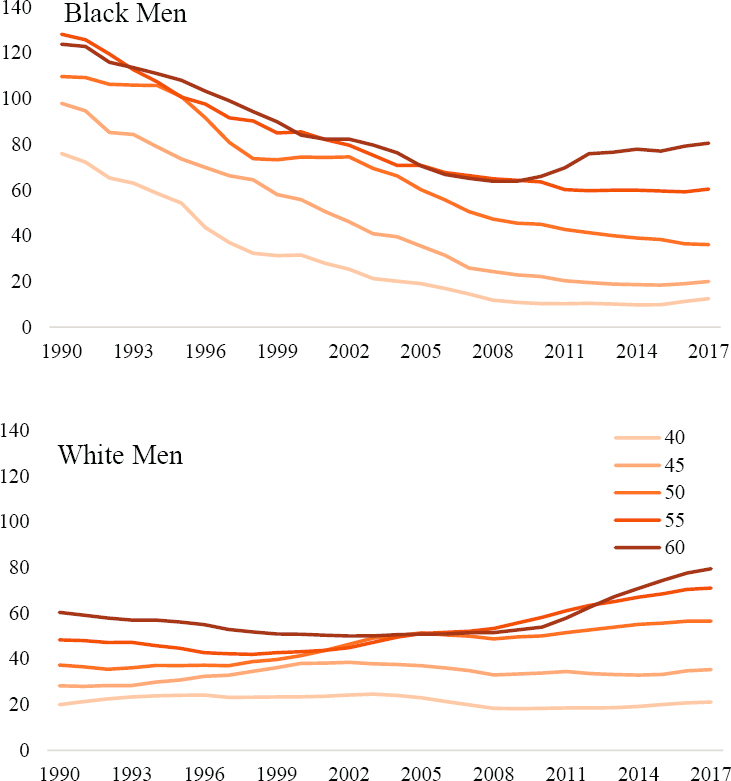
As a final example, evidence for both period- and cohort-based variation in U.S. mortality trends can be seen by plotting rates of mortality from alcohol-related deaths among U.S. Black and White men and women ages 40–64. Annex Figure 6-10 plots Mx from alcohol-related deaths across time periods to illustrate important racial/ethnic- and gender-based differences in the mortality trends.
Across the 1990s and 2000s, death rates from alcohol use declined substantially among the U.S. Black population. Among White men and women, the rates were much lower and relatively stable, albeit with some notable exceptions. Among White men and women ages 50–54 and 55–59, alcohol-related deaths began to increase in the mid-2000s. Corresponding with the Great Recession, reductions in alcohol-related deaths among Black men and women stalled and reversed for older Blacks. Likewise, alcohol-related deaths increased dramatically in the 2010s for White men and women over 50. The recent trends in mortality from alcohol use exhibit a strong period-based pattern for U.S. Black and White men and women, but variation in the trends by race and ethnicity, gender, and age indicates possible cohort-based patterns that are distinct among the U.S. White population.
NOTE: Lines indicate the ratio between Mx in each year and Mx in 1990.
SOURCE: Data from https://www.cdc.gov/nchs/nvss/nvss-restricted-data.htm.
This page intentionally left blank.


