
7
Opioids, Other Drugs, and Alcohol
Collectively, drugs and alcohol were responsible for more than 1.3 million deaths among the U.S. working-age (ages 25–64) population between 1990 and 2018 (Centers for Disease Control and Prevention [CDC], 2020b).1,2 Drug poisoning accounted for 756,160 deaths,3 while 374,197 deaths were alcohol-induced.4 Mental and behavioral disorders5
___________________
1 This figure is based on the International Classification of Diseases, 10th Revision (ICD-10) codes for underlying cause of death. The underlying cause of death is defined by the World Health Organization (WHO, 2011, p. 31) as “the disease or injury which initiated the train of morbid events leading directly to death, or the circumstances of the accident or violence which produced the fatal injury.” In this chapter, “other drugs” refers to both illicit and prescription drugs.
2 Note that the data presented in Chapters 3 and 4 cover the period 1990–2017 because those were the most recent data available at the time the committee conducted the analysis (2019). As this report was being written, data for 2018 were released, so the most up-to-date death counts for deaths due to drugs and alcohol are presented here.
3 This figure includes intentional drug poisonings (suicides).
4 In the committee’s analyses, alcohol-induced deaths included deaths with an ICD-9 or ICD-10 code representing the following: alcohol-induced pseudo-Cushing syndrome, degeneration of nervous system due to alcohol, alcoholic polyneuropathy, alcoholic myopathy, alcoholic cardiomyopathy, alcoholic gastritis, alcoholic fatty liver disease, alcoholic hepatitis, alcoholic fibrosis and sclerosis of the liver, alcoholic cirrhosis of the liver, alcoholic hepatic failure, alcoholic liver damage, excessive blood level of alcohol, and alcohol poisoning.
5 Mental and behavioral disorders represent a wide array of causes affecting the brain and associated behaviors, including cognitive diseases (e.g., dementia), mood disorders, disorders related to mental illness (e.g., schizophrenia, bipolar disorder, depression, anxiety), eating disorders, developmental disabilities and mental retardation, and disorders due to alcohol and drugs. Alzheimer’s disease is not included in this category but in diseases of the nervous system. In 2018, 198,318 individuals had an ICD-10 code of F10–F19 indicated as their underlying cause of death (mental and behavioral disorder due to psychoactive substances).
due to psychoactive substances (drugs and alcohol) accounted for an additional 198,318 deaths. These substance-related deaths are major contributors to the rise in working-age mortality. Drug poisoning deaths have been rising for almost three decades, primarily among non-Hispanic Whites (Whites) but also among non-Hispanic Blacks (Blacks) and Hispanics. Rates of alcohol-induced death increased among Whites throughout the entire period. Declines in these rates occurred among Blacks and Hispanics throughout the 1990s and early 2000s but leveled off during the late 2000s and increased in the 2010s.
The trend in substance-induced deaths is not abating, and the prevalence of substance use disorders (SUDs) remains high. A 2017 study found that 7.7 million Americans (2.9% of the total population) had a drug use disorder, while 15.7 million (5.9%) had an alcohol use disorder (Segal et al., 2017). A recent study showed that increases in clinical diagnoses related to alcohol misuse, substance misuse, and suicide ideation/behavior between 2009 and 2018 largely mirror the broader mortality trends from these three causes (Brignone et al., 2020). The rise in drug poisoning deaths is well studied, and scholars have offered plausible explanations for this phenomenon. Explanations for recent trends in alcohol-related deaths have been less extensively debated; however, the factors that influence both sets of trends are similar.
This chapter first reviews and summarizes the trends in drug poisoning and alcohol-induced deaths, highlighting the timing, geographic, and racial/ethnic variations in these trends—details essential to any comprehensive explanation of these trends. For example, why were Whites more impacted than Hispanics and Blacks, particularly during the first wave of opioid deaths that was characterized by a major increase in overdoses due to prescription opioids? And why were residents of the Appalachia region impacted more and earlier relative to residents of other areas of the country? The chapter examines possible explanations offered in the literature in light of these trend variations. Ultimately, the committee believes the overall explanation is a combination of increased availability of and access to alcohol and highly lethal drugs (supply), and both underlying long-term vulnerability and increased vulnerability of certain segments of the U.S. population (demand).
TRENDS IN MORTALITY DUE TO DRUG POISONING AND ALCOHOL
Drug Poisoning Mortality
The increase in mortality from drug poisoning over the past three decades has been alarming. Nationally, the drug poisoning mortality
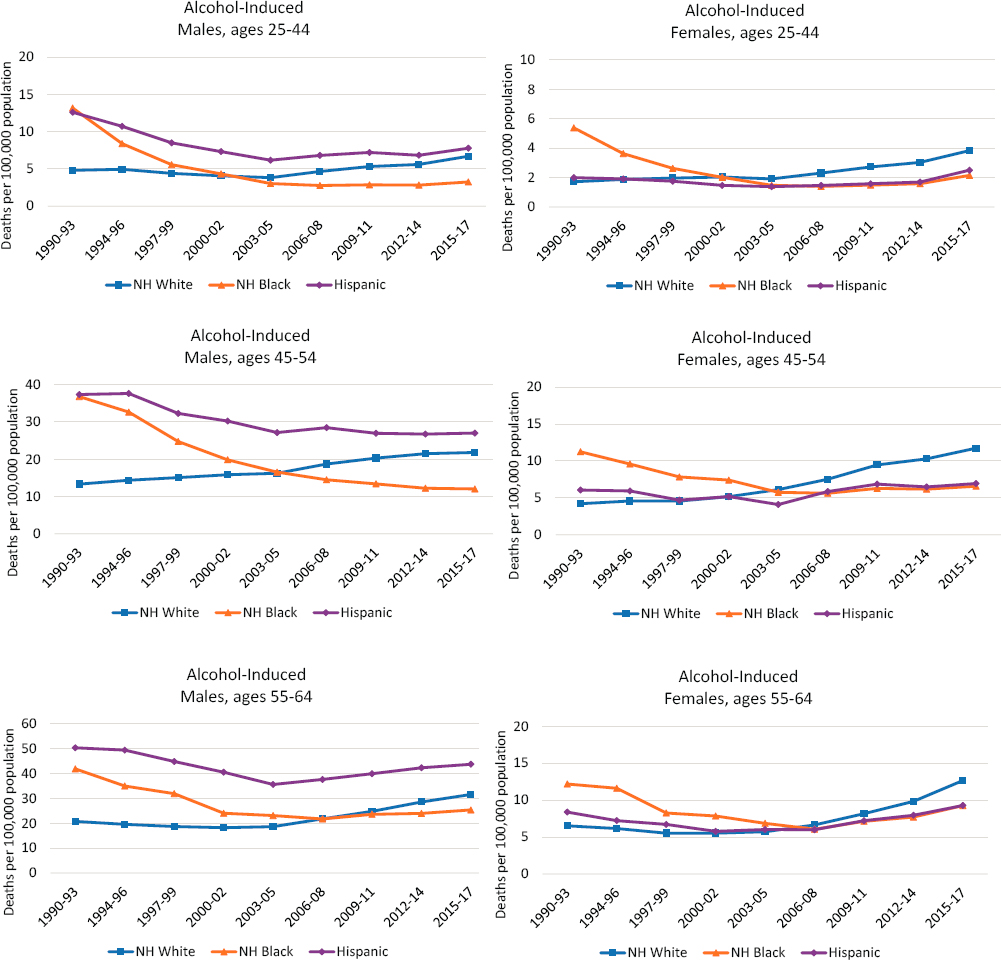
rate increased from 3.4 to 21.7 deaths per 100,000 population (a 538% increase) between 1990 and 2017 (National Center for Health Statistics [NCHS], 2019b). During this period, mortality due to drug poisoning rose more than mortality from any other cause (see Chapter 4). This phenomenon affected all racial/ethnic groups, both men and women, and all U.S. states. Mortality from drug poisoning began to increase in the early 1990s, but these increases accelerated between the late 1990s and mid-2000s and then surged in the 2010s (Figure 7-1). Although these trends were seen among all racial/ethnic groups, their exact timing and pattern varied by sex, age, and race and ethnicity, suggesting that not all working-age adults were equally impacted by each phase.
Drug mortality rates increased throughout the entire study period for White males and females in all three age groups (Figure 7-1). Increases were especially pronounced starting in the early 2010s. Among Black males and females ages 25–44, rates remained relatively low and stable throughout the 1990s and 2000s, followed by an uptick in the 2010s. Rates increased among Black males and females ages 45–54 throughout the 1990s and early 2000s, then declined among Black males and leveled off among Black females during the mid-2000s before again increasing in the 2010s. Rates increased steadily throughout the study period among Black males and females ages 55–64 and then surged in the 2010s. Black males ages 55–64 were the only group to maintain higher drug mortality rates than Whites throughout the entire study period. Among Hispanic males and females ages 25–44, rates remained relatively low and stable until the 2010s, when these groups experienced increases similar to those among the other groups. Rates among Hispanic males ages 45–54 also remained comparatively low and stable until the 2010s, when they increased. Hispanic females ages 45–54 had stable rates throughout the 1990s and early 2000s but saw small but consistent increases starting in the mid-2000s. Finally, rates among Hispanic males and females ages 55–64 were low and stable throughout the 1990s and early 2000s but began to increase in the mid-2000s.
Although the committee did not perform independent analyses of mortality by education or other measures of socioeconomic status (SES), several previous studies examined SES differences in drug-related mortality and found large and growing disparities among working-age White adults (Case and Deaton, 2015, 2017, 2020; Geronimus et al., 2019; Ho, 2017). Case and Deaton’s (2015) seminal study of increasing midlife mortality from “drugs, alcohol, and suicide” showed that the death rate among U.S. adults ages 45–54 due to poisoning—which included prescription and illicit drug poisoning and alcohol-related deaths, both unintentional and of undetermined intentionality—increased for White adults of all educational levels, as well as for Black and Hispanic adults, between 1999 and 2013. However, the increase was especially pronounced for Whites with a high
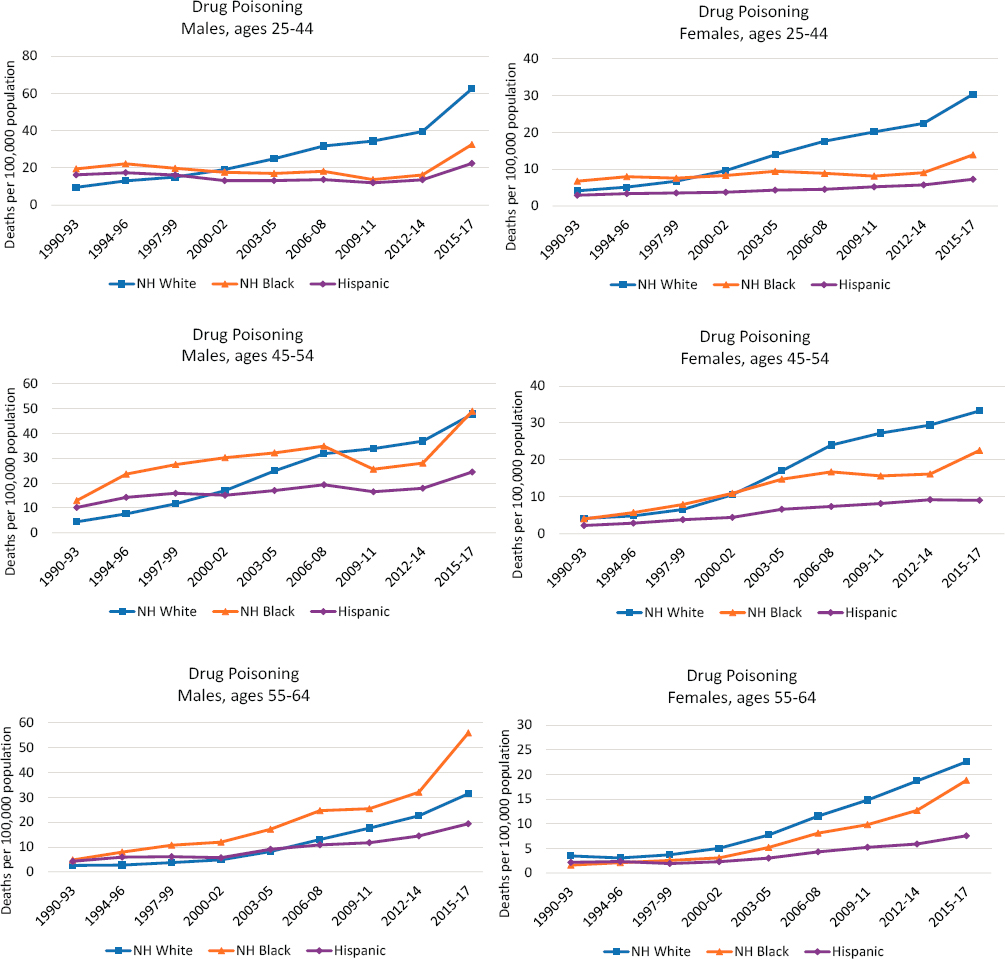
NOTE: Each panel of the figure shows mortality rates for non-Hispanic (NH) Whites (blue line), NH Blacks (orange line), and Hispanics (purple line). Mortality rates for males are shown in the lefthand panels, while those for females are shown in the righthand panels. Mortality rates are shown for three age groups: 25–44 (top panels), 45–54 (middle panels), and 55–64 (bottom panels). Rates are age-adjusted to reflect a standard population age distribution.
SOURCE: Data from National Vital Statistics System Detailed Mortality Files, https://www.cdc.gov/nchs/nvss/deaths.htm.
school degree or less, among whom the death rate for poisoning increased more than four-fold over the period.
Those findings provided the first clear evidence that working-age drug poisoning mortality was increasing more rapidly among less-educated than among more highly educated White adults. Unfortunately, Case and Deaton (2015) did not break down the figures for Black or Hispanic adults by educational attainment; notably, though, both groups exhibited increases in poisoning mortality at ages 45–54 between 1999 and 2013.
In a subsequent study, Ho (2017) conducted a thorough analysis of changes in U.S. death rates due to drug poisoning between 1992 and 2011, stratified by educational attainment. Drug poisoning death rates increased among White adults (both males and females) at all levels of education, even during the earliest period of 1992–1996, before the emergence of OxyContin. The increases were, however, especially steep in the 2000s compared with the 1990s among those ages 30–60 compared with older adults, among White adults compared with the population as a whole, and among those with a high school education or less compared with those with a college degree or more. Thus, Ho (2017) concluded that the increased death rate from drug poisoning from the early 1990s to the 2010s was especially steep among the less educated and accounted for large shares (~70% for men and ~44% for women) of increasing educational disparities in working-age mortality over this period.
Most recently, Geronimus and colleagues (2019) documented changes in educational disparities in working-age (and older) mortality between 1990 and 2015 for Black and White women and men. This study measured educational attainment using population quartiles to help account for the effects of increasing educational attainment across time. Similar to Ho (2017), Geronimus and colleagues (2019) demonstrated that increasing drug-related mortality was especially concentrated among lower-educated White adults and accounted for 73 percent and 44 percent of the increasing educational disparity in working-age mortality for White men and White women, respectively. The authors concluded that one-half (White women) to 80 percent (White men) of the increasing educational disparity in working-age mortality over the 1990–2015 period was due to drugs, alcohol, or suicide, with educational differences in drug poisoning mortality particularly important for understanding widening educational disparities in working-age mortality among White women and men since 1990. For Black women and men, however, the findings differed. Increases in drug-related mortality among Blacks differed only very modestly by educational attainment and thus had very little influence on changing educational disparities in working-age mortality.
There are also important geographic differences in the trends in drug poisoning mortality rates. Rates increased among all racial/ethnic groups
in all metro status categories between 1990 and 2017, but the increases were steeper for some groups than others and varied in their timing (Figure 7-2). In general, differences by metropolitan status among working-age White adults are small. The gap between large metropolitan areas (hereafter referred to as “large metros”) and other areas grew the most among White males, but nonmetropolitan areas (hereafter referred to as “nonmetros”) and small and medium metropolitan areas (hereafter referred to as “small/medium metros”) experienced slower increases in mortality from drug poisoning, particularly during the 2010s. This finding suggests that mortality due to drug poisoning is not responsible for the growing gap in all-cause mortality between large central metros and nonmetros among working-age White adults. However, Monnat (2020a) notes substantial variation in drug poisoning mortality across different rural areas in the United States, and while some rural areas have among the lowest drug mortality rates in the country, others have the highest. Combining all rural areas into one composite rate averages out these wide divergences and masks the reality that drug poisonings accounted for a large share of the widening rural mortality penalty in certain regions (e.g., Appalachia, New England) and economic contexts (e.g., mining counties) (Monnat, 2020b).
Among working-age Black adults, drug mortality rates were highest in large central metros and lowest in nonmetros throughout the period. Younger Black males and females in large central metros experienced a decline in drug mortality during the 2000s, but their rates increased again in the 2010s. Among Hispanic males in both age groups, rates were highest in large fringe metros and generally lowest in nonmetros. Among Hispanic females, rates were lowest in large central metros.
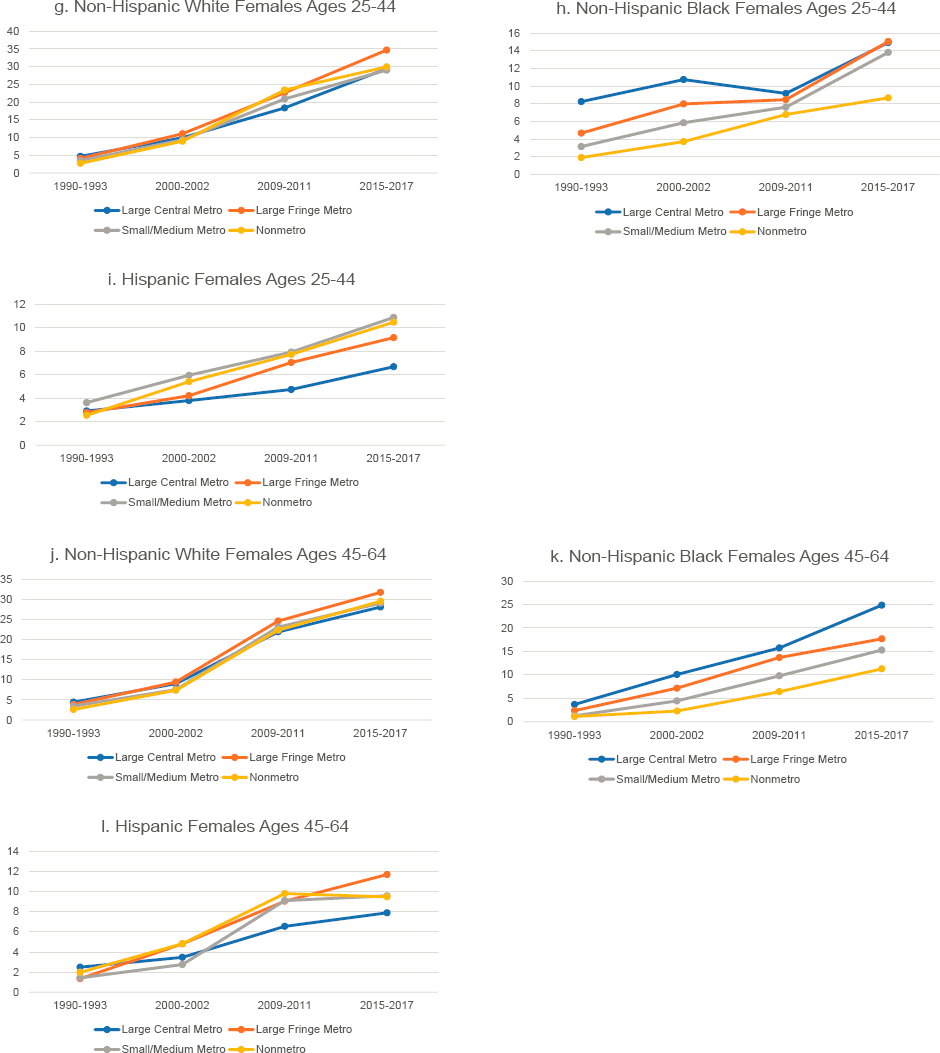
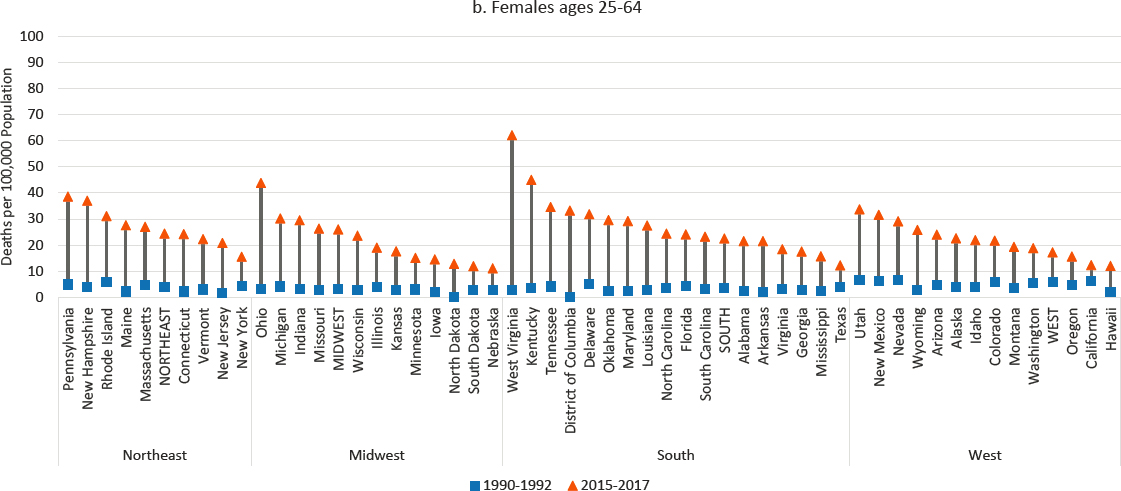
In some ways, the drug overdose crisis can be considered a national crisis, as drug poisoning mortality rates increased in every U.S. state over the study period (Figure 7-3). However, drug mortality rates were disproportionately higher and increased more in some parts of the country than others, with the highest rates concentrated in Appalachia, New England, Florida, eastern Oklahoma, and the desert Southwest (Monnat, 2018, 2019, 2020b; Monnat et al., 2019; Rigg et al., 2019; Rossen et al., 2017). The committee’s analysis showed that working-age drug mortality rates increased for both males and females in all states from 1990 to 2017, but the increases were most pronounced in West Virginia (more than 2000% for both males and females). Among males, the other top-ranked states for increases were Maine, Ohio, Vermont, Kentucky, and New Hampshire. For females, the other top-ranked states for increases were New Jersey, Ohio, Kentucky, and Maine.
Most fatal drug overdoses involve opioids (see Figure 7-4). The surge in fatal drug overdose rates among all groups in the 2010s was due primarily to fentanyl, a synthetic and highly potent illicit opioid with high overdose
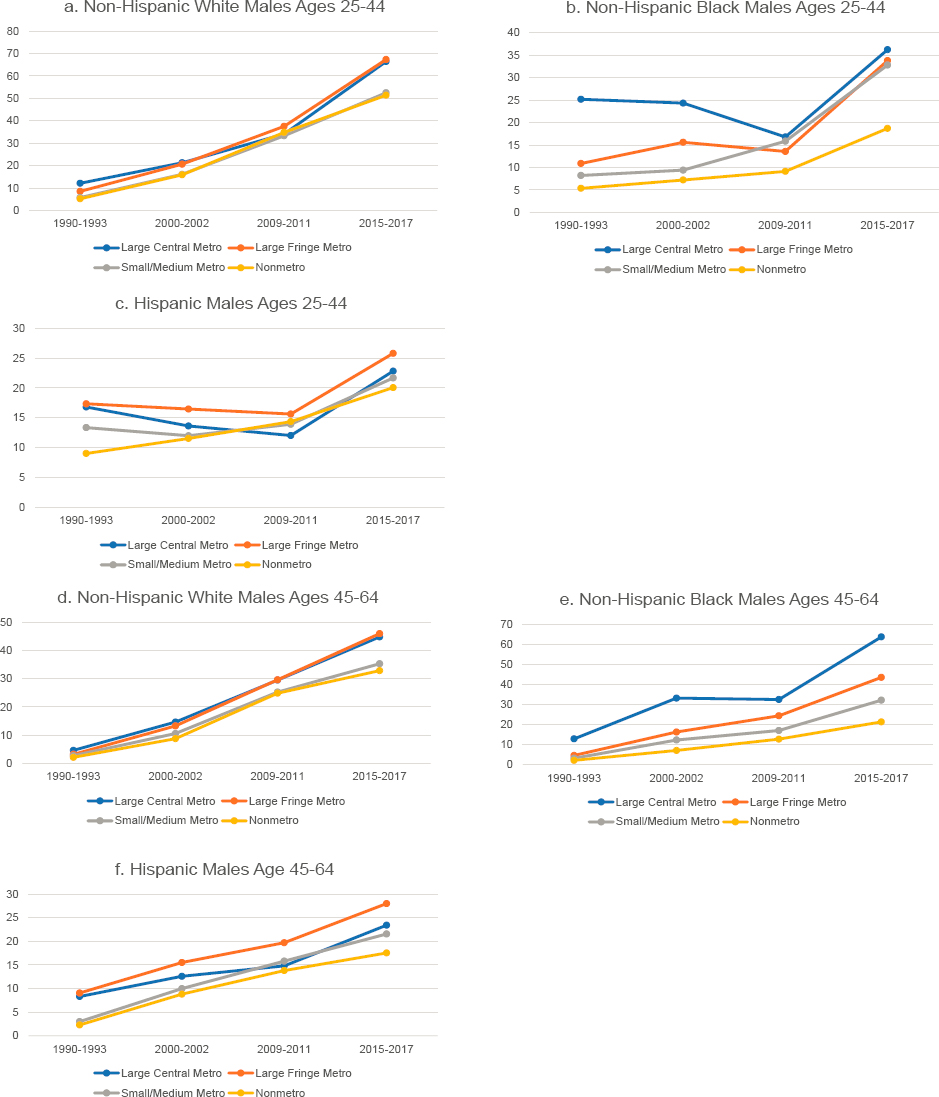
NOTE: Drug poisoning mortality rates are shown for ages 25–44 (panels a-c and g-i) and 45–64 (panels d-f and j-l) across four levels of metropolitan status: (1) large central metropolitan areas (blue lines); (2) large fringe metropolitan areas (orange lines); (3) small or medium metropolitan areas (gray lines); and (4) nonmetropolitan areas (yellow lines). Trends in these four groups are presented separately by sex (males in panels a-f, females in panels g-l) and for non-Hispanic (NH) Whites (panels a, d, g, and j), NH Blacks (panels b, e, h, and k), and Hispanics (c, f, i, and l). Rates are age-adjusted by 10-year age group.
SOURCE: Data from National Vital Statistics System Detailed Mortality Files, https://www.cdc.gov/nchs/nvss/deaths.htm.
risk (Kiang et al., 2019; Monnat et al., 2019; Peters et al., 2020). Fentanyl was the primary contributor to overdoses among all racial/ethnic groups starting in the mid-2010s, while Whites continued to have higher rates of overdose from prescription opioids relative to other racial/ethnic groups. In state- and county-level analyses, prescription opioids, heroin, and fentanyl were found to be differentially implicated in overdoses across different parts of the United States. For example, synthetic opioid deaths were strongly concentrated throughout the East, whereas heroin overdoses were highest in the industrial Midwest and New Mexico (Kiang et al., 2019; Monnat, 2019; Peters et al., 2020; Ruhm, 2017).
NOTE: Drug poisoning mortality rates are shown for 1990–1992 (blue squares) and 2015–2017 (orange triangles) along with the changes over time (black connecting lines). Mortality for males is shown in panel a, while mortality for females is shown in panel b. Rates are age-adjusted by 10-year age group. For males, the 1990–1992 rate for Alaska represents 1991 and 1992 only; the rate was suppressed for 1990. North Dakota is excluded to comply with Centers for Disease Control and Prevention (CDC) suppression criteria (fewer than 10 deaths in 1990–1992). The District of Columbia is excluded for females for the same reason. States are ordered from highest to lowest mortality rate in 2015–2017 within region.
SOURCE: Data from CDC WONDER Online Database, https://wonder.cdc.gov.
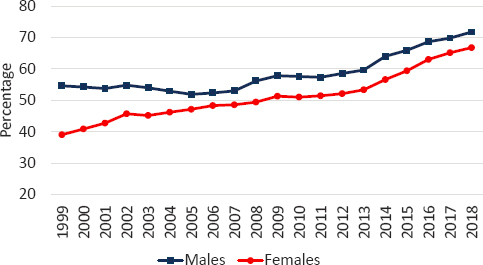
NOTE: The percentage of all fatal drug poisonings that involved opioids is shown for males (blue squares) and females (red circles). Drug poisonings that involve opioids are those for which opioids are recorded as the underlying cause of death (International Classification of Diseases [ICD]-10 code of X40–X44, X60–X64, X85, or Y10–14) and/or a multiple cause-of-death code signifies opioid involvement (T40.0, T40.1, T40.2, T40.3, T40.4, and T40.6).
SOURCE: Data from CDC WONDER Online Database (https://wonder.cdc.gov/).
Between 1999 and 2018, the share of drug poisonings involving opioids increased from 54.6 to 71.7 percent among working-age males and from 39.1 to 66.8 percent among working-age females. Based on death certificates only, opioids were involved in more than 386,000 working-age deaths between 1999 and 2018 (see Figure 7-4). However, nearly a quarter of death certificates indicating drug poisoning do not specify the drug involved (Ruhm, 2018a). As a result, opioid deaths are underreported on death certificates by as much as 20–35 percent, depending on the year (Ruhm, 2018a). Philadelphia County, Pennsylvania, offers a good example. There were 1,047 fatal drug overdoses in 2017 in that county, but an opioid-specific International Classification of Diseases (ICD) code was included on only 45 death certificates (CDC, 2020b).
Figure 7-5 shows trends in opioid-involved drug poisoning deaths from 1979 to 2018 for working-age (ages 25–64) males and females. The figure displays a break between 1998 and 1999 due to changes in ICD coding between those years, and readers should compare trends separately for 1979 to 1998 and 1999 to 2018. Even with this break, however, one can see that opioid deaths began increasing among males in the early 1990s, prior to the release of OxyContin in 1996. Opioid-involved deaths rose precipitously between 1999 and 2017. Over that period, the opioid-involved drug poisoning death rate rose from 7.5 to 34.6 deaths per 100,000 population among working-age males and from 2.5 to 15.3 deaths per 100,000 population among working-age females. For the first time in more than two
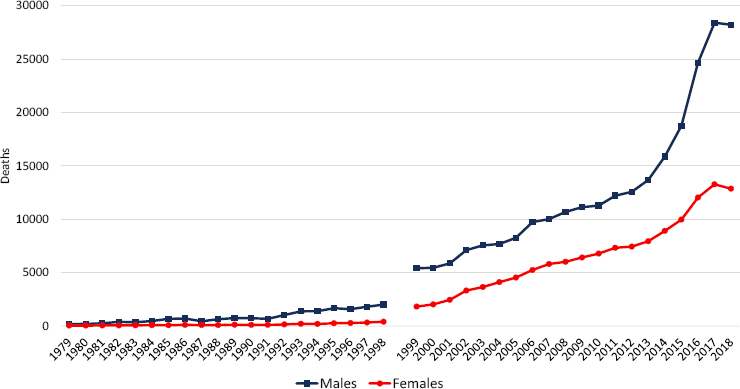
NOTE: The number of fatal drug poisonings involving opioids is shown for working-age males (blue squares) and females (red circles). A break is shown between 1998 and 1999 because of changes in International Classification of Diseases (ICD) codes between those years. Opioid overdoses are likely undercounted prior to 1999. For 1979–1998, deaths were classified as a drug poisoning involving opioids if they were assigned an underlying cause-of-death ICD-9 code of E850.0. For 1999–2018, deaths were classified as a drug poisoning involving opioids if they were assigned an underlying cause-of-death ICD-10 code for drug poisoning (X40–44, X60–64, X85, and Y10–Y14) or a multiple cause-of-death code for an opioid (T40.0, T40.1, T40.2, T40.3, T40.4, and T40.6).
SOURCE: Data from CDC WONDER Online Database, https://wonder.cdc.gov.
decades, there was a slight decline in fatal opioid poisonings among both males and females in 2018. However, the most recent drug mortality data available to the committee, covering 2019 and early 2020, suggest that this small decline may have been temporary and not a reversal of the long-term increase in opioid deaths (Ahmad, Rossen, and Sutton, 2020).
Figure 7-6 presents trends in drug poisoning by specific drug among working-age (ages 25–64) males and females, 1999–2018. The figure does not present trends prior to 1999 because of the lack of comparability in drug-specific ICD codes pre- versus post-1999. The contemporary drug overdose crisis has been described as a triple-wave epidemic (Ciccarone, 2019). Wave 1 (1990s to late 2000s) was characterized by an increase in overdoses due to prescription opioids (e.g., oxycodone, hydrocodone). Wave 2 (mid-2000s to early 2010s) was characterized by a surge in heroin overdoses, which increased as prescription opioids became more difficult
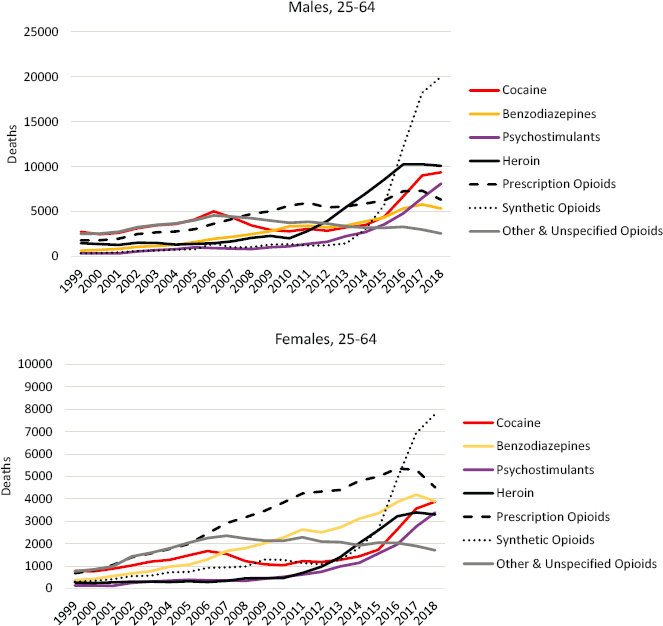
NOTE: The number of deaths is shown for deaths involving cocaine (red line), benzodiazepines (yellow line), psychostimulants (purple line), heroin (solid black line), prescription opioids (dashed line), synthetic opioids (dotted line), and other & unspecified opioids (grey line), separately for working-age males (upper panel) and females (lower panel). Deaths are not mutually exclusive; more than one drug can be involved in a single death. Therefore, deaths are counted under each drug that was involved. Deaths were classified as drug poisonings if the underlying cause of death was a drug poisoning ICD-10 code (X40–44, X60–64, X85, and Y10–Y14). Specific drugs were identified using the multiple cause-of-death codes: cocaine (T40.5); benzodiazepines (T42.4); psychostimulants, including methamphetamine (T43.6); heroin (T40.1); prescription opioids (T40.2); synthetic opioids (T40.4); and other & unspecified opioids (T40.0, T40.3, and T40.6)
SOURCE: Data from CDC WONDER Online Database, https://wonder.cdc.gov.
and costly to procure and as drug cartels caught on to the demand for opioids in the United States and increased the supply of heroin (Quinones, 2015). Wave 3 (2010s) was characterized by a massive increase in overdoses due to synthetic opioids, including fentanyl and fentanyl-related compounds and derivatives. As overdoses from prescription opioids and heroin began to level off, fentanyl overdoses surged to become the primary contributor to overdose deaths.
The media, scholarly, and political focus on opioids is well deserved, but it is important to note that more than half of drug overdoses involve multiple substances, and overdoses from other drugs, including benzodiazepines, cocaine, and methamphetamine, also increased over this period (Gladden et al., 2019) (see Figure 7-6). Many people who misuse prescription opioids also use illegal drugs (Rigg and Monnat, 2015a, 2015b; Rigg et al., 2019). In 2015, among those reporting misuse of prescription opioids, 72 percent reported using heroin; 52 percent methamphetamine; and approximately a third cocaine, LSD, or ecstasy. In what has been described as the fourth wave (Cano and Huang, 2020) of the drug overdose crisis, overdoses from stimulants surpassed those from prescription opioids to compete with heroin (see Figure 7-6).
Alcohol-Induced Mortality
Mortality from alcohol-induced causes followed different trends from those involving drug poisoning, although here, too, working-age Whites experienced larger increases in mortality relative to working-age Blacks or Hispanics (Figure 7-7). In fact, Whites were the only racial/ethnic group to experience an overall increase in the alcohol-induced mortality rate between 1990 and 2017.6 Among White males ages 45–54, the alcohol-induced mortality rate increased from 13.3 to 21.8 per 100,000 population, representing 7.4 percent of the overall increase in mortality for this population. Among White males in both the younger (25–44) and older (55–64) working-age groups, the alcohol-induced mortality rate increased from 4.8 to 6.7 and 20.7 to 31.6 per 100,000 population, respectively.
For many working-age adults, alcohol-induced mortality followed a similar pattern over the period, with declines in the 1990s, followed by increases that began in the mid-2000s and continued into the 2010s. This pattern held among White males in the younger working-age group (25–44); White, Black, and Hispanic males and females in the oldest working-age group (55–64); and Hispanic females ages 45–54. The primary
___________________
6 Trends are not presented for Asians or American Indians. There were slight increases among Hispanic women in all three age groups, but the increases were less than 1 death per 100,000 population.
NOTE: Each panel shows mortality rates for non-Hispanic (NH) Whites (blue line), NH Blacks (orange line), and Hispanics (purple line). Mortality rates for males are shown in the lefthand panels, while those for females are shown in the righthand panels. Mortality rates are shown for three age groups: 25–44 (top panels), 45–54 (middle panels), and 55–64 (bottom panels). Rates are age-adjusted to reflect a standard population age distribution.
SOURCE: Data from National Vital Statistics System Detailed Mortality Files, https://www.cdc.gov/nchs/nvss/deaths.htm.
difference between White adults and Hispanic or Black adults was that decreases were larger among Hispanic and Black adults in the initial period, while the increases after the mid-2000s were larger among White than among Hispanic and Black adults, leading to larger overall increases among White adults. Black and Hispanic males and Black females in the 25–44 and 45–54 age groups initially followed a similar pattern of decreasing alcohol-induced mortality until the mid-2000s; however, alcohol-induced mortality among these groups stagnated throughout the remainder of the period rather than increasing. In contrast, White females ages 25–54 and White males ages 45–54 experienced an increase in alcohol-induced mortality throughout the period, with the largest increases generally occurring after the mid-2000s. Despite this steady increase, White females maintained lower alcohol-induced mortality rates relative to White males throughout the period. Rates remained constant throughout most of the period among Hispanic females ages 25–44, only increasing slightly in the most recent period, between 2012–2014 and 2015–2017. These mortality trends are consistent with those identified by Kerr and colleagues (2009), who found a significantly lower volume of alcohol consumption among Hispanic and Black relative to White respondents in six U.S. national alcohol surveys conducted between 1979 and 2005.
Vierboom, Preston, and Hendi (2019) examined trends in educational differences in alcohol-related mortality between 2000 and 2017 using a comprehensive definition of alcohol-attributable mortality based on the Centers for Disease Control and Prevention’s (CDC’s) Alcohol Related Disease Impact Classification; the latter includes 48 alcohol-related causes of death and causes that are influenced indirectly by alcohol use. They found that at ages 45–49, alcohol-related mortality increased at all educational levels over this period, with the smallest increases among men and women with a college degree and the largest increases among those with less than a high school education.
Our analysis shows that the increase in alcohol-induced deaths from 1990 to 2017 was mostly a national phenomenon (Figure 7-8). Differences across metro status categories were generally small, with somewhat more favorable trends within large central metros.7 Working-age alcohol-induced deaths increased in all but 13 states among males and in all but 5 states among females. In keeping with the racial/ethnic dimension of this trend, the largest percentage increases occurred in Idaho, Iowa, Wyoming, Oklahoma, and Montana for males and in Iowa, North Dakota, Wyoming, Oklahoma, and Arkansas for females. States with
___________________
7 The most notable differences by metro status occurred for Hispanic females, among whom alcohol-induced mortality was much lower in nonmetros than in other areas in the early 1990s, but higher than in other areas by the end of the period. See Appendix A for full results.
the largest percentage declines were Delaware, New York, North Carolina, and South Carolina plus the District of Columbia (DC) for males and Maryland, New York, New Jersey, and South Carolina plus DC for females. States with the largest percentage increases had relatively high proportions of White residents, while states where the steepest percentage declines occurred had relatively high proportions of Black residents.
The increases in alcohol-induced mortality reported above likely reflect much earlier changes in consumption patterns. The temporal trends observed in alcohol-induced mortality align with temporal trends in per capita alcohol consumption (Kerr et al., 2009, 2013a). The majority of alcohol-induced deaths are due to chronic liver disease and liver cirrhosis. For most people, it takes many years of heavy drinking to develop and succumb to these diseases. Peak alcohol consumption in the United States occurred during the mid-1970s to early 1980s (see Figure 7-4; Haughwout and Slater, 2018). There was then a sharp drop in consumption between the early 1980s and 1997, followed by a slow rise starting in 1998. Assuming that the main cohort of drinkers during the peak consumption period (mid-1970s to early 1980s) were ages 20–40, most of them would have been ages 35–55 at the start of the study period (1990).
Using data from six U.S. National Alcohol Surveys conducted between 1979 and 2005, Kerr and colleagues (2009) conducted age–period–cohort (APC) analysis and found a strong cohort effect for increased alcohol consumption among those born after 1975. In another APC study, using data from seven cross-sectional studies of the United States representing more than 36,000 adults (ages 18 and over), Kerr and colleagues (2013a) found that age effects for drinking beer typically peak in the early 20s and then decline, whereas wine and spirits have relatively flat age profiles. They also found that men born between 1976 and 1985 and women born between 1981 and 1985 have higher alcohol consumption relative to earlier or later birth cohorts. Among women, however, they noted an additional pattern for the 1956–1960 birth cohort, which stands out from adjacent cohorts as having high alcohol consumption and binge drinking. The authors note that members of this cohort were in their early 20s during the peak of U.S. per capita alcohol consumption (early 1980s), and this fact, along with relaxed social sanctions on female alcohol use, may have led these women to develop heavier drinking habits at that time. They conclude that “it is especially important to try to understand characteristics of the 1976-1985 birth cohorts, and the conditions between 1995 and 2005 when their drinking habits were being developed” (Kerr et al., 2013a, p. 1041). Based on a systematic review of 68 studies, Slade and colleagues (2016) similarly found a closing of the gender gap in alcohol consumption between the early 1990s and late 1990s birth cohorts.
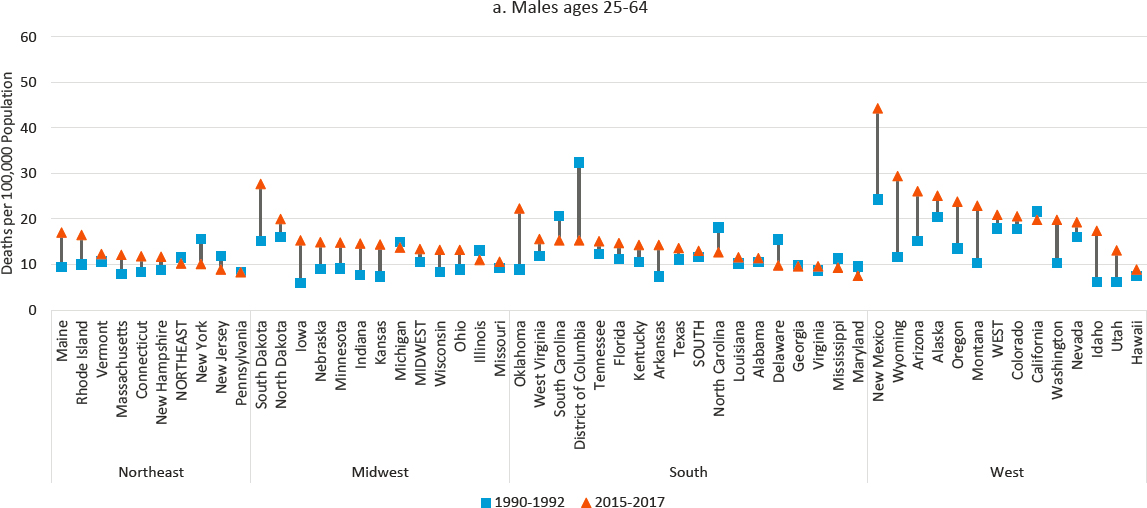
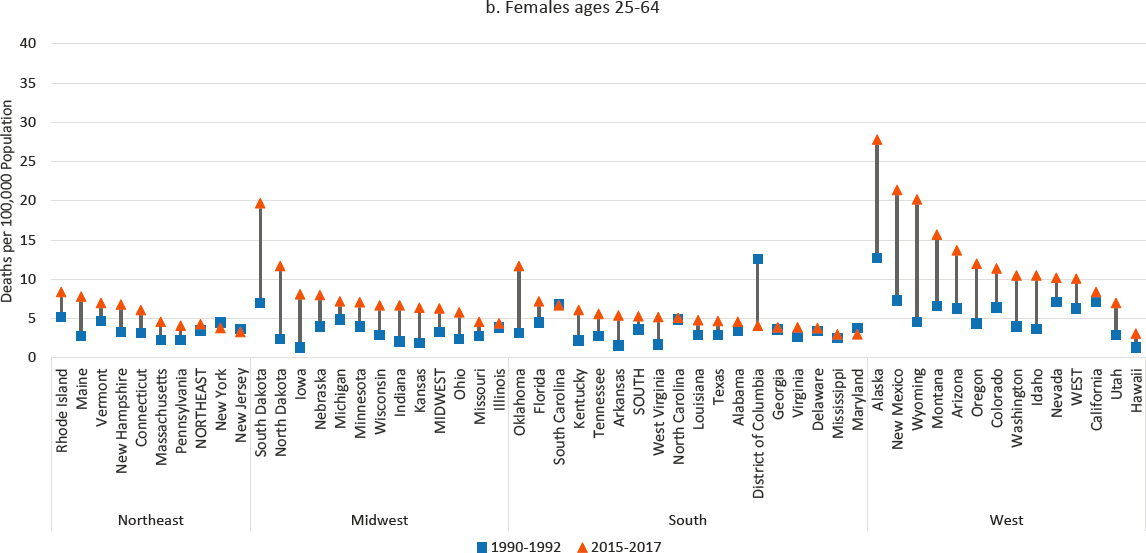
NOTE: Mortality rates for alcohol-induced deaths are shown for 1990–1992 (blue squares) and 2015–2017 (orange triangles), along with the changes over time (black connecting lines). The rates for males are shown in panel a, while the rates for females are shown in panel b. Rates are age-adjusted by 10-year age group. States are ordered from highest to lowest mortality rate in 2015–2017 within region.
SOURCE: Data from CDC WONDER Online Database, https://wonder.cdc.gov.
Between the early 1980s and late 1990s, per capita consumption of alcohol (particularly beer and spirits) declined in all four major regions of the United States. Beer consumption continued to decline throughout the 2010s, but consumption of wine and spirits began to rise in the late 1990s, driving an overall increase in alcohol consumption since that time (see Figure 7-9; Haughwout and Slater, 2018).
Summary of Trends in Mortality from Drugs and Alcohol
In some ways, the trends in mortality due to drug poisoning and alcohol-related causes suggest similarities in the affected populations.8 Both causes of death increased steadily over the 1990–2017 study period among working-age Whites. Although more research on socioeconomic disparities in mortality has examined differences in mortality due to drug poisoning rather than alcohol-induced mortality, the research collectively suggests that among working-age Whites, particularly men, increased mortality from both causes was greater among those with a high school degree or less than among those with a college degree. Mortality due to substance use generally (drug and alcohol use) explains most of the growth in the socioeconomic gap in mortality among men and about half of the growth in the gap among women. Differences in mortality due to drug poisoning and alcohol-induced causes between metro and nonmetro areas followed similar trends, even as regional trends differed. Neither cause of death contributed to the growing mortality gap between metro and nonmetro areas.
Despite these similarities, there are also important differences in drug mortality and alcohol-induced mortality trends. In particular, the timing, racial/ethnic and age profiles, and geography of these trends vary. For example, drug mortality increased among older working-age Black males during the 1990s; however, mortality from alcohol-induced causes decreased substantially among this group. And although both drug and alcohol-induced mortality rates increased among working-age Whites, younger working-age Whites experienced larger increases in drug poisoning mortality relative to their older counterparts, who experienced larger increases in mortality from alcohol-induced causes. With respect to geography, Western states experienced the smallest increase in drug mortality but the largest increases in alcohol-induced mortality.
___________________
8 The committee also examined trends in mortality from mental and behavioral disorders. These trends largely mirrored the trends for alcohol-related mortality; therefore, they are not presented here. Appendix A presents the full set of cause-specific mortality trends by sex, age group, and race and ethnicity, as well as the cause-specific mortality trends by sex, age group, race and ethnicity, and metropolitan status.
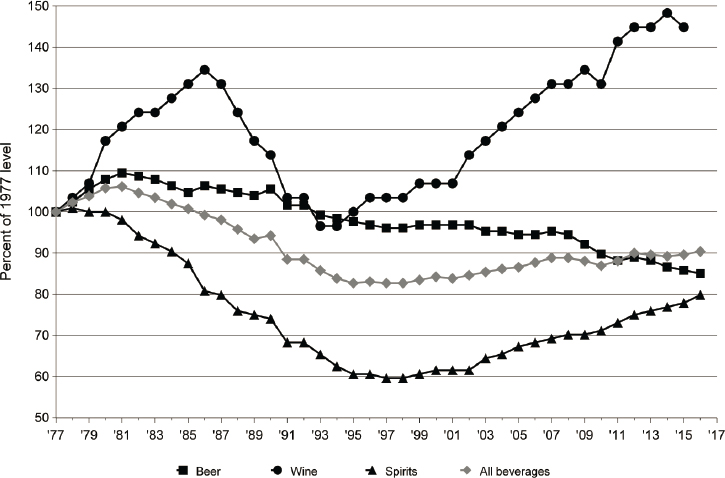
NOTE: Beverage types include beer (black squares), wine (black circles), spirits (black triangles), and all beverages combined (grey diamonds).
SOURCE: Data from National Institute on Alcohol Abuse and Alcoholism, https://pubs.niaaa.nih.gov/publications/surveillance110/CONS16.pdf.
These differences in drug and alcohol-induced mortality trends could be the result of differences in the etiology of mortality from these causes. Unlike drug poisonings, which are often acute and due to overdose, most alcohol-induced deaths are chronic and are the result of many years of steady alcohol consumption. With the exception of fatal injuries caused by alcohol intoxication, drugs (particularly opioids) kill people more quickly than does alcohol. This complicates the ability to draw a clear link between cohort-based trends in the availability and consumption of alcohol among younger adults and subsequent period changes in mortality among older adults. Relative to drug poisoning, the extended period of consumption before the onset of many diseases caused by alcohol provides greater opportunity for intervention before alcohol-induced mortality occurs, as well as greater opportunity for deaths from other causes. In contrast, drug poisoning mortality may be more likely to track contemporaneous trends in the supply of particularly lethal drugs. For these reasons, although the overall trends in mortality from these causes of death differ, it is possible that these
trends are the result of common underlying vulnerabilities to drug and alcohol use within certain population groups and geographic areas.
EXPLANATIONS FOR THE RISE IN WORKING-AGE MORTALITY FROM DRUG POISONING AND ALCOHOL-INDUCED CAUSES
Scholars have debated whether the rise in drug poisonings is due to the increased availability of drugs (supply side) or the increased vulnerability of certain population groups (demand side). Scholars who support the former explanation point to the actions of legal and illegal drug suppliers and regulatory failures of government agencies, primarily the Food and Drug Administration (FDA) and Drug Enforcement Administration (DEA) (Kolodny et al., 2015). These scholars chronicle the increases in the availability of inexpensive highly addictive and lethal drugs. Scholars who point to increases in the vulnerability of population groups reference the social determinants of health that put some individuals and communities at risk of addiction and substance misuse (Dasgupta, Beletsky, and Ciccarone, 2018). These scholars chronicle an increase in socially at-risk populations that amplified the impact of supply shifts such that life expectancy in the United States began to decline during the period. Yet these are not competing explanations for the nation’s overdose crisis; rather, the increase in the availability of drugs and both the long-term and increasing vulnerability of these population groups combined to create and fuel the rising trend in drug poisoning deaths. The country’s drug overdose crisis represents a “perfect storm” of the flooding of the market with highly addictive yet deadly substances and underlying U.S. demand for and vulnerability to substances that temporarily numb both physical and mental pain.
Drug and alcohol addictions also create additional vulnerabilities in the population groups they impact. The addictive and destructive nature of opioids, many other drugs, and alcohol puts pressure on the social and economic fabric of families and communities, resulting in downward spirals that lead to further addiction.
Supply-Side Explanations
Prescribing Practices and the Emergence of OxyContin
On the supply side, weak government regulations and aggressive and highly effective marketing tactics on the part of the pharmaceutical industry (manufacturers, distributors, pharmacies) and pain management advocacy groups (many of which were funded by the pharmaceutical industry) and physicians sparked a massive increase in opioid prescribing in the 1990s and 2000s and the subsequent rise in prescription opioid misuse,
addiction, and overdose (see Figure 7-10; Kolodny et al., 2015). Physicians were encouraged to be more aggressive with pain management and given misleading information about the safety of opioids and their lack of addictiveness. A small group of physicians, motivated by profits, engaged in dubious schemes for prescribing large amounts of opioids or received fees to promote these drugs.
Among the most well-known culprits in the opioid overprescribing crisis is the pharmaceutical company Purdue Pharma. In 2020, Purdue reached an $8.3 billion settlement with the U.S. government and agreed to plead guilty to criminal charges that it enabled the supply of opioids “without legitimate medical purpose,” conspired to defraud the United States, and violated antikickback laws in its distribution of opioids. Kickbacks included payment to health care companies and physicians to encourage opioid prescribing (Sherman, 2020). From 1996 to 2002, Purdue provided funding for more than 20,000 educational campaigns promoting the use of opioids for chronic pain in patients without cancer (a group for which opioids were
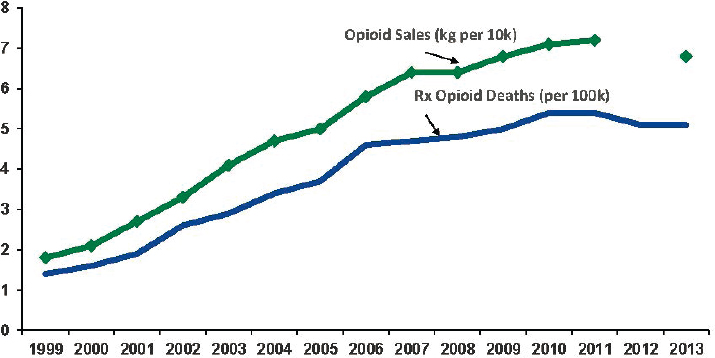
SOURCE: Baldwin, G. (2015). Overview of the Public Health Burden of Prescription Drug and Heroin Overdoses. Available: https://www.fda.gov/media/93249/download. Opioid sales data available from U.S. Department of Justice, Drug Enforcement Administration, Automated Reports and Consolidated Ordering System (ARCOS), https://www.deadiversion.usdoj.gov/arcos/retail_drug_summary/2013/index.html. Prescription opioid deaths data available from Centers for Disease Control and Prevention, National Center for Health Statistics, National Vital Statistics System, http://wonder.cdc.gov.
generally not indicated). In 1997, the American Academy of Pain Medicine and American Pain Society issued a joint consensus statement promoting the benefits of using opioids for chronic pain management (Haddox et al., 1997; National Academies of Sciences, Engineering, and Medicine [NASEM], 2017). These and other pain advocacy groups (many of which, as noted, were funded by Purdue and other pharmaceutical companies) contributed to opioid overprescribing by arguing that pain was the fifth vital sign and too often left untreated or poorly managed. Their representatives visited physicians’ offices and medical conferences and argued that physicians were too insensitive to the effects of pain on quality of life, needed to do a better job of measuring and monitoring patients’ pain, and should prescribe appropriate pain medications (Quinones, 2015). The motivation behind this movement for more aggressive treatment of pain may not have been in the best interest of patients. Prior to the mid-1990s, opioids were restricted primarily to late-stage cancer patients, palliative care, and victims of traumatic injury; however, pain advocates and pharmaceutical representatives encouraged primary care physicians to assess patients for pain along with the other vital signs and to prescribe opioids aggressively to manage a variety of chronic pain conditions, from menstrual cramps to back pain.
In 1996, Purdue introduced and began heavily marketing OxyContin—an extended-release oxycodone product. Although several other opioid products were already on the market, OxyContin is widely viewed as the product that fueled the surge in U.S. opioid addiction. U.S. Department of Justice documents show that Purdue executives and the company’s owners (the Sackler family) knew that OxyContin was widely abused but lied in claiming that it was less addictive than other opioid products already on the market, intentionally misleading federal regulators, health care providers, and the public (Macy, 2019; Meier, 2018). This disinformation campaign made many physicians comfortable in prescribing the drug heavily to a wide range of patients. Purdue argued that OxyContin’s new slow-release long-acting formulation not only was more effective than existing opioids but also reduced the product’s ability to give users a high, and therefore its addiction potential. However, the slow-release technology worked only when the pill was consumed whole. When it was crushed and snorted or dissolved and injected, users could obtain a very intense immediate high, making OxyContin much more addictive than other prescription opioid products already on the market. Purdue also exaggerated the period of pain relief OxyContin typically provided (12 hours). Most people who used it experienced a much shorter relief period, leading them to take the pills more frequently.
When the FDA approved the use of OxyContin in 1995, the agency believed that the slow-release technology minimized the risk of addiction. Purdue (and subsequently other pharmaceutical companies) exploited the
now infamous five-sentence Porter and Jick letter, which was published in the New England Journal of Medicine in 1980, to convince the FDA, physicians, and the public that opioids were safe and not addictive. That letter actually stated that, among the nearly 12,000 hospitalized patients who had received at least one opioid administration in the hospital, only 4 had developed an addiction. Although Porter and Jick’s study included only hospitalized patients, Purdue used the letter to state that “less than one percent of patients treated with opioids became addicted.” As a result of Purdue’s actions, pain specialists and other providers, especially speakers (many of whom received consulting fees from Purdue) who gave lectures to physicians about pain management, routinely cited this statistic.
In addition to misleading physicians, the FDA, and the public about OxyContin’s addiction risk, Purdue used aggressive marketing tactics that were unprecedented for a Schedule II drug.9 From 1996 to 2001, Purdue conducted more than 40 national pain management conferences; recruited and trained physicians for national speaker bureaus; compiled prescriber profiles on individual physicians to target those with already high rates of opioid prescribing; developed a lucrative bonus system for its sales representatives; distributed “patient-starter” coupons that provided patients with free prescriptions for a 7- to 30-day supply of OxyContin; and distributed numerous branded promotional items, such as tools, stuffed plush toys, and compact discs (“Get into the Swing with OxyContin,” Van Zee, 2009). OxyContin sales skyrocketed from 670,000 to 6.2 million from 1997 to 2002. The global consulting firm McKinsey & Company (arguably the world’s most prestigious management consulting firm) developed a plan to “turbocharge” OxyContin sales, push back against the DEA, counter emotional messages from parents whose children had overdosed, and even give Purdue’s distributors a rebate for every OxyContin overdose attributable to pills they sold (Bogdanich and Forsythe, 2020; Forsythe and Bogdanich, 2019; Kristof and WuDunn, 2020).
The success of OxyContin led to the introduction of copycat extended-release medications, including Opana® ER (oxymorphone hydrochloride extended release), and several extended-release hydrocodone products (e.g., Zohydro® ER, Hysingla® ER), as well as to increased prescribing of short-release hydrocodone and oxycodone products that had been on the market long before OxyContin. By 2015, numbers of opioid prescriptions were three times higher than they had been in 1999 (from 180 to 640 morphine milligram equivalents per person) (Guy et al., 2017). Prescribing rates peaked in 2010 and have declined ever since. However, declines have not been uniform: the average number of days for which medications were
___________________
9 Schedule II drugs are substances with a high potential for abuse but with some medicinal purpose.
prescribed continued to rise in some places, and prescribing rates remain much higher today than they were before OxyContin entered the market in 1996 (Guy et al., 2017; Schuchat, Houry, and Guy, 2017).
Purdue is hardly the only company responsible for the surge in opioid prescribing, as evidenced by the numerous city, state, and federal lawsuits (past and current) filed against opioid manufacturers, distributors, and dispensers.10 Other major culprits include the manufacturers Mallinckrodt Pharmaceuticals (which sold more opioids in the United States than any other manufacturer during the height of the opioid crisis), Johnson & Johnson, Endo International, Teva Pharmaceuticals, and Allergan and the distributors McKesson, Cardinal Health, and AmerisourceBergen (Dwyer, 2019; Kaplan and Hoffman, 2020). Drug distributors, dispensers, and pharmacy chains (e.g., Walgreens, CVS, Rite Aid) also contributed to and profited from overprescribing through their failure to monitor and investigate suspicious opioid prescribing patterns (Cuéllar and Humphreys, 2019; Hoffman, 2020).
Despite heavy marketing efforts, some physicians remained hesitant to prescribe opioids to treat chronic pain and fearful of their addiction risk. Some unscrupulous physicians viewed the increased demand for prescription opioids as an entrepreneurial opportunity, which resulted in high-volume-prescribing pain clinics (some of which functioned as “pill mills”) across the United States. At pill mills, physicians wrote prescriptions for OxyContin and other opioids, often with little diagnosis or follow-up. Several investigative books and docuseries describe how patients would line up, pay cash, and leave with prescriptions for high-dosage opioids and other drugs, which they sometimes used themselves but often sold or diverted to family and friends (Quinones, 2015; Temple, 2016; Willoughby Nason and Furst, 2020). This egregious prescribing could not have happened without the willful help of pharmaceutical distributors. In the space of just 2 years, for example, the giant pharmaceutical distributor McKesson Corporation shipped nearly 9 million opioid pills to a single pharmacy in tiny Kermit, West Virginia (population 400) (Kristof and WuDunn, 2020).
Pill mills first emerged in the most economically depressed regions of Ohio, Kentucky, West Virginia, and Florida in the late 1990s and then spread across the country (Quinones, 2015). In the late 1990s in Maine, West Virginia, eastern Kentucky, southwestern Virginia, and Alabama, hydrocodone and oxycodone (non-OxyContin) were prescribed at a rate 2.5–5 times the national average. By 2000 in these same places, OxyContin prescribing rates were 5–6 times higher than the national average (Van
___________________
10 For a record of the various lawsuits, judgments, and settlements against pharmaceutical companies, see https://www.drugwatch.com/opioids/lawsuits.
Zee, 2009). It is no coincidence that these were the first areas of the United States to experience widespread increases in opioid misuse, diversion, and overdose and demand for SUD treatment.
Even conscientious physicians contributed to the glut of opioids on the market through opioid overprescribing after surgical procedures (Ladha et al., 2019; Neuman, Bateman, and Wunsch, 2019). In a review of the research evidence on the extent of opioid overprescribing after surgery, Neuman, Bateman, and Wunsch (2019) summarize several studies showing that U.S. physicians prescribe opioids after surgery at rates several times higher than those of their European counterparts. For example, Ladha and colleagues (2019) found that, compared with Canada or Sweden, the United States had higher average doses of opioid prescriptions for most surgical procedures. Bicket and colleagues (2017) found that 67–92 percent of U.S. patients having undergone surgery had unused opioid tablets, with the proportion of unused tablets ranging from 42 to 71 percent. Many patients store unused prescriptions improperly, often leaving them in unlocked locations such as medicine cabinets, cupboards, and wardrobes (Bicket et al., 2017; Neuman, Bateman, and Wunsch, 2019). This improper storage contributes to prescription opioid diversion through theft by relatives, friends, and strangers who enter households to provide services (e.g., repairs, cleaning, home health care) (Inciardi et al., 2007).
Collectively, the forces described above resulted in saturation of the United States with 76 billion opioid pills just between 2006 and 2012; no other country approached this level of opioid prescribing (Hingham, Horwitz, and Rich, 2019). In 2015, 97.5 million persons ages 12 and over—36.4 percent of the U.S. population (Hughes et al., 2016)—reported using prescribed pain relievers (hydrocodone, oxycodone, and morphine).
Regulatory Failure
When the FDA approved OxyContin in 1995, the drug had not been shown to be more efficacious or safe than the short-acting oxycodone that was then on the market. As noted, the claim promoted by Purdue was that OxyContin was less likely to lead to misuse and addiction because of its time-release formulation (NASEM, 2017, p. 18). In approving OxyContin, however, the agency overlooked substantial evidence against the effectiveness of this “extended-release” technology (Frydl, 2017). A recent report of the National Academies of Sciences, Engineering, and Medicine (2017, p. 264) points to limitations of the process for evaluating investigational drugs, particularly with respect to the approval of opioids:
For example, showing that a drug has substantial evidence of efficacy does not necessarily mean that the drug is more effective than currently
available therapies, or that the efficacy demonstrated is clinically meaningful…In addition, clinical trials sufficient to meet the FDA’s efficacy standard can be conducted in a brief, highly protocolized setting and often exclude many patients who would be expected to get the drug following its approval…Clinical trials could be designed with more robust follow-up periods or be prospectively powered to ensure that well-known side effects are adequately measured. However, the FDA bases its approval decision on the data provided by the manufacturer at the time of the NDA [New Drug Application] and does not require that trials of investigational drugs be conducted with particular characteristics.
The FDA’s regulatory authority continues following the initial marketing approval of a drug, and postapproval monitoring may require ongoing evaluation and timely communication with health care providers and the public. However, these actions take place against a backdrop of industry activities that promote the use of the drug to providers and patients (NASEM, 2017, pp. 364–365).
The DEA also plays an important role in regulating a large share of the country’s licit drug supply, including opioids (Frydl, 2017). But the Office of the Inspector General of the U.S. Department of Justice has noted the DEA’s slow response to the significant increase in the use and diversion of opioids since 2000: “DEA did not use its available resources, including its data systems and strongest administrative enforcement tools, to detect and regulate diversion effectively…[and] DEA policies and regulations did not adequately hold registrants accountable or prevent the diversion of pharmaceutical opioids” (U.S. Department of Justice [DOJ], 2019, p. i).
State licensing and monitoring boards also contributed to opioid overprescribing. In states that monitored physicians’ prescribing of opioids and other Schedule II drugs, deaths due to drug poisoning were lower. Alpert and colleagues (2019) argue that Purdue viewed as a barrier to entry state requirements that physicians prescribe opioids on triplicate forms that could be used to monitor possible fraud and overprescribing. They show that OxyContin distribution was 2.5 times greater in states without versus those with this requirement, and that as a result, drug overdose deaths increased more rapidly in the former compared with the latter states.
Insurance companies also could have done more to stop opioid abuse. Public and private insurers paid for prescriptions for many years without developing adequate checks to determine whether the prescriptions were appropriate. For example, Morden and colleagues (2014) document that nearly half of disabled Medicare beneficiaries received a prescription opioid in 2010, and half of those received six or more prescriptions.
The Surge in Heroin and Fentanyl
As policy makers, state health officials, and physicians became aware of the surge in prescription opioid addiction and diversion, policies and strategies were employed to control the misuse of opioids. These measures included instituting prescribing limits, monitoring prescribing to identify excessive levels, and implementing “pill mill” laws requiring providers to submit clinical documentation from medical records to support their prescribing of opioids (Kiang et al., 2019). As a result, prescribing began declining after 2010, and prescription opioids subsequently became less available and more expressive to buy “on the street.” Purdue also reformulated OxyContin into an “abuse-deterrent” formulation, but research shows that this reformulation was followed by a significant level of both residual misuse and switching to other drugs, particularly heroin (Cicero and Ellis, 2015). These forces created a “thick market” for heroin (Quinones, 2015), lowering its prices and introducing a new clientele to the drug. This new market, combined with the existing heroin client base, ushered in the second wave of the opioid overdose crisis, in which the consolidation of the heroin supply chain in Mexico and the much more widespread availability of heroin in the United States than in the past led to an increase in heroin overdose deaths.
The consolidation of the heroin supply chain in Mexico is an important part of this story. Mexican drug suppliers went from controlling 50 percent to 90 percent of the heroin market from 2005 to 2016 (Ciccarone, 2019). Quinones (2015) describes how small cells of poor rural farm boys from the tiny Mexican town of Xalisco, Nayarit, expanded their heroin business from California to small cities and towns throughout the United States in the 1990s and 2000s. Prior to 2000, U.S. heroin came primarily from four regions: southeast Asia, southwest Asia, Mexico, and Colombia. Mexico’s market domination was due in part to the DEA crackdown on heroin suppliers in Colombia. The disruption of the Colombian drug cartels created an opening for Mexican suppliers to provide heroin. The heroin from Mexico was more refined and more potent than the black tar heroin that preceded it and proliferated in the Northeast and Midwest (Quinones, 2015). Heroin also became cheaper and much more widely available than at any point in recent history.
The third wave of the opioid overdose crisis began in the early 2010s, when drug suppliers and dealers began increasingly adulterating heroin and other drugs (e.g., cocaine) with fentanyl and fentanyl derivatives. Fentanyl is cheap; very potent even in small quantities (50 times more potent than heroin); and because of its potency, easy to smuggle into the United States in smaller quantities than heroin. Even when consumed in small quantities, fentanyl increases the likelihood of drug overdose compared with heroin,
resulting in higher mortality rates. In March 2015, the DEA issued a nationwide alert regarding fentanyl, noting the surging number of overdose deaths associated with its use. According to the DEA, most fentanyl entering the United States is from China (U.S. Drug Enforcement Administration [DEA], 2016) and is much cheaper and more potent than Mexican heroin (Pardo et al., 2019).
Nearly 29,000 fentanyl-related deaths occurred in 2017, more than triple the number observed in 2015, when national alarms first began to sound (NCHS, 2019a). Fentanyl deaths surpassed those involving heroin in August 2016 and have continued to climb, even as overall overdose mortality began to level off. Relative to those in other regions of the country, people who consume heroin and other narcotics in the Northeast are at greater risk of consuming a product that has been adulterated with fentanyl because of that region’s proximity to shipping ports. The product may be “cut” multiple times on its way from the Northeast to Southern and Western distribution networks, thereby diminishing its potency along the way. This may explain in part why mortality associated with fentanyl shows a geographically heterogeneous pattern, concentrated in the Northeast (Monnat, 2019; Peters et al., 2020). The DEA also attributes this regional variation to the fact that black tar heroin is more popular in the Western United States, whereas white powder heroin is more popular in the East (DEA, 2016). It is easier to mix fentanyl with white powder heroin than with black tar heroin.
Attributing the rise of drug overdose deaths to misleading marketing and aggressive distribution of legal opioids and the ensuing widespread emergence of illicit opioids (heroin and fentanyl) in the United States is appealing because this explanation points to proximal factors, is conceptually plausible, and is supported by empirical evidence (and court documentation). One must ask, however, why some communities and sociodemographic groups are more vulnerable to an increase in the supply of opioids. Undoubtedly, saturation of the market with highly addictive and potent opioid painkillers was an essential spark for the massive increase in fatal drug overdoses over the past three decades. But it does not explain why rates of addiction and overdose are higher among certain population subgroups than others or why rates of overdose from other drugs, including methamphetamine, cocaine, and benzodiazepines, continue to climb.
Changes in Alcohol Supply
The rise in alcohol consumption has been linked to a relative decline in the price of alcohol; alcohol industry efforts to increase the times at which and number of places where people can consume alcohol; the development
and aggressive promotion of new alcoholic products, particularly to youth, young adults, and women; and weakening government oversight of alcohol (Freudenberg, 2014).
With the exception of the Prohibition era (1920–1933), the United States has historically had fairly moderate alcohol regulations relative to peer nations (Gruenewald, 2011). Except for raising the drinking age from 18 to 21 and enacting stricter laws regarding driving while intoxicated and the ways in which alcohol is advertised, the United States has trended toward less restrictive alcohol policies over the past several decades. As with prescription drugs, alcohol industry deregulation (e.g., relaxing days and times of sales, relaxing where alcohol can be sold, allowing home delivery and “cocktails to go”) and privatization have resulted in increased availability and affordability of alcohol (Freudenberg, 2014).
Between 2007 and 2017, the number of outlets selling alcohol (including both on- and off-premise sites), grew from 528,594 to 644,647—a 22 percent increase (Nielsen, 2018). Alcohol became less expensive (in real terms) than at any time in the past 60 years (Kerr et al., 2013b). Kerr and colleagues (2013b) calculated that the cost of one drink per day of the cheapest branded spirits declined from 4.46 percent of U.S. mean per capita income in 1950 to 0.29 percent in 2011.
New alcohol products have also been developed and promoted. Beginning in the late 1990s, the alcohol industry developed and began to heavily market sweetened and flavored alcoholic beverages (FABs)—also known as “alcopops,” flavored malt beverages, and “malternatives” (e.g., wine coolers, hard lemonade, alcoholic spring water)—to attract youth and women (Freudenberg, 2014). Expenditures on advertising across all FAB brands increased from $27.5 million in 2000 to $196.3 million in 2002 (Freudenberg, 2014), substantially increasing youth exposure to and consumption of these brands and products (Mosher, 2012). Members of the early 1980s birth cohort were in their late teens and early 20s during the early 2000s, so this group was beginning to drink regularly when the heaviest marketing of FABs occurred (Mosher, 2012). For a thorough review of contemporary alcohol industry marketing and lobbying practices and their association with increased alcohol consumption and alcohol-related health problems and mortality, see Freudenberg (2014).
While these supply conditions may be related to the increases in alcohol consumption that have occurred since the mid-1990s, they cannot explain why peak U.S. per capita alcohol consumption occurred during the mid-1970s to mid-1980s and was followed by a decline throughout the late 1980s and early 1990s (Haughwout and Slater, 2018). These trends raise questions about the potential role of demand.
Demand-Side Explanations
Susceptibility to substance abuse is influenced by individual/proximal factors (e.g., SES, psychological factors); community meso-level structures (e.g., family, peers, social environment); and macro-level structures (e.g., economic inequality, policies, corporate practices) (see Figure 6-1 in Chapter 6). Increases in substance-related mortality, while affecting all demographic groups and places, have been larger in some groups and places than others. Various meso- and macro-level structures have had varied impacts on different groups of people and places, making certain individuals more vulnerable to adopting harmful health behaviors and certain places more vulnerable to the infiltration of addictive opioids.
Scholars have offered a number of possible demand-related explanations for the surge in drug addiction and overdose seen over the past three decades and its particular impact on certain subpopulations and geographic areas. Some of these explanations focus on factors proximate to individuals—physical pain, mental illness, adverse childhood experiences (ACEs), and psychological distress or despair—and others on factors more structural and distal—macro-level economic and social changes. This section first provides an overview of conceptual models of addictive behaviors and then summarizes the evidence for these explanations.
Substance Use Disorders and the Underlying Causes of Drug and Alcohol Addiction
Conceptual models of addictive behaviors are useful in understanding why some individuals are more vulnerable to misusing drugs and alcohol. Underlying these models of addiction is the notion that individuals who become dependent on drugs or alcohol have lost control of their ability to use these substances appropriately. Five basic conceptual models attempt to explain addictive behaviors. These models focus on the moral, medical, psychological, sociological, and economic (rational) factors that drive those behaviors, factors that in reality often overlap (Clark, 2011).
The oldest model is the moral model of addiction, an archaic perspective developed by early classical theorists Cesare Beccaria and Jeremy Bentham. Under this model, an individual who becomes dependent on a substance is responsible for his or her behavior, for addiction is viewed as a rational, personal choice rooted in the morals of the individual. This choice is aimed at maximizing the individual’s pleasure and can be controlled through the perception and understanding of consequences. This conscious engagement in addictive behavior makes addiction “morally wrong,” and this behavior is associated with other immoral decisions and criminal activity. The
moral model thus encourages society to criminalize, regulate, and prohibit addictive behavior and to increase its consequences and costs to discourage it. This model is inconsistent with current clinical and biological thinking, and may lead to a language of addiction that stigmatizes individuals and impedes successful treatment (Fareed, 2020; Zgierska et al., 2020).
The medical model of addiction—the preferred model of the National Institute on Drug Abuse—defines it as a brain disease (Ozburn, Janowsky, and Crabbe, 2015). According to this model, addiction in a pathological sense stems from the genetic and neuroadaptation theory. This theory posits that addiction may be caused by certain genes that increase a person’s vulnerability to addiction, or neurochemical adjustments in the brain that lead to measurable tolerance and withdrawal. The medical model therefore focuses on the impact of drugs and alcohol on certain regions of the brain and the neurocircuitry that facilitates the impulsivity and compulsivity that produce the three stages of addiction: “binge/intoxication,” “withdrawal/negative affect,” and “preoccupation/anticipation” (craving) (Ozburn, Janowsky, and Crabbe, 2015).
Despite substantial research on biological mechanisms, the medical model has some limitations (Koob and Volkow, 2010; Volkow and Koob, 2015). This model tends to support interventions that disrupt the brain’s response to drugs and alcohol, and there have been some treatment successes. Yet despite these successes and the important evidence for genetic forces in addiction, this model fails to take into account social and cultural forces and the multiple triggering pathways that may lead to addiction, as well as the personal motivation and social support necessary for addiction recovery.
The psychological model focuses on addictive behaviors as a means of escape from negative emotional states caused by unmet psychological needs, implying that treatment must go beyond the addiction itself and address those needs. Unlike the moral model, the psychological model views addiction as the manifestation of motivation rather than loss of control (Khantzian, 1997). Motivation ties to self-efficacy, the belief in one’s ability to stop engaging in such behavior. People who experience addiction use cognitive and behavioral self-regulatory strategies to resist cravings. Like the medical model, the psychological model does not emphasize individual choice but highlights the influence of learned reinforcement on the development of such behaviors. Applying learning theory to addiction has robust clinical implications, such as the potential for teaching strategies for reducing addictive behaviors. Still, the psychological model does not account for the social and environmental context of a person’s experience with addiction.
The sociological model of addiction asserts that it is socially and culturally constructed through family, peers, culture, and other social influences.
Proponents of this model oppose the medicalization of social deviance, positing that it facilitates labeling of addictive behaviors based on one’s social status and the agenda of social control agents. For example, someone addicted to opioids is a patient, while someone addicted to heroin is a criminal, despite the similarities between the two substances. Along with social context, the psychological context of the drug or alcohol user is salient to the process of becoming an “addict.” That label becomes a core identity that furthers the performance of the associated behaviors, such that individuals behave like agents of the substance, lacking control over their own actions. Thus the sociological model suggests that effective interventions must consider the individual’s social and psychological context.
The economic or rational model suggests that drug or alcohol addiction is an individual choice based on the level of satisfaction these substances give the user. Not only do users receive contemporary satisfaction from using drugs or alcohol but their current use raises their satisfaction for their immediate subsequent use. This reinforcing phenomenon coupled with an increasing tolerance—that is, to receive same satisfaction, the user has to use more of the substance—results in a rational addiction (Becker and Murphy, 1988).
Looking at these five models, while there is certainly a sentiment in the nation that Americans have moved away from traditional values, the evidence does not suggest that the rise in substance-related mortality is associated with a decline in morality. Indeed, some of the states with the highest levels of religiosity are also those that have experienced the greatest increases in mortality due to drug poisoning and alcohol-induced causes (Norman, 2018). Rather, the committee posits that changes in psychological needs and social context are more likely contributors to the increased vulnerability of certain U.S. subpopulations (Sudhinaraset, Wigglesworth, and Takeuchi, 2016).
In general, substances with the potential for addiction or dependence are considered to be alcohol; tobacco; and a variety of drugs, licit and illicit. However, other substances are also regularly misused, an example being hydrocarbon toxicity (e.g., glue sniffing) (Tormoehlen, Tekulve, and Nañagas, 2014). In keeping with the taxonomy of the current Diagnostic and Statistical Manual of Mental Disorders, Fifth Edition (DSM-5), most substance addictions that rise to the level of clinical importance meet a common set of criteria and are called SUDs. The scientific, medical, and public heath literature on SUDs overall is robust and growing. An important problem, however, is that only a few and occasional surveys—particularly the important National Survey on Drug Use and Health (NSDUH)
and the National Epidemiologic Survey on Alcohol and Related Conditions (NESARC)—address the population prevalence of these disorders.11
In 2015, among persons receiving treatment for substance use in the past year, 22.4 percent reported misusing prescription pain relievers (Haffajee et al., 2019; Hughes et al., 2016). It is important to note, however, that people do not immediately become addicts in adulthood when a physician prescribes opioids. National data show that nearly three-quarters of individuals ages 18–30 admitted for substance use treatment began using before age 18, and 10.2 percent began at age 11 or younger. These findings suggest that preventing initiation of substance use in childhood and adolescence is important to preventing the development of SUDs later in life (Strashny, 2014).
In 2018, an estimated 21.2 million people ages 12 or over (i.e., about 1 in 13 people in the United States) needed substance use treatment, although only about 3.7 million people received any kind of treatment (Substance Abuse and Mental Health Services Administration [SAMHSA], 2019). Medications have been shown to be effective in treating opioid use disorder and reducing the risk of dying from an overdose, yet at most 20–40 percent of people with that disorder receive treatment. Access to providers who treat opioid use disorder can vary, with deadly consequences. For example, counties with high rates of mortality due to opioid overdose have fewer primary care providers who could prescribe medications used to treat the disorder (Haffajee et al., 2019). Adoption of Medicaid expansion was associated with a 6 percent lower rate of total opioid overdose deaths compared with the rate in nonexpansion states. Counties in expansion states had an 11 percent lower rate of death involving heroin and a 10 percent lower rate of death involving synthetic opioids other than methadone compared with counties in nonexpansion states, although an 11 percent increase was observed in methadone-related overdose mortality in expansion states (Kravitz-Wirtz et al., 2020).
The Role of Physical Pain
In addition to psychological predispositions to addiction, physical pain is another potential demand-side proximal explanation for the increase in SUDs and subsequent overdose. The level of physical pain among adults in the United States is high and may be rising. According to a report of the Institute of Medicine (IOM, 2011), about 100 million adult Americans, or about 40 percent of the U.S. adult population, experience chronic pain.
___________________
11 The most recent (and third) wave of NESARC was conducted in 2011–2012; previous waves were conducted in 2001–2002 and 2004–2005. The committee is not aware of plans to conduct a fourth wave of NESARC.
Using data from the Medical Expenditure Panel Survey, Gaskin and Richard (2012) found that in 2010, 70.3 million adults had joint pain (53.4 million had “arthritis” pain), and 22.6 million reported that this pain was severe. Millions also experience pain from injury, disease, or medical procedures. Some evidence suggests that there have been increases in physical pain over the past several decades. Case and Deaton (2015) found concurrent rising increases in reported levels of pain and declines in self-reported health and physical functioning among midlife adults (ages 45–54). Using 18 years of data from the Medical Expenditure Panel Survey, Nahin and colleagues (2019) similarly found that the proportion of adults reporting painful health conditions increased from 32.9 percent in 1997–1998 to 41.0 percent in 2013–2014. This finding may be attributable to an increase in anatomically localized physical pain syndromes per se, or to an increase in systemic conditions that have important pain manifestations.
In the most recent study of pain trends available to the committee, Zajacova, Grol-Prokopczyk, and Zimmer (forthcoming) examined the prevalence of joint, low-back, neck, migraine, and jaw/facial pain among adults ages 25–84 using the 2002–2018 National Health Interview Survey. They found a large escalation in pain prevalence among adults over this period, with overall reports of pain in at least one anatomic site increasing by 10 percent (from 49% in 2002 to 54% in 2018), representing an increase of 10.5 million adults experiencing pain. They also found that socioeconomic disparities in pain prevalence increased over this period. For example, whereas the odds of reporting any pain increased by 17 percent among those with a college degree, they increased by 40 percent among those who never attended college. Psychological distress and health behaviors were among the most important correlates of these trends.
Prior to the mid-1990s, adults with non-cancer-related pain would rarely have been prescribed opioids except for short-term needs (e.g., sickle cell crises, kidney stones, postoperative recovery). However, the prevalence of (and possible increase in) adults with painful chronic health conditions provided a new market for opioids. Among adults with severe pain, the use of strong opioids more than doubled from 11.5 percent in 2001–2002 to 24.3 percent in 2013–2014. In a recent study of adults ages 25–74 using data from the mid-1990s and early 2010s, Glei, Stokes, and Weinstein (2020) found that physical pain was linked more closely to the rise in the misuse12 of prescription opioids relative to other drugs. Disparities in pain management experienced by Blacks and Hispanics may have blunted and protected them from the overprescribing of opioids (Mossey, 2011).
___________________
12 “Misuse” is defined in this study as personal use in ways not prescribed or distribution of these drugs to others for whom they were not intended.
The Role of Mental Illness
Mental illnesses and SUDs are closely interrelated.13 About 1 in 4 people with a serious mental illness (SMI) have an SUD, and about 1 in 10 people with an SUD have an SMI (National Institute on Drug Abuse [NIDA], 2018). Thus even if they are not inextricably linked, SMIs and SUDs frequently overlap. It is widely believed, with important evidence, that SMIs and SUDs each can promote the progression of the other (NIDA, 2018).
An important consideration in understanding the onset and development of mental illnesses is their early onset relative to many chronic conditions of older ages. According to the American Psychiatric Association, 50 percent of mental illnesses begin by age 14 and three-quarters by age 24 (American Psychiatric Association, 2018). Many conditions destined to become fully manifest mental illnesses may develop slowly over the first two decades of life, and they rarely appear suddenly.
It has been observed for decades that persons with mental conditions are also more likely than others to have higher rates of physical/medical conditions. This literature has confirmed, for example, higher rates of back and neck pain (Viana et al., 2018), risk of arthritis (Aguilar-Gaxiola et al., 2016), and hypertension (Stein et al., 2014) among those with chronic mental conditions. In a review of mental health surveys from 17 countries, Scott and colleagues (2016) found a variety of chronic physical conditions occurring more commonly among those with mental disorders than in control populations. These findings may be related to why people with mental illness are more likely to misuse pain relievers. Among people with mental illness, 11.2 percent reported misusing prescribed pain relievers, compared with 3 percent of those with no mental illness. People with SMI were at even greater risk, with a 15.1 percent prevalence of misuse (Hughes et al., 2016).
The high cost of psychiatric care and the related costs of mental health care insurance are important barriers to access to mental health care, resulting in substantial treatment deficiencies and high rates of unmet need (Rowan, McAlpine, and Blewett, 2013; Walker et al., 2015). A significant proportion of Americans also lack geographic access to psychiatric and other mental health services, and many U.S. counties have no psychiatric services at all (Byers et al., 2017; Kakuma et al., 2011).
The ability to relate trends in adult mental illness to other important health and functional characteristics, such as substance use, disability, employment status, and mental illness–related mortality, would be of great value. Unfortunately, ongoing population surveys and other nationwide surveillance using comprehensive indicators of adult mental illness are
___________________
13 See also Chapter 8 for a discussion of the relationship between mental illness and suicide.
scant. The NSDUH collects data annually on substance misuse, SMI, psychological distress, and suicidal ideation. However, it does not include other commonly diagnosed mental illnesses (bipolar disorder, phobias, personality disorders, eating and gambling disorders, schizophrenia and other psychoses). Moreover, the data are cross-sectional, making it difficult to determine the direction of causality between substance use and mental health disorders. Several national surveys do include nondiagnostic indicators of mental health, such as self-reports of depressive symptoms, anxiety, depression, panic attacks, and psychological distress. Such studies with longitudinal data enable researchers to examine how changes in mental health are related to changes in substance use and suicidal behavior. However, the quality of the data is often hampered by the subjective nature of the questions and the lack of consistency in repeated measures over time. For example, a recent systematic review on this issue, covering a variety of countries, suggests that there is little evidence for substantial recent changes in rates of adult mental illness (Richter et al., 2019). Conversely, using 10 years of national health care claims data, Brignone and colleagues (2020) found increases of 37 percent, 94 percent, and 170 percent in diagnoses related to alcohol, drugs, and suicidal ideation/behavior, respectively, from 2009 to 2018. An important report on the frequency of and trends in various mental illnesses was produced for the United States for the period 1990–2016 (U.S. Burden of Disease Collaborators, 2018), but a full specification of the range of mental conditions was not available.
Adverse Childhood Experiences
ACEs include physical, sexual, and emotional abuse and parental divorce, domestic violence, incarceration, substance misuse, and mental illness. These experiences are prevalent in the U.S. population. In a study representing nearly 215,000 adults in 23 U.S. states, Merrick and colleagues (2018) found that nearly two-thirds had experienced at least one ACE, and a quarter reported three or more such experiences. Other studies using both clinic-based and national samples have found similar prevalence levels, ranging from half to 69.1 percent of the U.S. adult population (Anda et al., 2006; Brown et al., 2009; Campbell, Walker, and Egede, 2016; Choi et al., 2017; Monnat and Chandler, 2015).
Since Felitti and colleagues (1998) published their landmark ACE study (also known as the CDC-Kaiser ACE study) showing a relationship between childhood abuse and household dysfunction and the leading causes of death among U.S. adults, hundreds of studies across various samples have confirmed the relationship between ACEs and multiple adverse health outcomes across the life course (Hughes et al., 2017; Kalmakis and Chandler,
2015; Larkin, Shields, and Anda, 2012; Norman et al., 2012). Using the longitudinal data from the CDC-Kaiser ACE study, Brown and colleagues (2009) tracked 17,000 individuals who were ages 18 or older in 1995–1997 over 20 years and found that the odds of premature mortality at 20-year follow-up were significantly higher among those who had had ACEs, and that those with six or more ACEs died nearly 20 years earlier, on average, than those without ACEs. This study did not assess differences in mortality by cause. Using these same data, however, Brown and colleagues (2010) found a graded relationship between ACE score and smoking-attributable lung cancer mortality.
To the committee’s knowledge, no studies have examined the relationship between ACEs and substance-related mortality. However, numerous studies (see systematic reviews by Hughes et al., 2017; Kalmakis and Chandler, 2015) document strong relationships between ACEs and drug and alcohol misuse, age of initiation, high-risk misuse (e.g., injection drug use), and nonfatal overdose, all of which are risk factors for fatal drug poisoning and alcohol-related death. Additional studies show strong associations between ACEs (both individually and in a dose-response relationship) and suicidal ideation and attempts in adulthood (Afifi et al., 2009; Dube et al., 2001). As a result, ACEs are now well known to be highly salient risk factors for developing mental illnesses and SUDs later in life (Anda et al., 2006; Campbell, Walker, and Egede, 2016; Choi et al., 2017; Dube et al., 2002, 2003; Loudermilk et al., 2018; Merrick et al., 2017, 2018; Stein et al., 2017). Many of these studies show strong dose-response relationships; for each additional ACE, the odds of mental illnesses and SUDs in adulthood increase. ACEs have both life-course and multigenerational effects; children with parents who misuse substances are more likely than their peers to develop mental health disorders and to misuse alcohol and drugs themselves in adulthood (Anda et al., 2002). Traumatic experiences in childhood lead to multiple changes in brain structure and function, self-regulation, and stress response that serve as pathways to risky substance use behavior throughout life (CDC, 2019a; Jones, Merrick, and Houry, 2020).
Research on temporal trends in ACE prevalence is sparse, so it is also difficult to determine whether the changes observed in working-age drug- and alcohol-related mortality can be attributed to a posited increase in ACE prevalence. Data limitations also have resulted in a paucity of research on geographic differences in the prevalence of ACEs among U.S. adults. The Behavioral Risk Factor Surveillance System (BRFSS) is the only ongoing national dataset that includes responses to questions about both ACEs and health behaviors. However, not all states include the ACE module in their annual BRFSS administration, and starting in 2015, county identifiers were no longer included in the publicly available BRFSS data.
The Role of Despair
Several scholars have appealed to an argument first made popular by Case and Deaton’s (2015) research that the surge in drug poisoning in the United States stems from increased demand resulting from a rising tide of despair, particularly among less-educated working-age adults (Cherlin, 2014; Dasgupta, Beletsky, and Ciccarone, 2018; Graham and Pinto, 2019; Graham, Pinto, and Juneau, 2017; Jalal et al., 2018; Monnat, 2018, 2019; Monnat et al., 2019; Silva, 2019; Stein et al., 2017b). The term “deaths of despair” was first used by a journalist to describe Case and Deaton’s findings (Khazan, 2015). Case and Deaton themselves indicate that when they proposed the term, they were choosing a label, not an explanation (Case and Deaton, 2018). The term is not a clinical diagnosis, but more a layperson’s classification prompted by the fact that the rise in mortality among working-age adults was due not to the leading causes of death (i.e., heart diseases, cancer, stroke, or diabetes) but to drug use, drinking, and suicide, things that people who feel good about their lives do not tend to do. Since that article was published, some scholars have adopted the term, while others have discouraged its use because it lacks clinical justification: “despair” denotes hopelessness, a feature and a correlate of many mental health disorders but not one in itself. Beyond the label, researchers have been actively examining whether there are causal links between adverse social (e.g., economic, community, family) conditions that could result in feelings of despair and in mental health conditions and SUDs.
Examining mortality trends among Whites ages 45–54 without a college degree over the period 1999–2013, Case and Deaton (2015, 2017) show that the main causes of death driving the increase in mortality in this population were drug and alcohol poisoning, suicide, and chronic liver diseases and cirrhosis. They also provide evidence of increasing morbidity, reporting concurrent declines in self-reported health, mental health, and ability to conduct activities of daily living and increases in chronic pain and inability to work.
Case and Deaton’s 2015 article resulted in massive media coverage and public attention (Cassidy, 2015; Douthat, 2015; Fox News, 2017; Krugman, 2015; Rugaber, 2017; Saslow, 2016; Tavernise, 2016), as well as commentary by scientists (Auerbach and Miller, 2018; Diez Roux, 2017; Erwin, 2017; Scutchfield and Keck, 2017). The notion that the recent rise in midlife mortality was due to increasing psychological distress among working-class Whites accorded with economic, cultural, and societal trends in the United States. In their subsequent publications (2017, 2020), Case and Deaton show that mortality and morbidity among working-age Whites without a college degree continued to climb through the late 2010s. They expand their potential explanations for these trends by describing how the
life circumstances of less-educated Whites have deteriorated over recent decades. They cite several examples, including the deterioration in wages, declining labor force participation, and declines in job quality among those without a college degree; the rise in family breakdown, including divorce, nonmarital childbearing, and single parenthood; changes in religious practices; and the decline in union representation. Many of these factors are features of largely working-class communities where manufacturing jobs disappeared long ago and where unemployment has become a permanent state. At one time, these communities, often buoyed by thriving industries and busy plants or mines, were characterized by economic and family stability; unskilled and less-educated workers could find steady work with decent benefits, and social mobility was a possibility. These same communities are now marked by disconnected families, social disorganization, and high unemployment; hopelessness and despair abound among individuals, families, and the community at large, and many youth see no future. The next section elaborates on the role of these structural changes in mortality trends.
The collapse of local economies, social institutions, and family structures experienced by working-class Whites since the 1990s appears similar to the decline experienced by their Black counterparts in the 1970s–1990s. Both declines were accompanied by lethal drug use. As alluded to earlier, the crisis among Blacks was treated primarily as a criminal justice problem, while the crisis among Whites has been treated primarily (though not exclusively) as a public health crisis—a contrast often cited as an example of systemic racism (see Chapter 11). These distinctions aside, both crises may have been fueled by despair brought on by changing economic, social, and family conditions that disproportionately impacted individuals without a college degree (Silva, 2019; Wilson, 1987).
Theoretically, “despair” or other forms of psychological distress may help to explain substance-related deaths because they reflect behaviors of individuals who are potentially depressed, distressed, and without hope for the future (Baines, Jones, and Christiansen, 2016; McLean, 2016). Of course, how to define and measure despair in research is a key challenge. A formal definition of “despair” as a noun is “the complete loss or absence of hope” or “a cause of hopelessness”; the verb “to despair” means “to lose or be without hope,” and “to lose all hope or confidence” (Merriam-Webster, 2020; Lexico.com, 2020). Recent research has attempted to examine trends in psychological distress and despair-related behavior. Here the challenge of how to define “despair” is important because there are no well-developed scales or validated measures of despair or hopelessness (Goldman, Glei, and Weinstein, 2018; Muennig et al., 2018). As a result, research examining trends in despair has focused on measures of negative emotions, including sadness, hopelessness, worthlessness, and depression, and positive
emotions, such as trust, happiness, fulfillment, optimism, and life satisfaction (Gaydosh et al., 2019; Goldman, Glei, and Weinstein, 2018; Graham and Pinto, 2019; Graham, Pinto, and Juneau, 2017; Graham, Laffan, and Pinto, 2018; Muennig et al., 2018).
In the most comprehensive roadmap for examining the relationship between despair and health outcomes the committee could find, Shanahan and colleagues (2019, p. 855) propose that despair is a multidimensional concept manifesting in cognitive, emotional, behavioral, and biological domains, and that it goes beyond the individual to arise in and spread through social contexts and communities. According to these authors, cognitive despair includes “thoughts indicating defeat, hopelessness, guilt, worthlessness, learned helplessness, pessimism, and limited positive expectations for the future.” Emotional despair includes “feelings of excessive sadness, irritability, hostility, loneliness, anhedonia, and apathy.” Behavioral despair involves maladaptive attempts to cope with distress and consists of “risky, reckless, and unhealthy acts that are self-destructive and reflect limited consideration of the future (e.g., high-risk sexual behaviors, gambling, self-harm, reckless driving, excessive spending, criminal activity, smoking, substance use, low physical activity).” Finally, biological despair occurs when “the body’s stress-reactive systems no longer function homeostatically and show signs of dysregulation or depletion, which constitutes a biological correlate of, and sometimes a basis for, cognitive, emotional, and behavioral despair.”
The committee could find no study examining empirically the relationship between all of these domains of despair and substance use or drug-related mortality, or investigating the causal relationship between changes in psychological well-being and changes in substance use or drug-related mortality. However, there is ample empirical support for the hypothesis that proxies for despair (e.g., hopelessness, sadness, worry) are connected to drug use. For example, in a study designed to validate the relationship between various personality scales and substance use, Woicik and colleagues (2009) found that the Beck Hopelessness Scale (Beck et al., 1974) was significantly associated with drug use among adults. In a national study of college students, self-reported feelings of hopelessness, sadness, and depression were associated with significantly greater odds of nonmedical prescription opioid use (Zullig and Divin, 2012). In a qualitative study conducted in McKeesport, Pennsylvania, respondents referenced the hopelessness of the area and its lack of opportunity as drivers of the use of heroin (McLean, 2016). Among a sample of adult patients in a large emergency department in Flint, Michigan, Bohnert and colleagues (2018) found that 26 percent of patients with any history of overdose reported that they wanted to die or did not care about risks. And in research based on well-being metrics in the Gallup Healthways survey, Graham and Pinto (2019) found a strong
association among lack of hope; high levels of worry; and rising rates of drug, alcohol, and suicide mortality among lower-educated Whites.
Several studies, moreover, have found evidence of worsening psychological health among U.S. working-age adults. Using self-report data from the 1993–2019 BRFSS surveys, Blanchflower and Oswald (2020) found that the proportion of the U.S. population in extreme distress (measured as reporting major mental and emotional problems in all 30 of the past 30 days) rose from 3.6 percent in 1993 to 6.4 percent in 2019. Among low-educated middle-age Whites, the percentage more than doubled, from 4.8 percent to 11.5 percent.
Gaydosh and colleagues (2019) used data from the National Longitudinal Study of Adolescent to Adult Health (Add Health) to examine trends in a young working-age cohort (ages 32–42) who had been followed from adolescence in 1994 to the beginning of midlife in 2017. They found that developmental patterns of depressive symptoms, suicidal ideation, heavy drinking, and drug use were generally similar across all racial/ethnic, educational, and geographic subgroups, with recent rises in these adverse outcomes beyond age 30 (which the cohort reached in approximately 2010). These findings suggest that all subgroups of younger cohorts are experiencing some measure of psychological distress, and that distress appears to be arising earlier in the life course.
Goldman, Glei, and Weinstein (2018) examined changes in despair-related feelings and health among Whites from the mid-1990s to early 2010s in the Midlife in the United States (MIDUS) Study, focusing in particular on socioeconomic subgroups (they lacked sufficient data to stratify their results by race). They found a decline in psychological health in this population over the period, a decline that was steeper among those of lower SES. Given the broad age range in MIDUS (25–74), they were able to document similar declines in psychological health across age groups, including those ages 30, 40, 50, and 70. They concluded that trends of worsening psychological health are a broad-based phenomenon. In commenting on this analysis, Cherlin (2018) expresses some doubt about whether the findings support the idea of growing despair in the United States. He notes that among low-SES Whites, the greatest declines in psychological health occurred for indicators of “positive affect” (feeling cheerful, in good spirits, extremely happy, calm and peaceful, satisfied, full of life, life satisfaction). “Negative affect” (so sad nothing cheers you up, nervous, restlessness, hopeless, everything was an effort, worthless) showed smaller differences by SES. Moreover, scales of psychological well-being, which Cherlin argued were better measures of despair, showed weak and insignificant SES gradients. Overall, Cherlin suggests that a rising tide of despair is probably an overstatement based on the MIDUS data, concluding that trends in generic happiness, sadness, and life satisfaction differed by SES more so
than trends in despair-related psychological and social well-being. Nonetheless, he acknowledges that even if a “rising tide of despair may be an overstatement,” the concentration of declining psychological health among individuals of lower SES is troubling (Cherlin, 2018, p. 7177).
Muennig and colleagues (2018) make the case for a longer-term trend of worsening psychological health in the United States since the early 1980s that spanned demographic groups. Using data from the General Social Survey 1983–2012, the authors examined trends in measures of psychological well-being in the United States, including self-reported happiness and trust in others, whether people tended to be fair, whether parents had a better standard of living, and frequency of sex. Compared with similar data from Australia on the happiness and trust measures, they found a greater decline in overall well-being in the United States, especially toward the late 1980s. They similarly noted declines in subjective ratings of physical and mental health from the BRFSS. Based on their exploratory analysis and the prevailing literature, they concluded that there has been a long-term trend of increasing mistrust and loneliness and worsening mental and physical health across all age, racial/ethnic, and SES groups (Muennig et al., 2018). While Muennig and colleagues discount the argument that recent changes in despair are related to the recent rise in midlife mortality, they do provide evidence of longer-term trends in both declining health and worsening psychological well-being in the United States, suggesting a potential long-term connection between such trends (consistent with arguments made by Case and Deaton, 2017, 2020).
In a special issue of AJPH Rural Health titled The Epidemic of Despair among White Americans (Stein et al., 2017b), researchers consider differences in drug, alcohol, and suicide deaths by metro status to determine whether these deaths were primarily a rural phenomenon linked to the despair hypothesis. They report that increased death rates from 1999 to 2015 were largely among White populations outside of large urban areas and that most increases were attributable to suicide, accidental poisoning, and liver disease. Although the study design was not causal, they conclude that the rise in mortality in these nonurban areas was caused primarily by harmful coping behaviors related to underlying social and economic factors in these communities, consistent with the despair hypothesis of Case and Deaton. As noted earlier in this chapter, drug poisoning mortality rates have risen in metro and nonmetro areas alike and across all racial/ethnic groups (to varying degrees) since the early 1990s.
There has been pushback against the argument that despair is a strong explanation for the rise in working-age mortality and against grouping drug- and alcohol-related and suicide deaths in a composite “despair” classification. Major critiques include, first, that most of the increase in working-age mortality since the 1980s was due to drug poisoning, with
suicide and alcohol-related causes contributing negligibly to either the increases for most working-age groups (Masters, Tilstra, and Simon, 2017) or the increases in educational disparities in life expectancy (Geronimus et al., 2019). A second critique is that increases in the three causes of death (drugs, alcohol, and suicide) have varied by time, geography, and demographic group, raising skepticism that they could share a single underlying cause such as despair. Third, many of the hypothesized social forces (discussed in the next section) that would lead to increases in despair predated observed mortality rate increases by several decades (Ruhm, 2021). Finally, non-Whites (particularly Blacks) in the United States have historically had much more reason than Whites to experience despair (because of economic disadvantage and systemic racism), yet racial/ethnic minorities fare better on despair-related measures and experienced comparatively smaller increases in drug poisoning during the period of observation and no or only very small increases in alcohol-induced deaths and suicides (Diez Roux, 2017; Ruhm, 2021).
Various scholars have examined data on mortality trends over time similar to the data analyzed by Case and Deaton, but taking a broader view by expanding the timeframe; the ages of death, to include both younger (25–45) and older (45–65) ages; and the causes of death, and by examining trends by gender, race, ethnicity, and education (Geronimus et al., 2019; Ho, 2017; Masters, Tilstra, and Simon, 2017, 2018; Stein et al., 2017b). Masters, Tilstra, and Simon (2017), for example, examined trends in death rates during 1980–2013 for White men and women ages 45–54 and found that recent increases in extrinsic mortality were driven by rapid increases in drug-related mortality, whereas the contributions of chronic liver disease and suicide to mortality levels had been fairly stable for the past 30 years. They also found important gender differences in which women had experienced greater increases in recent mortality compared with men. They argue that these findings are inconsistent with the despair argument as the explanation for rising White midlife mortality. In a 2018 study, these authors examined mortality rates among younger and middle-age Whites and decomposed trends into period- and cohort-based variation (Masters, Tilstra, and Simon, 2018). They document the rise in drug-related deaths for younger- and middle-age Whites as a period-based phenomenon consistent with increases in opioid exposure rather than a rising tide of despair among more recent birth cohorts.
It is important to note, however, that Masters and colleagues did not disaggregate trends by educational attainment, which would be essential for undermining Case and Deaton’s cohort thesis. As Case and Deaton (2017, 2020) show, nearly all of the increase in drug poisoning over the prior three decades was among those without a 4-year college degree. While the rates increased slightly among those with a bachelor’s degree, these increases
pale in comparison with the surge in drug overdoses and other “deaths of despair” among Whites without a 4-year college degree. It is among the less-educated group of Whites that Case and Deaton (2020) show that the risk of dying from drugs, alcohol, and suicide increased with each subsequent birth cohort. For example, they found that among those ages 45 without a bachelor’s degree, the birth cohort of 1960 faced a risk 50 percent higher than that of the cohort born in 1950, and the cohort of 1970 faced a risk more than twice as high. At any given age, later birth cohorts had higher drug mortality rates than their earlier counterparts. It is only among the more highly educated (those with a bachelor’s degree) that Case and Deaton found no or only very small cohort effects (with each cohort dying along the same age profile). They found a similar lack of a cohort pattern among Blacks both with and without a 4-year college degree.
Geronimus and colleagues (2019) examined years of life lost by sex and education among Whites and Blacks ages 25–84 from 1990 to 2015. They found that drug overdoses, but not suicides or alcohol-related deaths, contributed substantially to growing educational inequities in life expectancy among White males and, to a lesser extent, White females. As a result, they caution against combining drug, alcohol, and suicide deaths into a composite despair-related category and suggest that the popularization of the despair hypothesis threatens to divert attention from ongoing racial/ethnic health inequities, as well as from other causes of death that have contributed to widening educational disparities, including cardiovascular diseases, cancers, and other internal causes.
In sum, researchers have used “deaths of despair” both as a blanket term to categorize deaths from drugs, alcohol, and suicide and as a potential explanation for the trends in substance-related mortality presented in this chapter, as well as the trends in suicide presented in the next chapter. Researchers disagree on the merits of both of these uses of the concept. The hopelessness signified by despair is a feature of depression and other affective disorders but is not itself a formal mental health diagnosis. There are also challenges with measuring despair and establishing causality. Despair is the result of changes in one’s long-term outlook on life that go beyond fluctuations in employment, wages, and other economic indicators. It is also about hope and expectations, about perceived negative changes in the character and nature of communities that impact all social institutions and erode individuals’ outlook for themselves and their children (Blacksher, 2018; Marsh, 1987; Silva, 2019). While the committee could find no causal studies on the effects of changing psychological health on U.S. substance use and mortality trends, substantial research shows that psychological health has worsened among U.S. working-age adults. There is also empirical evidence that proxies for despair, such as hopelessness, sadness, and worry, are associated with substance use. Ultimately, measuring despair
and determining causality remain key challenges for understanding the true role of despair in recent mortality trends. Qualitative research, which provides compelling evidence for the role of increasing despair in substance misuse and overdose, can offer insights for demographers, economists, and epidemiologists who aim to develop and test strong measures of despair. Furthermore, there is a need to integrate the despair hypothesis with the supply-side story. For example, to what extent did the increase in despair “prepare the field” so that the introduction of potent and highly addictive opioids could take root? Despair may be an important part of a “perfect storm” of conditions under which drug overdose deaths rose massively in the United States during the period encompassed by this study.
Macro-Level Economic and Social Change
Macro-level economic and social changes have been posited as being among the upstream factors that have given rise to despair among working-age adults without a college degree. Slow, long-term structural changes and stressors to the U.S. economy, along with unexpected shocks (e.g., the Great Recession), have had differential effects on population subgroups and geographic areas. These trends may explain in part the geographic patterns in drug poisoning mortality discussed in Chapter 4, as well as those affecting other health outcomes discussed later in this report.
Macro-level economic trends and policy changes have resulted in prosperity in some places (e.g., high-tech and finance-dominant urban hubs) and decimation in others (Appalachia, the former Industrial Belt). The distribution of industry and occupations is uneven across the country, with some communities more vulnerable than others to particular types of downturns. In particular, industries that were traditionally the source of high-wage jobs for non-college-educated adults have been unable to sustain those jobs. Competition from lower-wage workers abroad, the introduction of labor-saving technologies at home, and decreased demand for products and services (e.g., tobacco, domestic steel) have lowered the demand for high-wage blue collar jobs (Brown and Schafft, 2018; Lichter and Schafft, 2016). What were once well-paying production jobs (mining, manufacturing) disappeared in the industrial heartland, while high-wage, high-skill service-, finance-, and technology-based employment became concentrated in a small handful of urban cores (Bailey, Jensen, and Ransom, 2014; Brown and Swanson, 2003; Lobao, 2014; Peters, 2013; Smith and Tickamyer, 2011). The declines in employment opportunities and job quality led to an outmigration of the “best and brightest” young adults from those communities seeking opportunities elsewhere (Burton et al., 2013; Carr and Kefalas, 2009; Peters, 2012; Slack, 2014). Once-vibrant communities were then left with a disproportionate share of low-wage, low-skill, and often less healthy
(or disabled) workers who found themselves with limited opportunities in the midst of closed plants and mines and empty retail establishments. The end result has been to intensify the disproportionate geographic clustering of multigenerational economic distress in many parts of the United States.
The geographic distribution of economic decline, the loss of manufacturing and mining jobs, the decline in wages for blue collar workers, and the rise in poverty in some communities all correspond to the recent surge in drug deaths (Iceland and Hernandez, 2017; Saez and Zucman, 2016; Thiede, Kim, and Valasik, 2018) and other working-age deaths in geographic areas and populations discussed in Chapter 4. The collapse of local economies can contribute to collective frustration and hopelessness, lower tax bases, community disinvestment, infrastructural decay, family disintegration, crime, and substance misuse (Brown and Swanson, 2003; Carr and Kefalas, 2009; McLean, 2016; Sampson and Groves, 1989; Smith and Tickamyer, 2011).
Moreover, rising economic distress has intersected with rising family distress and marital dissolution and long-term demographic trends of lower marriage rates, increasing single-parent families, and increasing multiple-partner fertility (Burton et al., 2013; Child Trends DataBank, 2015). Collectively, these factors may mean that growing shares of the U.S. population are feeling isolated, disconnected, unstable, and without purpose or meaning in their lives.
While the direction of causality is debatable, substantial literature shows strong associations between economic distress and poor mental health and substance misuse (Frasquilho et al., 2016; Galea, Ahern, and Vlahov, 2003; Hempstead and Phillips, 2015; Kaplan et al., 2015; Kerr et al., 2017; Monnat, 2018; Pierce and Schott, 2020). The qualitative research has been especially strong in this regard. For example, sociologist Victor Tan Chen (2015) interviewed laid-off automotive workers after the General Motors and Ford plant closures of the Great Recession. After losing their well-paying jobs on the assembly lines, which many had held for years, they found themselves in an unfriendly economy that favored high education and connections. Interviewees expressed feelings of failure, apathy, despair, and self-blame, and many had turned to substances to cope. Similarly, in her study of people with heroin addiction in the deteriorating mill city of McKeesport, Pennsylvania, McLean (2016) concluded from her interviews that deindustrialization, the lack of employment opportunities, and the outmigration of businesses and people had created an atmosphere that was vulnerable to the influx of heroin. Her interviewees cited feelings of hopelessness and social isolation related to the lack of economic activity in their communities as a motivation for their drug use (McLean, 2016). Drawing on fieldwork and in-depth interviews, Jennifer Silva explored how economic decline was experienced by working-class Whites, Blacks, and
Hispanics living in rural Pennsylvania. In a presentation to the committee in October 2019, she described how—in a context in which family ties are fragile, opportunities for mobility seem scarce, and social safety nets have diminished—her respondents often had turned to drugs, alcohol, and even food to cope with life’s disappointments, the lack of economic opportunity, and hopelessness about the future.
Several quantitative studies have used objective measures of economic and social decline as indicators of place-level despair to examine associations between economic conditions and drug fatality rates. These studies have generally examined short- or medium-term economic change (i.e., since the early-2000s or Great Recession effects). Analyzing county-level mortality data for 1999–2014 and emergency department utilization data for 2000–2013 for 20 states, Hollingsworth, Ruhm, and Simon (2017) found that as the county unemployment rate increased by 1 percentage point, the opioid death rate rose by 3.6 percent, and emergency department visits for opioid overdose increased by 7.0 percent. Krueger (2017) found that, compared with working men, working-age men not in the labor force experienced notably lower levels of emotional well-being, derived relatively little meaning from their daily activities, and were more likely to feel pain and take pain medication daily (Ahmedani et al., 2017). Taking advantage of differential exposures to trade liberalization resulting from Congress’s granting of Permanent Normal Trade Relations (PNTR) status to China in 2000, Pierce and Schott (2016) found an increase in mortality due to drug poisoning, alcohol, and suicide. Shifting a county from the 25th to the 75th percentile of exposure to PNTR was associated with an increase in the drug poisoning rate of 2 to 3 deaths per 100,000 population each year after the policy was instituted, a significant share of the average mortality from drug overdoses during the period 1999–2013. This increase in drug-related mortality was observed across a large portion of the working-age population (most age groups between 20 and 54). However, the association was observed only among Whites and not other racial/ethnic groups.
Using data for 1999–2016 from 112 counties in 30 commuting zones primarily in the South and Midwest, Venkataramani and colleagues (2020) found that automotive plant closings were associated with opioid mortality rates. Five years after a plant closure, opioid mortality rates had increased 85 percent more in exposed counties than in similar counties that did not experience a plant closure. The association was largest among working-age White males. Betz and Jones (2018) present evidence that growth in industries more likely to hire low-skilled workers was protective of overdose deaths, particularly for rural White males. However, they also found that the economic improvements in low-skill industries appeared to protect Blacks and women against opioid overdoses.
Very little research concomitantly examines the roles of both economic
factors and family composition in place-level variation in drug mortality. Using cross-sectional county-level data, Monnat (2018) found that various measures of economic and family distress (including rates of poverty, unemployment, disability, low educational attainment, public assistance, divorce/separation, and single-parent families) all were associated with higher drug mortality rates, after controlling for racial/ethnic and age composition, metropolitan status, state-level fixed effects, and opioid prescribing rates (Monnat, 2018, 2019; Monnat et al., 2019).
Other research suggests that the relationship between drug overdose rates and economic decline may vary depending on the specific drug being considered. Monnat and colleagues (2019) found high rates of prescription opioid overdoses and overdoses involving both prescription and synthetic opioids to be clustered in more economically disadvantaged counties with larger concentrations of service industry workers. Counties with high rates of heroin overdoses were more urban, had larger concentrations of professional workers, and were less economically disadvantaged. Peters and colleagues (2020) examined drug overdose rates for specific opioids in 2002–2004, 2008–2012, and 2014–2016. They identified three distinct opioid epidemics (prescription opioids, heroin, and prescription–synthetic opioid mixtures) and one syndemic14 involving multiple opioids and other drugs. They found that counties with prescription-related epidemics had been “left behind” in the economic restructuring that occurred during the 1970s and 1980s. These communities were less populated and more remote, were older and mostly White, had a history of substance use, and were former farm and factory communities that had been in decline for several decades. Overdoses in these places exemplify the “deaths of despair” narrative. By contrast, counties with high rates of heroin overdose and those classified as “syndemic” counties tended to be more urban, connected to interstates, more racially diverse, and in general more economically secure. However, the counties with the highest drug overdose rates tended to be characterized by a dual economy in which some workers had good high-skilled and decent-paying jobs, and others had low-skilled and low-paying jobs. Blue collar employment had been declining in these counties since the 1980s. The authors conclude that the overdose crisis in these largely urban areas followed the path of previous drug epidemics, affecting the disadvantaged subpopulation that had been left behind rather than the entire community.
___________________
14 “A syndemic, or synergistic epidemic, is more than a convenient portmanteau or a synonym for comorbidity. The hallmark of a syndemic is the presence of two or more disease states that adversely interact with each other, negatively affecting the mutual course of each disease trajectory, enhancing vulnerability, and which are made more deleterious by experienced inequities” (The Lancet, 2017).
Whereas the studies summarized above examined place-level objective measures of economic change and distress, Glei and Weinstein (2019) show that subjective measures of economic distress, such as financial strain, perceived intergenerational financial disadvantage, and current work uncertainty, are better predictors of drug misuse. They conclude that the rise in drug abuse among working-age adults may relate to perceived economic distress that is not captured by standard objective measures. This conclusion is consistent with one drawn by Jennifer Silva in her presentation to the committee, that “people’s experiences of the world, whether they make sense, can have an impact on their lives because they feel their stories as true.” It is also consistent with the findings of a recent cohort study by Muller and colleagues (2020). Using data from the High School and Beyond study for 11,680 males who were in high school during the 1980s and 2015 mortality data from the National Death Index and the Social Security Death Index, the authors found higher rates of suicide and drug poisoning among men who had planned to work in occupations that declined during the 1980s and 1990s. They conclude that men whose occupational expectations were unmet because of labor market declines were at higher risk of death from suicide or drug poisoning relative to men with different occupational expectations.
Some of the studies discussed above found drug-related mortality effects of economic decline/distress for Whites but not Blacks or Hispanics (Hollingsworth, Ruhm, and Simon, 2017; Pierce and Schott, 2020). This finding might call into question the explanatory power of economic decline for drug mortality trends, given that Blacks and Hispanics have long faced more precarious economic conditions relative to Whites. Alternatively, it may suggest that Whites have been less resilient in the face of the economic shifts of the past several decades, or that Blacks and Hispanics cope differently with precarious economic circumstances relative to Whites. Or it may suggest that there is a floor effect on the impact of economic decline, with Blacks and Hispanics having seen the market for their blue collar workforce decline decades earlier (Assari, 2016; Blacksher, 2019; Cherlin, 2019).
Other research has found no or only limited evidence of the relationship between short- or medium-term economic decline and drug overdoses. Currie, Jin, and Schnell (2019) concluded that the relationship between employment and opioid prescribing rates is weak and that trends in employment do not explain the rise in opioid prescribing. Dow and colleagues (2019) found no association between the minimum wage and the Earned Income Tax Credit and drug mortality. Ruhm (2018b) found that, after controlling for various demographic and geographic variables, changes in economic conditions (including changes in the unemployment rate and import exposure) explain less than one-tenth of the observed
increase in drug deaths occurring between 1999 and 2015, and even less of the growth in opioid overdose rates. In a response to Ruhm’s critique, however, Case and Deaton (2018) note that Ruhm looked only at medium-term rather than long-term changes in economic conditions. Subsequently, examining the impact of medium-term economic changes on drug mortality and the correlation between county-level economic downturns and drug mortality, Ruhm (2019) found that drug mortality rates did increase more in counties experiencing relative economic decline but that this relationship was weak (explaining less than one-tenth of the rise in drug mortality rates between 1999 and 2015). Instead, he attributes most of the drug mortality increase to the “drug environment” (i.e., the cost, supply, and regulation of drugs).
Not all studies of economic change and drug mortality focus on the magnitude of the effect, although when they do, they find that the impact of short- or mid-run economic change does not explain a large share of the overall increase in drug overdose deaths. However, it is important to point out that none of these studies or the trends presented in this report explicitly test the hypothesis that long-run (multidecade) declines in economic, family, and social conditions contributed to the increase in drug, alcohol, and suicide mortality among working-age adults without a college degree, whether that be through the pathway of despair or some other intervening mechanism. The cumulative effects of these multidimensional long-term exposures to adverse conditions remain unexplored.
SUMMARY
Collectively, drugs and alcohol were responsible for more than 1.3 million deaths among the U.S. working-age (ages 25–64) population between 1990 and 2018. These substance-related deaths were major contributors to the rise in working-age mortality, and as of this writing, they are not abating. Drug poisoning deaths have been rising for almost three decades, primarily among Whites but also among Blacks and Hispanics. Alcohol-induced deaths also increased among Whites during the entire study period, and while alcohol-induced deaths declined among Blacks and Hispanics throughout the 1990s and early 2000s, those declines leveled off during the late 2000s and shifted to increases in the 2010s.
The rise in drug poisoning deaths has been well studied, and that research has yielded some plausible explanations for this phenomenon. The trends in alcohol-related deaths have not been studied as extensively; however, the factors that influence both trends are similar. The increased availability of drugs and alcohol (i.e., changes on the supply side) and the
high and increased vulnerability of subpopulations (i.e., the demand side) combined to create and fuel the rising trend in drug and alcohol deaths.
On the supply side, actions in the 1980s and 1990s by the pharmaceutical industry (manufacturers, distributors, pharmacies), pain management advocacy groups (often funded by pharmaceutical companies), and physicians (encouraged by pain management advocates and pharmaceutical companies), combined with weak government regulations, sparked a massive increase in opioid prescribing and the subsequent rise in prescription opioid misuse, addiction, and overdose. Pharmaceutical companies, led by Purdue and its multibillion dollar blockbuster drug OxyContin, along with distributors, pharmacies, pill mills, and some physicians, saturated the United States with prescription opioids.
As policy makers, state health officials, and physicians began to recognize the dangers of opioids and prescribing subsequently declined, prescription opioids became less available and more expensive. As a result, people who had become addicted to or dependent on them (and people with existing heroin addictions) turned increasingly to heroin. This transition introduced a new clientele and created a “thick market” for heroin, lowering its prices, and ushering in the second wave of the U.S. addiction and overdose crisis. The third wave began in the early 2010s with the infiltration of fentanyl into the U.S. drug supply. Fentanyl deaths surpassed those involving heroin in 2016 and continued to climb, even as overall overdose mortality began to level off.
As with prescription drugs, alcohol industry deregulation (e.g., relaxing days and times of sales, relaxing where alcohol can be sold, allowing home delivery and “cocktails to go”) and privatization have resulted in increased availability and affordability of alcohol in the United States over the past few decades. Yet while these supply conditions may be related to the increased consumption seen since the mid-1990s, they cannot explain why peak U.S. per capita alcohol consumption occurred during the mid-1970s to mid-1980s and then declined throughout the late 1980s and early 1990s.
Demand-related explanations for the surge in substance use and overdose over the past three decades focus on why certain subpopulations and geographic areas appear to be more vulnerable than others to increased exposure to opioids and other drugs. These explanations include those that are both proximate to individuals (physical pain, mental illness, ACEs, psychological distress or despair) and those that are more structural and distal (macro-level economic, family, and social changes).
Millions of Americans experience chronic pain, and some evidence also suggests that there may have been increases in physical pain over the past several decades. Prior to the mid-1990s, adults with non-cancer-related pain would rarely have been prescribed opioids for long-term use. However, high
and possibly increasing levels of physical pain have created new markets for these drugs.
Mental illnesses and SUDs are closely intertwined. However, ongoing population surveys and other nationwide surveillance on comprehensive indicators of adult mental illness are scant, making it difficult to relate trends in those conditions to other important health and functional characteristics, such as substance use, disability, employment status, and mental illness–related mortality. Similarly, numerous studies document strong relationships between ACEs and drug and alcohol misuse, age of initiation, high-risk misuse (e.g., injection drug use), and nonfatal overdose, all of which are risk factors for fatal drug poisoning and alcohol-related death. Research on temporal trends in the prevalence of ACEs is sparse, however, making it is difficult to determine whether changes in the prevalence of these experiences are related to the changes observed in working-age drug- and alcohol-related mortality rates.
“Despair” has been among the more controversial potential explanations for the rise in substance-related deaths. Despair signifies hopelessness, which is a feature of depression and other affective disorders but is not itself a formal mental health diagnosis. The notion that the past 30-year rise in working-age mortality is due in part to increasing psychological distress among working-age adults with lower education is appealing because it accords with long-term economic, family, and social changes that have increased disconnection from the people, activities, and institutions that provide support and give people purpose and meaning. While the committee could find no causal studies on the effects of changing psychological health on U.S. substance use and mortality trends, there is ample empirical support for the hypothesis that psychological health has been worsening among U.S. working-age adults and that proxies for despair (e.g., hopelessness, sadness, worry) are connected to substance use. Ultimately, measuring despair and determining causality remain key challenges for understanding the true role of despair in recent mortality trends. Qualitative research, which provides compelling evidence for the role of increasing despair in substance use and overdose, can offer insights for demographers, economists, and epidemiologists who seek to develop and test strong measures of despair.
Finally, looking at more distal demand factors, one must consider societal factors that have made some subpopulations more vulnerable than others to the increased availability of substances. Existing research has drawn mixed conclusions about the causal relationship between objective economic factors (particularly in relation to area-level short-term changes in such economic outcomes as poverty and unemployment) and substance-related mortality. Research also shows significant relationships between subjective economic distress, unmet expectations, and drug use. It is clear as
well that economic well-being has declined among individuals without a college degree over the past several decades. The decline and transformation of industries that once provided good jobs for adults with only a high school education have resulted in the erosion of the character and nature of communities that depended on those industries. This economic decline has occurred concomitantly with declining marriage rates, increases in single-parent families, declining social safety nets, and increased disconnection from social institutions. Ultimately, there is strong observational evidence that the contexts of everyday lives and the decline in opportunities for adults without a college degree contributed to the rise in drug poisoning and alcohol-related deaths.
IMPLICATIONS FOR RESEARCH AND POLICY
Several reports and commissions have examined and offered recommendations related to the U.S. opioid crisis and the broader addiction and overdose crisis in the United States. Examples include the President’s Commission on Combating Drug Addiction and the Opioid Crisis (Christie et al., 2017); Pain in the Nation: The Drug, Alcohol and Suicide Crises and the Need for a National Resilience Strategy (Segal et al., 2017); Framing Opioid Prescribing Guidelines for Acute Pain: Developing the Evidence (NASEM, 2020a); Pain Management and the Opioid Epidemic: Balancing Societal and Individual Benefits and Risks of Prescription Opioid Use (NASEM, 2017); and Improving the Quality of Health Care for Mental and Substance-Use Conditions (IOM, 2006). These reports offer detailed recommendations for programs and interventions to address the problem, and readers are encouraged to access them.
The committee’s recommendations differ from those prior recommendations in that they do not focus on specific policy and practice strategies. Rather, the committee believes broad efforts are needed to address all components of the U.S. addiction and overdose crisis, on both the supply and demand sides. Such efforts would include strengthening regulatory control and monitoring of the development, marketing, distribution, and dispensing of prescription drugs; developing stronger standards, procedures, and sanctions within the pharmaceutical industry for the surveillance and prevention of activities that could result in misuse, addiction, or other harms among users of its products (for although such processes may exist on paper, they were clearly not effective with regard to the opioid epidemic); investing in programs that emphasize alternatives to arrest and incarceration and encourage entry into SUD treatment; expanding access to, improving the quality of, and learning more about the effectiveness of mental health counseling and substance use prevention, treatment, recovery, and harm
reduction programs; and revitalizing communities that have been hardest hit by the addiction and overdose crisis.
POLICY CONCLUSION 7-1: Economic policies are needed to address the larger economic and social strains and dislocations that made communities that experienced economic decline over the past four decades vulnerable to opioids and other drugs. This effort may require a holistic approach to development that involves federal, state, and local governments as well as a range of private-sector actors.
Public health policies that address SUDs have often been underutilized in favor of criminal justice policies—e.g., the “War on Drugs”—that emphasize arrests, incarceration, and punishment. Moreover, the United States annually spends much less on demand reduction than on supply reduction programs, and the gap between the two has been growing (Drug Policy Alliance, 2015; Miron and Waldock, 2010; White House Office of National Drug Control Policy, 2015). Public health policies treat substance use as a health problem, while criminal justice policies treat it as a moral failure. The criminal justice approach has been misguided and largely ineffective (Neill, 2014). It has cost the United States upwards of $1 trillion (Branson, 2012), led to extraordinary rates of incarceration that far exceed those of other industrialized nations and have disproportionately affected poor and Black communities (Mauer and King, 2007), and exacerbated tears in the social fabric of these communities (Dumont et al., 2013), all while doing little to curb either the supply of or the demand for drugs in the United States. Similarly, long-standing fear-based programs targeted at youth, such as the National Youth Anti-Drug Media campaign and Drug Abuse Resistance Education (D.A.R.E.) program, are costly and ineffective and have been found to have unintended negative consequences (Hornik and Jacobsohn, 2008; Hornik et al., 2008; Kanof, 2003; U.S. Government Accountability Office, 2006; Vincus et al., 2010; West and O’Neal, 2004). In contrast with a punitive zero-tolerance, War on Drugs approach, a public health or social determinants approach emphasizes integrating clinical care with efforts to improve structural environments and targeting both supply and demand factors at multiple levels (Dasgupta, Beletsky, and Ciccarone, 2018; Scutchfield and Keck, 2017).
RECOMMENDATION 7-1: Policy makers should implement policies that better address the U.S. addiction and overdose crisis and prevent future crises. In general, the most effective interventions target both risk and protective factors at multiple levels, including the individual, family, community, and society.
- The Food and Drug Administration, the Drug Enforcement Administration, and other federal and state regulatory agencies should strengthen regulatory control and monitoring of the development, marketing, distribution, and dispensing of prescription drugs.
- The pharmaceutical industry (including manufacturers, distributors, dispensers, and trade associations) should develop and fund stronger internal standards, regulatory structures, and procedures for surveillance and prevention of activities that could result in misuse, addiction, or other harms among users of its products. It should also develop stronger sanctions for violation of these standards.
- Federal, state, and local governments should invest in programs that focus on substance use as a public health issue and pursue alternatives to arrest and incarceration. Such programs should be aimed at reducing barriers to and encouraging entry into substance use disorder treatment.
- Medicaid and state and local government agencies (e.g., health departments, social services, public schools) should expand access to and improve the quality of substance use prevention, treatment, recovery, and harm reduction programs, as well as mental health counseling and treatment for people with substance use disorders. Substance use prevention programs should begin early, focus on life skills training and prosocial development rather than on fear, and be targeted to children and adolescents most at risk of early initiation of drug and alcohol use (e.g., those living in neighborhoods of low socioeconomic status, those who have suffered adverse childhood experiences).
Given the relationship between health insurance coverage and access to substance use treatment, as well as recent findings regarding largely better health and lower mortality among working-age adults who live in states that have expanded Medicaid under the Affordable Care Act (see Chapter 11), the committee also recommends that the 12 states that have not yet expanded access to Medicaid do so as soon as possible (see Chapter 11, Recommendation 11-1).
People with SUDs face numerous barriers to accessing the treatment they need, including limits on health insurance coverage, low Medicaid provider participation rates, shortages of mental health and substance use specialists, and fragmentation in care delivery (“carve-outs” and other policies that separate mental health from physical health care) (Byers et al., 2017; Huskamp and Iglehart, 2016; Kakuma et al., 2011; Rowan, McAlpine, and Blewett, 2013; Walker et al., 2015). As a result, an estimated 81.7 percent of Americans ages 12 and over with SUDs do not receive the treatment they
need (Huskamp and Iglehart, 2016). Moreover, despite their demonstrated efficacy in reducing overdose risk (Connery, 2015; Gallagher et al., 2019; Marlatt and Witkiewitz, 2010), access to harm reduction products and services, such as naloxone, medication-assisted therapies, needle exchange programs, safe injection sites, and recovery services (e.g., recovery housing, recovery groups, recovery coaches), is even scarcer (Dasgupta, Beletsky, and Ciccarone, 2018).
Addressing the control of substance addiction is an important multidisciplinary issue.
Examples of specific research gaps that require attention include improving behavioral approaches to relapse prevention, addressing the role of non-substance-related conditions in addictive behaviors, and developing better interventions to counter the adverse effects of various social groups in promoting substance use. The social and behavioral sciences can address the population affected by and clinical scope of addiction, and whether the addiction syndrome subsumes a larger set of non-substance use behaviors, such as pathological gambling (Potenza, 2006). Further research may facilitate better understanding of the biological mechanisms behind addiction and related impulse control disorders, and how those mechanisms can inform approaches to clinical management. Another important issue is the role of impulsivity in clinical substance use relapse among residents of treatment facilities. The social and behavioral sciences have yielded mindfulness strategies for deterring this relapse, and evidence suggests that the strategies can serve as the basis for viable and useful intervention (Davis et al., 2019). Social networks also play an important role in the genesis of substance use in adolescence and young adulthood, as the involvement of disadvantaged young populations with peer friends has been shown to be associated both with increased tobacco, alcohol, and other substance use and with prevention of substance use (Tucker et al., 2015).
RECOMMENDATION 7-2: Federal agencies, in partnership with private foundations and other funding entities, should support research on the effectiveness of behavioral health interventions in reducing mental illness and its consequences; on improved methods for delivering mental health and substance use treatment, harm reduction products and services (e.g., naloxone, medication-assisted therapies, needle exchange programs, safe injection sites), and recovery services; and on the extent to which inadequate access to these products and services has contributed to rising working-age mortality from substance use and suicide.
While substantial research has already focused on explaining the rise in substance-related mortality in the United States over the past three decades, this research has been limited by several research and data gaps, which are
discussed below. Addressing these gaps would aid in better understanding this rise in drug poisoning and alcohol-induced deaths and help inform policy solutions. The recommendations below address these data and research needs (see also Recommendation 7-2 above).
The existing literature offers both supply- and demand-side explanations for the observed trends in substance-related mortality over the past three decades. Supply-side explanations focus on the availability of addictive drugs and alcohol. More research on the marketing, distribution, and regulation of these legal and illegal products is warranted. It is known that variation in state regulations regarding physicians’ ability to prescribe opioids influenced the magnitude of the opioid addiction problem across states. However, better understanding is needed of physicians’ and patients’ responses to tighter regulations and how those responses interface with the markets for heroin and fentanyl. Many believe that as regulatory measures tighten controls on prescription opioids, substance users are pushed into the markets for heroin and fentanyl. It would be useful to know whether policy makers could effectively coordinate their regulatory policies on physician prescribing and their enforcement efforts against illegal drugs.
It appears clear that the lethality of opioids (relative to other drugs) contributed in important ways to the increase in drug poisoning mortality rates (regardless of whether SUDs themselves have actually increased). It would be valuable to understand the extent to which changes in the types of alcohol consumed by Americans (e.g., greater consumption of hard liquor) or the quantities consumed during drinking sessions (e.g., binge drinking) have increased the toxicity of the behavior and contributed to rising alcohol mortality rates among Whites.
Demand-side explanations focus on the factors that make certain demographic groups more vulnerable to drug and alcohol addiction and poisoning. Qualitative researchers have interviewed individuals who are living lives plagued by drug and alcohol misuse and dependence. The testimonies of these people highlight the role of declines in communities and families triggered by changes in economic opportunities. Yet while qualitative research supports this narrative, more rigorous quantitative research has not been as convincing. It is unknown whether these stories of hardship, primarily from the Appalachia region, are generalizable to other regions of the country or other racial/ethnic groups. There is a need for both qualitative and quantitative research focused on other regions and demographic groups to provide valuable insights into why the trends in mortality due to drug poisoning and alcohol use vary so much by region and demography. As elaborated in Chapter 11 (see Recommendation 11-6), more research is needed on explanations for differences in trends (changes) in drug- and alcohol-related mortality across different individual-level demographic characteristics (including sex, race and ethnicity, and socioeconomic
status), economic and social factors (e.g., social integration, unemployment, income inequality, public policy), and various levels of geography (e.g., economic disadvantage at the state, labor market, and area levels).
It is also unclear whether drug overdose and alcohol-induced deaths (and suicide) reflect competing or mutually overlapping causes of death. Evidence of alcohol consumption is known to be common in both drug overdoses (Jones, Paulozzi, and Mack, 2014; Tori, Larochelle, and Naimi, 2020) and suicides (Kaplan et al., 2014), so alcohol use could be said to play a significant role in accidental drug poisoning and suicide. For example, alcohol is involved in about 18.5 percent of overdoses involving prescription opioids (Jones, Paulozzi, and Mack, 2014), about 15.5 percent of those involving heroin (Tori, Larochelle, and Naimi, 2020), and 27.2 percent of those involving benzodiazepines (Jones, Paulozzi, and Mack, 2014). There are studies showing that some individuals use cannabis as a substitute for alcohol and other drugs for medical purposes (e.g., symptom management, reduction of withdrawal, pain treatment) (Reiman, 2009). In a small sample of high-risk drug users undergoing substance use treatment, Shapira and colleagues (2020) found that more than three-quarters of the sample reported substituting their preferred drug for another illicit substance (e.g., substituting street methadone and transdermal prescription opioid patches for heroin). But little is known about whether people substitute drugs for alcohol based on supply-side changes and whether the effects of such substitutions vary by demographic group and geography. For example, were alcohol-related deaths and/or suicides comparatively high during the 1980s and/or 1990s in places that currently have high rates of drug overdose? Do areas with more overdose deaths have lower suicide-/alcohol-related deaths? What role does mental distress play in overdose deaths, suicides and other mental health disorders, and alcohol use? What factors drive overdose versus suicide versus alcohol-related death in the presence of mental distress?
RECOMMENDATION 7-3: The National Institutes of Health, the Substance Abuse and Mental Health Services Administration, the Centers for Disease Control and Prevention, the Food and Drug Administration, and other relevant federal agencies should support research to address the gaps in knowledge regarding the underlying causes of the rise in drug poisoning, alcohol-related death, and suicide. Specifically, this research should be focused on
- the mechanisms underlying physicians’ and patients’ unintended responses to tighter regulation of drugs with a high risk of misuse and addiction, such as cases in which individuals dependent on prescription opioids were pushed to markets for heroin and fentanyl,
- and the identification of strategies for preventing those unintended consequences;
- whether changes over time in alcohol consumption (including types of alcoholic beverages, frequency of drinking, and volume of consumption), in advertising and promotion of alcohol, in cultural acceptance of alcohol use, and in concurrent use of drugs and alcohol have contributed to increases in alcohol-related mortality rates; and
- whether the various multilevel mechanisms that explain demographic and geographic differences and temporal changes in drug use are the same as or different from those that drive demographic and geographic differences and temporal changes in alcohol use and suicide.
In the absence of clinically validated measures, researchers have used various indicators to measure despair (e.g., hopelessness, optimism, happiness). As elaborated in Chapter 11 (see Recommendation 11-2), the interrelationship between mental and physical health and the implications for mortality trends also require further exploration, as some physical health morbidities (e.g., obesity, diabetes, hypertension) that have contributed to rising midlife mortality rates may also be related to mental health and/or psychological distress. Also needed is greater understanding of how trends (changes) in physical pain and psychological distress (or subjective measures of despair) vary by individual demographic group, SES, and geography.
As elaborated in Chapter 11 (see Recommendation 11-3), research on mortality trends would benefit from more analyses of multiple causes of death (MCDs). Death certificates include one underlying cause of death (UCD)—the cause the certifier has determined led directly to the death—and up to 20 contributing causes (i.e., MCDs). The conclusions one draws about the magnitude of the role played by specific causes of death in overall population mortality trends vary dramatically by whether one uses the UCD or MCD data (Redelings, Sorvillo, and Simon, 2006). Researchers should make better use of the codes for MCD in the ICD-10 in their examination, analysis, and explanation of trends in cause of death. Most research on these trends uses the ICD-10 code for UCD. But doing so misses important comorbidities and co-occurring conditions (e.g., alcohol or drug involvement in motor vehicle or pedestrian accidents, chronic substance use and heart disease, drug use and infectious disease) without which the person might not have died. An important task for future research is to consider different ways of categorizing causes of death so they shed light on multiple determinants more directly.
The committee acknowledges the important work of ongoing national surveys of mental health disorders and drug and alcohol use behaviors (e.g., NSDUH, National Epidemiologic Survey on Alcohol and Related Conditions, BRFSS), as well as administrative surveillance and vital record systems (e.g., National Center for Health Statistics vital records, National Violent Death Reporting System). However, these surveys and systems have several critical gaps that need to be addressed.
U.S. death certificates, which are compiled and made available to researchers by the National Center for Health Statistics, include decedents’ educational attainment. However, the quality of the educational data varies across demographic group and states. More accurate capture of these data is needed (see Chapter 5 and Recommendation 5-1). Improvement in these data would enable better testing of hypotheses as to why drug mortality rates have increased among individuals without a 4-year college degree but remained relatively flat among those with a college degree (Case and Deaton, 2020). Several important studies have examined APC trends in drug and alcohol deaths. However, these studies have been hampered by the inability to examine those trends by decedents’ educational attainment. Such studies are key to elucidating the relative contribution of increasing disadvantage among lower-educated individuals to their rising rates of drug and alcohol mortality.
More comprehensive identification of contributing causes of death on death certificates is also important (see Chapter 5 and Recommendation 5-1). The completeness of the MCD indicators on death certificates varies by certifier, and there are important differences in this regard by decedent demographic characteristics and other nonmedical factors (Wall et al., 2005). More systematic completion of the MCD section on death certificates would facilitate research on comorbid physical and mental health conditions and on the interrelationships among mental illnesses, SUDs, and suicides. Information from more complete and accurate death certificates could also be integrated into population surveillance, cohort studies, and interventional clinical trials addressing use of drugs and alcohol.
Given large and widening geographic disparities in drug- and alcohol-related mortality rates, the inclusion of geographic identifiers on the publicly accessible versions of national substance use and mental health surveillance surveys is urgently needed. The NSDUH is the only national annual surveillance survey designed explicitly to capture detailed information from individuals about both substance use behaviors and mental health conditions. Because of data privacy concerns, however, the publicly accessible version of these data includes no geographic identifiers. Researchers can apply to access the restricted-use data, which include state, county, and lower-level geographic identifiers, but the application and approval process
is time-intensive, and the only way to access the data upon approval is through a Federal Statistical Research Data Center. Few researchers can easily access these data centers. A better way is needed to balance respondents’ data privacy and the release of essential information to help researchers identify and better understand trends in major causes of death, especially for data from such surveys as the NSDUH, which includes nearly 70,000 respondents (thereby greatly reducing disclosure risk).
RECOMMENDATION 7-4: The Substance Abuse and Mental Health Services Administration should add to the publicly accessible version of the National Survey on Drug Use and Health U.S. Census region or U.S. Census division categories and the nine-category U.S. Department of Agriculture Economic Research Service rural–urban continuum codes or National Center for Health Statistics urban influence codes.
The NSDUH has a large depression inventory module and a module on the use of psychiatric clinic services; the NESARC (last conducted in 2011–2012) collects information about various types of anxiety disorders (including panic disorders) that are more common in people with SUDs, and it also asks about depression. Nevertheless, there are important gaps in the availability of information on adult mental illness rates in the United States as a whole and in regional jurisdictions. More of this information is needed to understand trends in the relationship between mental health conditions and SUDs; identify the levels of unmet population need for prevention and treatment of these conditions; and assess the outcomes of these conditions, including social dysfunction, drug and alcohol use, and suicide and other related mortality.
RECOMMENDATION 7-5: The National Institute of Mental Health and other relevant federal agencies should develop a research program to identify innovative and cost-effective methods for conducting periodic or ongoing population surveys of important mental health conditions. The research agenda should include measuring access to and uptake of behavioral health care services (e.g., mental health counseling, substance use disorder treatment) and the effects of such services on mental health outcomes and other important outcomes, such as those in the social, cognitive, and functional domains. These national surveys should be linked where possible to medical record and claims data, as well as to other important sources, such as education and social service information, while carefully protecting respondent confidentiality.
Finally, research on temporal trends in the prevalence of ACEs is sparse, and better data would greatly improve the ability of researchers to examine trends in the prevalence and demographic distribution of such experiences, as well as changes in their relationship to adult health behaviors and health outcomes.
RECOMMENDATION 7-6: Questions about adverse childhood experiences should be added to the core of the Behavioral Risk Factor Surveillance System (so that the questions are asked in every state in every year), as well as to other relevant national health surveys, such as the National Health Interview Survey and the National Survey on Drug Use and Health. To advance understanding of the mechanisms and control of these experiences, this information should be improved by facilitating maximal record linkage of cohort findings to available social, military, medical, psychiatric, environmental, and law enforcement records.


