
2
U.S. Mortality in an International Context
Life expectancy in the United States is lower than in many countries and has been for an extended period. In 2016, the United States ranked 34th among all countries on life expectancy (World Health Organization [WHO], 2018a) and 40th on “healthy” life expectancy (i.e., years lived without disease or disability) (WHO, 2018b). U.S. life expectancy ranks below that of nearly every other high-income country and below that of many middle-income countries (WHO, 2018a). This underperformance compared with other peer countries is a growing cause for concern and has motivated efforts to understand its contributing factors. The National Academies of Sciences, Engineering, and Medicine conducted two previous consensus studies related to this issue—one focused on U.S. mortality after age 50 (National Research Council [NRC], 2011), and another using a broader set of health metrics to compare health and longevity among Americans and populations in other high-income countries and examine mortality and life expectancy from the 1980s through 2008 Institute of Medicine and National Research Council [IOM and NRC], 2013).
This chapter extends those prior analyses to consider differences in life expectancy between the United States and peer countries over the period 1950–2016. The same 16 peer countries are considered here as in the 2013 report: Australia, Austria, Canada, Denmark, Finland, France, Germany, Italy, Japan, Norway, Portugal, Spain, Sweden, Switzerland, the Netherlands, and the United Kingdom. Trends in the mortality gaps between the United States and these other high-income countries are used to place recent U.S. mortality trends in a larger historical and international context. These comparisons also illustrate how high and rising working-age (ages 25–64)
mortality rates have shaped recent trends in U.S. life expectancy. The chapter presents five sets of international analyses presented in four sections, each intended to help illustrate the growing gap between mortality in the United States and other peer countries and to clarify the rationale for the committee’s focus on mortality rates at working ages:
- The first section compares the countries on an overall measure of longevity—life expectancy at birth—spanning the period 1950–2016. This long-term comparison of the United States with other countries helps clarify when the United States began to diverge from its peers, and whether the current gap is consistent with historical trends or marks a new point of divergence.
- The second section focuses on the contributions of specific age groups to the gap in life expectancy between the United States and its peer countries, as well as on how age-specific mortality rates in the United States compare with those of the 16 peer countries. These two sets of analyses clarify the age groups that make the largest contribution to the widening gap in life expectancy and mortality between the United States and its peers and establish the important role played by mortality at working ages since 2010.
- The third section focuses on working-age mortality and examines how trends in age-standardized mortality rates in this age range differed between the United States and the 16 peer countries between 1950 and 2016 after accounting for differences in the age distributions of their working-age populations over time.
- The final section examines how age-standardized mortality rates for several key causes of death differ between the United States and its peers.
A detailed description of the data and analytic methods used to produce these results can be found in the annex at the end of this chapter.
Together, the findings from these analyses paint a bleak picture of U.S. mortality in terms of both its current international standing and historical trends. The current gaps between life expectancy in the United States and peer countries are the largest ever recorded. Moreover, the trends underlying these growing gaps suggest that they would have been likely to increase in the near future even before the effects of the COVID-19 pandemic were realized. The evidence indicates, moreover, that the United States is falling behind its peers as the result of higher mortality at nearly all ages. Although deaths at older ages (i.e., above 65) account disproportionately for the increasing gap in life expectancy between the United States and peer countries, differences in the risk of death are greatest at younger ages. Many causes of death responsible for the increasing U.S. disadvantage are chronic
diseases that are costly and burdensome, require long-term care, and will likely shape U.S. mortality trends for years to come. Deaths related to drug use at younger ages also contribute substantially to the worsening U.S. mortality disadvantage. As discussed in the final chapter of this report, the large and growing U.S. disadvantage in life expectancy and health will likely persist without national-level investments in disease prevention, changes in regulatory policies, and reductions in social and economic inequalities.
LIFE EXPECTANCY AT BIRTH IN THE UNITED STATES VERSUS PEER COUNTRIES
The gap in life expectancy between the United States and peer countries has been decades in the making, with evidence of a possible problem appearing as long ago as the 1950s (Figure 2-1).1 By 2016, life expectancy for U.S. females (81.1 years) was 3.3 years lower than the average in the 16 peer countries (84.4 years), and life expectancy for U.S. males (76.2 years) was 3.7 years lower than the peer average (79.9 years). Although the gap in life expectancy between the United States and peer countries unfolded over a long period of slower growth in U.S. life expectancy spanning many decades (1950–2010), this trend accelerated rapidly after 2010 as life expectancy stagnated and then declined in the United States alone.
Although U.S. life expectancy increased from 1950 to 2010, it often did so at a slower pace than in the peer countries (Figure 2-1, upper panels). In the first decades of this period, the slower growth in life expectancy within the United States relative to the peer average was heavily influenced by the rapid growth in life expectancy that occurred within those peer countries that were recovering from the effects of World War II. However, U.S. life expectancy also remained below that of the remaining peer countries during this time. By 1970, life expectancy among U.S. males had fallen below the average in the peer countries, and life expectancy among U.S. females had lost the advantage it held during the 1950s. Although increases in U.S. life expectancy in the 1970s were comparable to (and sometimes exceeded) those in the peer countries, year-over-year increases in the United States began diminishing in the late 1970s and failed to keep pace during the 1980s, 1990s, and 2000s. This long-term trend of falling behind peer countries was more pronounced among U.S. females than among U.S. males.
___________________
1 In the 1950s, the countries that had lower life expectancy than the United States for both males and females were Austria, Finland, France, Germany, Italy, Japan, Portugal, and Spain—all of which were recovering from the effects of World War II. U.S. life expectancy already had fallen below that of each of the remaining peer countries—Australia, Canada, Denmark, the Netherlands, Norway, Sweden, and Switzerland—among females and below all but Canada among males.
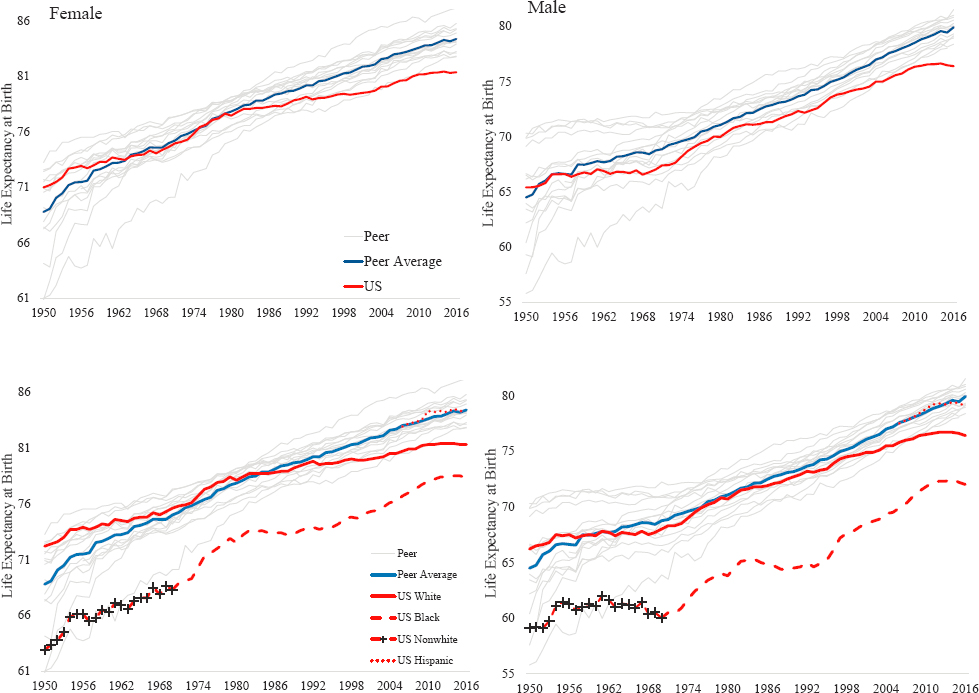
NOTE: Life expectancy at birth is depicted for females in the two lefthand panels and for males in the two righthand panels. In the top two panels, the red solid lines plot life expectancy at birth for the total U.S. population. In the bottom two panels, the red solid lines plot life expectancy at birth for the U.S. White population, while the red dashed lines plot life expectancy for U.S. non-White populations. In the period before 1970, the red dashed line with the black “+” symbol plots the combined life expectancy at birth for all U.S. non-White populations. Beginning in 1970, the red dashed line represents life expectancy at birth among the U.S. Black population only. The red dotted line that begins in 2006 plots life expectancy at birth for U.S. Hispanics. In all four panels, the gray lines plot the respective life expectancies for each peer country, and the blue solid lines show average female and male life expectancies across the 16 peer countries.
SOURCE: U.S. mortality data are drawn from National Vital Statistics Reports (see the annex at the end of this chapter for detail). Mortality data for the 16 peer countries are drawn from the Human Mortality Database (2019).
In the early-2010s, increases in U.S. life expectancy first stalled and then reversed, with declines occurring for both U.S. males and females between 2014 and 2016. These recent downward trends in U.S. life expectancy were especially pronounced among U.S. males. In contrast, life expectancies for both males and females in peer countries continued their upward trend.
The racial/ethnic diversity of the U.S. population distinguishes it from the populations of its 16 peer countries. Although mortality rates among the U.S. non-White population relative to the non-Hispanic White (White) population are disproportionately high because of a range of historical and current factors (e.g., slavery, immigration, racial discrimination [see Chapter 11]), there is little evidence that racial/ethnic diversity explains the U.S. life expectancy gap. For example, as shown in Figure 2-1 (lower panels), although life expectancy among the U.S. non-Hispanic Black (Black) population was far lower than that of the U.S. White population and of peer countries, life expectancy among the U.S. White population also failed to keep pace with that of peer countries. The stall and decline in U.S. life expectancy after 2010 occurred among the U.S. Black, White, and Hispanic male and female populations.
THE U.S. MORTALITY DISADVANTAGE BY AGE
International Differences in Life Expectancy Decomposed by Age
Which age group is most responsible for the decline in U.S. life expectancy? The gap in U.S. life expectancy was driven by mortality trends among adults roughly ages 18–60 (Figure 2-2). The gap began to take shape early; as early as 1970, the United States had a survival disadvantage compared with its peer countries in all age groups between 10 and 65. The U.S. disadvantage in life expectancy extended over time, gradually encompassing all age groups under 80. Although the United States had a survival advantage among infants and children under age 10 and among older adults (ages 65 and over) in 1970, by 2016 only the very oldest ages (over 80 among males, over 85 among females) retained an advantage in life expectancy over the peer country average.
The overall trends over time in the U.S. disadvantage in life expectancy relative to the peer country average were similar by sex, but the age patterns differed for males and females. Among females in 1970 (Figure 2-2, upper panel), the age-specific contribution to the U.S. life expectancy disadvantage among those ages 10 and over grew steadily with age, peaking at age 55 before reversing and becoming a sizable life expectancy advantage among females over age 65. In contrast, among males in 1970 (Figure 2-2, lower panel), the age-specific contribution to the U.S. disadvantage in life expectancy did not increase steadily after age 10; instead, it increased quickly
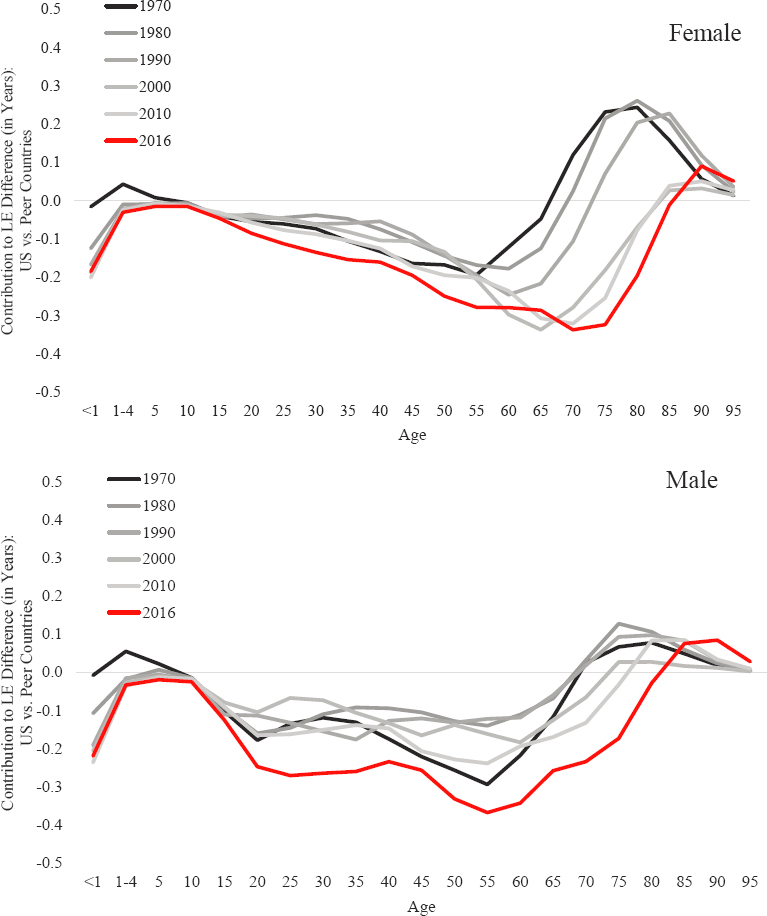
NOTE: The figure plots the number of years of life expectancy contributed by each age group to the total gap in life expectancy between the United States and the average of the 16 peer countries. Positive values on the vertical axis indicate survival advantages for the United States (i.e., fewer deaths at these ages), whereas negative values indicate survival disadvantages for the United States. The top panel shows the results for females, while the bottom panel shows the results for males. The black and gray-scale lines plot the values for the period 1970–2010 in 10-year increments. The red line plots the values for 2016, the most recent year for which life expectancy data were available for all 16 peer countries. The data presented were estimated using Arriaga decomposition techniques (Arriaga, 1984; Auger et al., 2014). They show the specific contributions of ages <1 year, 1–4 years, and all 5-year age groups from 5–9 through 95–99 (deaths above age 100 do not contribute to the life expectancy differences between the United States and peer countries in all years).
SOURCE: U.S. mortality data are drawn from National Vital Statistics Reports (see the annex at the end of this chapter). Mortality data for the 16 peer countries are drawn from the Human Mortality Database (2019).
between ages 10 and 20 and then remained steady between ages 20 and 35, after which it again began to increase. As was the case among females, the age-specific contribution to the U.S. disadvantage in life expectancy among males was largest at age 55 and then reversed at older ages, so that U.S. males over age 65 held an advantage in life expectancy; however, this age-specific advantage was much smaller than that which occurred among older females.
The relative survival advantage among U.S. females at younger ages in 1970 dissipated over time, and by the 2000s and 2010s had become a growing disadvantage. The disadvantage in life expectancy in midlife that was already present in 1970 continued to increase over time and extended into older ages, erasing the older-age survival advantage by 2016. This steady trend across the years accounted for most of the increase in the U.S. female life expectancy disadvantage. Similar trends occurred among U.S. males, but the magnitude of the changes over time and the contributions of specific age groups to the U.S. life expectancy disadvantage differed from those of females. Between 2010 and 2016, a large younger-age disadvantage, a growing midlife disadvantage, and the loss of an older-age survival advantage emerged among males. Deaths among younger males made a larger contribution to the U.S. male life expectancy disadvantage than was the case among U.S. females. However, the extension of the midlife disadvantage to older ages and the loss of the older-age advantage compared with the peer countries was more pronounced among females.
Although the long-term trend of falling behind the peer countries occurred for both male and female life expectancy in the United States, this trend was more pronounced for female life expectancy between 1980 and 2010 (Figure 2-1). The decomposition of life expectancy by age group (Figure 2-2) shows that during the 1980s and 1990s, while the United States maintained a midlife disadvantage, the differences in female life expectancy between the United States and the peer countries increased, largely as the result of a widening survival disadvantage for U.S. females at older ages; only after 2000 did the widening midlife disadvantage contribute substantially to the widening female survival disadvantage of the United States relative to the peer countries. In contrast to earlier periods, the more recent stalling and decline in U.S. life expectancy since 2010 were more pronounced for U.S. males than for U.S. females, largely because of a widening survival disadvantage for U.S. males at working ages.
U.S. Mortality Relative to International Peers by Age
Comparing mortality rates in the United States and the peer countries highlights how long the United States has experienced higher mortality rates at midlife and younger ages, and this U.S. disadvantage has increased
substantially since 2000 (Figure 2-3). For all age groups between 15 and 65, the probabilities of death have been consistently higher in the United States than in the peer countries since at least the 1970s, and the ratio of mortality rates at these ages in the United States to those within the peer countries grew substantially from 2000 to 2010 and again from 2010 to 2016. After 2000, the relative risk of mortality in the United States among late adolescents and young adults (under age 40) increased more dramatically than among any other age group. In contrast, the relative mortality risk increased more steadily among older age groups over the decades.
The decomposition results shown in Figure 2-2 estimate the absolute contributions of each age group to differences in life expectancy between the United States and the peer countries. These data show that because mortality is much higher at older relative to younger ages, the reduction and then reversal over time of the U.S. mortality advantage at older ages had a larger effect on the gap in life expectancy between the United States and the peer countries relative to the consistent U.S. mortality disadvantage at midlife and younger ages over the period. The differences shown in Figure 2-3 are expressed in relative terms as ratios of mortality rates and highlight—more vividly than in Figure 2-2—the extremely high mortality risk faced by U.S. infants, children, adolescents, and young adults relative to their peers in other countries since 1990. The contrast is sobering. For example, whereas the risk of female infant death in the United States and the peer countries was comparable in the 1970s, by 2016 female infant mortality rates had increased to be about 75 percent higher in the United States. The risk of U.S. females dying at age 25 was about 40 percent higher in the United States than in the peer countries in 1970 but rose to more than 150 percent higher by 2016.
INTERNATIONAL TRENDS IN WORKING-AGE MORTALITY
The above discussion demonstrates that the United States has long faced higher mortality among working-age adults compared with the peer country average, but the gap has grown dramatically since 2000, contributing to widening differences in life expectancy between the United States and its peers. When the age-standardized probability of death between ages 25 and 64 in the United States is compared with that in each of the 16 peer countries instead of the peer country average (Figure 2-4), it is clear that the United States has consistently been among those countries with the highest working-age mortality since at least 1950, but also has increasingly pulled away from its peers over time. This is especially true for the most recent period, during which working-age mortality declined and became increasingly similar across the 16 peer countries while climbing in the United States.
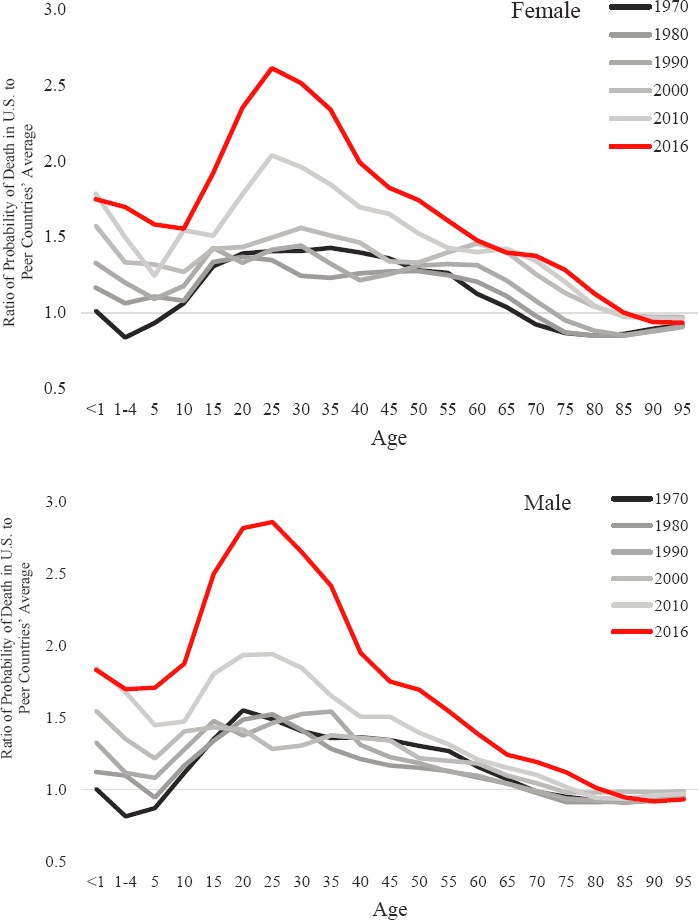
NOTE: The top panel shows the relative age-specific mortality risk for females, while the bottom panel shows the relative age-specific mortality risk for males. A value above 1.0 indicates that males and females in the United States experienced a higher probability of dying in that age group relative to the peer country average, while a value below 1.0 indicates that the United States experienced a lower risk of dying in that age group. The black and gray-scale lines plot the values for the period 1970–2010 in 10-year increments. The red line plots the values for 2016, the most recent year for which data on life expectancy were available for all 16 peer countries. The figure shows the specific contributions of ages <1 year, 1–4 years, and all 5-year age groups from 5–9 through 95–99 (deaths above age 100 do not contribute to the life expectancy differences between the United States and peer countries in all years).
SOURCE: U.S. mortality data are drawn from National Vital Statistics Reports (see the annex at the end of this chapter). Mortality data for the 16 peer countries are drawn from the Human Mortality Database (2019).
In 1950, although the United States had high mortality relative to most of its peers, several peer countries experienced higher working-age mortality. Over time, however, the United States increasingly became an outlier. By 2001, it consistently had higher female working-age mortality relative to any peer country, and by 2006, it had the highest male working-age mortality. Beginning in 2010, working-age mortality increased in the United States among both males and females while continuing to decline in peer countries. Whereas in 1950 there was considerable variation in working-age mortality among the 16 peer countries, their mortality rates converged over time, although there remained greater variability across countries in mortality among working-age males versus females.
The status of the United States as an outlier among its peers is highlighted when working-age mortality in the United States is measured in the number of standard deviations above the peer country average (Figure 2-4, bottom panels). Working-age mortality in the United States increased from less than 1 standard deviation above the peer country average in 1950 to more than 4 standard deviations above the average by 2016 among both males and females. Although working-age mortality had been increasing since at least the 1990s, both sexes experienced a steep increase in the most recent period that began in 2010, when working-age mortality started to increase in the United States alone.
Although the position of the United States relative to its peers eroded over time, these changes did not occur steadily over the period. Consistent with the episodic trends described in the previous sections, the United States fell behind the 16 peer countries during the 1950s and 1960s; then improved on both life expectancy and its relative standing in working-age mortality in the 1970s; but increasingly fell behind during the 1980s, 1990s, and 2000s. Finally, in the period following 2010, working-age mortality began to increase in the United States alone, dramatically intensifying the already poor U.S. standing. The results shown in Figure 2-4, which are limited to ages 25–64, show that these trends are not just being driven by a relative slowdown in declines (or by increases) in mortality at increasingly older ages, but are part of a broader pattern of U.S. disadvantage that extends throughout the life course and is increasingly concentrated in working-age adulthood.
U.S. MORTALITY BY CAUSE OF DEATH IN INTERNATIONAL PERSPECTIVE
To provide insight into the underlying causes of death that drive the higher mortality rates in the United States compared with the peer countries, this section compares cause-specific mortality rates—for the United States and peer country averages—for selected causes of death in 2000, 2008, and
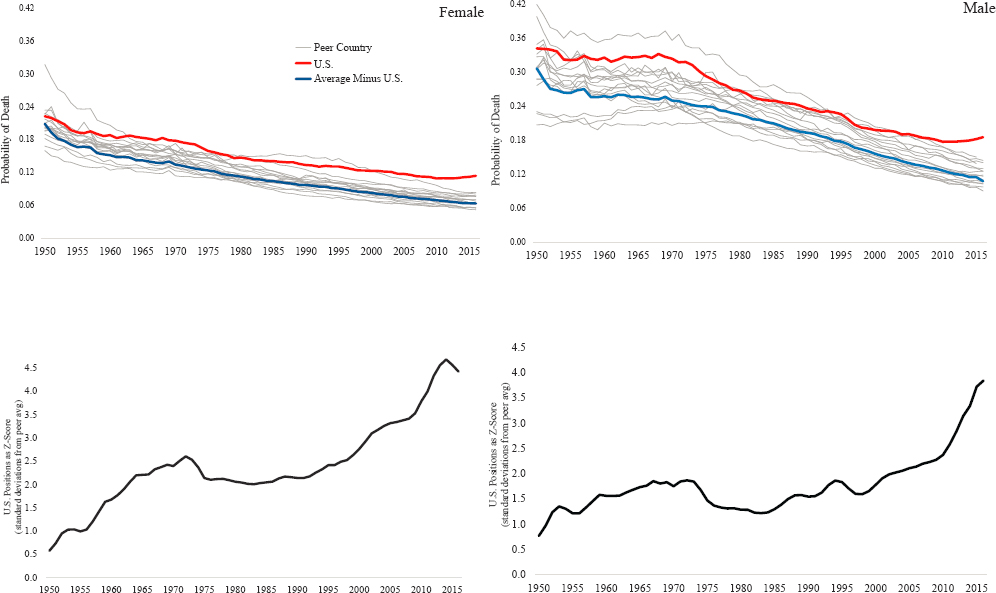
NOTE: The top two panels show the probability of dying between ages 25 and 64 in the United States and the 16 peer countries after adjusting these probabilities to account for differences in the age distributions across countries and over time. In these panels, the red line shows the mortality risk in the United States, the gray lines plot the respective mortality risk for each peer country, and the blue solid lines show the average mortality risk across the 16 peer countries. The bottom two panels show the relative positions of the United States and the 16 peer countries. The relative position of the United States is expressed as a z-score—specifically, the number of standard deviations above the peer country average by which the U.S. mortality risk falls.
SOURCE: U.S. mortality data are drawn from National Vital Statistics Reports (see the annex at the end of this chapter). Mortality data for the 16 peer countries are drawn from the Human Mortality Database (2019).
2015 (Table 2-1). These rates are computed for all ages in the populations but are age-adjusted to a standardized age distribution to ensure comparability over time and across countries. Although the United States enjoyed lower mortality from some causes of death during this period, this advantage was more than outweighed by the extensive range of causes for which the United States experienced higher mortality relative to its peers, and this disadvantage increased over time. By 2000, the United States already had higher mortality relative to its peers among both males and females across a wide range of causes of death, including circulatory diseases, endocrine diseases, lung cancer, respiratory diseases, and genitourinary diseases. Over the next 15 years, the mortality gap between the United States and its peers continued to grow for many of these causes of death, and further expanded to include higher mortality among both sexes from digestive diseases and accidental poisonings (including drug overdoses).
The four largest contributors to the growth in the U.S.–peer country mortality gap between 2000 and 2015 were circulatory diseases, diseases of the digestive system, accidental poisonings, and intentional self-harm (i.e., suicide). Mortality due to circulatory diseases, cancers involving organs other than the liver or lung, and respiratory diseases declined in both the United States and the peer countries, but the declines in the United States did not keep pace with those in the peer countries. The same was true for mortality due to diseases of the endocrine system among females. Among males, mortality due to diseases of the digestive system, mental health or alcohol use, and assault (i.e., homicide) stagnated over the period in the United States but continued to decline in the peer countries. Mortality due to accidental poisonings and liver cancer increased in both the United States and the peer countries, but the increases were greater in the United States, contributing to the growing U.S. mortality disadvantage. Finally, mortality for several causes of death—including intentional self-harm and diseases of the endocrine system among males and intentional self-harm, diseases of the digestive system, and mental health and alcohol use among females—increased in the United States but not in the peer countries.
| Males | 2000 | 2008 | 2015 | Change in Difference | |||
|---|---|---|---|---|---|---|---|
| U.S. | Peers | U.S. | Peers | U.S. | Peers | ||
| All Causes | 1210.4 | 1163.2 | 1028.5 | 975.4 | 988.4 | 877.5 | 63.7 |
| Circulatory Diseases | 476.1 | 446.5 | 338.1 | 322.8 | 310.7 | 261.0 | 20.1 |
| Accidental Poisonings | 6.5 | 3.4 | 13.5 | 4.7 | 20.0 | 4.7 | 12.2 |
| Digestive Diseases | 40.7 | 46.9 | 37.4 | 41.4 | 37.5 | 34.9 | 8.8 |
| Intentional Self-Harm | 18.5 | 21.5 | 19.8 | 18.3 | 21.9 | 16.7 | 8.2 |
| Other Cancers | 127.3 | 147.0 | 115.4 | 132.9 | 109.6 | 123.2 | 6.1 |
| Respiratory Diseases | 123.2 | 115.5 | 104.5 | 91.9 | 97.9 | 85.7 | 4.5 |
| Endocrine Diseases | 42.6 | 29.0 | 40.3 | 28.8 | 43.5 | 26.6 | 3.3 |
| Liver Cancer | 7.9 | 10.8 | 9.7 | 11.4 | 11.4 | 12.0 | 2.3 |
| Mental Health/Alcohol Use | 4.1 | 5.4 | 3.3 | 4.9 | 4.1 | 4.4 | 1.0 |
| Assault | 8.9 | 1.4 | 9.1 | 1.2 | 8.8 | 0.9 | 0.4 |
| Genitourinary Diseases | 26.7 | 18.3 | 25.9 | 19.2 | 25.2 | 17.2 | –0.4 |
| Prostate Cancer | 35.6 | 43.5 | 26.0 | 36.4 | 22.0 | 31.3 | –1.4 |
| HIV/AIDS | 7.8 | 2.6 | 5.0 | 1.6 | 3.0 | 0.9 | –3.1 |
| Colorectal Cancer | 29.2 | 35.5 | 22.7 | 31.9 | 19.4 | 29.0 | –3.3 |
| Lung Cancer | 89.9 | 72.2 | 74.5 | 64.7 | 58.1 | 55.8 | –15.4 |
NOTES: Change in difference = (U.S.–peer)2015–(U.S.–peer)2000.
Orange highlights indicate U.S. rate-peer rate >3.
Green highlights indicate U.S. rate-peer rate <3.
| Females | 2000 | 2008 | 2015 | Change in Difference | |||
|---|---|---|---|---|---|---|---|
| U.S. | Peers | U.S. | Peers | U.S. | Peers | ||
| All Causes | 836.5 | 732.4 | 731.8 | 641.0 | 713.1 | 594.6 | 14.4 |
| Digestive Diseases | 34.5 | 37.2 | 44.3 | 31.6 | 38.5 | 32.0 | 9.2 |
| Circulatory Diseases | 395.4 | 363.1 | 281.5 | 267.3 | 257.5 | 217.0 | 8.2 |
| Accidental Poisonings | 2.5 | 1.1 | 6.8 | 1.6 | 10.0 | 1.7 | 6.9 |
| Intentional Self-Harm | 4.1 | 6.9 | 4.9 | 6.1 | 6.2 | 5.7 | 3.3 |
| Respiratory Diseases | 96.9 | 78.8 | 87.2 | 68.0 | 84.4 | 64.6 | 1.7 |
| Mental Health/Alcohol Use | 2.4 | 3.2 | 2.0 | 3.0 | 2.6 | 2.7 | 0.7 |
| Liver Cancer | 3.4 | 4.0 | 3.7 | 4.8 | 4.6 | 4.6 | 0.6 |
| Endocrine Diseases | 39.3 | 26.2 | 35.1 | 25.6 | 36.5 | 22.9 | 0.5 |
| Other Cancers | 90.6 | 96.1 | 80.0 | 87.5 | 75.7 | 81.1 | 0.1 |
| Genitourinary Diseases | 22.9 | 13.9 | 22.2 | 15.2 | 21.5 | 14.1 | –1.6 |
| Breast Cancer | 30.5 | 30.6 | 25.6 | 27.1 | 23.2 | 24.2 | –0.9 |
| HIV/AIDS | 2.5 | 0.6 | 1.9 | 0.5 | 1.0 | 0.2 | –1.1 |
| Colorectal Cancer | 20.4 | 22.9 | 16.1 | 20.0 | 13.9 | 17.8 | –1.4 |
| Lung Cancer | 48.2 | 22.1 | 45.4 | 26.8 | 39.1 | 27.6 | –14.6 |
NOTES: Change in difference = (U.S.–peer)2015–(U.S.–peer)2000.
Orange highlights indicate U.S. rate-peer rate >3.
Green highlights indicate U.S. rate-peer rate <3.
The table presents cause-specific male and female age-standardized mortality rates for the United States and the peer country average for the years 2000, 2008, and 2015. In addition, the table shows how the gap in mortality between the United States and peer countries changed between 2000 and 2015. A positive change in the difference indicates that the United States fared worse than its peers over the period because it experienced either a smaller decrease or a more rapid increase in mortality relative to the peer countries. The table is sorted by the 2000–2015 change in the difference in mortality between the United States and peer countries. “Other cancers” include all cancers excluding prostate, liver, breast, colorectal, and lung cancers.
SOURCE: Data from OECD Stat (https://stats.oecd.org/index.aspx?queryid=30115).
Although the United States became increasingly disadvantaged relative to its 16 peer countries across many causes of death, it also outperformed these countries on lowering mortality due to HIV/AIDS and several types of cancer. Compared with the peer countries, the United States experienced a faster decrease in mortality from HIV/AIDS and colorectal cancer; female mortality due to breast cancer; and male mortality from lung cancer, prostate cancer, and diseases of the genitourinary system. Female mortality from lung cancer and diseases of the genitourinary system decreased in the United States but rose in peer countries. However, these reductions in cancer mortality were offset by increases in mortality from other causes, and the overall mortality gap increased.
Because of reporting differences across countries and over time, the cause-specific mortality rates discussed here could not be restricted to working-age adults, nor could these analyses be extended to the period before 2000. Despite these limitations, however, these analyses provide important clues about trends in causes of death that are most likely responsible for the U.S. disadvantage in life expectancy.
SUMMARY
The current U.S. disadvantage in life expectancy relative to peer countries is part of a decades-long trend in which the United States fell behind its peers in both life expectancy and mortality outcomes. For decades, the increase in U.S. life expectancy failed to keep pace with the increase in peer countries, and the gap widened after 2010 because of the stagnation and decline in U.S. life expectancy, which reversed years of progress. This stagnation and subsequent decline cannot be explained by the greater racial/ethnic diversity of the United States compared with its peers because it occurred among multiple racial/ethnic groups, including Whites.
U.S. working-age mortality has been among the highest of all peer countries since the 1950s, and the recent increase that occurred after 2010 did not occur in the peer countries, where mortality rates continued to decline. In the 1970s, although the United States experienced higher mortality among working-age adults, mortality was lower than in peer countries among young children and those over age 65. Much of the growing gap in life expectancy that occurred in the latter half of the 20th century was due to the expansion of the U.S. mortality disadvantage into both older and younger ages, where the United States had previously held an advantage. This long-term trend was driven by an increasing mortality disadvantage among adults over age 65, particularly among females. In the period since 2000, however, large and growing increases in working-age mortality that occurred only in the United States have played a larger role in the changes
in mortality rates, magnifying and expanding the disparity between the United States and its peers, particularly among males.
Although the United States saw relative improvements over peer countries in mortality from some causes of death (e.g., HIV/AIDS, certain cancers), these gains were offset by the growing U.S. disadvantage for other causes of death, particularly circulatory and digestive system diseases, accidental poisonings, and intentional self-harm. The U.S. disadvantage in mortality relative to its peers extends across a wide range of causes of death, including many chronic diseases that are costly and burdensome to treat, suggesting that eliminating the disparity between the United States and its peers will not be a simple task.
The U.S. disadvantage may be further complicated by the effects of the COVID-19 pandemic. The committee completed its work before detailed mortality data for 2020 were available. Although firm conclusions must therefore await future research, preliminary mortality data suggest that the U.S. mortality disadvantage may have worsened because the United States failed to contain the virus as effectively as did the 16 peer countries (Johns Hopkins University, 2020). The United States experienced higher mortality from COVID-19 relative to most of its peers (Bilinski and Emanuel, 2020). Although the results presented in this chapter show that the United States continued to maintain a mortality advantage at ages 75 and over, the high COVID-19 mortality at these ages is likely to have further eroded that advantage and potentially to have reversed it. In addition, the increase in mortality at working ages due to the virus will further widen the longstanding U.S. mortality disadvantage at these ages. Although the direct effects of COVID-19 on mortality will likely be temporary, some preliminary evidence indicates that those who recover from the disease experience long-term health problems.
ANNEX 2-1
International Trends Methodology
SOURCE OF INTERNATIONAL TREND COMPARISON DATA
Data for the Sixteen Peer Countries
All-cause mortality data for the 16 peer countries included in the analysis in this chapter were downloaded from the Human Mortality Database (HMD) on July 24, 2019 (www.mortality.org). The HMD is a collaborative international effort to provide open, international access to detailed mortality and population data for 41 countries and geographic areas throughout
the world. It is organized by research teams in the United States at the University of California, Berkeley and the Max Planck Institute for Demographic Research in Germany, with scientific contributions from researchers from many countries, and is supported by research grants and financial contributions from governmental and private sources. The HMD data include calculated mortality rates and life tables, as well as the original data underlying these calculations. All the HMD data can be accessed publicly and downloaded for free.
The analysis in this chapter uses calculated data from period life tables based on mortality from all causes of death for every year between 1950 and 2016 for which these data were available for the 16 peer countries. Data covering the full period were available for most of the countries; for a small number of countries, however, the available data did not begin until after 1950 or ended prior to 2016. Data availability for the 16 peer countries can be found in Annex Table 2-1.
Cause-specific mortality rates were drawn from the Organisation for Economic Co-operation and Development (OECD) statistics generator, which in turn draws its data from the World Health Organization’s (WHO’s) Mortality Database (2019). Data included in the WHO Mortality Database come from national vital statistics registration systems in the respective countries and focus on underlying causes of death coded using the International Classification of Diseases. WHO defines underlying cause of death as “the disease or injury which initiated the train of morbid events leading directly to death, or the circumstances of the accident or violence which produced the fatal injury” (WHO, 2019, p. 1).
Data for the United States
Data on life expectancy at birth for U.S. males and females and for White and Black males and females for the period 1950–2016 were drawn from Table 19 of the National Vital Statistics Reports (NVSRs) published by the National Center for Health Statistics (Arias, Heron, and Xu, 2017; Arias, Xu, and Kochanek, 2019), which includes estimated life expectancy at birth, in years, by race, Hispanic origin, and sex. Detailed sex- and race-specific life table data for 1970, 1980, 1990, 2000, 2010, and 2016 were also drawn from NVSRs from the relevant years (Arias, 2014; Arias, Rostron, and Tejada-Vera, 2010; Arias, Xu, and Kochanek, 2019; National Center for Health Statistics [NCHS], 1964, 1974, 1984, 1994). Although it was possible to download the detailed sex- and race-specific life table data for 1990 and later years directly, data from the 1970 and 1980 NVSRs were copied by hand into digital form. The hand-entered data and subsequent calculations were then checked for accuracy by National Academies’ staff.
ANNEX TABLE 2-1 Availability of Mortality Data for the 16 Peer Countries
| Country | Available Years | Exclusions/Exceptions |
|---|---|---|
| Australia | 1950–2016 | |
| Austria | 1950–2016 | |
| Canada | 1950–2016 | |
| Denmark | 1950–2016 | |
| Finland | 1950–2016 | |
| France | 1950–2016 | |
| Germany | 1956–2016 | As East and West Germany before 1990 |
| Italy | 1950–2014 | |
| Japan | 1950–2016 | |
| Norway | 1950–2016 | |
| Portugal | 1950–2015 | |
| Spain | 1950–2016 | |
| Sweden | 1950–2016 | |
| Switzerland | 1950–2016 | |
| The Netherlands | 1950–2016 | |
| United Kingdom | 1950–2016 |
The reporting of race-specific life expectancy and mortality data in the NVSRs changed over the 1950–2016 period covered in these analyses. Prior to 1970, these reports included life expectancy and mortality estimates for only two racial categories: Whites and non-Whites. From 1970 to 2005, the NVSRs reported life expectancy and mortality estimates for only the White and Black populations. In 2006, the National Center for Health Statistics began to incorporate ethnicity into its NVSRs. Beginning in that year, the NVSRs reported separate life expectancy and mortality estimates for the non-Hispanic White, non-Hispanic Black, and Hispanic populations. These changes mean that the racial/ethnic categories used for the time series in Figure 2-1 are not perfectly comparable over time. For example, the estimates for Whites include Hispanic Whites during the 1950–2005 period but exclude Hispanic Whites during the 2006–2016 period.
ANALYTIC STRATEGY
This chapter presents the results of five sets of analyses, presented in four sections. The first section compares life expectancy at birth by sex in the United States and the 16 peer countries. Life expectancy in the United
States is presented by sex and by sex and race or race and ethnicity. The second set of analyses (second section) presents the age-specific contributions to overall differences in life expectancy at birth between the United States and the peer countries derived using Arriaga decomposition techniques. The third set of analyses, also presented in the second section, shows the ratio of age-specific mortality rates in the United States to the peer country average. The fourth set of analyses, presented in the third section, shows the age-adjusted probability of dying between ages 25 and 64 in the United States and the peer countries, as well as the relative U.S. position expressed as a z-score. The final set of analyses, presented in the fourth section, compares cause-specific mortality rates in the United States with the peer country averages for selected causes of death. These final analytic results were drawn directly from OECD Stat and were calculated by the WHO Mortality Database (2019). The methods used to calculate them are detailed at www.mortality.org.
Life Expectancy at Birth
Life expectancy at birth for each country was not directly calculated but drawn from outside data sources. Life expectancy for the 16 peer countries was calculated by the HMD using standard life table construction methods detailed more extensively in the online documentation located on the HMD website.2 Life expectancy at birth for the United States was drawn directly from Table 19 of the NVSRs.
Arriaga Age Decomposition of Differences in Life Expectancy
As noted, the committee used Arriaga decomposition techniques (Arriaga, 1984; Auger et al., 2014) to estimate how deaths at specific ages contributed to differences in life expectancy between the United States and the peer countries in 1970, 1980, 1990, 2000, 2010, and 2016. Using this method, it was possible to show the specific contributions of ages <1 year, ages 1–4 years, and all 5-year age groups from 5–9 through 95–99. (The contribution for ages 100 and older was not calculated because deaths above age 100 are unusual and do not contribute substantively to the differences in life expectancy between the United States and peer countries.)
Using this method, the age-specific contributions to differences in life expectancy have two components. First is the direct effect of higher mortality rates for each age group: people who die within that age range relative to those who do not contribute fewer years lived to life expectancy during that range. For example, an individual who dies at age 27.5 in a given year
___________________
contributes 2.5 years lived (from age 25 until age 27.5) during the 25–29 age interval, while an individual in this age group who does not die contributes 5 years lived (from age 25.0 to the end of the interval, age 30.0).
The second component of the age-specific contribution to life expectancy is the indirect effect: individuals who die within a given age group will not add any years lived to older age groups. For example, if a woman would have survived to age 64.0 had she been subject to the mortality rates in population A but instead died at age 60.0 because she was subject to the higher mortality rates in population B, then part of the difference in life expectancy for ages 60–64 in populations A and B is due to the fact that this individual did not survive to contribute years lived to this age group in population B but would have done so in population A.
The Arriaga decomposition technique decomposes the total difference in life expectancy into the differences in the contributions to life expectancy of mortality within each age group. These age-specific contributions are calculated as the sum of the direct and indirect effects of differences in mortality between two populations in each age group. For example, the difference between the life expectancy for females in the United States and in peer countries in 1980 was –.33 years; that is, U.S. female life expectancy was .33 years lower than the average female life expectancy in peer countries. This overall .33-year life expectancy difference can be decomposed into age-specific differences between the United States and peer countries:
- a .23-year disadvantage for U.S. females below age 25,
- a .31-year disadvantage for U.S. females between ages 25 and 49,
- a .59-year disadvantage for U.S. females between ages 50 and 74, and
- a .80-year advantage for U.S. females above age 75.
Taken together, these age-specific differences generate the overall .33-year disadvantage:
–.23 + –.31 + –.59 + .80 = –.33 years
Because of the indirect effect of higher mortality, the same differences in mortality can have a larger impact on life expectancy at birth if they occur at younger versus older ages. However, this effect is countered by the fact that age-specific mortality rates are much lower at younger than at older ages, so absolute differences in mortality rates tend to be smaller.
Ratio of Age-Specific Mortality in the United States to That in the Peer Countries
To isolate the effect of international differences in age-specific mortality rates, the committee calculated the ratio of the probability of dying within a given age group in the United States to the peer country average for 1970, 1980, 1990, 2000, 2010, and 2016. As with the Arriaga decompositions, the analysis focused on the specific contributions of ages <1 year, ages 1–4 years, and all 5-year age groups from 5–9 through 95–99. When possible, these age-specific probabilities were drawn directly from the NVSRs (United States) or the HMD (the 16 peer countries). When the probabilities included in these sources were reported in single-year age increments, the 1-year probabilities were used to calculate the 5-year probabilities using standard life table calculation methods (Preston, Heuveline, and Guillot, 2000).
The Probability of Death Between Ages 25 and 64
Figure 2-4 shows the probability of death occurring between ages 25 and 64, based on calculating the probability of dying for each 1 year of age using standard life table methods (Preston, Heuveline, and Guillot, 2000), and then applying these probabilities to a standardized population to create a synthetic cohort whose members were exposed to these death probabilities throughout their working ages. Assume, for example, that the probability of dying between an individual’s 25th and 26th birthdays is 0.00057, and the probability between the 26th and 27th birthdays is 0.00063. Based on these probabilities, in a population of 100,000 people who survive to age 25, the probability of dying between ages 25 and 27 would be calculated as
100,000 x 0.00057 = 57 deaths 99,943.00 survivors to age 26
99,943 x 0.00063 = 61.96 deaths 99,881.04 survivors to age 27
probability of death between ages 25 and 27:
(57 + 61.96)/100,000 = 0.0011896
Note that the probability of dying between ages 25 and 27 is less than the sum of the probabilities of dying at ages 25 and 26, because those who do not survive to age 26 are not eligible to also die at age 26. By beginning with a standardized population size and iteratively applying the probability of death at each age to only the population that survives to that age, the final probabilities of death between ages 25 and 64 are standardized and are no longer dependent on the underlying population age distribution. In standard life table notation this estimate refers to (l25 – l65)/l25, where l25 is the number of people that survive to age 25, and l65 is the number of people that survive to age 65.
This page intentionally left blank.


