
– 11 –

Census Bureau’s Responses and Own Analyses of 2010 Demonstration Data Products
Linda Jacobsen (Population Reference Bureau) introduced the final presentation block of the workshop, which was reserved for the Census Bureau to offer reactions to what they had observed and heard over the course of the workshop, as well as to summarize the results of their own investigations of the 2010 Demonstration Data Products (DDP). As Jacobsen commented, the public release of the 2010 DDP was accompanied by an email address and an encouragement to provide feedback directly to the Census Bureau, and so this workshop session was intended to provide a forum for reaction to those comments.
As with the Census Bureau’s first presentation block on the workshop’s first day (Chapter 2), the Census Bureau divided the presentation space into two talks, with Matthew Spence (presenting work cocredited to Population Division colleague Marc Perry) discussing demographic findings in the 2010 DDP (Section 11.1) and William Sexton (on behalf of and with support from the Disclosure Avoidance System [DAS] development team) presenting initial findings and next steps concerning the new differential privacy–based approach (Section 11.2). Closing the session, Census Bureau deputy director Ron Jarmin took a few minutes to talk about next steps for continued user engagement (Section 11.3).
| Percentile | Blocks | Blocks With Nonzero Population | Block Groups | Tracts | Counties |
|---|---|---|---|---|---|
| 25th | 0% | 13% | 0.5% | 0.2% | 0.1% |
| 50th (Median) | 6% | 36% | 1.2% | 0.5% | 0.2% |
| 75th | 46% | 100% | 2.2% | 1.0% | 0.5% |
| 95th | 275% | 560% | 4.8% | 2.3% | 2.3% |
SOURCE: Matthew Spence workshop presentation (modified only to put the median/50th percentile as the second row rather than the first).
11.1 DEMOGRAPHIC FINDINGS OF THE 2010 CENSUS DEMONSTRATION DATA PRODUCTS
At the outset, Matthew Spence (U.S. Census Bureau) thanked not only presentation coauthor Marc Perry, senior demographer in the Population Division, but dozens of other colleagues in the Census Bureau’s Population and Geography Divisions for their assistance and ongoing work in analyzing these data.
11.1.1 Geography
Spence first discussed the demographic findings related to census geography, in particular the difference in accuracy experienced between on-spine and off-spine geographic levels (Figure 2.1). Looking first at on-spine levels, he first began by corroborating, in striking fashion, that which had emerged in several workshop presentations: data at the census block level are fairly noisy. The Population Division’s analysis calculated absolute percent differences between the original 2010 Census data and the 2010 DDP for all units at several geographic levels; the results are summarized in Table 11.1. Counties proved relatively accurate, with a median absolute percent difference of 0.2 bracketed by 25th and 75th percentiles of 0.1 percent and 0.5 percent, respectively. (This means that the central 50 percent of the county-level observations fell in the tight range of 0.1–0.5 percent absolute difference between 2010 Census and 2010 DDP.) There is a bit more play in the distribution at the block group level, around a median of 1.2 percent. But percent differences at the block level can be massive—a median absolute percent difference of 6 percent between original 2010 Census data and 2010 DDP results, a 75th percentile at 46 percent, and a 95th percentile of 275 percent (meaning that 5 percent of counties experienced
differences of 275 percent or more). Restricting attention to blocks with nonzero population in both the 2010 and 2010 DDP data (thus filtering out numerous uninhabitable bocks) only exacerbates the noisiness of the data, with the median increasing to a 36 percent difference and the 95th percentile reaching 560 percent.
Spence then presented boxplots of the absolute percent difference (broken down into population size categories) for one on-spine geographic level, counties, and two off-spine levels, county subdivision and place. Doing so corroborated the findings of several workshop presenters: the values for off-spine geographic levels are distinctly less accurate than those on-spine geographic levels that receive direct allocation of privacy-loss budget ϵ. Moreover, the effect varies by population size of the geounits. The absolute percentage differences between the 2010 Census and 2010 DDP are more variable for the smaller geounits (counties, county subdivisions, and places with populations between 10,000 and 49,999), and those distributions tighten for larger population size categories (50,000 to 100,000 and 100,000 or greater). For geounits under 10,000 population, counties (on-spine) have absolute percentage differences tightly concentrated near 0, with the distributions for small county subdivisions and places being noisier still.
Spence noted that 500 of the nation’s 3,143 counties have a population below 7,500. As mentioned earlier, for all counties, Spence found a median absolute percent difference of 0.2 percent, quartiles at 0.1 and 0.5 percent, and 95th percentile 2.3 percent. For those 500 least populous counties, the differences between the 2010 Census and the 2010 DDP suggest some fairly large changes: median 1.4 percent, quartiles at 0.67 and 2.6 percent, and 95th percentile 7.6 percent. While these small counties might only be 16 percent of all the counties, Spence said that they are hardly randomly distributed: they are the majority of the counties that comprise states such as Alaska, the Dakotas, Nebraska, and Kansas.
11.1.2 Characteristics
Replicating the age pyramid analysis conducted for Virginia localities for presentation to the Census Bureau’s Data Stewardship Executive Policy Committee (see Section 2.2), Spence and colleagues focused on other counties. In this presentation, he presented results from the counties that turn out to be the median county and the 25th percentile county in the nation in terms of total population in 2010: Lyon County, Minnesota, and Bacon County, Georgia. Figure 11.1 illustrates the results for Lyon County.
Spence said that the age pyramids for large counties look very good and generally match the patterns seen in the 2010 Census tabulations (indicated in the plots by black outline boxes). The median and 25th percentile counties are, by definition, smaller than that, and the age pyramid for Lyon County
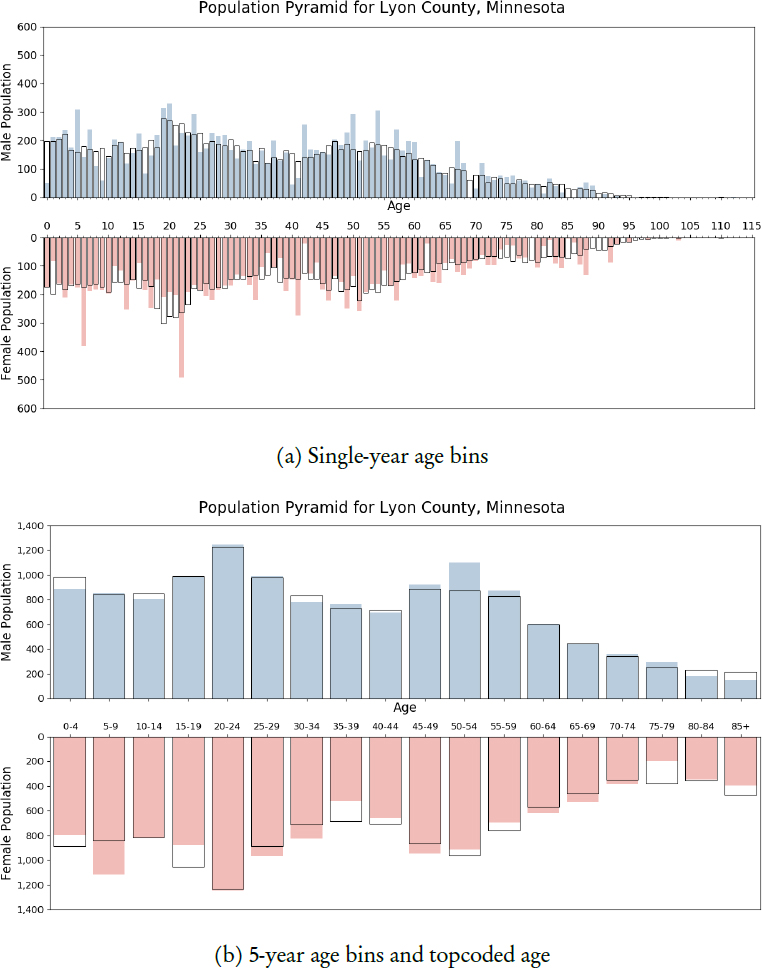
NOTES: DAS-generated Microdata Detail File values indicated by shaded bars; true 2010 Census values denoted by unshaded boxes.
SOURCE: Matthew Spence workshop presentation.
(the median) in the top plot of Figure 11.1 shows the distribution of the 2010 DDP data to be very jagged and prone to some very discrepant results. Spence pointed in particular to the left-most bar in the plot, showing about 200 0-year-old males in the 2010 Census tabulations and only about 50 in the 2010 DDP. But the overall shape of the distributions are reasonably consistent. But, Spence hastened to add, half the counties in the nation have populations smaller than Lyon County; the plot for the 25th-percentile county (Bacon County, Georgia) is not depicted here but looks considerably worse.
As shown in the second plot of Figure 11.1, Spence and colleagues found that they could ameliorate some of the noisy appearance by binning the ages into categories (here, five-year age groups) and topcoding age at 85 and over. Rendered in that way, the shaded bars and black outlines are a lot closer than in the single-year age bins, which is “heartening to see,” Spence said. The binning and topcoding improves the appearance of the pyramids for Bacon County as well, though differences do persist.
Turning attention to differences in the data on race, Spence and colleagues found the marked inflation in the 2010 DDP of person records with combinations of four, five, and six major race groups to be interesting. The 2010 Census tabulations indicated 299,736,465 person records with only a single race group indicated, while the 2010 DDP found 299,724,408 such single-race persons, a negligible change relative to the nation as a whole. The number of two-race combinations in the 2010 DDP person records experienced the largest numeric change (21,183), but still a small percentage relative to the 2010 Census tally of 8.27 million. For three-race combinations, the 2010 DDP begins to show more cases than the original 2010 Census tabulations (676, 469 → 687, 813), still relatively small in percentage change. But the number of four-way combinations jumped 25.4 percent (57, 875 → 72, 578), five-way combinations by 55.4 percent (8, 619 → 13, 995), and the number of cases ticking all six major race categories up by 305.2 percent (792 → 3, 209). Spence quickly displayed a series of scatterplots, plotting 2010 DDP counts by 2010 Census original data counts for these multirace combinations, at the state and county levels, all showing generally tight clustering for around the 45-degree equality line but some fan-out and locally large shifts for smaller states and counties, for instance, the combination of Asian, American Indian and Alaska Native, and “some other race” in North Dakota.
Spence found that agreement is generally good at the state and county levels for the characteristic of Hispanic origin. Relatively few counties experienced a change greater than 5 percentage points, and as with other experiences, the misses in excess of 5 percentage points tended to be in less populous areas.
To get a sense of effects in the housing unit and household data—which have drawn less attention than the person-level data—Spence and colleagues asked their colleagues in the Census Bureau’s Center for Enterprise Dissemination Services and Consumer Innovation (CEDSCI) to produce seven pairs of county-
level maps, each pair with common color coding categories, to graphically display differences between original 2010 Census and 2010 DDP data. He added the caveat that the seven variables make use of variables (and recoded variables) on the housing unit side of the DAS-processed Microdata Detail File (MDF). They do not involve person–household joins, or record linkage between the person and housing unit MDFs.1 The seven variables covered by the uniform-look county-level maps are:
- Percentage of households with children under 6 years of age,
- Percentage of households that are same-sex couples (a special case that was not a published result from the 2010 Census, as the relationship question in the 2010 Census did not include the relevant categories; this was a special recode to approximate the way the information will be collected in 2020),
- Percentage of households where householder race is black alone,
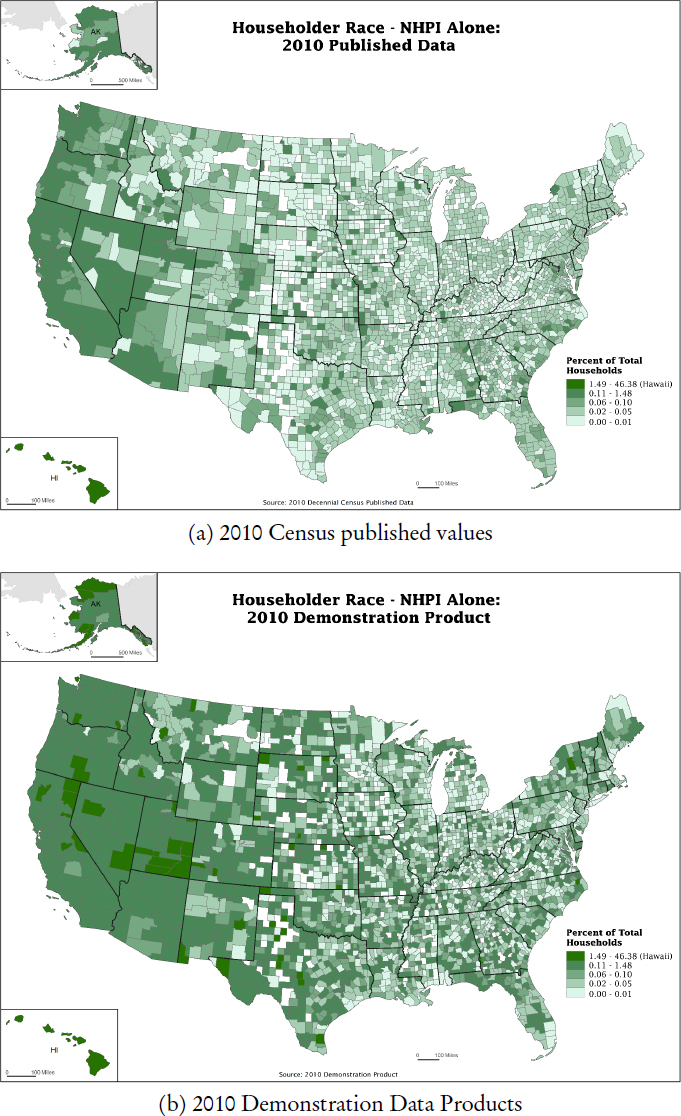
- Percentage of households where householder race is Native Hawaiian and Pacific Islander alone,
- Percentage of households where householder race is Asian alone,
- Percentage of households where householder race is American Indian or Alaska Native alone, and
- Percentage of households where householder is Hispanic.
To illustrate the point of the visuals, the maps for householder Native Hawaiian and Pacific Islander alone are shown in Figure 11.2. That point, Spence suggested, is that, when the category breaks and color schemes are held constant, the maps from the two sources are quite different. The 2010 DDP maps seems to show signs of the inflation of the rarer race categories (tendency toward darker shades and higher values) that Spence noted previously.
11.1.3 Observations
Spence said that he wanted to close with some observations, the first two of which were in the nature of reassuring workshop participants that “we have noticed [what] pretty much everybody has noticed” and that “we really appreciate you calling it to our attention.” The first of these is the now-familiar observation that large areas and population groups tend to lose population in the DAS processing while small areas and groups tend to gain. To illustrate the point, he briefly displayed a table grouping the nation’s counties by population size and computing median difference and median absolute differences between the original 2010 Census data and the 2010 DDP estimates. He said that it is also becoming increasingly clear that this behavior might be inherent to the
___________________
1 Indeed, person–household joins (as would be necessary to generate some tables and analyses on household structure and to derive family structure within households) are out-of-scope for the main 2020 Census TopDown Algorithm.
process (due to the nonnegative integer constraint), but it is still something being examined. The second of these points are the various problems that were pointed out about vacancy rates. The Census Bureau is now aware that several hundred counties showed a 0 percent vacancy rate in the DDP and that almost one-fourth of counties “ended up having a vacancy rate lower than the lowest published vacancy rate in 2010.” But, he added, the Census Bureau is working on ameliorating that.
The interplay of the disclosure avoidance approaches with the Census Bureau’s population estimates program came up several times in the workshop. By way of overview, Spence said that the big product of the estimates program are the annual postcensal estimates, using recent data on births, deaths, and migration to update the most recent decennial census figures. These are published at the county level covering age, sex, race, and Hispanic origin. The program also works on several end-of-decade projects: intercensal estimates that adjust the postcensal estimates to produce consistent time series, demographic analysis that provides an independent coverage measure of the census, and estimates evaluation that studies how well postcensal estimates aligned with the decennial.
Spence said that the concern about how these population estimates work with the disclosure avoidance approach has arisen because the estimates are so important. Like the decennial census tabulations themselves, they have major legal, regulatory, and research uses. The challenge, he said, is that the differential privacy–based approaches make it very difficult to apply the Census Bureau’s known, proven methods for estimation. In particular, the postcensal estimates rely on a cohort-component method, using both administrative records and decennial census data. However, the fully synthetic MDF arising from the 2020 DAS—which cleaves person and housing unit data apart at the outset—will not contain the full set of geographic and demographic characteristics needed for the record linkage and estimation processes to work. As brief illustration of the level of error potentially involved, Spence displayed a table showing mean absolute percent error (MAPEs) from comparing 2010-vintage postcensal estimates to the 2010 Census data, as well as MAPES from comparing the same estimates to the 2010 DDP data. For the nation as a whole, the MAPE for the resident population based on the 2010 Census publications is 7.7 (that is, the average percent error was 7.7 percent in either direction). Based on the 2010 DDP, the MAPE is 13.0, indicating more noise, but the problem is accentuated by looking at breakdowns of the household separate from the group quarters population and by state. In estimating the household population of Vermont, a comparison of 2010-vintage estimates to the 2010 Census tabulations yields a MAPE of 17.1. The corresponding MAPE for the 2010 DDP is 113.9, an average swing of 113.9 percent error in either direction. Spence said that the Census Bureau is currently studying various approaches on the best way to move forward on this matter.
Spence acknowledged the external feedback that the Census Bureau received since the publication of the 2010 DDP, and outlined common concerns including the handling of small populations and non-hierarchical or off-spine geographies and the consistency between DAS-processed decennial census data and other data sets. He added that users and stakeholders had expressed concern about whether 2020 Census demographic data at the county level (and below) will be available and sufficient to produce their own population estimates, about the availability of microdata in general (e.g., through a Public Use Microdata Sample), and about the interplay between the differential privacy approach and the Census Bureau’s Population Estimates program. In closing, he recapped the basic findings that total population counts and basic characteristics at the national, state, and larger metropolitan areas look very similar to the published data, while the counts for less populous areas or smaller groups are noisier. He noted that research is ongoing to produce some tables not included in the demonstration data (notably those requiring person-household joins) and to remedy “demographically implausible” results that have been noted (such as the 0 percent vacancy rates). He said that the Census Bureau looks forward to taking user feedback into account to create 2020 Census data products with maximum utility for data users.
11.2 KNOWN ISSUES AND NEXT STEPS IN DISCLOSURE AVOIDANCE SYSTEM DEVELOPMENT
William Sexton (U.S. Census Bureau), a member of the DAS Team, introduced himself as “the guy that Phil Leclerc kept referring to as if I had all the solutions”—“I don’t, sorry.” But he said that he had been fascinated by the animated discussions surrounding these topics and excited to see some of the examples that do show the 2010 DDP doing reasonably well compared to the original 2010 Census publications. He noted that he is still “very grateful that I don’t need to make those policy decisions,” which will be difficult.
Sexton said that it is important to clarify again that there are two primary sources of error within the TopDown Algorithm (TDA):
- Measurement error arising from the actual differential privacy part of the process, injecting noise into the histogram cell counts (“the noisy pictures that we take of the data”), and
- Post-processing error arising from the statistical inference processes necessary to convert the noisy pictures into legitimate contingency tables, where the table cells are non-negative integers and the cells add up properly to the margins.
Of these, Sexton said, post-processing error is “much larger” and more problematic than the measurement error introduced through the differential privacy noise. The noisy measurements, by construction, are unbiased
estimates of the quantities they are trying to evaluate. The bias issues that have been discussed throughout the workshop—positive bias in small counts, negative in large counts—are a direct result of post-processing error (as well as the need to respect invariants and other constraints in the system).
Sexton reiterated that post-processing is an umbrella term that refers to anything that you do after applying differential privacy, the point being that post-processing is not constrained by differential privacy. The import of this is that the protections of differential privacy apply through the noisy measurement process. Techniques to ameliorate post-processing error can proceed and tap insights from fields including demography, statistics, computer science, econometrics, and operations research without the expense of additional privacy-loss budget.
Adding more detail, Sexton commented that a central issue is that the TDA post-processing relies on solving what the DAS team calls “the L2 optimization problem,” or in other words, using nonnegative least squares (NNLS) to find a best-fitting, nonnegative histogram to a set of noisy measurement “queries,” measuring closeness through mean squared error. This optimization is also constrained to respect invariants and structural zeroes as well asl to observe hierarchical consistency (table cells adding up to their margins, block counts adding up to block group counts, and so forth). The noisy measurements and queries used in the L2 solve typically include a detailed (fully saturated) histogram query, which is essential to the binding requirement that the disclosure avoidance process create microdata as the output (for input to the Census Bureau’s tabulation systems). Besides the detailed histogram query, runs typically include other marginal queries, such as histograms that mimic the table specifications for the P.L. 94-171 redistricting data products.
The catch in this is that NNLS is not the more familiar ordinary least squares (OLS), and hence does not share some of the key properties of OLS. OLS is a best linear unbiased estimator, so if it were possible to use it in the DAS context, Sexton said, we would have the solution with provably minimum variance that is unbiased, and it would be difficult to reduce the post-processing error beyond that. Sexton said that the DAS team is working on a hybrid solution that uses OLS when possible and reverts to NNLS after that. This is unlikely to be a perfect solution, but it should produce improved accuracy without consuming additional privacy-loss budget ϵ. Reiterating that improving post-processing is not constrained by differential privacy, he noted that reducing post-processing error is not a privacy research problem per se, but rather a statistical research problem. Sexton said that this research is also the primary focus of the DAS scientific team at the moment, and that collaboration is welcome in the work.
Sexton said that it is important to note that the TDA is designed to optimize for counts, not for ratio or nonlinear functions. He acknowledged workshop presentations on the use of those counts as denominators for rate
calculations and does not diminish the importance of those use cases: “we understand that.” But the fact is that the TDA isn’t being optimized for those calculations. Likewise, for application areas such as spatial segregation models or demographic forecasting, using the original differentially private, noisy measurements before post-processing would likely make the methods work better. The useful point here is that the noisy measurements are (as promised by differential privacy) future-proof to any subsequent attacks, meaning that providing direct access to the noisy measurements need not require the use of the Census Bureau’s Research Data Centers as a broker. They could be released as an alternative product to the census. (However, the approach would require the Census Bureau to support alternative releases surrounding the decennial census.) Given resource constraints, Sexton said that the Census Bureau is awaiting feedback from the user community before committing to producing alternative data releases and products.
Allocation of the privacy-loss budget ϵ by geography is another critical topic going forward. The TDA currently expends ϵ on the spine, or central hierarchy, and not at all on the off-spine areas. With respect to allocation along the spine, Sexton said that the suggestion to make better strategic or programmatic use of the extra layer (tract groups) that the TDA has already built into the process is a good one and should be explored. He added that the current design, which focuses on the spine, is meant to directly support the redistricting function, subject to the constraint that future districts can’t be put on the spine even if so desired because they are not known a priori.
In regard to the second point, the off-spine geographies, Sexton said that creating a separate geographic spine for processing some of the current off-spine areas in a systematic way would require a “major redesign” of TDA. In turn, that would require a policy decision, and so that is not an engineering consideration for the DAS team at present. But, Sexton acknowledged, presentations at this workshop have made it very clear that “this design feature may have created unintended consequences,” including some major inequities, and these are being documented and addressed by Census Bureau staff. Sexton says that the current TDA design does make it feasible to incorporate custom queries embodying important information about some off-spine geographies, and this may be an avenue for making improvements. For instance, a custom query could be used to target the collection of cells corresponding to geographic areas where combinations of three or more major race groups are very unlikely. Sexton cautioned that such special queries cannot violate differential privacy, which notably precludes looking at the 2020 Census data themselves to define the special queries (for instance, using the 2020 Census data to find those areas where combinations of three or more major race groups are very unlikely to be reported). But using auxiliary data such as previous censuses or the American Community Survey could serve the same purpose. More encouraging, Sexton said, internal experimentation suggests to the DAS team that “when we
correctly select these special queries, the potential gains in accuracy far outweigh the potential losses of possibly choosing these special queries poorly.”
Reiterating Spence’s point, Sexton said that the DAS team is aware of the 2010 DDP showing unrealistic 100 percent or 0 percent vacancy rates and generally showing large drops in vacancy relative to the SF1. Sexton said that this behavior is a direct albeit unintended consequence of the design of the 2010 DDP as a subset of the full, planned Demographic and Housing Characteristics (DHC) file series. He said that they are confident that implementing the complete design, which was not possible for the 2010 DDP will address these issues, adding that the Census Bureau would be very interested in gaining access to the code and analyses that data users have run on the vacancy rate problems so that the Census Bureau can verify that the problems have been solved.
In addition to the allocation of ϵ across geographic levels, there will be keen interest in the allocation of ϵ across tables and queries. When implemented fully, the full specifications for the 2010 P.L. 94-171 file and the DHC files amounts to roughly 2.5 million different record types within each geounit within the geographic hierarchy. The current allocation scheme is somewhat ad hoc, representing best efforts to “tune” the allocation. Decisions on how best to spend privacy-loss budget in the full configurations is a policy matter beyond the scope of this presentation, but an area in which continuing research and collaboration is welcome as well.
Sexton closed with an appeal for feedback at any time. Particularly “helpful, actionable feedback” would include continuing to identify “impossible or improbable outcomes” that manifest themselves in the 2010 DDP, as well as articulation of “acceptable tradeoffs” or standards-based thresholds that data users would be willing to bear or that would be absolutely essential to be acceptable for particular use cases. He said that he has been “blown away by the amount of effort and work that has gone into the organization of this conference, as well as the passion of the data users in caring deeply about the utility of the data,” and hopes to continue to work together “to create the best product we can.”
11.3 NEXT STEPS FOR USER ENGAGEMENT
Ron Jarmin (deputy director, U.S. Census Bureau) thanked the presenters and participants for their energy and, on the part of the Census Bureau, echoed Spence and Sexton in saying that the Census Bureau hoped to “continue this conversation as we get closer to releasing these products.” To that end, he announced that the Census Bureau would be working with the Committee on National Statistics to organize a few working groups—ideally including many workshop participants but other folks as well—and so he encouraged suggestions for participants to have on hand for these discussions.


