
– 2 –

Disclosure Avoidance in the 2020 Census
After brief introductory remarks on behalf of the Committee on National Statistics (Brian Harris-Kojetin, director), the U.S. Census Bureau (Ron Jarmin, deputy director), and the workshop planning committee (Joe Hotz and Joe Salvo, cochairs), the workshop began in earnest with a two-part presentation by Census Bureau staff. Philip Leclerc (Section 2.1) provided a general overview of the Census Bureau’s approach to disclosure limitation. In the interest of time, Leclerc did not delve too deeply into the details of how the Census Bureau’s algorithm is executed, with some of that material being covered in brief in later remarks by David Van Riper and Seth Spielman (Section 3.1) or deferred to background documents accompanying the release of the 2010 Demonstration Data Products (DDP). For clarity here, the passage in this chapter incorporates material from the later presentation and the associated documents. Matthew Spence (Section 2.2) completed the session with a reprise-in-brief of the presentation given to the Census Bureau’s Data Stewardship Executive Policy (DSEP) Committee, which led to their selection of parameters for the construction of the 2010 DDP.
2.1 THE 2020 DECENNIAL CENSUS TOPDOWN DISCLOSURE LIMITATION ALGORITHM: A REPORT ON THE CURRENT STATE OF THE PRIVACY LOSS–ACCURACY TRADE-OFF
2.1.1 Reason for the Change: The Simulated Database Reconstruction Attack
Philip Leclerc (U.S. Census Bureau) described the development of what is formally known as the 2010 Decennial Census TopDown Disclosure Limitation Algorithm (TDA for short), fleshing out some details of the Census Bureau’s simulated database reconstruction attack against itself that was alluded to in Chapter 1. Leclerc said that the simulated attack was motivated by the basic fact that the data landscape surrounding the Census Bureau has changed “dramatically over the last 30 to 40 years” in three critical respects. The sheer amount of available electronic data on persons and households outside of Census Bureau walls, the cheapness and availability of large-scale computing power (such as in the cloud), and the availability of “sophisticated mathematical algorithms” for mining insights about individuals from public releases of data have all advanced rapidly in the past few decades. In tandem, these developments led the Census Bureau to ponder whether its traditional disclosure limitation methods, such as the swapping of data records or the suppression of very small counts in tables, were capable of meeting modern demands.
Leclerc likened the database reconstruction problem to “solving the world’s largest Sudoku puzzle,” focusing principally on roughly a dozen publicly available, already-published tabulations from Summary File 1 (SF1) of the 2010 Census to make inference about what possible sets of underlying microdata values could possibly have produced those tabulations. The guiding notion of the approach is that every piece of published tabular data provides some hint about the underlying person-level data. Hence, Leclerc said, adding more and more tabulations (at varying levels of geography and covering different combinations of variables) that are “reasonably informationally independent of one another” reduces the number of sets of possible microdata values that could have generated all those tabulations. The more the available data, the closer one gets to a single unique answer to that question.
In the context of the 2010 Census, Leclerc said, this work involved inferring five variables to populate 308,745,538 “reconstructed records,” mimicking a person-level microdata set for the full 2010 count across 6,207,027 census blocks. The five variables used in the reconstruction were census block, sex, age (in individual years, 0–115), race (63 categories),1 and ethnicity (binary, Hispanic
___________________
1 The U.S. Office of Management and Budget (OMB) defines five minimum race categories: white, black or African American, American Indian or Alaska Native, Asian, and Native Hawaiian or Pacific Islander. The Census Bureau is permitted by OMB and required by appropriations
or non-Hispanic). Comparing these reconstructed records to the 2010 Census Edited File (CEF, the sensitive master dataset of census returns), 46 percent of the population (142 million person records) were an exact match on these five variables, rising to 71 percent if age is allowed to “match” plus or minus one year. On their own, these matches suggest the “high fidelity” of the database reconstruction work, Leclerc said—but the problem comes during the actual simulated “attack” when linkages are made between the reconstructed records and a commercial data set that had been collected in support of the 2010 Census as it was carried out (that is, external data to which an external attacker might have access). Those commercial data did not include race and Hispanic origin data, but they did include critical, personally identifiable information—name—in addition to block, age, and sex. Linking the reconstructed records and the commercial data by block × sex × age yielded 138 million (45 percent) “putative reidentifications,” possible or suspected matches that an attacker could infer even though they would still have uncertainty as to exactly which person record was a match. The Census Bureau, though, has the unique capacity to compare these results to the confidential CEF data, and doing so confirmed 52 million (38 percent) of these putative reidentifications (17 percent of the overall 2010 Census population) as being correct on name, census block, sex, age, race, and ethnicity.
Though “it is heartening that this 38 percent is not 100 percent,” Leclerc noted that it is “extremely disconcerting that this rate is several orders of magnitude larger than anything we have seen in the past in similar studies of this kind.” The magnitude of the bottom-line 17 percent reidentification risk reinforced the notion that the data landscape has fundamentally changed in recent decades and that database reconstruction attack “does potentially represent a significant and meaningful threat to traditional disclosure limitation algorithms.” Leclerc said that the magnitude of the potential risk is the reason why the Census Bureau turned to formal privacy, or differential privacy, techniques: because the mathematical proofs about the privacy guarantees that they impart provide a strong measure of future-proofing against the range of data, computational power, and algorithms that attackers in the future (or today) may bring to bear.
2.1.2 Structure of the TopDown Algorithm
Throughout the workshop and in the early public discussions of disclosure avoidance in the 2020 Census, the term “differential privacy” (also known
___________________
legislative text to also include “some other race” as a category. Since the 2000 Census, census respondents have been permitted to specify more than one race for themselves. Hence, what are sometimes called the 63 “OMB categories” summarize all the various combinations of six main race categories: six one-way combinations, 15 two-way, 20 three-way, 15 four-way, six five-way, and one six-way.
as “formal privacy”) was used fairly loosely, often referring to the specific implementation being used by the Census Bureau. In fact, Leclerc commented, there is practically “an infinite range of algorithms you could design, and you have a lot of choices to make,” in implementing differential privacy. The challenge is one of developing an algorithm that fits the particular application at hand.
The basic premise of the Census Bureau’s planned TDA routine is to start with the CEF, the true underlying data collected in the census after any quality edits or imputations for missing information are made. CEF data are in microdata form, individual records for every person and housing unit. As described by Leclerc, the TDA takes the CEF and a set of constraints and parameters and uses them to construct a new, wholly synthetic microdata file as output. This new file does not have any one-to-one correspondence with the original CEF records, but being microdata are appropriate to enter the 2020 Census tabulation systems and generate tables and products. The resulting tables from the TDA as it existed in October 2019, comprising the files used in redistricting and much of the content planned for the 2020 Demographic and Housing Characteristics (DHC) tables, were dubbed the 2010 Demonstration Data Products (DDP). At the workshop, this output dataset was dubbed the Microdata Detail File (MDF); in subsequent months, it has been relabeled more evocatively as Privacy-Protected Microdata Files (PPMF). Though the beginning and ending formats in this process consist of individual-record microdata files, the intermediate steps are taken with respect to a “histogram,” which Leclerc described as a “more numerically useful” and computationally tractable form that is informationally equivalent to the microdata forms.
A subtle but very important point is that the Census Bureau’s TDA works on person and housing unit information completely separate from each other. The MDF and PPMF are plural, having both person and housing unit files with no explicit linkage. It is for this reason that plans for handling 2020 Census data products requiring household-person “joins” such as inference about family structures are out of scope for the TDA, and those plans remain works in progress. The added complexity is also why descriptions of the TDA (like that in the remainder of this section) tend to emphasize the mechanics of constructing the person file; there are parallel processes working at constructing analogous housing unit files.
The constraints and parameters in Leclerc’s capsule description were referred to throughout the workshop. Chief among them is the privacy-loss budget, commonly denoted by ϵ (epsilon), along with a plan for allocating shares of that ϵ to particular data tables and geographic levels. These aspects of ϵ are discussed in more detail below, but at the outset, ϵ can be thought of as a slider that governs the chosen balance between privacy (introducing more error) and accuracy (introducing less error). The constraints include a set of structural zeroes, or instances where logic dictates that a histogram cell entry must be 0
in the TDA-synthesized results. Leclerc cited the example of “a householder who is two years old” as one example of such an impossible record type that constitutes a structural zero. Critically, the set of constraints also includes a set of data-dependent “invariants:” values that are held immune from privacy protection and that must carry forward directly from the CEF to the protected data. Most notably, the political sensitivity of state-level population totals for apportionment of the U.S. House of Representatives is such that those figures are held immune from change in the disclosure avoidance process. More subtly, the Census Bureau included the count of housing units and group quarters units at the block level as invariants in the 2010 DDP to prevent the algorithm from, for example, establishing a count of college-age dormitory students in census blocks that do not include such dormitories.
In broad outlines, the actual “differential privacy” part of the TDA lies in generating a set of “noisy measurements”—adding a controlled amount of random statistical noise to all applicable histogram cells, where the noise is generated from a probability distribution dependent on the pertinent share of ϵ. The basic premise is that these noisy measurements in the histogram are now privacy-protected, having had statistical error injected into them in an unbiased manner. The problem, Leclerc said, is that they will be inconsistent and “they won’t look like microdata anymore.” In other words, the sum of all the noisy measurements for age categories may differ from the sums by the race categories alone, and the noisy measurements may be negative and, depending on what probability distribution is used to draw the random noise, decimal-valued. Hence, the TDA takes steps to translate these noisy measurements into nonnegative integers that satisfy all of the invariants and constraints (and finally, equivalently, into microdata format again) in what has come to be known as “post-processing.”
In practice, the Census Bureau chose a more complex path in constructing the TDA than those broad outlines suggest, hoping to achieve some other beneficial features as described below. As alluded to in later workshop presentations and background materials, two major concepts are central to the way the TDA functions: a nested hierarchy of geographic entities (more succinctly labeled throughout the workshop as the “geographic spine”) and a set of tables (or equivalent histograms) labeled “queries” that are the actual “noisy measurements” calculated for the various geographic levels. In his joint presentation, David Van Riper (Minnesota Population Center) gave an overview of the geographic hierarchy used by the Census Bureau, which is rendered more clearly in Figure 2.1 and highlights the central “on-spine” levels in a dashed box. One of these layers, the tract group, was created as computational convenience, to mitigate the high variability in the extent to which counties are geographic “parents” of census tracts. With that geographic “spine” as a reference, Table 2.1 draws from the background material prepared for the workshop to describe the way in which fractional allocations of ϵ were
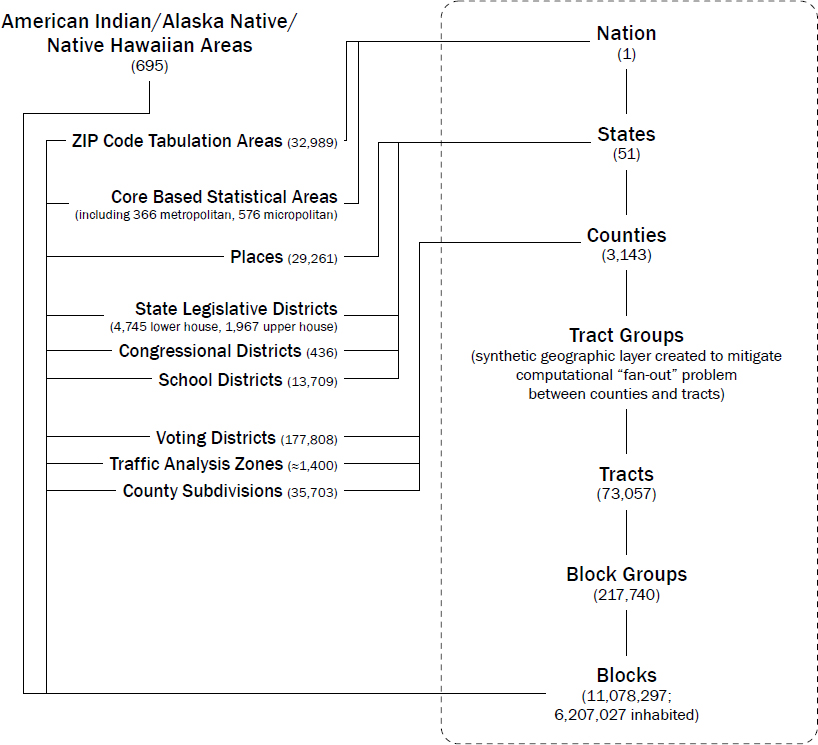
NOTES: Entities in the dashed rectangle are the “spine” or “on-spine” geographic levels, in the parlance that developed around the Census TopDown Algorithm; those not in the rectangle are “off-spine.” Counts associated with geographic levels are tallies from the 2010 Census (see https://www.census.gov/geographies/reference-files/time-series/geo/tallies.html) with number of inhabited census blocks from Philip Leclerc presentation (Section 2.1). Adapted from original to include DDP-specific tract group layer and to exclude some less relevant levels such as census region or division.
SOURCES: Adapted from “Standard Hierarchy of Census Geographic Entities” published by U.S. Census Bureau at https://www2.census.gov/geo/pdfs/reference/geodiagram.pdf?# and included in several workshop presentations, including those of David Van Riper and Seth Spielman (Section 3.1) and Matthew Spence (Section 11.1).
Table 2.1 Allocation of Privacy-Loss Budget in Constructing 2010 Demonstration Data Products
(a) Proportion of Privacy-Loss Budget Allocated to Geographic Levels
| Geographic Level | Proportion of ϵ Allocated |
|---|---|
| Nation | 0.2 |
| State | 0.2 |
| County | 0.12 |
| Tract Group | 0.12 |
| Tract | 0.12 |
| Block Group | 0.12 |
| Block | 0.12 |
(b) Proportion of Per-Geographic-Level Privacy-Loss Budget Assigned to Person-Based Tabulations
| Query | Proportion of ϵ Allocated |
|---|---|
| Age × Sex (116 × 2 cells) | 0.05 |
| Age, Four-Year Buckets × Sex (29 × 2 cells) | 0.05 |
| Age, 16-Year Buckets × Sex (8 × 2 cells) | 0.05 |
| Age, 64-Year Buckets × Sex (2 × 2 cells) | 0.05 |
| HHGQa (8 cells) | 0.2 |
| Age, Voting Age Split × Hispanic × Cenraceb × Citizenc (2 × 2 × 63 × 2 cells) | 0.5 |
| Detailed Tabulations (fully saturated contingency table) | 0.1 |
allocated to specific noisy-measurement queries and geographic level, separately for persons and housing units. The proportional allocations speak to different priorities or settings of the accuracy-privacy trade-off. The nation and state levels (0.2) were weighted slightly more toward accuracy than the finer levels of geography (0.12), while the person-level query roughly corresponding with the basic tables needed for redistricting (with its 0.5 share) is allotted half of the overall privacy-loss budget while the different age-sex splits (at 0.05) are shifted more strongly toward privacy (varying on specific characteristics). The query tables are calculated from the CEF and noise is injected, using a random draw from a distribution with parameter based on the applicable share of ϵ —for example, for the tract level and the query roughly corresponding to redistricting data, based on 0.12 × 0.5 × 4, as ϵ was set to 4 for the person-level tabulations in the 2010 Census DDP. (ϵ was set to 2 for the housing unit tabulations in the 2010 DDP, bringing the overall privacy-loss budget to 6.)
The TDA derives its name from the way it combines these concepts, essentially building the privacy-protected histogram stagewise by geography from top (nation) down to bottom (block). A best-fitting solution is found
Table 2.1 (continued)
(c) Proportion of Per-Geographic-Level Privacy-Loss Budget Assigned to Housing-Based Tabulations
| Query | Proportion of ϵ Allocated |
|---|---|
| Hispd × Raced × Size × HHType (2 × 7 × 8 × 24 cells) | 0.25 |
| HHSexd × Hisp × Race × HHType (2 × 2 × 7 × 24 cells) | 0.25 |
| Hisp × Race × Multi (2 × 7 × 2 cells) | 0.1 |
| HHSex × HHType × Elderly (2 × 24 × 8 cells) | 0.1 |
| HHSex × HHAged × HHType (2 × 9 × 24 cells) | 0.1 |
| Detailed Tabulations (fully saturated contingency table) | 0.2 |
a HHGQ is a derived variable indicating whether a person resides in a housing unit (non-group quarters or non-GQ) or in one of seven top-level group quarters types (correctional facilities for adults; juvenile facilities; nursing/skilled nursing facilities; other institutional; college/university student housing; military quarters; other noninstitutional).
b Cenrace is comprised of the 63 multiple-selection combinations possible from the six top-level U.S. Office of Management and Budget race categories (white, black, American Indian, Asian, Native Hawaiian and Pacific Islander, and some other race).
c Citizen, whether or not the person is a U.S. citizen, is included in this tabulation because the TopDown algorithm was developed anticipating that the citizenship question would be included in the 2020 Census questionnaire (it was not). For the 2010 Demonstration Data Products, the Census Bureau indicates that “the variable was imputed using a crude model for testing purposes” and that the variable will be removed for final 2020 Census production systems.
d In the housing unit–level tabulations, the variables Hisp, Race, HHSex, and HHAge refer to the Hispanic origin, race, sex, and age of the person coded as the “householder,” the reference person in the particular housing unit.
SOURCE: Adapted from the fact sheet produced by the U.S. Census Bureau in support of the workshop, the key text of which was also included in the technical documentation associated with the 2010 Demonstration Data Products; ϵ allocation by levels and tables was referenced in workshop presentation by Philip Leclerc.
to the set of noisy-measurement queries for the nation and the associated constraints, producing an initial histogram without any identifiers. This optimization process is repeated for each state, and the new subhistograms now bear a state identifier. The process repeats for each county within each state, yielding new subhistograms with a state and county identifier, and so forth, recursively, down to the block level.
2.1.3 Why Differential Privacy and Why the TopDown Algorithm in Specific?
Leclerc reiterated that differential privacy is but one option for pursuing disclosure limitation and that within the differential privacy approach, numerous algorithms and techniques exist that might be used to achieve the objectives. In making the argument for why the Census Bureau pursued this particular TDA, Leclerc began by emphasizing two requirements or properties of differential privacy in general that make the approach appealing:
- With its basis in differential privacy, the TDA has the desirable theoretical property of ϵ -consistency. Alluding to the formal definition of ϵ in the differential privacy literature, Leclerc said that this parameter is a bound on the amount of sensitive or private information that can possibly be “leaked” about any individual. The property of ϵ -consistency, then, means that it functions in the manner described above, as a slider striking a balance between accuracy and privacy. The “true” underlying data set should be replicated exactly (error → 0) as the privacy-loss budget is made larger and larger (ϵ → ∞). Leclerc said that this is important in the 2020 Census context for providing maximum flexibility to the Census Bureau’s Data Stewardship Executive Policy (DSEP) Committee in tuning the privacy-accuracy balance.
- Transparency was another desirable property that the Census Bureau sought in developing the approach. Leclerc noted that traditional disclosure limitation techniques lack the generality of mathematical proofs underlying their guarantees, and by their nature, they are a black box about which details cannot be made public or debated publicly. By comparison, differential privacy and the TDA permit the Census Bureau to be “very candid, explicit and straightforward,” in describing its approach and allow it to make the source code and parameters fully public.
Even though the basic histogram schema Geography × Ethnicity × Race × Age × Sex × HHGQ is, at finest grained detail (geography at census blocks), massive—roughly 10 million blocks crossed by 1.25 million combinations of the
other variables2—Leclerc noted that it would certainly be conceptually simpler and easier to understand to “take a noisy picture” of that massive histogram, optimize within those numbers, and essentially build every census measurement from bottom-up (aggregating blocks). The consequence, though, would be “much larger error at higher geographic levels.” He said that the key benefit of the TDA routine is that the error due to disclosure limitation and noise injection does not increase with the number of census blocks contained within a particular area. The geographic hierarchy and corresponding sets of queries are such that different accuracy profiles can be assigned to different geography-variable combinations, rather than injecting similarly scaled doses of statistical noise into national and census-block cell counts alike. The national level and census block level should have different accuracy and error profiles, he argued, because privacy concerns are greater in the smaller geographic levels.
Another crucial benefit of the TDA, Leclerc noted, is the algorithm’s inherent ability to allow the lower, sparser-celled geographic levels in the overall histogram to “borrow strength” from the upper levels, imposing some consistency with values at those upper levels as detail is built up at the lower levels. However, a recurrent theme through the workshop—and the point made by Van Riper in introducing the “spine” in his remarks—is that this benefit accrues to those geographies on the geographic spine. Results for off-spine geographies like school districts would generally need to be built up from component census blocks and so could suffer from compounding “error” (adding up many block-level deviations from truth) rather than borrowing strength from higher levels.
2.1.4 Choosing a Privacy-Loss Budget ϵ
With that background in place, Leclerc pivoted to the challenge of setting a privacy-loss budget ϵ, the balance of his remarks and those of Census Bureau colleague Matthew Spence replicating the information presented to the Census Bureau’s DSEP Committee in September 2019 to make that decision for the 2010 DDP. Both Leclerc and Spence would make the point that this challenge may seem straightforward initially, but it is actually a very difficult policy decision that requires the Census Bureau to balance its legal commitments to preserve privacy and its long-standing mission to provide the highest quality data, and it virtually guarantees that no one is particularly “happy when they walk out of the room at the end of the conversation” about setting ϵ.
___________________
2 HHGQ, here, is a variable that indicates whether a person resides in one of several major types of group quarter facilities or, if not, how the person is related to the householder or census reference person. In Leclerc’s calculation, HHGQ can take on 43 values. The other variables take on the number of categories listed above in discussing the simulated database reconstruction attack. A simplified version of the variable was used in constructing the 2010 DDP, as described in Table 2.1.
Leclerc said that the arguments presented to DSEP had two basic thrusts, the first being “mathematical guarantees:” the aspects of ϵ as a balance between privacy and accuracy that can be expressed in mathematical proofs and that are thus “future-proof” to additional disclosure by any future attacker with any auxiliary data, arbitrary computing power, and future database reconstruction algorithms. He said that arguments related to mathematical guarantees tend to be exercises in bounding—succinctly, in stating “what is the worst that could happen?” There are several, complementary interpretations that can be given to ϵ and the privacy guarantees made by a differential privacy-based algorithm like the TDA. Leclerc emphasized the interpretation of differential privacy (formal privacy) making privacy promises based on relative privacy risk relative to a counterfactual world in which any individual person’s data record was omitted or incorrect. (This is in contrast to traditional disclosure avoidance avenues that speak to absolute privacy risk but must assume a particular, well-defined mode of attack that is being guarded against.) These discussions are challenging because one does not want to bound legitimate scientific inference using the resulting, privatized data, but only inference that erodes privacy. The second major thrust in the arguments presented about choosing ϵ involve what Leclerc called “optimistic empirical analyses,” in essence repeating the simulated database reconstruction attack that motivated the Census Bureau to adopt differential privacy in the first place, using TDA output at various levels of ϵ to get a sense of practical change in privacy protection.
Leclerc’s discussion of accuracy metrics for the DSEP Committee, as well as Spence’s presentation in the next section, focused on TDA runs carried out on the state of Virginia, which Leclerc said was chosen as a test case as “a compromise between runtime and complexity and scale.” The primary metric Leclerc focused on is 1−TVD, or “one minus average Total Variation Distance.” This is defined as

calculating the absolute difference between histogram entries in the original census data (CEF) and the synthetic TDA output data (MDF) for all record types j and geographic units g in a level, normalizing that sum by dividing by twice the national population, and subtracting the result from 1. Leclerc explained that the resulting statistic—scaled to be between 0 and 1—can be thought of as the proportion of MDF histogram entries that were exactly as enumerated. So, 1 − TVD = 0.7 would suggest that roughly 70 percent of the entries in a particular table or histogram “were right” relative to the original values. Two caveats to the use of 1 − TVD as a metric are that it tends to emphasize more populous geographic units (larger cell entries) and, more fundamentally, that “1 − TVD doesn’t really make any sense when age is in the histogram.” This is because discrepancies between different levels of the
age variable are weighted equally in this strict variation-distance measure, even though one could reasonably interpret confusing a 100-year-old person and a 99-year-old person as a less consequential error than confusing a 100-year-old with a 1-year-old. Consequently, Leclerc said, they presented DSEP with an “L1 error over quantiles” measure or, put simply, a “measure of the difference in shape between two age distributions.” Leclerc said that they used this second measure exclusively on Sex × Age histograms, and that it can be interpreted using statements such as “on average, the median age in a tract for males was off by X years.”
In his workshop presentation, Leclerc displayed only one graph from the metrics analysis—1 − TVD for total population, for major on-spine geographic levels (state, county, tract, block group, and block) in Virginia for values of ϵ between 0 and 16—and instead focused on the major findings and features that the analysis suggested. The metrics work suggested patterns “we see over and over again:” that accuracy tends to be higher (and “generally quite good” all in all) for the coarser geographic levels, but markedly less so for census blocks themselves. Leclerc also said that 1 − TVD performs better for tabulations that combine fewer counts per geographic unit. The plot of total population, for instance, involves just a single count or statistic per geounit; “if you look at, say, the Sex × Age histogram or a breakdown of the 63 possible combinations of CENRACE values, those will give you graphs that are not quite as rosy looking as this one.”
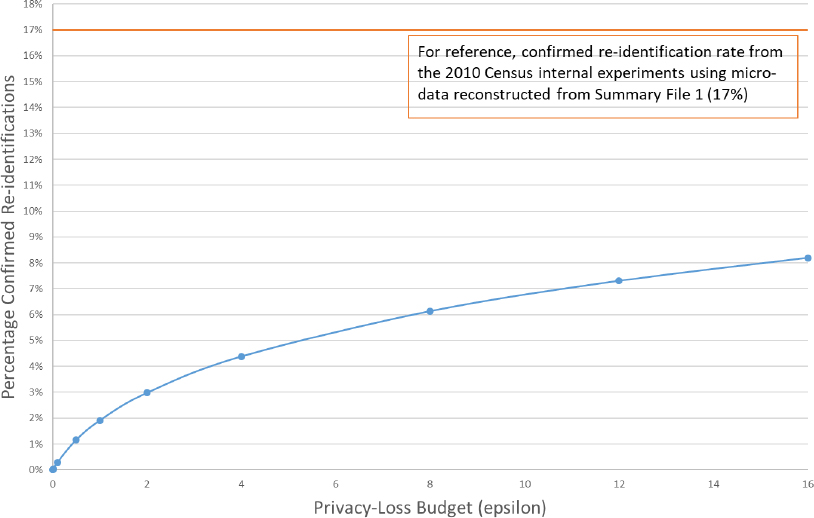
Leclerc closed his presentation by switching to the second main line of arguments to DSEP and returning to the original “problem” that motivated the switch to differential privacy-based methods in the first place. He noted that the mathematical proofs associated with formal privacy directly address he changing landscape (of data, computation, and algorithms) faced by the Census Bureau in its disclosure efforts, but it was still deemed crucial to assess how well the TDA performs at addressing the simulated database reconstruction attack. Leclerc said that the Census Bureau carried out new experiments and simulated attacks, the only difference this time being that the TDA-generated microdata were used as the input rather than the published 2010 Census tables. This analysis was repeated for a variety of ϵ levels, and the results are displayed in Figure 2.2. As expected, the figure shows that very small values of ϵ force the confirmed reidentification rate to 0 (perfect privacy, minimal accuracy). Leclerc noted that at ϵ = 16—a value that would be considered extremely large in the formal privacy literature in computer science—the TDA processing reduces the confirmed reidentification rate by more than half, from 17 percent in the original simulated attack to 8.2 percent in the new experimental runs. In this configuration of the DAS and TDA, as discussed later in the workshop, the confirmed reidentification rate appears to tend asymptotically toward 9 percent or so as ϵ increases.
SOURCE: Philip Leclerc workshop presentation.
2.2 SETTING THE PRIVACY-LOSS BUDGET FOR THE 2010 DEMONSTRATION DATA PRODUCTS
Matthew Spence (U.S. Census Bureau) emphasized that, even to the point of omitting a title slide, the series of graphs in his workshop presentation are exactly those prepared for and presented to the DSEP Committee. Spence explained that the Census Bureau’s Population Division was given MDFs for the state of Virginia prepared using nine different values of ϵ: 0.01, 0.1, 0.25, 0.5, 1, 2, 4, 8, and 16. He said he was asked to produce graphics that display the data accuracy in these MDF runs in a way that would be understood by demographers. His presentation consisted of displaying and commenting on several sets of nine separate ϵ -level graphs. For brevity, we reproduce only a subsample of these figures to illustrate the main points.
First, Spence looked at county-level population totals, comparing the privatized MDF totals to those from the raw 2010 Census data—“the unswapped 2010 Summary File,” he said, allowing for the most direct comparison of the effects of the TDA on the estimates. The first set of graphs looked at raw difference between the population totals. The second set, excerpted in Figure 2.3, expresses the percentage difference in population for Virginia
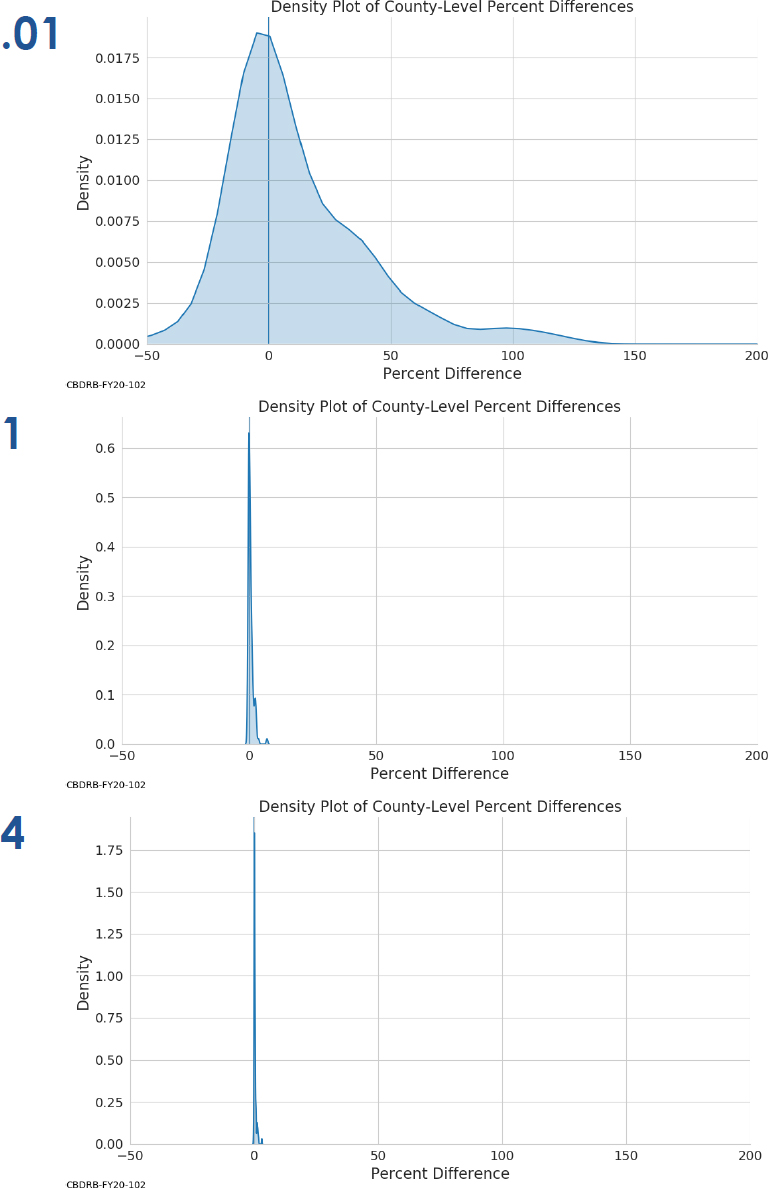
NOTES: Value of ϵ indicated in large print at top left of graph. Presentation also included ϵ values of 0.1, 0.25, 0.5, 2, 8, and 16.
SOURCE: Matthew Spence workshop presentation.
counties between the TDA estimates and the raw 2010 Census totals. In both cases, a kernel density estimate is plotted. At the lowest levels of ϵ, there is a sharp spike at 0, but there is also extremely large variation in both absolute and percentage difference. At ϵ = 0.01, counties in Virginia experience population swings from −6,000 to 4,000, ranging in percentage terms from a reduction of 50 percent of the total county population to gains of 200 percent. Increasing ϵ tightens those distributions considerably, by ϵ = 0.1 to a sharper concentration of county population swings of ±2,000 and by ϵ = 1 to percentage of population swings within ±10 percent.
Interesting patterns begin to emerge when assessing systematic variation by size of the county, so the next series of plots were boxplots grouping Virginia’s counties into seven roughly equally-numbered buckets: from very small counties (0–7,500) to the largest (100,000 or greater, including Fairfax County, the state’s most populous at roughly 1,000,000). Figure 2.4 replicates some of the boxplots for absolute difference in population between the ϵ - keyed MDFs and the raw 2010 Census data, while Spence also presented boxplots showing the percentage of difference in population for the counties, in both cases grouping data by these total-population size categories. Figure 2.4 illustrates the tendency shown in the previous figure for population values to cluster closer to 0 as ϵ increases, but Spence noted a theme made clear by the boxplots that would recur throughout the workshop: the most populous areas (here, counties) tend to lose people in the MDF runs (for ϵ = 1, on the order of 500 people) while the least populous counties gain slightly in population (again for ϵ = 1, on the order of 100). In the end, this result makes intuitive sense: the TDA post-processing necessarily introduces some positive bias because of the requirement that the privatized data be nonnegative. Spence also discussed the other remarkable feature of the plots in Figure 2.4, which is that they vividly illustrate the effect of varying ϵ: the y-axis, and the degree to which the DAS changes county-level populations, changes dramatically across the graphs.
Demographers are keenly interested in the distribution of age by sex, and age pyramids are a common method for effectively conveying those distributions. Spence indicated that the Census Bureau researchers wanted to look at different effects for a range of county conditions, repeating the analysis for the state’s most populous county (Fairfax County, roughly 1,000,000 people), the median-populated county (Winchester City,3 roughly 27,000), and the least populated county (Highland County, about 2,300). In all three instances, these individual age-year pyramids divided by sex for the smallest values of ϵ are so variable and jagged as to be unrecognizable. The plot for Winchester City at ϵ = 0.01 drew a laugh from the audience after Spence (accurately) characterized the pyramid as showing that “basically everyone is 46 and female.” The matching to true census
___________________
3 Virginia’s 38 independent cities are county-level equivalents and so are “on-spine” (per Figure 2.1), as distinct from places (other cities and towns) that are generally off-spine.
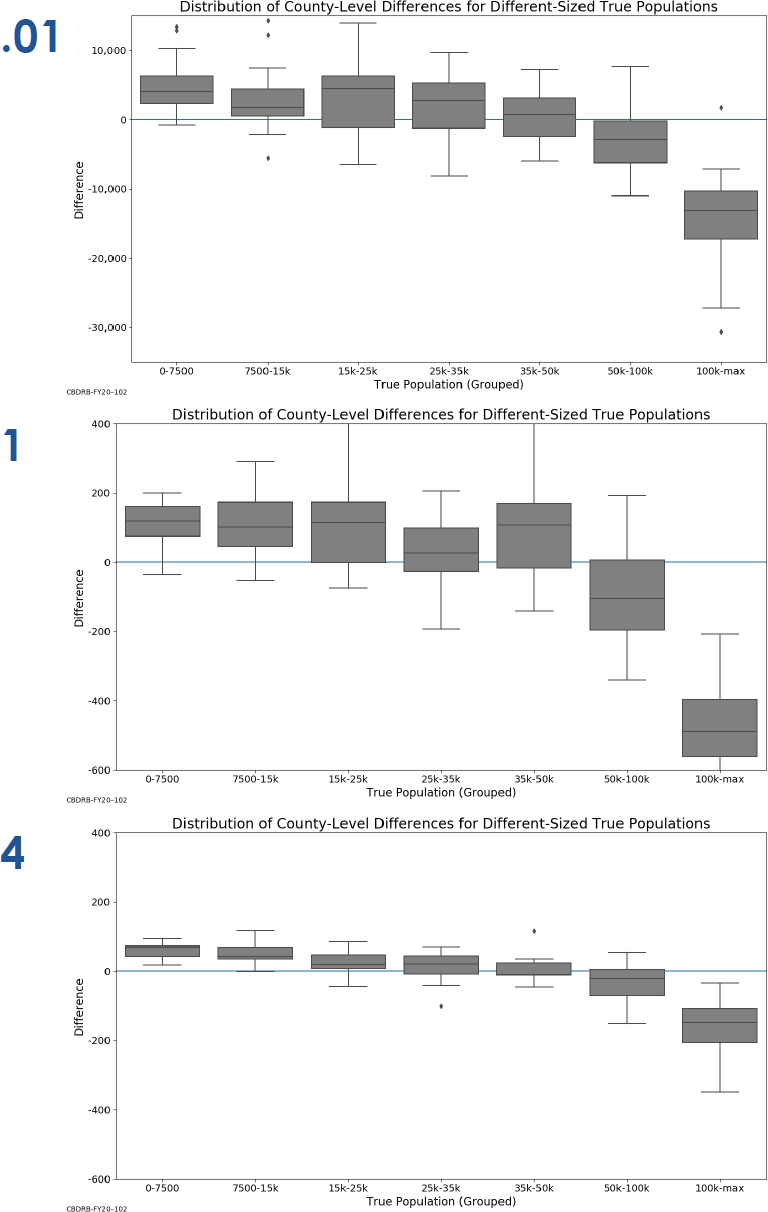
NOTES: Value of ϵ indicated in large print at top left of graph. Presentation also included ϵ values of 0.1, 0.25, 0.5, 2, 8, and 16.
SOURCE: Matthew Spence workshop presentation.
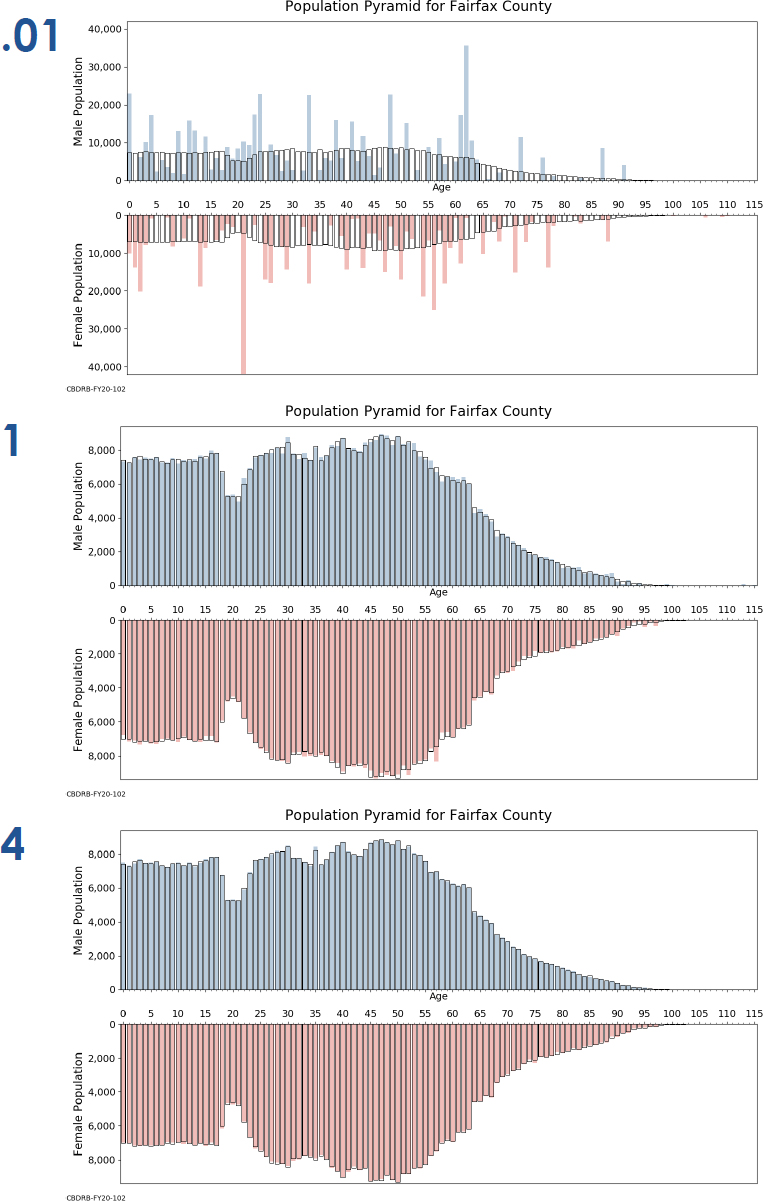
NOTES: DAS-generated Microdata Detail File values indicated by shaded bars. True 2010 Census values denoted by unshaded boxes. Value of ϵ indicated in large print at top left of graph. Presentation also included ϵ values of 0.1, 0.25, 0.5, 2, 8, and 16.
SOURCE: Matthew Spence workshop presentation.
characteristics becomes better with higher values of ϵ —dramatically so even by ϵ = 1 for the heavily populated Fairfax County, with significant differences still evident for individual years of age at ϵ = 16 in Winchester City.
Spence acknowledged Leclerc’s earlier comments, about crafting a different metric when age is involved, by noting that in regard to these age pyramids, “it doesn’t just matter that you missed, it also matters how much you missed by.” He noted that he would have liked to find more ways to more fully reflect those nuanced differences in the graphs, perhaps by collapsing the single years of age into five-year buckets.
Spence capped his presentation with a very quick glimpse at a series of scatterplots that considered differences in county-level composition (between the ϵ -keyed MDFs and the true 2010 Census data) by recoded race categories, calculating “race alone” categories when only one of the six main race categories was selected and adding a “two or more races” category to include all other multirace responses. Consistent with the previous plots in Spence’s series, the lowest values of ϵ show some major discrepancies, such as a county with 0 percent of its true 2010 Census population identifying as one of these major race groups but registering as 40 percent in the MDF. As in the preceding graphs, Spence noted that the scattering of points above the 45-degree line for small percentages in the 2010 Census data and below the line for large percentages in 2010 is consistent with the previous finding that more populous race groups for particular counties tend to lose population in TDA processing and less populous groups tend to gain.
2.3 FLOOR DISCUSSION
In the discussion session, William O’Hare (demographic consultant) took note of the range of values for ϵ in Spence’s presentation and asked whether those were the values (or the full range of values) under consideration for use in the 2020 Census. Spence replied that his presentation to DSEP in September 2019 was intended to portray an illustrative range of values and to start illuminating how different ϵ values work in practice. He said that he couldn’t speak to what range of ϵ would be under consideration, just that this would start the discussion. (Later in the session, other participants would ask a variant on the same question, yielding much the same answer.)
Session moderator Joe Hotz (Duke University) said that the workshop planning committee had asked all the presenters to give some sense of the privacy–accuracy trade-offs that need to be made in implementing a new disclosure avoidance routine. Having just gone through the exercise of looking at implications by demographic groups, he asked the Census Bureau presenters to think about things from the perspective of a non-Bureau demographer, to consider how they would respond to making (or improving upon) these kinds
of trade-offs. Spence, noting that he is a demographer, said that he was acutely aware of the tension. He said both that “I absolutely value data accuracy” and “we are sworn to uphold confidentiality” and privacy protection. As chief of the Foreign-Born Population Branch, Spence added that he is involved in the tabulation of citizenship data using the question on the American Community Survey (ACS) and the Current Population Survey (CPS) and is very conscious of the need to ensure that those tables don’t inadvertently disclose information that could lead to identification. He said that his sense in going through the numbers for Virginia was that it was a major improvement in accuracy in moving from ϵ = 0.01 to ϵ = 0.1 and again when ϵ was raised to values of 1 or higher. That said, work with the nationwide results in the DDP was suggesting that Virginia is “a little more of a homogeneous state” in some respects than he might have anticipated up front. Looking into results for a state the least populous county of which has 2,300 people is one thing, but considering counties (and characteristics within counties) that may only have 100 is considerably different. He said that as the workshop presentations probed more and more into small geographies and more detailed demographic characteristics, it would become clearer that a high level of ϵ matters greatly for accuracy. Leclerc replied by first observing that every opportunity to better target those tabulations that are most used and necessary in practice is valuable, meaning that workshop participant suggestions of tabulations, either in terms of their geographic level of detail or just their frequency of use in the field, that might be “bucketed” or aggregated differently would be helpful. Secondly, he cautioned about becoming too attuned to the apparent performance of specific ϵ values for these limited tabulations from one state and one variant of the DAS methodology. The problem of becoming too fixated on privacy-accuracy trade-offs in this specific implementation is that the Census Bureau continues to improve on the TDA’s operations, which means that the system’s performance at different levels will also change somewhat over time. Later in the discussion session, Leclerc reiterated that stakeholders shouldn’t become overly fixated about ϵ values in an interval (0.01, 16), and that what the Census Bureau most needs to hear is feedback about what use cases the Demonstration Data Products do a satisfactory job with and which ones need more work, as well as what level of quantitatively expressed accuracy is absolutely essential for particular use cases.
David Van Riper (Minnesota Population Center) asked Leclerc for his thoughts about the confirmed reidentification rates when reprising the simulated database reconstruction attack (Figure 2.2), suggesting a reidentification risk of roughly 6 percent for the overall ϵ = 6 used in the DDP (4 for the person data, 2 for the housing unit data). Van Riper said that he recalled some previous presentations where a similar reidentification rate based on ACS data was 0.1 percent. The three-fold change from 17 to 6 in the 2010 DDP is substantial but a far cry from rates on the order of 0.1 percent. Leclerc replied that the Census
Bureau has some important questions to follow up on in this regard, and he returned to a notion that he had mentioned before about trying to separate legitimate scientific inferences from privacy-eroding inference. He said that this is a question that he could not fully address now but acknowledged that there is always an implicit comparison being assumed with some baseline rate, and there needs to be care in crafting that kind of argument in the reidentification work.
Nancy Krieger (Harvard T.H. Chan School of Public Health) foreshadowed her presentation on the workshop’s second day (Section 7.1) by acknowledging the need to optimize in terms of accuracy and privacy, but she suggested that the concept of equity also needs to be optimized as well. On a whole range of outcomes, including but certainly not limited to health, census data are of interest in comparing “who’s doing better” among different groups in the country relative to “who’s doing worse.” Hence, the impacts of disclosure avoidance on being able to understand the magnitude of inequities within the general population also deserves consideration. Leclerc said that this was a very useful insight and that the Census Bureau would appreciate feedback on measuring equity and the effect on dimensions of equity in a more rigorous manner.
Clifford Cook (City of Cambridge, Massachusetts) began by noting that his workshop presentation (Section 5.1) would also touch on equity themes, and he also commended Krieger’s point. Cook extended the theme by asking Spence and Leclerc about the take-away impression from Spence’s graphs that large counties (and areas in general) tend to be penalized and less populous areas tend to be rewarded—not using those words in a pejorative or positive sense, he hastened to add, just making an obvious observation from the figures about population lost or gained. He asked whether there were ways for the TDA routine to “re-balance that curve, as it were,” and not exacerbate that effect. Leclerc pointed out that William Sexton’s remarks on the workshop’s second day (Chapter 11) would provide more detail, but also acknowledged that this behavior isn’t attributable to differential privacy itself but to the constraints on post-processing. The constraints that histogram values be non-negative integers and the imposition of invariants necessarily “imply some magnitude of what we have seen here, which is a positive bias in small counts and a negative bias in large counts.” There is not likely to be a way to completely eliminate those biases, but the Census Bureau’s second-day presentation (Chapter 11) commented on ways to try to mitigate it. Spence agreed that these biases exist by nature of the post-processing but added that stakeholders should bear in mind that the changes generally tend to be small percentages and may not be as concerning as extrapolation from the experiences of these Virginia localities might suggest. Cook replied that the “arithmetic limitations” behind the negative and positive biases are clear but added that his look at the DDP
suggests that “the issue does get much worse as you go down the geographic scale, and it has serious policy implications.”
Eddie Hunsinger (California Department of Finance) asked about the age structures in some of the graphs that had been presented quickly, saying that they appeared to show some patterning that doesn’t look like random noise, even between age groups at five-year age categories. Leclerc said that this was an interesting observation and that one avenue for internal research at the Census Bureau is using available information from prior censuses and surveys to improve the methodology. This could come to bear in trying to fine-tune the handling of age distributions (for instance, basing predictions on age structures in 2025 based on age structures in 2020). Spence added that he would be returning to the question of implications for population estimates and projections in the Census Bureau’s second-day presentation block (Chapter 11).
Abraham Flaxman (University of Washington) raised a question that would be expressed in later workshop presentations: Since it would seem to be the most direct way to “get those total counts right,” why not make total population invariant at the census block level (and not just at the state)? Spence replied first, saying that the Census Bureau’s researchers have noticed that adding invariants “essentially eats the privacy-loss budget,” which in turn produces “extremely noisy and virtually useless” results elsewhere. He illustrated the point by saying that, based on analyses done since the release of the DDP, workshop presentations were inevitably going to mention the unusual results those products show for housing unit vacancy rates. Fixing the housing unit counts by block, while having to accommodate changes in total population counts, requires either effectively placing people in known-vacant units (unnaturally driving down the vacancy rate) or placing them in known-occupied units (unnaturally driving up the average household population size). Leclerc began by echoing the caution about “offsetting effects,” in particular suggesting that it would not be appropriate to assume that imposing many more invariants and reducing ϵ would strike a reasonable balance. The privacy “guarantee” afforded by differential privacy-based approaches “becomes tremendously more complicated,” he said, when adding additional invariants, and this means that the meaning of the privacy-loss budget ϵ becomes very tricky. For these reasons, he advised against “layering on invariants whenever we get worried about something” and instead steer attention to the possibilities for having a larger privacy-loss budget ϵ and allocating bigger shares of it on the total population counts.
Qian Cai (University of Virginia) began by thanking the Census Bureau researchers for presenting results for Virginia, but added that fuller look at the DDP was suggesting that even the small percentage changes mentioned by Spence have very big practical effects. She noted that the smaller counties in Virginia tend to be rural and have older, less diverse, declining populations. She noted that Spence’s presentation had covered Highland County, the state’s least
populous county. The adjacent Bath County, somewhat larger in population, appears to tell a very different story of a “growing county, younger and more diverse,” seemingly based on those small-percentage differences that still affect the narrative. As another example, Cai mentioned that DDP information for the small city of Emporia suggests that the city’s teen pregnancy rate would shift from 5 percent to 66 percent, which has definite implications. Spence replied that he understood the importance of the point and the role of census data as denominators for other measures.


