


Below is the uncorrected machine-read text of this chapter, intended to provide our own search engines and external engines with highly rich, chapter-representative searchable text of each book. Because it is UNCORRECTED material, please consider the following text as a useful but insufficient proxy for the authoritative book pages.
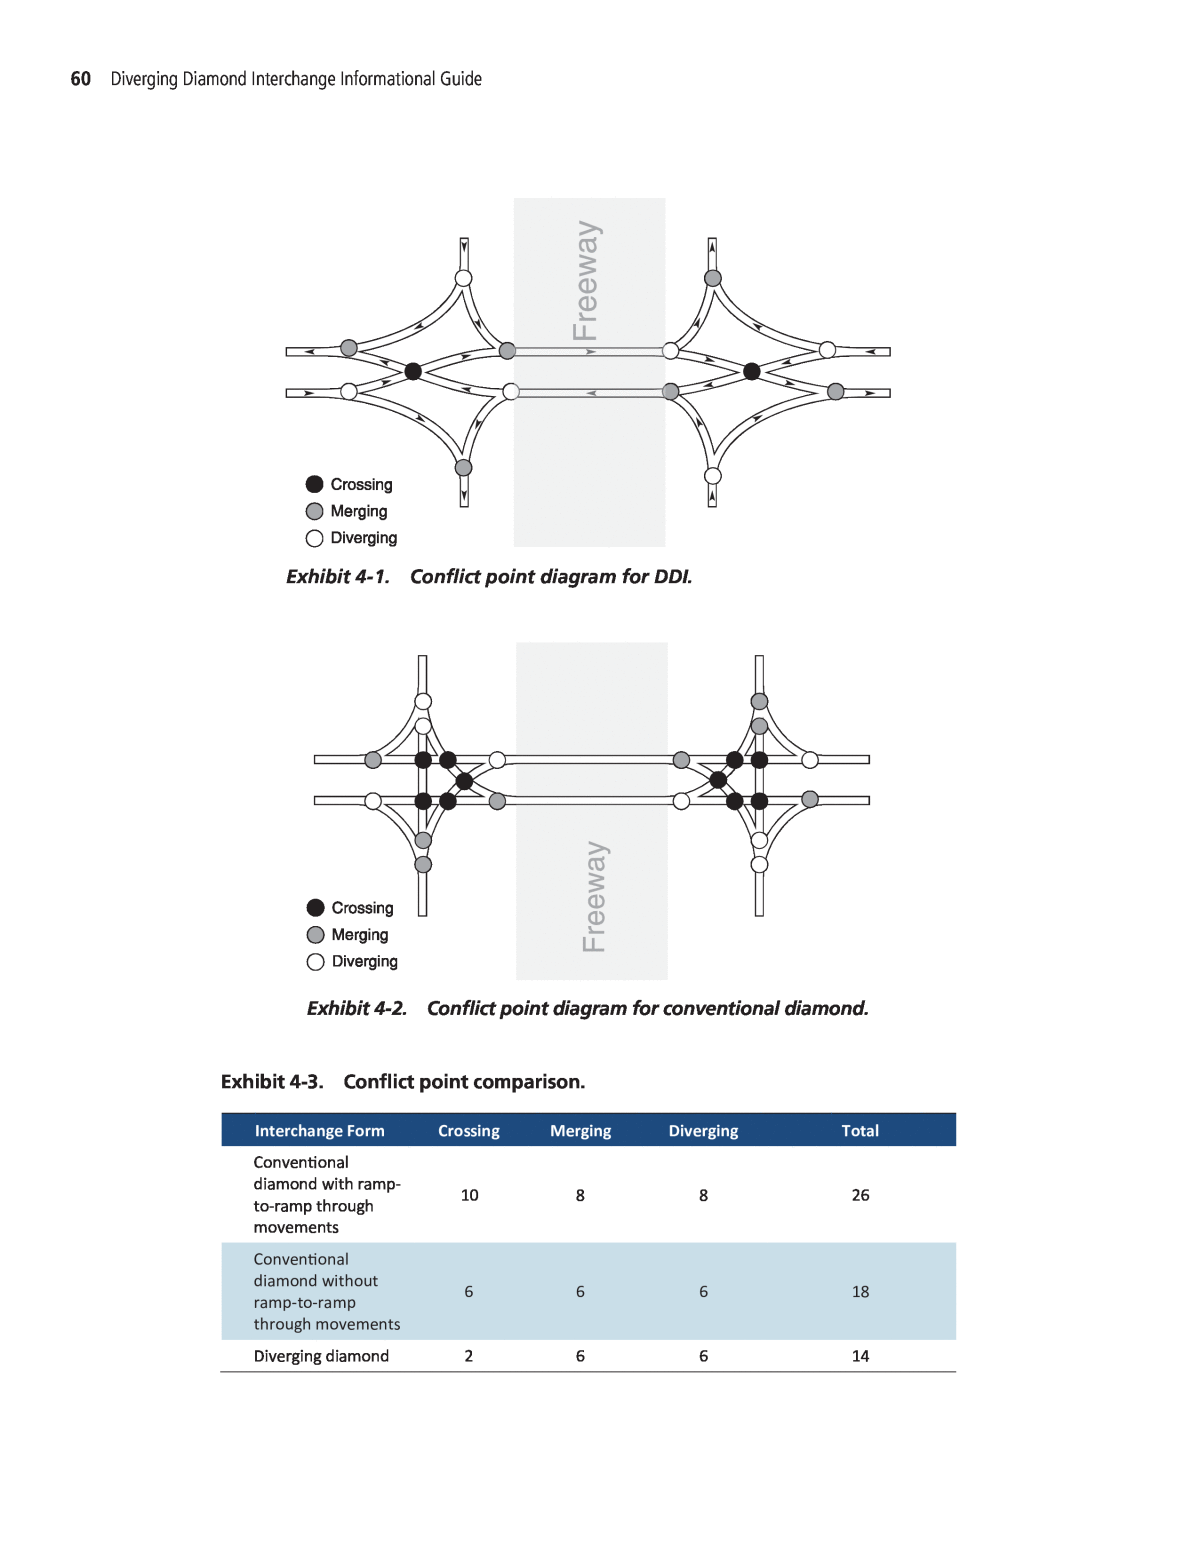
59 Diverging diamond interchanges (DDIs), like many alternative intersection and interchange designs, offer quantifiable safety benefits compared to conventional interchange designs. This chapter provides an overview of safety principles of DDIs, followed by a summary of quanti fiable safety findings. This chapter focuses on the safety aspects for motorized vehicles; refer to Chapter 3 for findings related to pedestrians and bicyclists. 4.1 Safety Principles 4.1.1 Conflict Points The number of motor vehicle conflict points present at an intersection and volume of conflicting traffic present may serve as a surrogate measure of intersection safety. Conflict points are defined by the location where the paths of various traffic modes cross, including motor vehicle, bicycle, or pedestrian movements. VehicleÂtoÂvehicle conflicts are most often described as merging, diverging, or crossing, where crossing conflict points represent the greatest risk for higher severity crashes as they denote the location where severe angle collisions take place. Although traffic control devices can reduce the propensity for crashes by eliminating conflict points or controlling them through signing, signals, or pavement markings, traffic control and intersection geometry cannot completely eliminate the human error factor that contributes to collisions. Exhibits 4Â1 and 4Â2 present vehicleÂtoÂvehicle conflicts for a conventional diamond inter change and a DDI, while Exhibit 4Â3 provides a direct comparison of the conflicts present at both interchanges. Conventional diamond interchanges have 26 conflict points including offÂramp to onÂramp through movements that are typically low volume if frontage roads are not part of the ramp system. If offÂramp to onÂramp through movements are physically limited, conventional diamond interchanges have 18 conflict points. By contrast, DDIs have 14 conflict points. The reduction in conflict points is due to the unique crossover movements, which remove offÂramp to onÂramp through movements and eliminate several leftÂturning conflicts between the ramps and cross street. The biggest distinction is the significant decrease in crossing conflicts that typically lead to dangerous angle crashes. 4.1.2 Right Turn at Exit Ramp Traffic between the two crossovers travels on the left side of the road, which is counter to the expectation of rightÂturning drivers from the freeway exit ramp. RightÂturnÂonÂred (RTOR) oper ation is often desired at this movement for capacity reasons, similar to that used at conventional C H A P T E R 4 Safety
60 Diverging Diamond Interchange Informational Guide Exhibit 4-1. Conflict point diagram for DDI. Exhibit 4-2. Conflict point diagram for conventional diamond. Interchange Form Crossing Merging Diverging Total Conventional diamond with ramp- to-ramp through movements 10 8 8 26 Conventional diamond without ramp-to-ramp through movements 6 6 6 18 Diverging diamond 2 6 6 14 Exhibit 4-3. Conflict point comparison.
Safety 61 diamond interchanges. However, if RTOR operations are allowed, rightÂturning drivers may look on the wrong side of the road when checking for conflicting vehicles because traffic is crossed over. Intersection sight distance may also be limited by barriers or other obstacles between the crossovers. Exhibit 4Â4 shows the oncoming traffic for the right turn at the exit ramp. 4.1.3 Left Turn at Exit Ramp In states where leftÂturnÂonÂred (LTOR) operation is allowed from a oneÂway street to another oneÂway street, the unique design of the DDI allows for LTOR operations. Exhibit 4Â5 shows the oncoming traffic for the left turn at the exit ramp. Exhibit 4-4. Oncoming traffic for the right turn at the exit ramp. Exhibit 4-5. Oncoming traffic for the left turn at the exit ramp.
62 Diverging Diamond Interchange Informational Guide 4.1.4 Wrong-way Maneuvers At most interchanges, including conventional diamonds, wrongÂway maneuver concerns are primarily related to drivers entering the freeway in the wrong direction. There is nothing inherent about the design of the DDI that would increase the likelihood of this, and the channelization of movements may decrease the likelihood of wrongÂway maneuvers at freeway exit ramps. However, the crossovers on the cross street create the potential for wrongÂway movements on the cross street. While early DDI research (1) identified a link between flat crossover angles and wrongÂway maneuvers on the cross street, subsequent DDI experience has indicated other design features discussed in Chapter 6 likely play a greater role in determining the potential for wrongÂway movements. 4.1.5 Incident Response Considerations The response times of emergency responders at DDIs have been raised as a concern. Some of these concerns are summarized below: ⢠The barrier between travel directions and crossovers prevents passenger vehicles or emergency responders from driving on the wrong side of the road to pass or respond to broken down vehicles. This is similar to a conventional interchange with a divided arterial. In most cases, decreased delay and queuing at a DDI compared to a conventional diamond interchange miti gates the need for travel on the wrong side of the road. LongÂterm video monitoring efforts at seven DDIs for a 6Âmonth period found no unusual problems in clearing crashes (1). ⢠In most cases, decreased delay and queuing at a DDI compared to a conventional diamond interchange is beneficial to emergency vehicles. The right turn on the freeway exit ramp often does not allow RTOR, causing queues to be longer than at a conventional diamond. This may impede emergency vehicles making right turns off the freeway. ⢠RampÂtoÂramp movements are sometimes made by emergency vehicles when congestion on the freeway does not allow passage of an emergency vehicle. The unique crossover design of a DDI does not allow through movements at the ramps, and strategies for mitigating this issue are limited. 4.2 Observed Safety Performance The primary measure of safety performance is longÂterm annual average crash frequency. Crash modification factors (CMFs) based on significant samples of data from treatment and reference sites that remove bias found in most safety studies, especially regressionÂtoÂtheÂmean, have been developed in several studies and expanded within this guide. This section provides a summary of safety effects from early DDI implementations and surrogate measures collected at several DDIs in an FHWA study (1). Other safety considerations, including wrongÂway maneuvers, are discussed and data is provided where possible. 4.2.1 Literature Summary Exhibit 4Â6 shows a compilation of the study summary and results of the recent DDI safety studies, which are described further in Appendix A. In summary, DDIs offer crash reduction benefits over conventional diamond interchanges. Information in the HSM indicates that road safety is affected by a change in number of lanes, lane width, shoulder width, median width, intersection skew angle, speed, traffic control type (e.g., stop, signal), and horizontal curvature. Each new interchange conversion presents unique combinations of change in most of these elements and features. The calculation of a CMF that summarizes the overall change
Safety 63 Year of Report Author(s) Study Site Locations (# sites) Study Methodology(ies) Results 2011 V. Chilukuri et al. (2) Springfield, MO (1) Naïve Before-After CMF â 0.54 2015 P. Edara et al. (3) Missouri (6) Empirical Bayes CMFs for entire interchange: KABC â 0.374 PDO â 0.649 All â 0.592 CMFs for ramp terminal intersections: KABC â 0.322 PDO â 0.466 All â 0.434 2016 H. Lloyd (4) Utah (5) Empirical Bayes CMFs for entire interchange: KABC â 0.43 PDO â 0.76 All â 0.64 CMFs for ramp terminal intersections: KABC â 0.32 PDO â 0.64 All â 0.50 2017 B. Claros et al. (5) Missouri Empirical Bayes CMFs of 0.45 for fatal and injury, 0.686 for PDO, and 0.625 for total crashes at ramp terminal intersections. 2018 Kittelson & Associates, Inc., adapting work by Nye (6). GA, ID, KS, KY, MN, MO, NC, NY, UT, VA, WY (26) Empirical Bayes CMF functions for each of three severity categories (i.e., FI, PDO, and all severities combined), presented in Section 4.2.2 KABC = Fatal, Disability Injury, Evident Injury, and Possible Injury Crashes FI = Fatal and Injury PDO = Property Damage Only Crashes Exhibit 4-6. DDI safety studies, CMF values and sources. in safety associated with a specific interchange conversion describes the combined safety effect of the changes in each element and feature at that site. This âoverallâ (or projectÂlevel) CMF can be a reliable descriptor of the change in safety at the converted site. However, it will not be a reliable descriptor of the change in safety associated with a proposed new site unless the changes in elements and features at the converted site are a match to those at the proposed site. If one or more changes at the proposed site do not match those at the converted site, then a different projectÂlevel CMF value will be obtained for the proposed site. 4.2.2 Predicted Crash Modification Factors A crash modification function was used to compute the predicted crash modification factor values for various combinations of the equationâs input variables. The results are shown in two exhibits: Exhibit 4Â7 for interchanges converted from a âbeforeâ condition with two signal ized terminals and Exhibit 4Â8 for interchanges converted from a âbeforeâ condition with two unsignalized terminals. Details of the equation used to derive the crash modification factors can be found in Appendix A.
64 Diverging Diamond Interchange Informational Guide 30 2 0 0.20 0.26 0.25 1 0.30 0.39 0.38 2 0.45 0.59 0.58 1 0 0.25 0.30 0.29 1 0.38 0.46 0.44 2 0.56 0.69 0.67 0 0 0.32 0.35 0.34 1 0.47 0.53 0.51 2 0.70 0.81 0.79 35 2 0 0.28 0.38 0.36 1 0.41 0.58 0.55 2 0.61 0.89 0.84 1 0 0.34 0.45 0.42 1 0.51 0.68 0.64 2 0.76 1.04 0.98 0 0 0.43 0.53 0.49 1 0.64 0.80 0.75 2 0.96 1.21 1.14 40 2 0 0.38 0.57 0.52 1 0.56 0.87 0.79 2 0.83 1.32 1.22 1 0 0.47 0.67 0.61 1 0.70 1.02 0.93 2 1.04 1.55 1.42 0 0 0.59 0.78 0.71 1 0.87 1.19 1.09 2 1.30 1.81 1.66 45 2 0 0.51 0.86 0.75 1 0.76 1.30 1.15 2 1.14 1.97 1.77 1 0 0.64 1.00 0.88 1 0.95 1.52 1.35 2 1.42 2.31 2.07 0 0 0.80 1.17 1.03 1 1.19 1.78 1.58 2 1.77 2.70 2.41 Notes: 1 Number of through lanes at the DDI minus the number of through lanes at the interchange before conversion Total of both travel directions. (i.e., = ). 2 At some DDIs, the outside lane of the crossroad is dropped at the entrance ramp (i.e., the outside crossroad lane becomes a turning roadway at the ramp and continues onto the ramp). The value in the table describes the number of lanes that are dropped at the DDI. Total of both travel directions. Crossroad Speed Limit, mph Change in Crossroad Through Lanes1 Crossroad Lane Drops2 CMF, FI CMF, PDO CMF, Total Exhibit 4-7. Predicted CMF values when interchange has two signalized terminals before conversion.
Safety 65 30 2 0 0.24 0.37 0.35 1 0.36 0.56 0.54 2 0.54 0.85 0.82 1 0 0.30 0.43 0.41 1 0.45 0.66 0.63 2 0.67 0.99 0.96 0 0 0.38 0.50 0.48 1 0.56 0.77 0.73 2 0.84 1.16 1.12 35 2 0 0.33 0.55 0.51 1 0.49 0.84 0.78 2 0.73 1.27 1.19 1 0 0.41 0.64 0.59 1 0.62 0.98 0.91 2 0.92 1.48 1.39 0 0 0.52 0.75 0.69 1 0.77 1.14 1.06 2 1.15 1.73 1.63 40 2 0 0.45 0.82 0.74 1 0.67 1.25 1.13 2 1.00 1.90 1.73 1 0 0.56 0.96 0.86 1 0.84 1.46 1.32 2 1.25 2.21 2.02 0 0 0.70 1.12 1.01 1 1.05 1.70 1.55 2 1.56 2.59 2.37 45 2 0 0.61 1.23 1.07 1 0.92 1.86 1.64 2 1.36 2.83 2.52 1 0 0.77 1.43 1.26 1 1.14 2.18 1.92 2 1.70 3.30 2.94 0 0 0.96 1.68 1.47 1 1.43 2.54 2.25 2 2.13 3.86 3.44 Notes: 1 Number of through lanes at the DDI minus the number of through lanes at the interchange before conversion Total of both travel directions. (i.e., = ). 2 At some DDIs, the outside lane of the crossroad is dropped at the entrance ramp (i.e., the outside crossroad lane becomes a turning roadway at the ramp and continues onto the ramp). The value in the table describes the number of lanes that are dropped at the DDI. Total of both travel directions. Crossroad Speed Limit, mph Change in Crossroad Through Lanes1 Crossroad Lane Drops2 CMF, FI CMF, PDO CMF, Total Exhibit 4-8. Predicted CMF values when interchange has two unsignalized terminals before conversion.
66 Diverging Diamond Interchange Informational Guide The analysis results indicate that the conversion to DDI is often associated with a reduction in crashes; however, crash frequency may be increased for some combinations of higher cross road speed limit, one or more crossroad lanes dropped at the DDI, and the existing interchange having unsignalized terminals. âCrossroad lanes droppedâ refer to lanes on the outside of the crossroad that drop a freeway onÂramp. The dataset include a number of sites where lanes dropped onto entrance ramps at the DDI, but it did not include any sites where lanes dropped onto entrance ramps in the âbeforeâ condition. The use of CMF functions was found to explain more than oneÂhalf of the systematic varia bility in the CMF values. However, it is believed that there is still some unexplained systematic variable in the predicted CMF values. Data for additional sites will help in this investigation by increasing the sample size. Also, some investigation of the annual average daily traffic (AADT) data provided by Nye (6) indicates that there may be some correlation between the CMF value and traffic volume level. However, reliable crossroad AADT data for the before period and after period was not available for all sites. The total crash CMF model is offered to provide a general indication of the relative change in overall safety associated with interchange conversion. However, the FI CMF model and the PDO CMF model are recommended for use when quantifying the change in safety associated with a proposed conversion at a specific location. The CMFs presented in Exhibits 4Â7 and 4Â8 were developed from 26 DDIs from a prior ITRE study (6) where Nye gathered the representative crash data. Some conditions in the tables do not correspond to a condition present at any of the 26 interchanges but generally lie within the range of individual variable values within the data from the 26 interchanges. 4.3 References 1. Cunningham, C., B. Schroeder, J. Hummer, C. Vaughan, C. Yeom, K. Salamati, D. Findley, J. Chang, N. Rouphail, S. Bharadwaj, C. Jagadish, K. Hovey, and M. Corwin. Field Evaluation of Double Crossover Diamond Inter- changes. Contractorâs Draft Submittal. FHWA, Project No. DTFH61Â10ÂCÂ00029, 2014. 2. Chilukuri, V., S. Siromaskul, M. Trueblood, and T. Ryan. Diverging Diamond Interchange Performance Evalu- ation (I-44 & Route 13). Report OR11.012. Organizational Results, Missouri Department of Transportation. February 2011. 3. Edara, P., C. Sun, B. R. Claros, and H. Brown. Safety Evaluation of Diverging Diamond Interchanges in Missouri. Report cmr 15Â006. Missouri Department of Transportation, January 2015. 4. Lloyd, H. A Comprehensive Safety Analysis of Diverging Diamond Interchanges. MS thesis. Utah State University, Logan, UT, 2016. 5. Claros, B., P. Edara, and C. Sun. When driving on the left side is safe: Safety of the diverging diamond inter change ramp terminals. Accident Analysis & Prevention, Vol. 100, March 2017, pp. 133â142. 6. Nye, T. A National Safety Evaluation for Converting a Conventional Diamond Interchange to a Diverging Diamond Interchange. MS thesis. North Carolina State University, Raleigh, NC, 2018.
