
11
Consumer Acceptance and Market Response to Standards
When and how different fuel-saving technologies are incorporated into vehicles depends on multiple market and vehicle system factors in addition to the requirement of fuel economy and greenhouse gas (GHG) standards—including consumer demand and willingness to pay, how manufacturers respond to the standards, how the technologies affect other aspects of the vehicle consumers’ value, and the state of infrastructure supporting the technologies. These factors are also important determinants of the full costs of the standards.
Manufacturers and consumers can respond to increased fuel economy and GHG standards in various ways. As discussed extensively in the previous chapters, manufacturers can incorporate various powertrain and non-powertrain technologies into their vehicles to increase their fuel efficiency while maintaining levels of other attributes (e.g., acceleration performance, capacity, and amenities). Manufacturers can also apply technologies partially to improving fuel economy and partially to improving other attributes, creating a trade-off between improvements in fuel economy and other performance attributes. They can earn, buy, and sell credits for things such as alternative-fuel vehicle sales, or for overcomplying with the standards. Because compliance depends on the sales-weighted average of a manufacturer’s vehicles’ fuel economies, a manufacturer can increase its average fuel economy by adjusting prices and shifting sales to vehicles that exceed their footprint-based fuel economy standards and away from those that do not. Last, if a manufacturer were to increase the footprint of its vehicles or redesigned cars so that they are classified as light trucks, it would reduce the overall standard the manufacturer needs to attain.
Based on recent automaker decisions and their announced plans, each automaker can be expected to pursue a combination of these options, taking into consideration consumer preferences, technology implementation costs, competition with other automakers, and other market factors. A principal consideration of automakers is consumer preferences for fuel economy and other vehicle attributes, which may be affected by changes in the standards.
The effectiveness of the standards at reducing fuel consumption and emissions depends on consumer behavior, including vehicle choices and driving decisions. Consumer preferences for vehicle fuel economy and other attributes affect which vehicles are purchased and the extent to which technologies are adopted by the market. Similarly, consumers’ decisions about driving behavior affects the extent to which fuel-efficiency technologies lead to reductions in overall fuel use.
Consumers considering a new vehicle have a wide range from which to choose. When manufacturers offer a vehicle with particular fuel-saving technologies at a certain price, a potential consumer will determine whether the vehicle and its technologies are worth the price. The term willingness to pay for fuel economy denotes the amount
the consumer is willing to pay for a vehicle with higher fuel economy that is otherwise identical to another vehicle. Because consumers have many options available to meet their transportation needs, if a manufacturer increases a vehicle’s price and fuel economy at the same time, a consumer may purchase that vehicle if willingness to pay for increased fuel economy exceeds the price increase. If not, the consumer may purchase another new vehicle, may purchase a used vehicle, or may not purchase any vehicle. Because vehicles are bundles of attributes, comparison is more difficult in practice, as often consumers will not see vehicles that are entirely equivalent except for in fuel economy.
From the consumer’s perspective, it is useful to classify technologies according to their visibility to drivers and passengers. Technologies that can be considered invisible, such as multivalve engines and additional speed transmissions, increase fuel economy at an extra cost to the manufacturer but do not affect the vehicle’s operation in a way that is noticeable to the driver. Other technologies, such as start/stop and alternative fueling, are visible to drivers. These technologies raise fuel economy but affect the vehicle’s performance or desirability in other ways. For example, stop-start ignition may bother drivers who are not accustomed to the technology turning off and on while stopped at a red light, and plugging in a vehicle is a procedurally different way to fuel.
Invisible technologies affect consumer purchase decisions by affecting the vehicle’s price and fuel economy. Adding fuel-saving technology raises the cost of producing the vehicle, which may increase the price of the vehicle as the manufacturer tries to recover at least some of the costs. Additionally, invisible technologies may present trade-offs with vehicle attributes (e.g., increased fuel economy but decreased acceleration performance). For these types of technologies, a key consideration is how much consumers are willing to pay for the increase in fuel economy resulting from the technologies.
For visible technologies, perceptions of the technologies or trade-offs with other vehicle attributes also affect consumer purchasing decisions. For example, if certain powertrain technologies increase noise or vibrations when driving the vehicle, or negatively affect the vehicle’s handling or “drivability,” this could reduce a consumer’s desire to purchase vehicles with the technologies (Helfand et al., 2016). These negative aspects (whether actual or perceived) are generally referred to as “hidden costs” of the technologies (Gillingham and Palmer, 2014). Visible technologies may also have positive attributes. For example, some consumers may be attracted to the novelty, quietness, or smooth acceleration of an electric or fuel cell vehicle. For visible technologies, the consumers’ valuation (positive or negative) of the technology is a key consideration in addition to willingness to pay for the increase in fuel economy.
To set the stage for a discussion of consumer acceptance, this chapter first reviews historical trends in light-duty vehicle fuel economy and related vehicle attributes. These trends reflect responses to previous standards together with other market developments and technological change. Then, key economic concepts for understanding consumer acceptance are presented: rebound effects in response to fuel economy changes, how consumers value fuel economy and vehicle attributes, and the economic approaches for understanding this consumer valuation, from a traditional and behavioral perspective. These are important for informing how the agencies must consider a wide range of potential benefits and costs when evaluating future standards—estimations that depend critically on how consumers respond to fuel economy improvements and related changes in vehicle cost, technology, and design. This chapter then discusses the role of consumer acceptance in the transition toward new technology and closes with a consideration of electric vehicle (EV) incentives and adoption.
11.1 HISTORICAL MARKET TRENDS
The experience of the past 45 years illustrates how innovation, changing consumer preferences, and regulatory standards have influenced the light-duty vehicle market, providing a useful reference point for considering how the market may change in the future. From 1975 to 2019, the sales-weighted average per-mile fuel consumption and GHG emissions of new light-duty vehicles fell by 49%; the ratio of horsepower to vehicle weight increased 74%; and the combined market share of light trucks increased from 19% to 50% (EPA, 2020, tabulation by vehicle type). Examining these vehicle trends, and technology changes, can provide insights into how the market has achieved fuel economy increases in the past. Fuel economy and GHG standards play a role in influencing these vehicle trends, but they are also driven by changes in consumer demand, fuel prices, market
conditions, and other factors. Where studies have endeavored to separate these effects and causally attribute changes in technology or vehicle attributes to the fuel economy or GHG standards, these findings are discussed.
11.1.1 Changes in Vehicle Attributes and Technologies
Trends in sales-weighted average fuel economy and GHG emissions reveal how the average efficiency of new vehicles produced in a year has changed over time. In 1975, when the first fuel economy standards were passed by Congress, the sales-weighted average estimated real-world fuel economy was 13.1 miles per gallon (MPG) across all light-duty vehicles. It increased quickly to 22 MPG by 1987. Then, although the sales-weighted average fuel economy of both passenger car and light truck segments remained flat, the sales-weighted average across the full fleet decreased as the market share of light trucks grew. By 2004, the average across all light duty vehicles had fallen to 19.3 MPG. As light truck standards began to tighten, and Congress passed higher efficiency standards in 2006, the sales-weighted average again began to rise, reaching 25.5 MPG in 2019 (EPA, 2020). It has been noted in the literature that tightened standards have resulted in vehicles with higher fuel economy and lower performance than would have been realized otherwise (Klier and Linn, 2016). The key features of the fleet related to fuel efficiency, GHG emissions, and performance measures are summarized in Table 11.1.
TABLE 11.1 Vehicle Attributes for the U.S. Light-Duty Fleet in 1975 and 2019, Including Fuel Economy, GHG Emissions, Footprint, Curb Weight, Power, Power-to-Weight Ratio, and Production Share
| Vehicle Attribute (Sales Weighted, Fleet Average) | 1975 | 2019 | % Change |
|---|---|---|---|
| Estimated real-world fuel economy (MPG) | 13.1 | 25.5 | 95% |
| Passenger cars | 13.5 | 29.9 | 120% |
| Light trucks | 11.6 | 22.3 | 92% |
| GHG emissions (g/mi) | 681 | 346 | −49% |
| Passenger cars | 661 | 293 | −6% |
| Light trucks | 764 | 399 | −48% |
| Footprint (ft2) | N/A | 50.2 | N/A |
| Passenger cars | N/A | 46.7 | N/A |
| Light trucks | N/A | 53.6 | N/A |
| Curb weight (lb) | 4060 | 4110 | 1% |
| Passenger cars | 4057 | 3624 | −11% |
| Light trucks | 4073 | 4592 | 13% |
| Power (hp) | 137 | 244 | 78% |
| Passenger cars | 136 | 213 | 56% |
| Light trucks | 142 | 276 | 94% |
| Power-to-weight ratio (hp/1,000 lb) | 0.034 | 0.059 | 76% |
| Passenger cars | 0.034 | 0.059 | 75% |
| Light trucks | 0.035 | 0.060 | 72% |
| Production share | |||
| Passenger cars | 80.7% | 49.8% | −38% |
| Light trucks | 19.3% | 50.2% | 160% |
NOTE: Fuel economy has risen, while GHG emissions have fallen, in concert with increases in weight, power, power-to-weight ratio, and production share of light trucks over passenger cars.
SOURCE: EPA (2020).
GHG emissions largely parallel the trends in fuel consumption over this time period. Sales-weighted average estimated tailpipe GHG emissions fell from 681 grams per mile (g/mi) in 1975 to 405 g/mi in 1987, then began to increase until 2004 as sales shifted toward more light trucks relative to passenger cars. In 2004, the sales-weighted average GHG emissions were 461 g/mi. Since then, they have decreased to 346 g/mi in 2019.
Improvements in fuel efficiency, and corresponding reductions in GHG emissions, have varied across different market segments. The largest improvements were in the passenger vehicle segment, which increased fuel economy by approximately 95%, from a sales-weighted average of 13.5 MPG in 1975 to 25.5 MPG in 2019. The increase in pickup trucks was the smallest among the segments, from 11.9 MPG to 19.4 MPG, or 63%. Trends in estimated real-world MPG and carbon dioxide (CO2) for different vehicle classes are displayed in Figure 11.1.
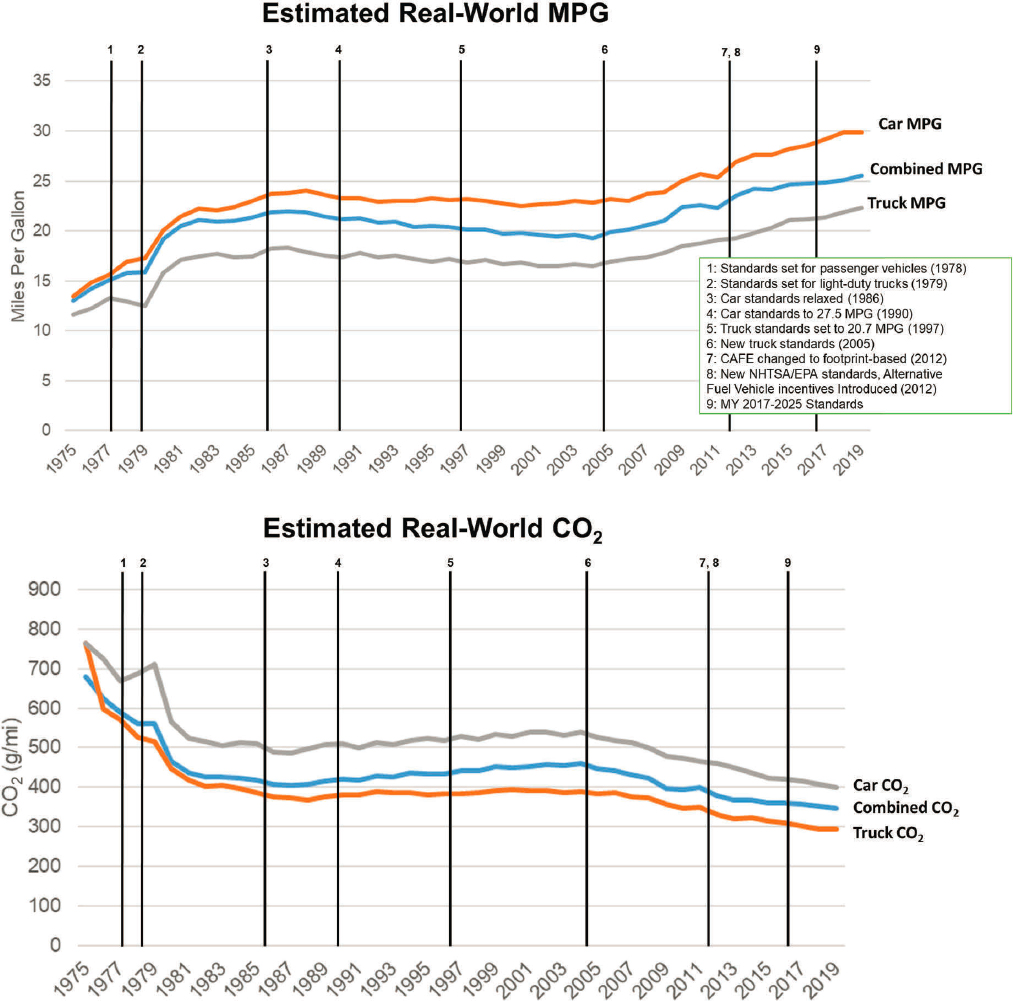
SOURCE: Adapted from Jenn et al. (2016); data from EPA (2019).
SOURCE: EPA (2020).
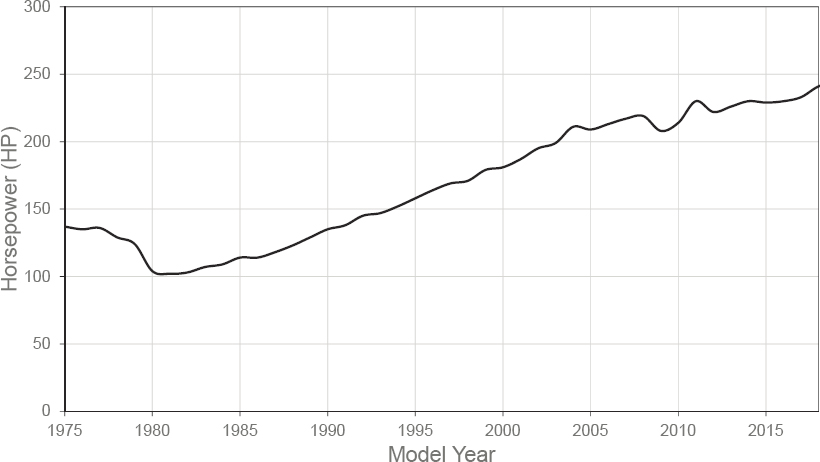
Sales-weighted average horsepower (hp) has also increased significantly over time, from 137 hp in 1975 to 244 hp in 2019, depicted in Figure 11.2. All segments of vehicles have seen increases in horsepower over this time, with pickup trucks experiencing the greatest increase (141 hp to 337 hp, 139%), and passenger cars experiencing the smallest increase (approximately 136 hp to 213 hp, 57%).
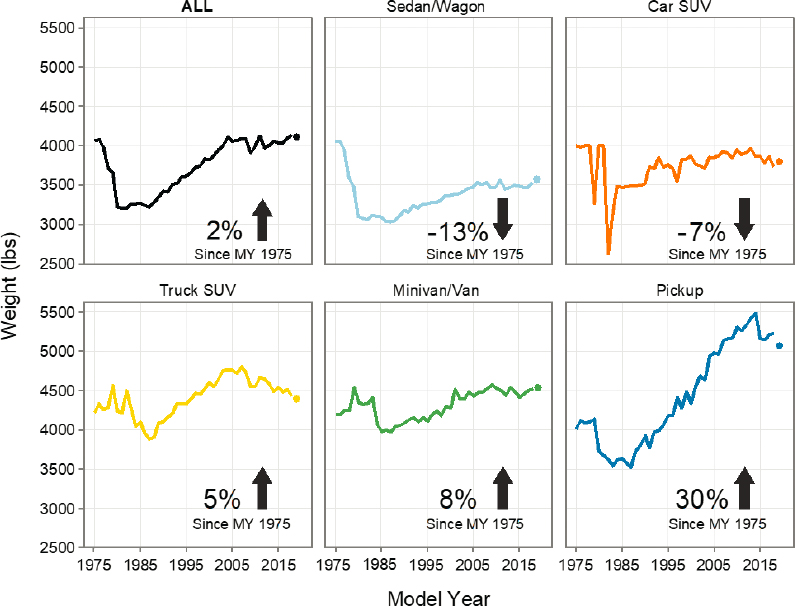
Overall, sales-weighted average vehicle weight is approximately the same as it was in 1975, although passenger car weight has decreased, while light truck weight has increased. The average weight of light-duty vehicles decreased by 22% from 1976 to 1981, but by 2007 all the lost weight had been regained. Since then, average weight has fluctuated somewhat from year to year without a clear upward or downward trend. However, the overall trend masks significant differences at the segment level. The increase in light truck weight is largely driven by pickup trucks, which have increased in weight 26% since 1975. Over this same time, the average weight of sedans and wagons decreased by 12%.
The ratio of horsepower to weight (hp/lb, a measure of acceleration potential) increased 76% during 1975 to 2019 for the average light-duty vehicle. From 1978 to 1985, the average hp/lb ratio changed little. With the exception of small, temporary reductions, the fuel economy standards remained constant from 1985 until 2005, with gradual increases in light truck standards. Passenger car standards were constant through this period, until increasing in 2011. From 1985 to 1995, light-duty hp/lb increased at an average annual rate of 2.35%, but at a declining rate of increase from 1995 onward. For the 9 years prior to the increase in fuel economy standards in 2011, passenger car hp/lb increased at the rate of 0.82% per year. When fuel economy standards were increasing in 2010 to 2019, passenger car hp/lb increased 0.93% per year (EPA, 2020). For the 15 years prior to the increase in light truck standards (1989–2004), light truck hp/lb increased at an average rate of 2.0%/yr. Trends in average new vehicle weight by type are shown in Figure 11.3.
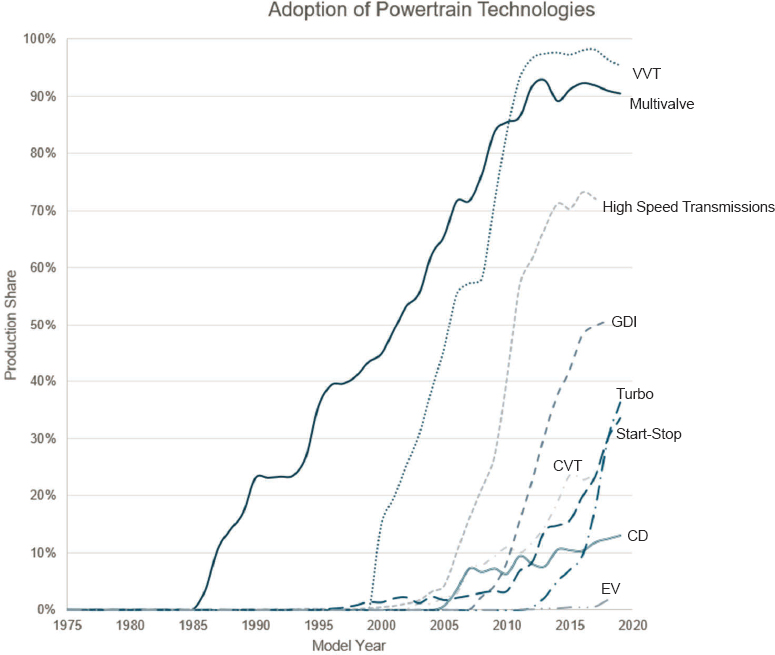
Trends in vehicle attributes show that for most vehicle segments, improvements in both fuel efficiency and power over the past 30 years have been accomplished, while sales-weighted average vehicle weight increased. This indicates that adoption of fuel economy technologies has improved the operating efficiency of these vehicles. Indeed, there has been significant growth in the adoption of higher efficiency powertrain technologies, including multivalve and variable valve engines, high-speed transmissions, direct injection, and others. Multivalve and variable valve engines started entering the market in the mid 1980s and have reached more than 90% share of produced vehicles (EPA, 2020). Until the early 2000s, almost all vehicles had only four or five gears, and by 2011, more than 50% of vehicles had six gears or more. In 2019, 48% of vehicles had seven or more gears and 24% had continuously variable transmissions (CVTs). Some technologies, such as CVTs, turbocharging, and cylinder
SOURCE: EPA (2020).
deactivation, started entering the market in the early 2000s but at a slower rate of growth. Start/stop capabilities were introduced in 2012 and grew to approximately 42% by 2019. EVs remain a small percentage of vehicles produced, at 2.6% in 2019. After two decades in the market, gasoline hybrid electric vehicles accounted for only 5% of light-duty vehicle sales in 2019. Trends in powertrain technologies over model years are displayed in Figure 11.4.
11.1.2 Changes in Market Share
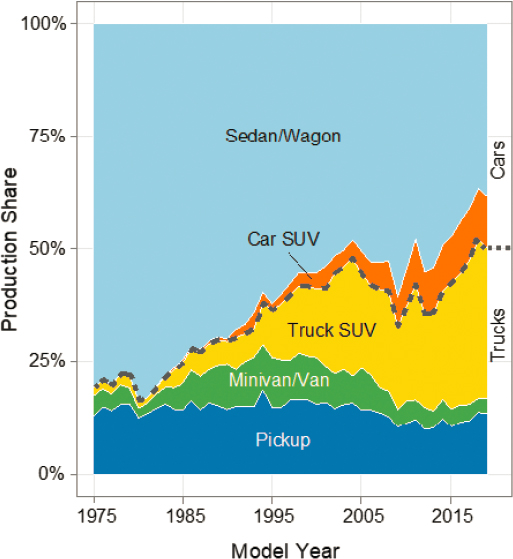
Examining the market share of vehicle segments, it is clear that the share of light trucks relative to passenger cars has been increasing. Since 1975, the market share of sedans and wagons has declined, and the share of sport utility vehicles (SUVs) has increased significantly. The largest increase comes from “truck SUVs,” which are SUVs that are classified as light trucks under the corporate average fuel economy (CAFE) Congressional classifications because they have 4-wheel drive and off-road capabilities as defined by vehicle dimensions such as ground clearance and approach and departure angles. These truck SUVs have increased from less than 2% of sales in 1975 to 33% of sales in 2019. Pickup trucks, in contrast, have held a roughly constant market share, hovering between 10% and 18%. Production share by vehicle type is displayed in Figure 11.5. Owing to these shifts in market share and because trucks have lower fuel economy than cars, the sales-weighted average fuel economy of all new light-duty vehicles sold in the United States increased by only 1.4 MPG from 2014 through 2019. These changes in market share have motivated concerns regarding mass disparity in the light-duty fleet.
FINDING 11.1: Vehicle horsepower and acceleration performance have continued to improve over the past two decades, while standards were tightening. However, the tightening of the standards has caused manufacturers to offer internal combustion engine (ICE)-based vehicles that have higher fuel economy and less performance on average than otherwise would have been the case. The standards have affected vehicle attributes other than fuel economy, and the overall welfare effects of the program on consumers are still subject to study. Whether forgone performance
SOURCE: Committee generated using data from EPA (2020).
SOURCE: EPA (2020).
or other attribute improvements will occur in the future in response to tightened standards depends on technology adoption; the extent to which fuel economy trades off with performance in hybrid, plug-in hybrid, battery electric, and fuel cell powertrains; the impact on production costs; and consumer valuation of fuel economy and performance attributes. Currently policy makers do not have enough information on which actions are most effective.
RECOMMENDATION 11.1: The agencies should collect further evidence on the influence of vehicle performance trade-offs on automaker compliance strategies and consumers, and reassess whether forgone performance improvements should be included in benefit-cost analysis of the standards. The agencies should assess how new technologies penetrating the market will affect the trade-offs among greenhouse gas emissions rates, performance, and other attributes.
FINDING 11.2: The sales-weighted average vehicle footprint has not changed significantly since the footprint-based standards went into effect. However, the sales-weighted average footprint and weight of pickup trucks has increased. Additionally, with growth in consumer demand for SUVs and crossovers, and dual standards for passenger cars and light trucks, there has been an incentive to shift model offerings to light trucks, per regulatory definition.
RECOMMENDATION 11.2: The National Highway Traffic Safety Administration should ensure that its standards do not incentivize increases in the mass of heavier vehicles, exacerbating mass disparity.
11.2 FUEL ECONOMY AND VEHICLE TRAVEL: REBOUND EFFECTS
Fuel economy affects how much driving consumers choose to do, which in turn affects the extent to which increased fuel economy reduces overall fuel use and emissions. Increasing the energy efficiency of energy-using equipment reduces the cost of energy required for its use. Lower energy cost induces increased use, all else equal. This phenomenon is known as the “rebound effect.” It is not in dispute that there is a fuel economy rebound effect for motor vehicle travel, and there is a consensus in the literature that the rebound effect should be included in cost-benefit analyses of fuel economy and GHG standards. However, there is still consequential disagreement about its magnitude. The size of the rebound effect matters because it affects the ability of fuel economy improvements to reduce externalities like GHG emissions and because vehicle travel also has unintended consequences like traffic congestion and local air pollution. This section discusses the rebound effect and empirical estimates of it in behavioral science research.
The rebound effect is typically divided into three parts (IRGC, 2013; Gillingham et al., 2016):
- A direct rebound effect, the increase in vehicle miles induced by the reduced cost of travel.1
- An indirect rebound effect, the effect of net fuel savings on consumers’ income, increasing purchases of other goods and services.2
- An economy-wide or equilibrium effect, owing to changes in consumption patterns and prices throughout the economy.
For vehicle travel, the second and third components are one to two orders of magnitude smaller than the direct rebound effect (Greene et al., 2019) and are typically not included in published studies.3
___________________
1 Like all price reductions, this consists of a substitution effect and an income effect on the demand for travel.
2 Increasing fuel economy by adding fuel economy technologies to vehicles will, in general, increase vehicle prices, which would tend to diminish the rebound effect to some degree. Many estimates of the rebound effect do not take associated increases in vehicle price into account.
3 On average, 3.3% of U.S. households’ expenditures are for “gasoline, other fuels and motor oil” (BLS, 2019). If fuel economy were doubled and half of the fuel savings were offset by the cost of the fuel economy improvement, average household income would increase by 0.825%. If consumers allocated 3.3% of that to more vehicle travel, vehicle miles would increase by only 0.03%. Economy-wide effects can be approximated by estimating the effect on world oil prices. Greene et al. (2019) estimated that without the 70% increase in U.S. light-duty fuel economy from 1975 to 2018, increased petroleum demand would have raised world oil prices by about $2 to $3 per barrel, increasing the price of gasoline by 2–5%. If the elasticity of vehicle travel with respect to the price of gasoline is about –0.2, then the reduction in the price of gasoline owing to increased fuel economy would increase travel by 0.4–1%, implying an increase of 0.06–0.14% for a 10% increase in fuel economy.
Comprehensive international reviews of estimates of the rebound effect can be found in Sorrell and Dimitropoulos (2007), Gillingham et al. (2016), and Dimitropoulos et al. (2018). Dimitropoulos et al. (2018) report the results of a meta-analysis of 74 primary studies of the direct rebound effect, 41 of which were based on U.S. data, containing a total of 1,120 international estimates, based on data from various periods covering more than half a century, and including studies that estimate the elasticity of miles traveled to fuel economy, fuel prices, or fuel costs.4 Among the findings were that the international average short-run (approximately 1 year) rebound effect was about 10%–12%, with a larger long-run effect of 26%–29%. In Table V of their paper, they present estimates that vary by the price of gasoline, population density, and gross domestic product (GDP) per capita. Consistent with theory, their meta-analysis concluded that the rebound effect increased with the price of gasoline and population density and decreased with per capita GDP, making rebound estimates from different countries not directly comparable.5 Linearly interpolating the Table V estimates, using 2018 U.S. values for gasoline price ($0.63/liter), population density (33.75/km2), and GDP per capita ($51,552), Dimitropoulos et al.’s (2018) international meta-analysis model predicts a long-run rebound elasticity of 0.20 (20%) for the United States for the year 2017.
Other findings by Dimitropoulos et al. (2018) include the fact that studies based on microdata (e.g., household survey data) typically produce long-run rebound estimates twice or more as large as studies based on aggregate data (p. 169). However, the magnitude of the differences depended on the number of years covered by the microdata: studies based on 15 to 25 years of microdata produced results similar to studies based on aggregate data. In addition, studies using fuel price rather than fuel economy or fuel cost per mile as the explanatory variable also produced higher rebound elasticity estimates.
The meta-analysis also indicated that the rebound effect had been declining, worldwide, at the rate of about 0.7 percentage points per year. A declining rebound effect in the United States was first observed by Small and Van Dender (2007), who concluded that rising income and falling gasoline prices caused the rebound effect to fall to 2.2% in the short run and 10.7% in the long run for the 1997–2001 period. Hymel and Small (2015) updated and extended that analysis, using state-level data for the years 1966–2009. They again found a declining rebound effect over time but a somewhat higher rebound effect in the 2002–2009 period, possibly caused by higher gasoline prices. They also found decisively asymmetric responses to rising versus falling fuel cost per mile and reasoned that the effect when fuel costs per mile decreased would be a better measure of the rebound effect of increased fuel economy. The asymmetric model produced a long-run rebound effect of 4.2% with respect to fuel efficiency for the 2000–2009 period and a long-run effect of 18.4% for the full sample period of 1966–2009 (Hymel and Small, 2015, Table 8).
Using microdata from the 2009 U.S. National Household Travel Survey, Linn (2016) demonstrated that assumptions about the correlations between fuel economy and other vehicle and household characteristics affected rebound estimates. Considering all factors, Linn (2016) concluded that the rebound effect was between 20% and 40%. Assessing 14 recent U.S. estimates of the rebound effect for vehicle use, Gillingham (2020) concluded that they indicated a central estimate of 0.1. Although recent studies and reviews have narrowed the range of plausible values for future U.S. rebound effects, whether the rebound is, say, 10% rather than 20% will have an important impact on the net social benefits (i.e., benefits net of costs) of fuel economy and GHG standards.
11.3 HOW MUCH DO CONSUMERS VALUE FUEL COST SAVINGS AND WHAT ARE THE IMPLICATIONS FOR BENEFIT-COST ANALYSIS?
A large body of research over the past 40 years has helped to better understand consumer choices and market equilibrium in response to policies such as the fuel economy regulations. This body of research has empirically measured consumer and market behavior, and developed multiple theories that seek to explain and predict
___________________
4 Consistent with Office of Management and Budget Circular A-4, which provides guidance on benefit-cost analysis performed by U.S. regulatory agencies, estimates of rebound using U.S. data are most relevant to analyzing U.S. fuel economy and GHG standards.
5 “However, variation of estimates is large and can mainly be explained by differences in the time horizon considered, the elasticity measure used, and the type of data and econometric approach employed in primary studies. We also find that the rebound effect is declining over time and that lower per capita incomes, higher gasoline prices and higher population density are associated with larger rebound effects.” (Dimitropoulos et al., 2018, p. 163).
this behavior. Currently, there is not a consensus across the research literature on a single theoretical framework that best represents consumer choices, although there is a general consensus on some aspects of representing consumer behavior. Differing theories of consumer choice have important implications for the rationale for regulating fuel economy and for estimating the costs and benefits of fuel economy and GHG standards. Although there is a lack of consensus about how consumers value fuel economy when making car-buying decisions, there is general agreement that the actual fuel savings realized over time should be fully valued in cost-benefit analyses. The greatest area of disagreement is how standards will affect consumers’ satisfaction with new vehicles and, as a consequence, the sales of new vehicles and the retirement of used vehicles. This section first describes the U.S. Environmental Protection Agency’s (EPA’s) and the National Highway Traffic Safety Administration’s (NHTSA’s) assumptions about consumer and market behavior, and whether these assumptions are consistent with evidence and theoretical frameworks in behavioral research. It then presents two alternative theoretical frameworks that describe consumer choices: the traditional economic approach and the behavioral economics approach.
11.3.1 How Much Do Consumers Value Fuel Cost Savings?
A key question for fuel economy and GHG regulation is whether the unregulated market provides the socially optimal level of fuel economy and GHG emissions. Prior to the Safer Affordable Fuel Efficient (SAFE) Vehicles Rule, EPA and NHTSA had argued that standards are justified not just by externalities—in particular, energy security and climate externalities—but also the energy paradox, the apparent tendency of markets to undersupply energy-efficient technology. The agencies argued that the unregulated market does not always adopt technologies for which the value of fuel cost savings exceeds the cost of technology adoption. In fact, past benefit-cost analysis of standards could have justified the standards chosen based entirely on the value to consumers of the fuel cost savings—without even counting the societal benefits from improved energy security and lower GHG emissions.
One possible explanation for the energy paradox is that consumers do not count the full value of the fuel cost savings when choosing a vehicle. Because of this undervaluation, manufacturers have insufficient incentive to adopt technology and reduce fuel costs, giving rise to the energy paradox.
In this context, a sizable amount of literature has attempted to estimate how much consumers are willing to pay for fuel cost savings. The 2015 National Research Council light-duty fuel economy report summarizes this literature (NRC, 2015), concluding that the literature has failed to converge on a clear answer. Because the literature has not evolved much since that report, the literature is briefly summarized here, and readers are referred to the previous report for more detail. While there are several metrics one can use to describe consumer preferences for fuel cost savings, the notion of the valuation ratio is intuitive and has been used widely. The valuation equals the amount that a consumer is willing to pay for a small reduction in fuel at the time of vehicle purchase, divided by the present discounted value of those fuel cost savings over the lifetime of the vehicle. For example, a valuation ratio of 0.5 means that a consumer is willing to pay $0.50 for $1 present value of future fuel cost savings. A valuation ratio less than 1 is referred to as undervaluation.
Some papers in this literature, such as McFadden and Train (2000), estimate discrete choice models that attempt to predict the specific vehicle a consumer chooses based on the vehicle’s price, fuel economy, and other attributes, and perhaps on the consumer’s demographics. Other papers, such as Busse et al. (2013), estimate the effects of a vehicle’s fuel costs on vehicle prices and market shares.
Many papers found undervaluation, and many have found full or even overvaluation. Both earlier studies and more recent ones have found undervaluation. Studies using either methodology (discrete choice or otherwise) have found undervaluation.
11.3.2 Explanations of Potential Consumer Undervaluation
Next, several alternative explanations are discussed for why consumers may undervalue fuel cost savings when choosing a new vehicle. In short, the literature has not yet resolved which explanation best explains any apparent consumer undervaluation.
One set of explanations is consistent with a utility maximization framework, in which it appears to researchers that consumers undervalue fuel cost savings. For example, if fuel economy improvements caused by standards
are not visible to consumers, they do not realize that they are paying more for higher fuel economy. Alternatively, consumers may misunderstand that fuel costs are inversely related to fuel economy (sometimes referred to as MPG illusion), or there may be negative attributes of fuel-saving technologies that consumers consider and that the analyst ignores (sometimes referred to as hidden costs). When assessing whether consumers undervalue fuel cost savings, analysts must make assumptions on the discount rate that consumers use to assess future fuel cost savings. Consequently, explanations that fall under behavioral economics, such as present bias, may cause consumers to use different discount rates from those assumed by the analyst. Likewise, manufacturers may misoptimize if, for example, their forecasts of consumer demand are systematically biased.
The behavioral understanding of consumers’ decision making differs from the traditional economic understanding.6 “To a psychologist, it is self-evident that people are neither fully rational nor completely selfish, and that their tastes are anything but stable. Our two disciplines seemed to be studying different species, which the behavioral economist Richard Thaler later dubbed Econs and Humans” (Kahneman, 2011, p. 269).7
In many behavioral models, consumers’ decisions are not based on well-behaved utility functions. Instead, consumers’ preferences can be strongly influenced by the context, or framing of choices. Context dependence is considered a fundamental aspect of human decision making and one that contradicts choice models that rely on simple scalability, such as consistent choice of the option that provides maximum utility (Trueblood, 2012; Trueblood et al., 2014). Moreover, human decision-making processes often systematically differ from the traditional economic model in ways that are not appropriately characterized as mistakes. The behavioral model maintains that human beings have two fundamentally different modes of thinking, an intuitive (fast, system 1) and a deliberative (slow, system 2), and their decisions may differ depending on which mode of thinking dominates:
- System 1 operates automatically and quickly, with little or no effort and no sense of voluntary control.
- System 2 allocates attention to effortful mental activities that demand it, including complex computations. (Kahneman, 2011, p. 21)
The traditional economic model is similar to the behavioral model’s system 2, which is capable of overruling system 1 but typically does not. Which system is used to make a decision is affected by the context, or framing, of the decision.
Behavioral researchers have identified many important ways in which the behavior of human beings systematically differs from the model of rational economic behavior (e.g., Thaler, 2015; Kahneman, 2011; Dellavigna, 2009; Starmer, 2000). Among these are bounded rationality; satisficing8 rather than optimizing when faced with complex choices (like the choice among makes and models of automobiles); mental accounting (the consideration of value in relative rather than absolute terms); the endowment effect; loss aversion (causing potential losses to weight approximately twice as much as potential gains when consumers are faced with choices); present bias when weighing current versus future consumption; the compromise effect (leading consumers to avoid extreme options [Kivetz et al., 2004]); inadequate information or decision-making skills; inattentiveness; salience (information framed to attract attention is given greater weight); and the MPG illusion (Larrick and Soll, 2008). These differences may be in play when consumers make decisions about fuel economy and novel technologies, with important implications for standards and other policies (Allcott and Greenstone, 2012; Allcott et al., 2014, p. 73).
One behavioral difference, loss aversion, may play an especially important role in consumers’ choices concerning fuel economy technology because of the direction and potential magnitude of its effects. System 1 is loss averse. Faced with a risky choice, humans typically weigh potential losses about twice as much as potential gains
___________________
6 In what appears to be the only peer-reviewed study investigating the actual decision making of U.S. households about fuel economy, Turrentine and Kurani (2007) found no evidence to support the economic theory of rational expectations.
7 Daniel Kahneman was awarded the Nobel Prize in Economics in 2002 for his work in behavioral economics including Cumulative Prospect Theory and loss aversion. His book cited here, Thinking Fast and Slow, won the National Academies’ Best Book Award for 2012. Richard Thaler won the 2017 Nobel Prize in Economics for his work in behavioral economics.
8 Satisficing is the assessment that available options are adequate.
and overestimate the probability of loss (Thaler, 2015; Kahneman, 2011; Camerer, 2005; Kahneman and Tversky, 1979).9 However, the degree of loss aversion varies considerably from one individual to another (e.g., Nuemann and Böckenholt, 2014; Gächter et al., 2007). Critical factors that determine the value of fuel economy to a car buyer are substantially uncertain, including actual fuel economy versus label value (Greene et al., 2017; Wali et al., 2018) and the future price of gasoline (Hamilton, 2009). Simulations applying loss aversion to consumers’ fuel economy choices have shown that it can account for undervaluing of fuel economy improvements by half or more (Greene et al., 2013; Greene, 2011a).
Loss aversion is a general characteristic of human behavior, confirmed in numerous experimental as well as psychological and neurological studies (Sokol-Hessner and Rutledge, 2019) and observed by means of magnetic resonance imaging of the human brain (Tom et al., 2007). However, loss aversion has only recently been documented in the context of consumers choosing among new vehicles (Mrkva et al., 2019).
A crucial feature of loss aversion is its context dependency. Most of consumers’ choices do not induce a loss averse response. However, when a choice is framed with the following attributes, loss aversion is expected (Novemsky and Kahneman, 2005):
- A simple choice between a risky alternative and doing nothing—for example, buy versus do not buy a fuel economy technology (Ert and Erev, 2013).
- A choice that is infrequently encountered—for example, purchase a vehicle every few years (Erev et al., 2017).
- A choice involving substantial gains and losses—for example, in the hundreds or thousands of dollars (Kahneman and Tversky, 1979).
The choice to buy or not buy an energy-efficient or novel technology (e.g., the choice between a hybrid or standard version of the same car) is a simple risky bet framed to induce loss aversion. The choice between a large car and a small car or light truck, or the choice to buy a new car or hold on to one’s used vehicle is not framed to induce loss aversion.
The direction of loss aversion’s effect is clear. The upfront cost of an option to buy a fuel economy technology is known (e.g., the hybrid versus nonhybrid), but the value of future fuel savings is uncertain, chiefly owing to uncertainty about the actual fuel economy that will be achieved but also owing to uncertainty in future fuel prices, the amount of driving that will be done, discount rates, and so on. The payoff to the risky bet is the difference between the perceived uncertain value of future fuel savings and its cost. Loss aversion says that the perceived losses (cost > value) will be weighed twice the perceived gains. This unequivocally results in a bias toward undervaluing the fuel economy technology relative to its expected value. Only if the probability of losses is zero, in which case the choice is not risky, will there be no downward bias. Using typical uncertainties in the relevant variables, Greene (2011) showed that loss aversion would result in undervaluing fuel economy technologies by half or more, resulting in implicit payback periods of 3 to 4 years. If manufacturers understand that consumers will undervalue fuel economy technologies, they would be reluctant to add them to new vehicles.
According to the National Research Council (NRC, 2015) and the SAFE rulemaking (NHTSA/EPA, 2020), manufacturers believe that consumers significantly undervalue fuel economy and are typically willing to pay for only around 2.5 years of expected future fuel savings, consistent with the predictions of loss aversion (Greene, 2019).10Greene et al. (2013) present evidence from four national random sample surveys from 2008 to 2013 that consistently supports the manufacturers’ view of consumers’ willingness to pay for technology-based fuel economy improvements. Loss aversion implies that manufacturers would be reluctant to offer their customers the option to buy or not buy technology that improves fuel economy unless the fuel savings quickly repaid the upfront cost. However, although loss aversion is consistent with an average payback period of 2.5 years, research has not yet demonstrated that loss aversion of new vehicle buyers explains such a payback period.
___________________
9 Humans overweight losses relative to gains in riskless choices, which is termed the “endowment effect.” Loss aversion has been found not to apply to the exchange of money for goods in normal, riskless market transactions (Novemsky and Kahneman, 2005).
10 Apparent undervaluing of energy efficient technology has been observed across a wide variety of energy using durable goods and has been termed the “energy efficiency gap” or “energy efficiency paradox” (Gerarden et al., 2015; Gillingham and Palmer, 2014, p. 1486).
Consumers’ fuel economy choices in the context of fuel economy standards are very different. Because all makes and models gradually become more fuel efficient, the decision to buy a more efficient vehicle is no longer a simple risky bet, a choice to buy or not buy added fuel economy technology. Because all vehicles with similar attributes are more fuel efficient, MPG differences among similar vehicles tend to be small and may not be salient to consumers’ vehicle choices (e.g., Leard, 2018; Sallee, 2014). With fuel economy improving gradually over a period of several years, consumers have the opportunity to learn whether the fuel savings promised by window stickers and advertisements are being realized, reducing uncertainty. Under these circumstances, loss aversion is not expected for gradual and across-the-board fuel economy improvements. Consumers finding that they get more miles per gallon are likely to fully value the fuel savings. If the value of those savings exceeds their upfront cost, consumers are likely to prefer the newer, more efficient vehicles to comparable but less efficient used models.
The behavioral model provides a possible explanation for several facts that otherwise might appear anomalous. From the perspective of the behavioral model, the fact that dozens of studies conducted over the past 30 years are almost evenly divided with respect to whether consumers substantially undervalue fuel economy or value at approximately its expected, discounted present value (Greene, 2010; Helfand and Wolverton, 2011; Greene et al., 2018) is a reflection of inferences based on models that typically do not allow consumers’ preferences to vary according to the framing of choices. For example, fuel prices have varied dramatically over this period, which could affect preferences. On the other hand, estimating consumers’ willingness to pay for fuel economy is a particularly difficult problem for statistical inference and the variation in estimates may simply reflect that. From the perspective of the behavioral, it is also reasonable that previous assessments of the technological potential to increase light-duty vehicle fuel economy by National Research Council committees and the regulatory agencies have found substantial potential to increase fuel economy at costs considerably less than the discounted present value of expected future fuel savings (e.g., NRC, 1992, 2011, and 2015; TRB and NRC, 2002). On the other hand, the studies may have underestimated costs by not quantifying the foregone value of other attributes, particularly acceleration. From the perspective of the behavior model, the fact that fuel economy standards have consistently enjoyed overwhelming popular support (NRC, 2015; CRSG, 2018, 2017) is also not an anomaly but an expected result. If loss aversion does not apply to fuel economy improvements required by standards, as discussed above, there could be other reasons why consumers undervalue technology-based fuel economy improvements.
11.3.3 Implications for New Vehicle Sales and Used Vehicle Retirements
If fuel economy and GHG standards require manufacturers to produce and sell vehicles that consumers consider less desirable than the vehicles that would have been produced in the absence of standards, new vehicles sales would be lower than they would have been without the standards. If new vehicles are less desirable, demand would shift in favor of used vehicles, increasing their prices above what would have been the case without standards. As a result of the higher used vehicle prices, consumers will hold onto their used vehicles longer, slowing the rate of turnover of the vehicle stock. This phenomenon, known as the “Gruenspecht effect,” was first identified as a possible outcome of vehicle emissions regulations (Gruenspecht, 1982). The traditional economic model implies that the Gruenspecht effect is a highly likely, if not certain, unintended consequence of fuel economy and GHG regulations. With respect to cost-benefit analysis, the Gruenspecht effect has two negative consequences. First, there will be a loss of consumers’ surplus because new vehicles are more expensive but not as desirable as they would have been without the standards, and used vehicles are more expensive. Manufacturers will suffer a loss of profits owing to lower new vehicle sales. Second, slowing the rate of turnover of the used vehicle stock will slow the penetration of new safety technologies into the on-road vehicle fleet, resulting in higher levels of traffic fatalities and injuries than would have been the case without the regulations.
On the other hand, the Gruenspecht effect is not predicted by the behavioral model, under which it is not only possible but likely that if the fuel savings from increased fuel economy exceed its cost, consumers will find the more fuel-efficient vehicles required by regulation to be preferable to those that would otherwise have been produced. Under the behavioral model, consumers undervalue fuel economy technology when it is offered as a simple risky choice to purchase or not to purchase. The framing of the choice induces a predominantly system 1 response rather than a more rational system 2 response. This discourages manufacturers from using technologies that have
payback periods longer than about 2 or 3 years. By changing the framing of fuel economy technology choices (in general, all new vehicles are more fuel efficient and only a little more fuel efficient than the previous model year), standards can deliver vehicles whose fuel savings substantially exceed their increased prices and that will be accepted by consumers. Absent loss aversion, consumers are likely to appreciate the value of future fuel savings and therefore be pleased with the new, more fuel-efficient vehicles. It is possible that sales would increase rather than decrease and likewise manufacturers’ profits. In that case, increased new vehicle sales would reduce used vehicle prices, benefiting buyers of used vehicles and accelerating the turnover of the vehicle stock.
11.3.4 Implications of Potential Undervaluation for Benefit-Cost Analysis
Earlier, it was noted that the literature has not settled on a single explanation for potential consumer undervaluation of fuel cost savings. Here, it is pointed out that the interpretation of undervaluation has implications for benefit-cost analysis of fuel economy and GHG standards. Traditional economics provides a framework for evaluating the welfare effects of fuel economy and GHG standards. These welfare effects include consumers and manufacturers in the vehicle market and other markets affected by the regulation (e.g., used vehicles), and social welfare effects that are external to those markets, such as GHG emissions reductions. The welfare effects are estimated by comparing scenarios that differ only in the level of the standards. For example, one might compare the fuel economy and GHG standards for model years 2022–2025 that the Obama administration adopted with the standards the Trump administration proposed for the same model years. Implementing this framework requires assumptions about how manufacturers and consumers make decisions. Recent papers usually assume that manufacturers comply with standards using multiple options. All include sales mix, many include technology adoption, and some include trade-offs among fuel economy, horsepower, torque, and footprint.
The vehicle market is concentrated, with the top-5 firms accounting for 66% of the market and the top-10 firms accounting for 90% of the market in 2018 (EPA, 2020, Table 5.11). It is readily apparent that manufacturers pursue different pricing and technology strategies and that their strategies are commonly known.
There are relatively few automakers, in part owing to the large capital investments necessary to enter the automotive market. These few automakers sell differentiated products, making this an impure oligopolistic market. This market structure presents imperfect competition, meaning that manufacturers account for the effects of their own decisions on the decisions of other manufacturers. For example, suppose that a manufacturer ignores competitive responses and decides to raise the horsepower of its vehicles. The manufacturer would expect to attract consumers from other manufacturers. The situation is different if the manufacturer anticipates competitive responses by other manufacturers. That is, if the first manufacturer raises horsepower of its vehicles, the manufacturer expects its competitors to respond by raising horsepower of their vehicles. Consequently, all vehicles would have higher horsepower and the first manufacturer would not have a competitive advantage over the other manufacturers. Therefore, the manufacturer is less likely to raise horsepower if it anticipates competitive responses. The assumption of imperfect competition accounts for these feedbacks and competitive interactions among manufacturers.
On the consumer side, economic models include the assumption that each consumer chooses the vehicle that maximizes subjective utility. This is usually formulated as a discrete choice problem, where a household chooses whether to purchase a vehicle, and if so, which vehicle. Modelers may embed this choice in decisions about selling or scrapping other vehicles and the amount those vehicles are driven. Models usually allow for the possibility that preferences for vehicle attributes vary across individuals. For example, some may have higher willingness to pay for fuel economy than others. As a result, the market will be segmented, with high willingness to pay consumers typically purchasing vehicles with high fuel economy. Accounting for consumer preference variation is important for characterizing how manufacturers’ price and attribute choices affect sales. For example, one would expect that if a manufacturer raises the price of a luxury vehicle, most consumers will substitute to other luxury vehicles.
Other markets may be affected, particularly the used vehicle market. If consumers have low willingness to pay for fuel economy, tighter standards could increase demand for used vehicles because they are not subject to
the standards. Higher demand would raise prices of used vehicles. In turn, the decision to scrap a vehicle depends on its price in the used vehicle market. For example, if a repair is needed, a consumer may decide to make the repair and sell the vehicle rather than scrap it if the price of the vehicle exceeds the repair cost. Under this interpretation, the choices about vehicle purchase, scrappage, and miles traveled should be modeled jointly so that the model is based on a coherent set of assumptions that is consistent with the literature.
It is important to recognize that even if consumers choose a vehicle to maximize, consumers may make systematic mistakes when choosing a vehicle. For example, the possibility that fuel economy improvements caused by the standards are not visible to consumers was noted earlier. In that case, the consumer’s willingness to pay would be less than the present discounted value of the fuel cost savings. The analysis would use the consumer’s preferences to characterize consumer choices in each scenario, and then would conduct the welfare analysis accounting for these mistakes. To take an extreme example, suppose consumers have zero demand for fuel economy, meaning that they completely ignore fuel economy when purchasing a vehicle. In that case, standards would reduce manufacturer profits, because if manufacturers attempted to raise prices, consumers would substitute to used vehicles. Welfare analysis would account for the reduction in new vehicle sales and effects on manufacturer profits. It would also include actual fuel cost savings to consumers who purchase new vehicles.
Welfare effects are sensitive to the assumptions made. Accounting for various compliance options generally reduces costs to manufacturers. Accounting for consumer preferences and variation in those preferences across consumers has implications for total costs and for distribution costs across manufacturers and consumers.
In short, the utility maximization approach assumes that consumers maximize utility and that manufacturers are attempting to maximize profits. It is important to recognize that this approach can allow for the possibility that either manufacturers or consumers make mistakes (as distinct from a situation in which the researcher fails to correctly specify the model consumers use to make decisions). If consumers or manufacturers are misoptimizing, they make decisions according to their (incorrect) beliefs, and benefits and costs are evaluated using the realized outcomes. For example, if consumers undervalue fuel cost savings, the undervaluation would be accounted for when they are choosing which vehicle to buy, but their mistake would be corrected for when evaluating consumer benefits of lower fuel costs.
If the agencies adopt the utility maximization approach, they would model consumers as maximizing their own subjective well-being, while subject to a budget constraint and given the prices and attributes of vehicles in the new and used markets. If the benefit-cost analysis of the standards includes the effects of the standards on miles driven, accidents, scrappage, and other outcomes, it would be best that the agencies model consumer choices about vehicle purchase, scrappage, and miles traveled in an internally consistent manner. As of the SAFE Rule, although the agencies analyze the effects of standards on scrappage and miles traveled, they do not use an internally consistent framework. For example, they assume that fuel economy standards affect total new vehicle purchases but not the purchases of individual vehicle types, which is inconsistent with utility maximization. These inconsistencies yield some perverse results and likely cause the agencies to misestimate the effectiveness of the standards at reducing fuel consumption and GHG emissions, as well as the aggregate welfare effects, which include changes in manufacturer profits, consumer well-being, and other factors (Bento et al., 2018).
As noted above, some of the behavioral economics explanations for undervaluation can be incorporated in a standard utility maximization framework. If research reveals that other behavioral explanations are at work, it may be necessary to reformulate the welfare framework.
11.4 TRANSITIONS TO NEW TECHNOLOGY
As new technologies such as EVs and autonomous vehicles (AVs) become more relevant for improving the fuel use and emissions of vehicles, it will become more important to incorporate consumer and market barriers to new technologies into frameworks that aim to understand and predict vehicle market and driving behavior. This section describes relevant market failures and consumer barriers to transitioning to new technologies.
The transition to new vehicle technology platforms like EVs and AVs will affect and disrupt every segment of the motor vehicle ecosystem, including automakers, suppliers, dealers, fleet owners and operators, repair and
maintenance facilities, ride share services, insurers, and consumers. Section 11.4.2 addresses some of the impediments to adoption of new vehicle technologies such as EVs and AVs by existing market participant companies. Section 11.5.2 discusses impediments and challenges to consumer adoption and acceptance of these novel vehicle technologies.
FINDING 11.3: A lack of consumer understanding and familiarity as well as risk aversion to novel technology is an important barrier to novel technologies. Innovative approaches including education, consumer incentives, and dealership training may be required to overcome these barriers. Additional studies and information are needed to inform the most effective implementation of these actions.
RECOMMENDATION 11.3: More data and research on the relative effectiveness on vehicle adoption of different actions (e.g., education, consumer incentives, regulations, building supporting infrastructure) is needed to inform policy decisions, as well as whether effectiveness depends on who is undertaking the actions.
11.4.1 Market Failures and Company Responses to Disruptive Change
All companies in the motor vehicle industry face challenges in the shift to new vehicle technologies such as battery electric vehicles (BEVs), fuel cell vehicles, and connected and automated vehicles. These new technologies will require fundamental changes in the way vehicles are designed, manufactured, serviced, fueled, and operated. These changes will create opportunities for some companies but will represent a major change in the way existing companies across the vehicle ecosystem currently do business. Suppliers will need to produce and market new vehicle technologies. Manufacturers and their engineers will need to design, test, and build vehicles with very different core technologies. Dealers will need to sell vehicles that sales staff may be unfamiliar with, and that may provide a different driving experience for consumers and much lower maintenance costs (a major revenue stream for dealers). Energy suppliers will need to shift their supply and infrastructure to new fuel modalities. Fleet owners will need to adjust to new vehicle types with novel operation and fueling requirements. Fuel infrastructure will need to shift from gasoline refueling stations to electricity and hydrogen refueling stations. Not unexpectedly, companies in all these sectors are likely to exhibit some conscious or subconscious resistance to these technology changes.
The history of technology change teaches us that resistance to new technologies is a standard response of the incumbents (Juma, 2016). Joseph Schumpeter described how “creative destruction” is the engine of economic development and our market economy, in which “new consumers, goods, the new methods of production or transportation [and] the new markets” improve our economy and society at the expense of, and over the objections by, existing industries and businesses that are displaced by the new technologies (Schumpeter, 1942, p. 83). This resistance to new technologies is further extended by Clayton Christensen’s concept of “disruptive innovation,” in which entrenched market leaders stay focused on serving their customers with existing technologies while underestimating the disruptive impacts of new technologies that are initially less in demand but that may eventually displace their existing products, and if they are not careful, existing companies (Christensen, 1997).
Another relevant factor is that technological development is characterized by long periods of gradual, incremental change, punctuated by rare periods of rapid technology change that can disrupt existing markets and industries (Tushman and Anderson, 1986). The shift from ICEs to battery electric and fuel cell vehicles may represent one of these rare technological discontinuities. In such periods of rapid technology change, “[s]kills that brought product-class leaders to preeminence are rendered largely obsolete; new firms founded to exploit the new technology will gain market share at the expense of organizations that, bound by traditions, sunk costs, and internal political constraints, remain committed to outmoded technology” (Tushman and Anderson, 1986, p. 444).
In addition to these well-established general dynamics of technology change, several other aspects tend to “lock in” the incumbent petroleum/ICE paradigm and impede the transition to battery electric, fuel cell, and connected and automated vehicles. Like many other cleaner energy technologies, the private companies who need to invest in the development and deployment of the new cleaner technologies do not capture all the
societal benefits of the cleaner energy, thus creating a classic externality problem that will result in companies under-investing from a societal good perspective in these cleaner technologies (Jaffe et al., 2005). A special case of this problem is that a company that invests in such technologies will not be able to capture all the learning-by-doing benefits of its investments, but rather some of the resulting knowledge and experience spillover to competing companies. This will create private incentives for firms to delay and free ride on the investments of others (Nemet, 2012). Additionally, the manufacturers of electric and fuel cell vehicles, the primary movers in the transition away from ICEs, are dependent on complementary technologies such as battery or fuel cell manufacturers and infrastructure developers, which are mostly outside of their direct control. This further enhances the risk and deters investment in cleaner technology vehicles (Marchant, 2014). The transition to new vehicle powertrains that use new types of energy will require enormous capital investments throughout the vehicle life cycle, which may delay or deter vehicle manufacturers from going “all in,” especially in the post-COVID-19 era. An example of the historic lack of automaker commitment is limited advertising of EVs: in 2019, only 0.3% of automaker advertising dollars were spent on EVs (Plumer and Popovich, 2020), as well as anecdotal lack of availability of BEV models at dealerships, especially outside of the states that have a zero-emission vehicle (ZEV) mandate. Last, consumer unfamiliarity and hesitance about alternative fueled vehicles, discussed elsewhere in this chapter, presents a further barrier for vehicle manufacturers to invest in these technologies.
Notwithstanding all these barriers and disincentives, vehicle manufacturers are not opposed to battery electric, fuel cell, and connected and automated vehicles in principle. All major vehicle manufacturers now recognize the need to address climate change and reduce fossil fuel consumption, and have publicly stated that they want to be part of the solution rather than the problem (Toyota Motor Company, 2020; Volkswagen Group, 2020; Ford Motor Company, 2020; Honda, 2020; General Motors, 2016; Nissan Motor Coporation, n.d.; among others). Many manufacturers have adopted a long-term goal of zero-emission fleets. Vehicle manufacturers have invested billions into developing hybrid, battery electric, fuel cell, and connected and automated vehicles. Moreover, to the extent existing vehicle manufacturers do not develop these vehicles fast enough, start-ups such as Tesla and Waymo will quickly occupy that space, and they have already become leaders in electric and automated vehicles, respectively. Yet, despite these important industry efforts and support for transitioning away from ICEs, vehicle manufacturers are unlikely to move as fast and as far as society requires on their own volition, given the factors identified above. Moreover, other private participants in the vehicle ecosystem, such as energy suppliers and dealers, may be even more resistant to technology change (NRC, 2015).
The net effect of these factors is that from a societal perspective rational vehicle manufacturers and other private actors in the vehicle ecosystem will under-invest and delay in the transition to alternative fueled vehicles, even if they understand and in principle support that transition. Two general types of policy interventions can help to address these barriers, loosely grouped into “carrots” and “sticks.” Carrots can consist of government research funding and initiatives, tax credits or other subsidies for the sale or purchase of ZEVs, and infrastructure investments such as refueling stations (Nemet, 2012). Sticks usually come in the form of technology-forcing regulations. Of course, sticks and carrots are not exclusive, and the best policy strategy would be an integrated policy mix of regulatory requirements and incentives (Kivimaaa and Kerna, 2016; NRC, 2013).
11.4.2 Consumer Acceptance Barriers and Challenges
In addition to the complex consumer response to energy-saving vehicle technologies discussed in the previous sections of this chapter, another important element of consumer response is how the public responds to new technologies, going beyond vehicle fuel economy attributes. Consumers have important and often complex responses to new technologies that disrupt or change important aspects of their daily routines and may present new physical, economic, or other risks. EVs and AVs are likely to raise such reactions given their key differences from traditional vehicles that consumers are familiar with. Section 11.4.2.1 summarizes what is known about how consumers respond to novel technologies generally. Section 11.4.2.2 discuses consumer responses to EVs. Section 11.4.2.3 describes how consumers are likely to respond to AVs.
11.4.2.1 Consumer Responses to Novel Technologies
Consumers have diverse and complex reactions to novel technologies that disrupt or change their daily lives. Some consumers are attracted to novel products, and these individuals tend to be “early adopters” of new technologies (Rogers, 2003; Hirunyawipada and Paswan, 2006). The experience of these early adopters can provide important positive or negative feedback to the product manufacturers and their fellow, more reticent but mainstream consumers (Rogers, 2003). Negative experiences reported by early adopters can depress the willingness of other consumers to try the new technology. For example, initial purchasers of diesel cars in the United States experienced high diesel costs and new maintenance problems, and word of these problems spread throughout the rest of the population and deterred other consumers from purchasing diesel vehicles (Ram and Sheth, 1989).
While some consumers seek out and desire new innovations, many others affirmatively resist new technologies that disrupt their daily routine or present new risks. This phenomenon of “innovation resistance” has been defined as “the resistance offered by consumers to an innovation, either because it poses potential changes from a satisfactory status quo or because it conflicts with their belief structure.” (Ram and Sheth, 1989, p. 6). This innovation resistance is in many cases not simply the lack of willingness to adopt but rather is driven by one or more practical or psychological barriers that actively dissuade a consumer from adopting a new technology (Kleijnen et al., 2009). A highly discontinuous innovation based on a new technology, such as the first computer, creates major changes in a consumer’s way of life and is most likely to trigger innovation resistance (Ram and Sheth, 1989). “The higher the discontinuity of an innovation, the higher the resistance is likely to be” (Ram and Sheth, 1989, p. 6).
Consumer innovation resistance has a number of potential contributing factors, including functional barriers and risk barriers (Ram and Sheth, 1989). The most common functional barrier is when a new product alters product usage patterns by changing existing routines, practices, or habits of a consumer (Ram and Sheth, 1989). “[C]onsumers have an intrinsic desire for psychological equilibrium” and “[a]ny change imposed on their behavior has the potential to disturb this equilibrium”; “the consumer thus more often opts for resisting the change than going through a disturbing process of readjustment” (Ram, 1987, p. 208). An example is consumer resistance to carpooling, which required significant changes in consumer schedules, convenience, and comfort levels (Ram and Sheth, 1989).
A second type of functional barrier is when the innovation does not provide a superior performance-to-price value, so consumers see no benefit in transitioning to the new technology (Ram and Sheth, 1989). An example of such a barrier was the introduction of video discs, which consumers did not perceive as better value than existing video cassette recordings (VCRs) because, unlike the VCR, the videodiscs could not be recorded or reused.
Consumers may also resist new technologies out of concern for the physical, economic, performance, or social risks of an innovative technology (Conchar et al., 2004). A novel technology may present uncertain or unique physical risks, which makes consumers reluctant to try the new product. Resistance may be based on perceived or uncertain risks of the new product. For example, many consumers initially resisted microwave ovens because they feared the (non-ionizing) radiation might physically harm them (Ram and Sheth, 1989).
Consumers may also hold off buying a new product, owing to economic risks—in particular, the concern that a novel technology is still improving—and thus a consumer may be better off waiting until the technology gets better and cheaper (Ziamou and Veryzer, 2005). Consumers are concerned about being stranded with obsolete or inferior products, such as when early purchasers of Sony Betamax felt aggrieved when their video players and videos were displaced by the superior Video Home System (VHS) technology (Kleijnen et al., 2009). “Products based on new technologies are especially susceptible to this risk” (Ram and Sheth, 1989, p. 8).
A third and related type of risk barrier is concerns about the performance of a new technology, based on fears that the effectiveness or safety of the new product may not have been fully validated. Consumers will postpone their purchase of the new technology until its safety and effectiveness have been proven by widespread consumer use (Kleijnen et al., 2009). Such concerns about performance apply to any new vehicle model (Ram and Sheth, 1989).
A variety of strategies are available to mitigate or overcome the functional and risk barriers that contribute to innovation resistance. One strategy is to design the product so that it better fits within consumers’ existing lifestyle and infrastructure. For example, when Chrysler first started marketing minivans, the commercial vans that previously existed would not fit into many consumers’ garages, so the vehicles were redesigned to fit into garages
and this broke down the usage barrier (Ram and Sheth, 1989). Another strategy for breaking down usage barriers is mandating the technology through legislation, which has been effective for a variety of technologies such as unleaded gasoline, seat belts, and smoke detectors (Ram and Sheth, 1989).
Probably the most effective strategy for overcoming adoption barriers is to provide superior performance value over existing products (Ram and Sheth, 1989). An example is the introduction of electronic calculators, which could perform functions that their predecessor electromechanical calculators could not, and hence consumers quickly were willing to buy and even pay more for this superior performance (Ram and Sheth, 1989). Another effective strategy is to offer the product on a trial basis, so consumers can experience the new technology and get comfortable with the performance and perceived risks of the new technology (Rogers, 2003). An example is when the herbicide 2,4-D was first introduced, the manufacturers offered farmers a free trial for use on a 5- or 10-acre field, which successfully assured the farmers of the utility and safety of the new product (Ram and Sheth, 1989). Consumers are also likely to overcome their resistance to a technology if their costs are sufficiently inexpensive (Kleijnen et al., 2009).
Last, public education is an important strategy for overcoming consumer barriers to new technologies (Kleijnen et al., 2009). Much consumer resistance to new technologies is based on “suspicion” of unproven technologies, even when that suspicion is not supported by evidence (Kleijnen et al., 2009). While education of the public can be a slow and laborious process, it can significantly improve public acceptance over time, especially if supported by government or credible opinion-leaders (Ram and Sheth, 1989). Companies have used advertising showing products being used by unexpected types of people to help expand acceptance of a product—for example, Honda ran ads of respectable people such as priests and an elderly lady in tennis shoes riding their motorcycles with the caption “The nicest people ride on a Honda” (Ram and Sheth, 1989).
11.4.2.2 Consumer Resistance to BEVs
BEVs present two of the major factors that lead to innovation resistance. First, “innovations which conflict with the usage patterns of competing and well-established . . . or that contradict well-established workflows, practices, or habits, will face resistance” (Kleijnen et al., 2009, p. 346). “[R]esistance would seem to be a normal response of consumers when confronted with innovations” (Ram, 1987, p. 208). BEVs represent a significant change in how consumers fuel and use their vehicles. One particular issue is the longer fueling time (recharging compared with filling a gas tank), especially where fast-charging infrastructure is not available. Marketing or educational communications that show how EVs fit easily into consumers’ daily routines are likely to be effective (Kleijnen et al., 2009). For example, Toyota successfully marketed its Prius hybrid by focusing much of its “marketing communications on showing how the Prius is still able to deliver a driving experience consistent with current usage habits (e.g., ability to cover long distances without refueling)” (Kleijnen et al., 2009, p. 354). Lessons from this effort could be drawn upon to inform BEV marketing efforts.
Informational and word-of-mouth campaigns may also be effective in educating consumers about the ways that BEVs may improve the consumer’s quality of life, such as better acceleration, quieter ride, lower operational costs, reduced maintenance, and the convenience of being able to refuel at home or work without having to make regular trips to gas stations. Word-of-mouth and media propagation of good experiences with a new technology play an important role in reducing consumer resistance (Ram, 1987). Additionally, evidence suggests that consumers may view BEVs more positively after having experiences with the vehicle type (Liu et al., 2020; Schmalfuß et al., 2017). Perhaps the nation that has first achieved mainstream adoption of BEVs is Norway, where BEVs represented more than 46% of new vehicle sales in 2019 (EAFO, 2020). Analysis of public experiences in that country indicate that the two biggest factors for the mainstream uptake of BEVs was government subsidies and tax breaks that made BEVs cost-competitive with ICEs,11 and improvements in performance, addressing consumers’
___________________
11 The Norwegian government provides purchase incentives for BEVs by exempting purchases of such vehicles from the value added tax (VAT) and registration fees, which are usually quite substantial in Norway. In addition, local incentives include exemptions from road tolls and parking charges (Figenbaum and Nordbakke, 2019).
concerns over range (Figenbaum and Nordbakke, 2019). Greater awareness of these benefits should help overcome the resistance of many consumers owing to the changes that BEVs will create to their daily routines. Education on the differences among BEVs, plug-in hybrid electric vehicles (PHEVs), and other powertrain types may also present consumers with the opportunity to correct misperceptions and evaluate the BEV technology with a more-informed understanding of the technology. In addition to educational and marketing programs, making the recharging capacity more easily available and user friendly will also help to overcome resistance based on unfamiliarity and disruption of daily routines.
Second, BEVs create resistance based on risk—in this case, primarily fear of inadequate range of BEVs and the risk of being stranded by dead batteries. This “range anxiety” has been a long-standing concern about BEVs but should be diminished by consumers’ gradual understanding of how much range they need, EV models’ ability to meet those needs, and the increased range on the order of 300 miles on a single charge. In addition, educational and firsthand experiences showing how the ranges of modern BEVs easily fit into most consumers’ daily routines and vehicle use patterns can also help relieve some consumer anxiety. As the range of BEVs has increased, the range anxiety that some consumers continue to express is becoming more psychological than real (Franke and Krems, 2013). Moreover, resistance to technologies is often exacerbated when consumers base their perceptions on “stereotypes, rumor, or other indirect, non-experiential, sources” rather their own firsthand experience (Kleijnen et al., 2009, p. 346).
Another consumer barrier is not whether to buy a BEV but when to buy such a product (Ziamou and Veryzer, 2005). As discussed above, products based on new and emerging technologies are particularly subject to this consumer hesitancy on when to purchase (Ram and Sheth, 1989). A rapid pace of technological change causes consumers of the technology to weigh in favor of delaying purchase decisions as the technology rapidly improves (Balcer and Lippman, 1984), so the perception that BEV technology is rapidly improving may cause consumers to wait for better versions of the technology to appear. Two strategies have been identified to address this delayed purchase barrier. The first is to provide the product on a trial basis (Rogers, 2003; Ram, 1987), which in the case of BEVs may be achieved through vehicle leasing. Price reductions through mechanisms such as tax credits may also help overcome consumers’ reluctance to purchase a product at the present time (Kleijnen et al., 2009).
While early adopters represent the initial market for BEVs in the United States today, the success of these vehicles will require such vehicles to become more mainstream.
11.4.2.3 Consumer Responses to Autonomous Vehicles
Connected and automated vehicles (CAVs) also involve a significant technology change that consumers are not familiar with and may resist. The bulk of this discussion applies to fully autonomous vehicles, although consumer barriers to connected and partially autonomous vehicles include issues of trust, particularly pertaining to automatic lane keeping or adaptive cruise control.
The major source of resistance to CAVs is likely to be concern about the safety and physical risks of such technologies. Although CAVs are likely to be deployed only if they are significantly safer than human-driven vehicles, public opinion polls show that many, even the majority of, consumers have concerns about the safety of CAVs that may deter them from adopting such vehicles (AAA, 2019; Hewitt et al., 2019). Consumers often overestimate the risk and danger from unfamiliar, exotic technologies such as artificial intelligence-driven AVs (Kaplan, 2018; Slovic and Peters, 2006). In addition, disproportionate and sensational media coverage of a new technology, including any accident involving a CAV, can induce negative consumer perceptions of new technologies (Kleijnen et al., 2009).
Fears of physical risks can be addressed by providing information that is responsive to consumer concerns—but rather than pushing the information to the consumers, it is better for the information to be made available so that consumers can easily find useful information when they seek it (Kleijnen et al., 2009). CAVs may provide a benefit for fuel economy and GHG emissions, although the extent to which consumers may over- or undervalue those fuel savings is unknown. Public education programs and resources on CAV safety may be needed to overcome consumer fears and resistance to CAVs. One additional factor influencing adoption will be the cost of a CAV, with details regarding price and ownership models still to be seen.
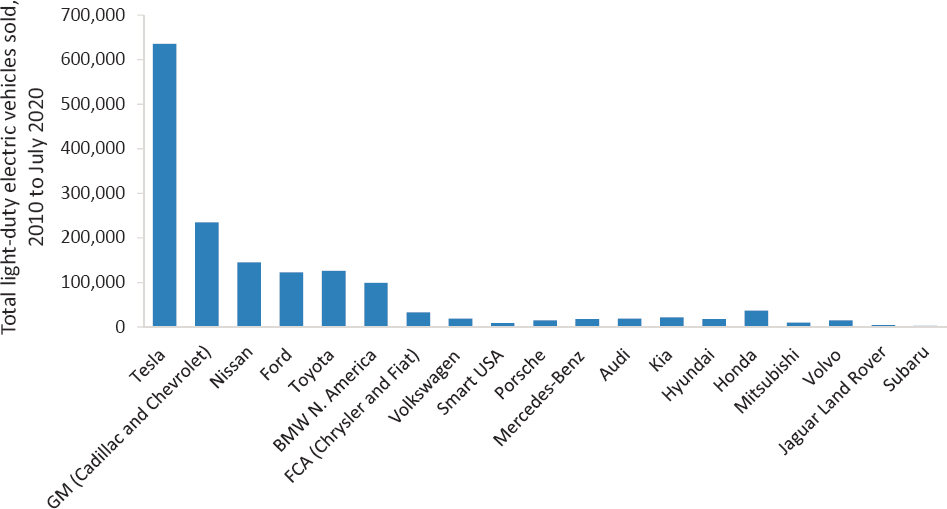
SOURCE: Committee generated, using data from Argonne National Laboratory (2020).
11.5 ROLE OF EV INCENTIVES, IMPACT OF INCENTIVE EXPIRATION, AND WHETHER TO CONTINUE EV INCENTIVES
11.5.1 Rationale of EV Incentives
New technology subsidies like EV incentives12 complement environmental regulations such as CAFE and ZEV and play two major roles—assisting in compliance with these regulations and stimulating technology innovation and transition (Jaffe et al., 2005). EV incentives have contributed to early plug-in electric vehicle (PEV) market development. A National Academies report on barriers to PEV deployment identified vehicle cost as a meaningful barrier to deployment, recommending that the federal government continue vehicle purchase incentives and funding for battery research, as well as invest in research on the relationship between charging infrastructure availability and adoption (TRB and NRC, 2015). Cumulative EV sales by automaker are displayed in Figure 11.6. Depending on how fast the technological and market factors improve, EV incentives, especially purchase subsidies, may continue to be important in assisting with CAFE compliance, if the CAFE regulations for 2025–2035 are designed to depend on large sales shares of PEVs.
11.5.2 Major Types of EV Incentives, Their Roles, and Transition to Focusing on Purchase Incentives
There are two main types of EV incentives: purchase subsidies and operational incentives. Purchase subsidies, such as tax credits, are one-time monetary benefits that are directly perceived by consumers to offset the price of the vehicle and typically paid by the government. Operational incentives are the tangible or intangible benefits repeatedly received by PEV owners during the ownership of the vehicle, typically in forms of access to privileged lanes (e.g., high-occupancy vehicle [HOV] or bus lanes), parking benefits (free, discounted, or preferred parking),
___________________
12 Purchase subsidies in this section refer to policies that directly stimulate monetary benefits to buyers of PEVs. Examples are instant price discount, tax credit, and reduced fees that would have been posed for gasoline vehicle purchase.
charging benefits (free or discounted workplace or public charging), and/or road fee waivers (e.g., waiver of road toll). Hardman (2019) reviewed 41 relevant studies of operational incentives for PEVs. Of the 41 studies reviewed, 23 out of 30 studying HOV access found that HOV lane access (reducing travel time during congestion) has a positive impact on PEV adoption. All 18 studies that investigate the role of charging infrastructure found that availability and improvement of charging infrastructure is correlated with PEV adoption, although the causality direction is less clear. Seven out of 10 studies that analyze road fees found that toll fee waivers correlate with PEV sales, and the remaining 3 could not confirm or exclude the effect (Hardman, 2019). It is difficult to rank operational incentives with respect to their impact on PEV sales, but it seems quite evident that operational incentives are correlated with PEV sales.
11.5.3 Overview of EV Incentives from 2011 to Now
PEV purchase subsidies in the United States mainly include federal tax credit and state incentives. The federal tax credit provides up to $7,500, depending on battery capacity (a proxy for vehicle capability) and number of sales of the manufacturer. Most PHEVs on the market in July 2020 were eligible for $4,000–$4,500 tax credits, and almost all BEVs are eligible for the maximum $7,500. If an automaker’s cumulative PEV sales have reached 200,000 units, its products are ineligible for the tax credit. As of July 2020 (Figure 11.7), Tesla and General Motors (GM) have exceeded this limit, which means that their PEV products will not be eligible for the federal tax credits.13 Nissan, Ford, Toyota, and BMW have 100,000 to 200,000 cumulative PEV sales,14 with 13 other automakers’ cumulative PEV sales still far below 100,000 (AFDC, n.d.a).
State PEV purchase subsidies vary widely. Since the introduction of PEVs to the U.S. market in the late 2010s, some states have provided purchase subsidies for PEVs, ranging from $750 to $6,000 per vehicle. Not all states have provided purchase subsidies, and some have ended their subsidies. The eligible amount can depend on electric range and income, with the specific rules set by each state. The maximum available purchase subsidies by states from 2010 to 2015 are summarized in Figure 11.7. As of July 2020, New Jersey had the largest maximum purchase subsidy of $5,000. The actual amount is $25 per mile of electric range. Colorado, Delaware, and Maryland provided up to $4,000, $3,500, and $3,000, respectively. Massachusetts, Oregon, California, Connecticut, and New York provided up to $2,000–$2,500 per BEV. Purchase subsidies have been generally smaller for PHEVs and greater for fuel cell electric vehicles, if available. Details of these state purchase subsidies can be found on the National Council of State Legislatures website (Hartman and Dowd, 2017) and the DOE Alternative Fuels Data Center (AFDC, n.d.b).
11.5.4 U.S. Purchase Subsidies Compared to Other Global Top Markets
The U.S. PEV purchase subsidies, including both federal and state incentives, are comparable to the top PEV markets around the world. According to Hardman et al. (2017), PEV purchase subsidies around the world exist in four forms—point of sale grant, sales tax and value added tax (VAT) exemptions, post-purchase rebates, and income tax credits. The U.S. federal PEV incentive as previously discussed is the only known example of income tax credits. The U.S. state purchase subsidies are usually in the form of post-purchase rebates.
As shown in Table 11.2, the U.S. maximum eligible amount for the PEV purchase subsidy varies by state, from $7,500 to $10,000. This appears to be more generous than some countries such as Canada or Germany, and less than the amount in the Netherlands and Norway. Although less studied, there is another type of EV purchase incentive in the form of a relative penalty for purchasing a gasoline vehicle. In principle, this kind of incentive can be combined with the “sales tax and VAT exemptions” in Table 11.2 and renamed as “avoided cost,” as these monetary values are not received as revenue by the consumer but as the payment avoided by not buying a conventional ICE vehicle. For example, in some major cities in China, regulations limiting new vehicle registration give
___________________
13 The tax credit will not be totally eliminated; instead, it will be phased out in the quarters following the one during which the 200,000 cumulative PEV sales is reached.
14 BMW’s PEV cumulative sales are 99,017 as of July 2020.
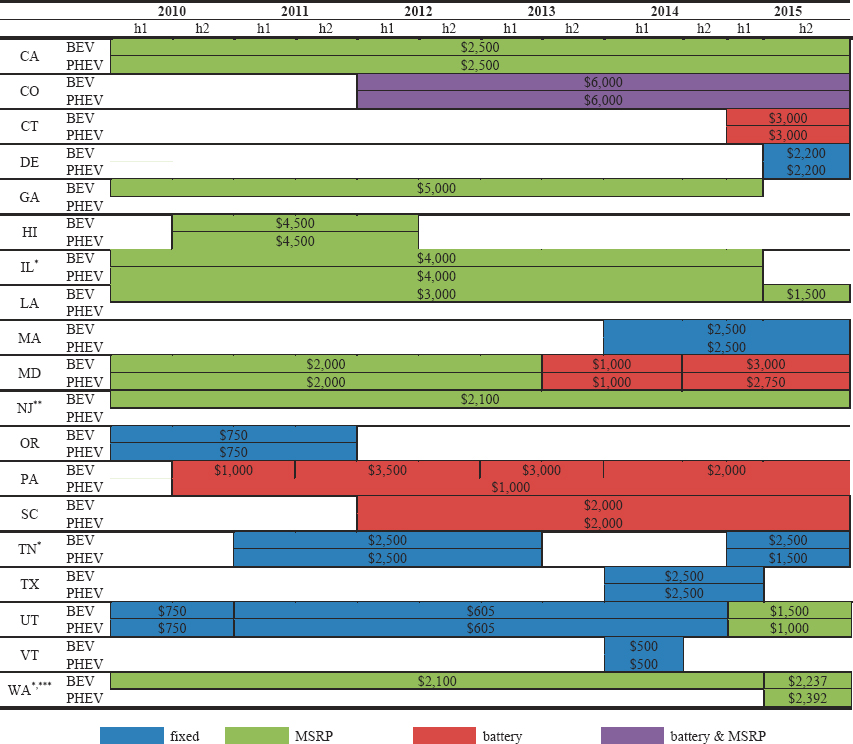
NOTE: *Subsidy for PHEVs applies only to extended range electric vehicles (EREVs). In Tennessee, this was the case for the first round of subsidies (2011h1–2012h2). **Based on an average manufacturer’s suggested retail price (MSRP) of $30,000 for the Nissan Leaf and 7% sales tax. ***Assumes a minimum 7% sales tax (varies by county). For illustration, the BEV amount between 2010h1 and 2015h1 is 7% of $30,000. In 2015h2, the sales tax exemption expanded to include EREVs but restricted eligible vehicles (both BEVs and EREVs) to those valued at less than $35,000. As a result, the only eligible EREV is the Chevrolet Volt. Based on the vehicles that were actually sold in 2015h2, the maximum BEV amount corresponds to a vehicle in the price range of a Kia Soul EV. SOURCE: Wee et al. (2019).
exception to PEVs. Such regulations have created an additional cost of about $13,000 based on the license plate bidding price in Shanghai in 2017. This cost penalty for a gasoline vehicle purchase acts virtually as a purchase incentive for PEVs and is of the same order of magnitude as, and provided in addition to, the combined central and local government purchase subsidies (Ou et al., 2017, 2019). As a result, the value of incentives in Table 11.1 for China should be approximately doubled to account for the PEV purchase subsidies in major cities of China that restricts purchase of conventional ICE vehicles.
11.5.5 Effectiveness of EV Incentives
Studies of EV policies in different countries and regions largely agreed that purchase subsidies are necessary for nurturing the early market for EVs (Hardman et al., 2017; Hao et al., 2014; Lutsey et al., 2018; Zhou et al., 2015). A study in 2016 based on an ex-post stated preference survey of 2,882 PEV owners in 11 states
TABLE 11.2 Purchase Incentives Available for BEVs and Their Values in the Top Global Markets
| Point of Sale Grant | Sales Tax and VAT Exemptions | Post-Purchase Rebates | Income Tax Credits | Value of Incentives (Local Currency) | Value of Incentives (US$) | |
|---|---|---|---|---|---|---|
| Canada | ✓ | CA$5,000–$8,500a | US$3,850–$6,850 | |||
| China | ✓ | ✓ | CN¥65,000 | US$9,800 | ||
| France | ✓ | ✓ | €6,300 | US$1,000–$7,000 | ||
| Germany | ✓ | €5,000 | US$5,500 | |||
| Japan | ✓ | ✓ | JP¥800,000 | US$7,800 | ||
| Netherlands | ✓ | €1,000–€20,000b | US$1,110–$22,000 | |||
| Norway | ✓ | ✓ | 90,000kr | US$11,000–$20,000c | ||
| United Kingdom | ✓ | £4,500 | US$5,800 | |||
| United States | ✓ | ✓ | US$7,500–$10,000d | US$7,500–$10,000d |
a Rebates in Canada are administered at the provincial level, and different incentives are available between provinces.
b These estimates are based on the difference in sales tax paid for a BEV and an ICE vehicle.
c Saving based on 25% VAT Exemption and Purchase Tax.
d Based on the US$7,500 federal tax credit and US$2,500 that is available in California.
NOTE: The value of incentives does not consider other incentives that are available when owning BEVs—for example, free parking or yearly tax exemptions. The table therefore considers only the value of incentives related to the purchase of a BEV. Incentives differ between vehicle sizes, and whether a vehicle older than 13 years old is being scrapped. They also include a 2.4% VAT reduction.
SOURCE: Reprinted from Renewable and Sustainable Energy Reviews, 80, Hardman et al., The effectiveness of financial purchase incentives for battery electric vehicles—A review of the evidence, 1100–1111, Copyright (2017), with permission from Elsevier.
attributes more than 30% of PEV sales to the federal PEV taxi credit (Tal and Nicholas, 2016). The federal tax credit, the California state rebate, and HOV lane access are found to be the most important incentives for PEV purchase (Jenn et al., 2020). A systemic review (published in 2017) of 35 studies on whether purchase subsidies had effectively promoted PEV sales found that availability of purchase incentives and EV sales are correlated, availability of purchase incentives increases EV purchase probability using choice experiments, and incentives are an important factor in the EV purchase decision process based on post purchase surveys (Hardman et al., 2017). Quantitative studies have reached a general agreement, according to Jenn et al. (2020), on the magnitude of EV purchase subsidy effectiveness—$1,000 purchase subsidy resulting in about 2.6% to 4.3% increase in PEV sales (DeShazo et al., 2017; Jenn et al., 2018; Tal and Nicholas, 2016). Another general agreement is that point-of-sale purchase subsidies are more efficient than post-sale rebates (Gallagher and Muehlegger, 2011; De Shazo, 2016).
Some studies recommended phase-down subsidies along with the reduction of battery cost, a logical recommendation based on the theoretical intent of the technology subsidy: to overcome high initial battery costs and increase scale to help lower battery costs. However, this recommendation implicitly relies on two assumptions—that the original level of subsidies is ideal or adequate and that consumers have homogenous willingness to pay for PEVs. If the incentive level is inadequate, it can become more adequate and thus be more effective with reduction of battery cost. In such cases, incentive phase-down should start only after the battery cost decreases to the extent that makes the incentive level adequate. By comparison, U.S. PEV purchase subsidies are not as generous as those in countries with leading PEV sales shares such as China and Norway, while U.S. consumers have been found to have a lower willingness to pay for BEVs than the consumers in China (Helveston et al., 2015). These together suggest that the current PEV purchase subsidies may need to be continued and improved.
U.S. PEV sales have been low except in a few states with complementary state-level policies such as California. The comparison of PEV sales between California and the other parts of the country underscores the importance of PEV purchase subsidies and other incentives for promoting PEV adoption (Li et al., 2017).
Comparing incentives and market aspects among international markets, California, and the rest of the United States shows differences in gasoline prices, charging infrastructure, and ZEV regulations. Gasoline prices are relatively low in the United States as a whole, as compared to California and international markets, possibly an obstacle for PEV sales. The deployment of charging infrastructure in the United States is less aggressive than the PEV sales in leading countries. The United States does not have a national ZEV program that can provide nationwide policy support for PEV sales, unlike the dual-credit policy in China that combines a ZEV mandate and a CAFE program at the national level. All of these factors point to the need for continuing and even strengthening the purchase subsidies, unless the aforementioned factors can be quickly improved for facilitating PEV adoption.
Consumer heterogeneity is another important factor and perspective for redesigning the PEV purchase incentives. A survey study of 14,000 PEV buyers using multinomial logistic regression suggests that incentives are becoming more important when the PEV market progresses beyond early adopters (Jenn et al., 2020). This may be counterintuitive but also important. Willingness to pay for PEVs could be lower with mainstream consumers than with early adopters, which calls for greater incentives according to the optimal incentive design recommendation by DeShazo et al. (2017), unless battery cost reduction accelerates. The actual outcome of incentive phase-out will depend on how fast the PEV technologies will improve and their costs will decrease; how fast charging infrastructure will be developed; and how other policies contribute to forming implicit, indirect, or internal subsidies for PEVs, such as the dual-credit policy in China, the ZEV mandate in California, the CAFE flexibilities for PEVs, and road priority (access to bus lanes and HOV lanes). Nevertheless, the finding that the mainstream consumers may have a lower willingness-to-pay for PEVs and thus more likely need incentives as PEV purchase motivation is important for envisioning the role of purchase incentives for large-volume sales of PEVs in 2025–2035.
11.5.6 Criticism, Skepticism, and Concerns Over EV Incentives Provision or Their Design
Criticisms over PEV incentives can stem from an overall objection to PEVs based on life cycle GHG emissions or loss of gas tax revenues, but a more common concern is related to the policy design of the PEV incentive, purchase subsidies in particular, rather than the provision of incentives. Incentives are viewed as a good motivator to encourage consumer consideration of PEVs and to increase their cost-competitiveness. The objective of a PEV subsidy design is to maximize PEV adoption subject to the consumer’s economic budget constraint (DeShazo et al., 2017), although it is debatable whether PEV sales or electrified vehicle miles traveled (eVMT) should be targeted. One consensus is that the same amount of subsidy should be provided at point of sale to consumers, rather than as post-sale rebates, in order to increase incentive effectiveness or reduce fiscal burdens. Not all PEV shoppers are aware of the purchase subsidies, which potentially inhibits the incentive impact and calls for consumer education. It is also widely accepted that the purchase subsidy should be given to low- or medium-income consumers for consideration of social equity and the better policy effectiveness, as high-income consumers are less price-elastic. In November 2016, California started excluding high-income residents from the $2,500 PEV rebate and adding an additional $2,000 for low-income consumers. The federal PEV tax credit and the other state incentive policies are yet to consider income eligibility. Some studies suggest that the purchase subsidy should give priority to low-end BEVs rather than high-end BEVs (Hardman et al., 2017), but this may be achieved already with consideration of income eligibility. Some suggest prioritizing purchase subsidies for long-range PHEVs, as short-range PHEV users have been found to skip charging and mainly use the vehicle as a hybrid. Electric range of PEVs is correlated with vehicle price and thus the income and price elasticity of the candidate buyers, but also affects the amount of distance traveled on electricity. How to design the subsidy scheme to maximize effectiveness on both PEV sales and eVMT requires sophisticated consideration of consumer heterogeneity and is not yet well studied. Another knowledge gap is the conditions to end the incentives. In principle, the incentives can be ended when the PEV sales have entered the late majority consumers and can be entirely market driven (Hardman et al., 2017). However, there is no clear way to define such conditions, also called a “tipping point,” which could be a concern for lack of a clear exit strategy for government expenditure commitment. Last, purchase subsidies and incentives may not be sufficient to overcome
barriers such as a lack of supporting infrastructure (e.g., charging for EVs), vehicle attributes (e.g., range for EVs), or overall price.
FINDING 11.4: Numerous studies have found that purchase subsidies have effectively increased plug-in hybrid and battery electric vehicle sales. Studies from California have indicated similar benefits from subsidizing fuel cell vehicles. Subsidies available at time of sale are more effective than tax credits or tax deductions owing to their immediacy and because not all car buyers can receive the value from tax credits and deductions. Studies have argued that purchase subsidies should be given to low- or medium-income EV buyers for consideration of both equity and policy effectiveness, as high-income consumers are less sensitive to the subsidy. California has implemented both point-of-sale rebates and income eligibility. The purchase subsidy amount overall in the United States is above the average but not the highest, relative to top zero-emission vehicle markets in the world.
RECOMMENDATION 11.4: The U.S. federal plug-in hybrid, battery electric vehicle, and fuel cell electric vehicle purchase subsidies should be continued beyond the current cumulative sales cutoffs to further increase the size of the market including lower-income, more price-responsive, and probably late-majority consumers.
RECOMMENDATION 11.5: The extended purchase subsidies should be changed into point-of-sale rebates to increase effectiveness. Income eligibility should be considered for both policy equity and effectiveness. The combination of point-of-sale rebates and income eligibility does not necessarily require dealerships to verify consumers’ income. As implemented in California, consumers can apply for the rebate right after buying a plug-in electric vehicle or even before (in San Diego County). The application process includes income verification through the government website. There may be better ways of implementing both point-of-sale rebates and income eligibility. Studies are recommended to optimize which type of plug-in hybrid, battery electric vehicle, and fuel cell electric vehicle and how much electric range should receive more or less subsidy, with considerations of equity and policy effectiveness in promoting sales or electrified vehicle miles traveled.
FINDING 11.5: The federal plug-in electric vehicle (PEV) incentives have expired for only 2 (Tesla and GM) out of 19 manufacturers that are selling PEVs in the United States. This suggests still a large number of PEVs to be sold and be eligible for the subsidy, but it is unclear how soon those 17 players can improve their product competitiveness and catch up on sales, given current overall PEV demand.
FINDING 11.6: Consumer unfamiliarity and misperceptions about the disruptive impacts and performance of battery electric vehicles (BEVs) are a significant impediment to consumer demand for such vehicles. Improved performance of BEVs—in particular, longer range through better batteries—will help to overcome such impediments. Empirical evidence on consumer responses to other technologies and BEV sales in other jurisdictions suggest that better infrastructure, tax credits, and public education campaigns can overcome consumer demand barriers.
RECOMMENDATION 11.6: Battery electric vehicle and fuel cell vehicle sales can contribute to meeting more stringent corporate average fuel economy standards, so governments should seek to stimulate consumer demand for such vehicles through infrastructure investments, purchase subsidies, public education programs (for both consumers and dealerships), and other incentives. Research should be conducted to determine which of these strategies are more cost-effective than the others (and in what contexts).
RECOMMENDATION 11.7: The 2025–2035 corporate average fuel economy standard should be set and designed to depend on and incentivize a significant market share of zero-emission vehicles (plug-in hybrid electric vehicle, battery electric vehicle, and fuel cell electric vehicle).
11.6 REFERENCES
AAA (American Automobile Association). 2019. “Three in Four Americans Remain Afraid of Fully Self-Driving Vehicles.” March 14. https://newsroom.aaa.com/2019/03/americans-fear-self-driving-cars-survey.
AFDC (Alternative Fuels Data Center). n.d.a. “Qualified Plug-In Electric Vehicle (PEV) Tax Credit.” Alternative Fuels Data Center, U.S. Department of Energy Office of Energy Efficiency and Renewable Energy. https://afdc.energy.gov/laws/409.
AFDC. n.d.b. “State Laws and Incentives.” Alternative Fuels Data Center, U.S. Department of Energy Office of Energy Efficiency and Renewable Energy. https://afdc.energy.gov/laws/state.
Allcott, H., and M. Greenstone. 2012. Is there an energy efficiency gap? Journal of Economic Perspectives 26(1): 3–28. https://doi.org/10.1257/jep.26.1.3.
Allcott, H., S. Mullainathan, and D. Taubinsky. 2014. Energy policy with externalities and internalities. Journal of Public Economics 112: 72–88.
Argonne National Laboratory. 2020. “Light Duty Electric Drive Vehicles Monthly Sales Updates.” https://www.anl.gov/es/light-duty-electric-drive-vehicles-monthly-sales-updates.
Balcer, Y., and S.A. Lippman. 1984. Technological expectations and adoption of improved technology. Journal of Economic Theory 34(4):292–318. December.
Bento, A.M., K. Gillingham, M.R. Jacobsen, C.R. Knittel, B. Leard, J. Linn, V. McConnell, et al. 2018. Flawed analyses of U.S. auto fuel economy standards. Science 362(6419):1119–1121. https://doi.org/10.1126/science.aav1458.
BLS (U.S. Bureau of Labor Statistics). 2019. “Consumer Expenditure Surveys: CE Tables.” Table 1110. https://www.bls.gov/cex/2017/combined/decile.pdf.
Busse, M.R., C.R. Knittel, and F. Zettelmeyer. 2013. Are consumers myopic? Evidence from new and used car purchases. American Economic Review 103(1):220–56. DOI: 10.1257/aer.103.1.220.
Camerer, C., G. Loewenstein, and D. Prelec. 2005. Neuroeconomics: How neuroscience can inform economics. Journal of Economic Literature 43(1):9–64. https://doi.org/10.1257/0022051053737843.
Christensen, C.M. 1997. The Innovator’s Dilemma: When New Technologies Cause Great Firms to Fail. Boston, MA: Harvard Business School Press.
Conchar, M.P., G.M. Zinkhan, C. Peters, and S. Olavarrieta. 2004. An integrated framework for the conceptualization of consumers’ perceived-risk processing. Journal of the Academy of Marketing Science 32(4):418–436.
CRSG (Consumer Reports Survey Group). 2017. “2017 Automotive Fuel Economy Survey Report.” provided by Shannon Baker-Brandstetter, Consumers Union, 9/13/2018.
CRSG. 2018. “2018 Automotive Fuel Economy Survey Report.” provided by Shannon Baker-Brandstetter, Consumers Union, 9/13/2018.
Dellavigna, S. 2009. Psychology and economics: Evidence from the field. Journal of Economic Literature 47(2):315–372.
DeShazo, J.R. 2016. Improving incentives for clean vehicle purchases in the United States: Challenges and opportunities. Review of Environmental Economics and Policy 10(1):149–165. December 1.
DeShazo, J.R., T.L. Sheldon, and R.T. Carson. 2017. Designing policy incentives for cleaner technologies: Lessons from California’s plug-in electric vehicle rebate program. Journal of Environmental Economics and Management 84:18–43. July 1.
Dimitropoulos, A., W. Oueslati, and C. Sintek, 2018. The rebound effect in road transport: A meta-analysis of empirical studies. Energy Economics 75:163–179.
EAFO (European Alternative Fuels Observatory). 2020. “AF Market Share New Registrations M1 (2019).” BEV, Norway. https://www.eafo.eu/vehicles-and-fleet/m1#.
EPA (U.S. Environmental Protection Agency). 2019. Greenhouse Gas (GHG) Emission Standards for Light-Duty Vehicles: Manufacturer Performance Report, and excel tables, accessed on 11/22/19 at https://www.epa.gov/automotive-trends/download-data-automotive-trends-report.
EPA. 2020. “EPA Automotive Trends Report: Greenhouse Gas Emissions, Fuel Economy, and Technology Since 1975.” https://nepis.epa.gov/Exe/ZyPDF.cgi?Dockey=P100YVK3.pdf.
Erev, I., E. Ert, O. Plonsky, D. Cohen, and O. Cohen. 2017. From anomalies to forecasts: Toward a descriptive model of decisions under risk, under ambiguity, and from experience. Psychology Review 124(4):369–409.
Ert, E., and I. Erev, 2013. On the descriptive value of loss aversion in decisions under risk: Six clarifications. Judgment and Decision Making 8(3):214–235.
Figenbaum, E., and S. Nordbakke. 2019. Battery Electric Vehicle User Experiences in Norway’s Maturing Market. Institute of Transport Economics, Norwegian Centre for Transport Research Report 11719/2019.
Ford Motor Company. 2020. “Ford Expands Climate Change Goals, Sets Target to Become Carbon Neutral By 2050: Annual Sustainability Report.” Ford Media Center. June 24. https://media.ford.com/content/fordmedia/fna/us/en/news/2020/06/24/ford-expands-climate-change-goals.html.
Franke, T., and J.F. Krems. 2013. Interacting with limited mobility resources: Psychological range levels in electric vehicle use. Transportation Research Part A: Policy and Practice 48:109–122.
Gächter, S., A. Herrmann, and E.J. Johnson. 2007. “Individual-Level Loss Aversion in Riskless and Risky Choices.” Discussion Paper Series. Institute for the Study of Labor, Bonn.
Gallagher, K.S., and E. Muehlegger. 2011. Giving green to get green? Incentives and consumer adoption of hybrid vehicle technology. Journal of Environmental Economics and Management 61(1):1–15. January 1.
General Motors. 2016. “GM Recognized as World Leader for Climate Change Action.” General Motors Green. October 31. https://www.generalmotors.green/product/public/us/en/GMGreen/energy_efficiency.detail.html/content/Pages/news/us/en/gm_green/2016/1031-climate-change-action.html.
Gerarden, T.D., R.G. Newell, R.N. Stavins, and R.C. Stowe. 2015. “An Assessment of the Energy-Efficiency Gap and Its Implications for Climate-Change Policy.” Working Paper 20905. Cambridge, MA: National Bureau of Economic Research.
Gillingham, K., and K. Palmer. 2014. Bridging the energy efficiency gap: Policy insights from economic theory and empirical evidence. Review of Environmental Economics and Policy 8(1):18–38.
Gillingham, K., D. Rapson, and G. Wagner. 2016. The rebound effect and energy efficiency policy. Review of Environmental Economics and Policy 10(1):68–88.
Gillingham, K. 2020. The rebound effect and the proposed rollback of U.S. fuel economy standards. Review of Environmental Economics and Policy 14(1):136–42. https://doi.org/10.1093/reep/rez015.
Greene, D.L. 2010. “How Consumers Value Fuel Economy: A Literature Review.” EPA-420-R-10-008. Washington, DC: Environmental Protection Agency.
Greene, D.L. 2011a. Uncertainty, loss aversion and markets for energy efficiency. Energy Economics 33:608–616.
Greene, D.L. 2011b. What’s greener than a VMT tax? The case for an indexed energy user fee to finance U.S. surface transportation. Transportation Research D: Environment 16:451–458.
Greene, D.L. 2019. Implications of Behavioral Economics for the Costs and Benefits of Fuel Economy Standards. Current Sust./Renew. Energy Reports. https://doi.org/10.1007/s40518-019-00134-4.
Greene, D.L., D.H. Evans, and J. Hiestand. 2013. Survey evidence on the willingness of U.S. consumers to pay for automotive fuel economy. Energy Policy 61:1539–1550.
Greene, D.L., A.J. Khattak, J. Liu, X. Wang, J.L. Hopson, and R. Goeltz. 2017. What is the evidence concerning the gap between on-road and Environmental Protection Agency fuel economy ratings? Transport Policy 53:146–160.
Greene, D., A. Hossain, J. Hofmann, G. Helfand, and R. Beach. 2018. Consumer Willingness to Pay for Vehicle Attributes: What Do We Know? Transportation Research Part A: Policy and Practice 118 (December): 258–79. https://doi.org/10.1016/j.tra.2018.09.013. eene, D.L., C. Sims, and M. Muratori. 2019. “Two Trillion Gallons.” Howard H. Baker, Jr. Center for Public Policy, University of Tennessee, Knoxville.
Gruenspecht, H.K. 1982. Differentiated regulation: The case of auto emissions standards. American Economic Review 72:328–331.
Hamilton, J.D. 2009. Understanding crude oil prices. Energy Journal 30(2):179–206.
Hao, H., X. Ou, J. Du, H. Wang, and M. Ouyang. 2014. China’s electric vehicle subsidy scheme: Rationale and impacts. Energy Policy 73:722–732. October 1.
Hardman, S. 2019. Understanding the impact of reoccurring and non-financial incentives on plug-in electric vehicle adoption—A review. Transportation Research Part A: Policy and Practice 119:1–14.
Hardman, S., A. Chandan, G. Tal, and T. Turrentine. 2017. The effectiveness of financial purchase incentives for battery electric vehicles—A review of the evidence. Renewable and Sustainable Energy Reviews 80:1100–1111.
Hartman, K., and E. Dowd. 2017. “State Efforts to Promote Hybrid and Electric Vehicles.” National Conference of State Legislatures. September 26. https://www.ncsl.org/research/energy/state-electric-vehicle-incentives-state-chart.aspx#hybrid,%20accessed%20on%20Sep%201,%202020.
Helfand, G. and A. Wolverton. 2011. Evaluating the consumer response to fuel economy: A review of the literature. International Review of Environmental and Resource Economics 5(2):103–46. https://doi.org/10.1561/101.00000040.
Helfand, G., M. McWilliams, K. Bolon, L. Reichle, M. Sha, A. Smith, and R. Beach. 2016. Searching for hidden costs: A technology-based approach to the energy efficiency gap in light-duty vehicles. Energy Policy 98(November):590–606. https://doi.org/10.1016/j.enpol.2016.09.014.
Helveston, J.P., Y. Liu, E.M.D. Feit, E. Fuchs, E. Klampfl, and J.J. Michalek. 2015. Will subsidies drive electric vehicle adoption? Measuring consumer preferences in the U.S. and China. Transportation Research Part A: Policy and Practice. 73:96–112. March 1.
Hewitt, C., I. Politis, T. Amanatidis, and A. Sarkar. 2019. “Assessing Public Perception of Self-Driving Cars: The Autonomous Vehicle Acceptance Model.” Microsoft. March. https://www.microsoft.com/en-us/research/uploads/prod/2019/03/assessing-public-perception.pdf.
Hirunyawipada, T., and A.K. Paswan. 2006. Consumer innovativeness and perceived risk: Implications for high technology product adoption. Journal of Consumer Marketing 23(4):182–198.
Honda. 2020. “Honda’s Approach to Climate Change.” Honda Corporate Social Responsibility (blog). December 23. https://csr.honda.com/sub-feature/designing-for-the-environment/.
Hymel, K.M., and K.A. Small. 2015. The rebound effect for automobile travel: Asymmetric response to price changes and novel features of the 2000s. Energy Economics 49:93–103.
IRGC (International Risk Governance Council). 2013. The Rebound Effect: Implications of Consumer Behavior for Robust Energy Policies. Geneva, Switzerland.
Jaffe, A.B., R.G. Newell, and R.N. Stavins. 2005. A tale of two market failures: Technology and environmental policy. Ecological Economics 54:164–174.
Jenn, A., I.M.L. Azevedo, and J.J. Michalek. 2016. Alternative fuel vehicle adoption increases fleet gasoline consumption and greenhouse gas emissions under United States corporate average fuel economy policy and greenhouse gas emissions standards. Environmental Science and Technology 50(5):2165–2174. https://doi.org/10.1021/acs.est.5b02842.
Jenn, A., K. Springel, and A.R. Gopal. 2018. Effectiveness of electric vehicle incentives in the United States. Energy Policy 119(August):349–56. https://doi.org/10.1016/j.enpol.2018.04.065.
Juma, C. 2016. Innovation and Its Enemies: Why People Resist New Technologies. Oxford, UK: Oxford University Press. Kahneman, D. 2011. Thinking Fast and Slow. New York: Farrar, Straus, and Giroux.
Kahneman, D., and A. Tversky. 1979. Prospect theory: An analysis of decision making under risk. Econometrica 47: 263–291.
Kaplan, J. 2018. “Why We Find Self-Driving Cars So Scary.” Wall Street Journal. May 31. https://www.wsj.com/articles/why-we-find-self-driving-cars-so-scary-1527784724.
Kivimaaa, P., and F. Kerna. 2016. Creative destruction or mere niche support? Innovation policy mixes for sustainability transitions. Research Policy 45(1):205–217.
Kleijnen, M., N. Lee, and M. Wetzels. 2009. An exploration of consumer resistance to innovation and its antecedents. Journal of Economic Psychology 30:344–357.
Klier, T., and J. Linn. 2016. Technological change, vehicle characteristics, and the opportunity costs of fuel economy standards. Journal of Public Economics 133:41–63.
Larrick, R.P., and J.B. Soll. 2008. The MPG illusion. Science 320(5883):1593–94. https://doi.org/10.1126/science.1154983.
Leard, B. 2018. Consumer inattention and the demand for vehicle fuel cost savings. Journal of Choice Modeling 29:1–16.
Li, X., P. Chen, and X. Wang. 2017. Impacts of renewables and socioeconomic factors on electric vehicle demands—panel data studies across 14 countries. Energy Policy 109:473–478. October. https://doi.org/10.1016/j.enpol.2017.07.021.
Linn, J. 2016. The rebound effect for passenger vehicles. Energy Journal 37(2):257–288.
Liu, R., Z. Ding, X. Jiang, J. Sun, Y. Jiang, and W. Qiang. 2020. How does experience impact the adoption willingness of battery electric vehicles? The role of psychological factors. Environmental Science and Pollution Research 27(20):25230–25247. https://doi.org/10.1007/s11356-020-08834-w.
Lutsey, N., M. Grant, S. Wappelhorst, and H. Zhou. 2018. Power Play: How Governments Are Spurring the Electric Vehicle Industry. San Francisco, CA: International Council on Clean Transportation.
Marchant, G.E. 2014. Complexity and anticipatory socio-behavioral assessment of government attempts to induce clean technologies. UCLA Law Review 61:1858–1894.
McFadden, D., and K. Train. 2000. Mixed MNL models for discrete response. Journal of Applied Econometrics 15(5):447–470.
Mrkva, K., E.J. Johnson, S. Gächter, and A. Herrmann. 2020. Moderating loss aversion: Loss aversion has moderators, but reports of its death are greatly exaggerated. Journal of Consumer Psychology 30(3):407–28. https://doi.org/10.1002/jcpy.1156.
Nemet, G.F. 2012. Subsidies for new technologies and knowledge spillovers from learning by doing. Journal of Policy Analysis and Management 31(3):601–622.
NHTSA/EPA (National Highway Traffic Safety Administration and U.S. Environmental Protection Agency). 2020. The Safer Affordable Fuel-Efficient (SAFE) Vehicles Rule for 2021-2026 Passenger Cars and Light Trucks. April 30, 2020. https://www.govinfo.gov/content/pkg/FR-2020-04-30/pdf/2020-06967.pdf.
Nissan Motor Corporation. n.d. “Climate Change.” Environmental Activities. https://www.nissan-global.com/EN/ENVIRONMENT/GREENPROGRAM/CLIMATE/.
Novemsky, N., and D. Kahneman. 2005. The boundaries of loss aversion. Journal of Market Research XLII:119–128.
NRC (National Research Council). 1992. Automotive Fuel Economy: How Far Can We Go? Washington, DC: The National Academies Press. https://doi.org/10.17226/1806.
NRC. 2011. Assessment of Fuel Economy Technologies for Light-Duty Vehicles. Washington, DC: The National Academies Press. https://doi.org/10.17226/12924.
NRC. 2013. Transitions to Alternative Vehicles and Fuels. Washington, DC: The National Academies Press. https://doi.org/10.17226/18264.
NRC. 2015. Cost, Effectiveness, and Deployment of Fuel Economy Technologies for Light-Duty Vehicles. Washington, DC: The National Academies Press. https://doi.org/10.17226/21744.
Nuemann, N., and U. Bockenholt. 2014. A meta-analysis of loss aversion in product choice. Journal of Retailing 90(June). https://doi.org/10.1016/j.jretai.2014.02.002.
Ou, S., Z. Lin, Z. Wu, J. Zheng, R. Lyu, S.V. Przesmitzki, and X. Hu. 2017. A Study of China’s Explosive Growth in the Plug-in Electric Vehicle Market. Oak Ridge, TN: Oak Ridge National Laboratory. January.
Ou, S., X. Hao, Z. Lin, H. Wang, J. Bouchard, X. He, S. Przesmitzki, et al. 2019. Light-duty plug-in electric vehicles in China: An overview on the market and its comparisons to the United States. Renewable and Sustainable Energy Reviews 112:747–761. September. https://doi.org/10.1016/j.rser.2019.06.021.
Plumer, B., and N. Popovich. 2020. “Super Bowl Ads Hyped Electric Cars. But Will Anyone Buy Them?” New York Times. February 2, sec. Climate. https://www.nytimes.com/interactive/2020/02/02/climate/super-bowl-ads-electric-car-hummer.html.
Ram, S. 1987. A model of innovation resistance. Advances in Consumer Research 14:208–212.
Ram, S., and J.N. Sheth. 1989. Consumer resistance to innovation: The marketing problem and its solutions. Journal of Consumer Marketing 6(2):5–14.
Rogers, E.M. 2003. Diffusion of Innovations. 5th ed. New York: Free Press.
Sallee, J.M. 2014. Rational inattention and energy efficiency. Journal of Law and Economics 57:781–820.
Schmalfuß, F., K. Mühl, and J.F. Krems. 2017. Direct experience with battery electric vehicles (BEVs) matters when evaluating vehicle attributes, attitude and purchase intention. Transportation Research Part F: Traffic Psychology and Behaviour 46:47–69. April. https://doi.org/10.1016/j.trf.2017.01.004.
Schumpeter, J.A. 1942. Capitalism, Socialism and Democracy. New York: Harper and Brothers.
Slovic, P., and E. Peters. 2006. Risk perception and affect. Current Directions in Psychological Science 15:322.
Small, K.A., and K. Van Dender. 2007. Fuel efficiency and motor vehicle travel: The declining rebound effect. Energy Journal 28(1):25–51.
Sokol-Hessner, P., and R.B. Rutledge. 2019. The psychological and neural basis of loss aversion. Current Directions in Psychological Science 28(1):20–27. https://doi.org/10.1177/0963721418806510.
Sorrell, S., and J. Dimitropoulos. 2007. “UKERC Review of Evidence for the Rebound Effect. Technical Report 2: Econometric Studies.” UKERC/WP/TPA/2007/010. UK Energy Research Centre, Sussex Energy Group, University of Sussex, UK.
Starmer, C. 2000. Developments in non-expected utility theory: The hunt for a descriptive theory of choice under risk. Journal of Economic Literature 38:332–382.
Tal, G., and M. Nicholas. 2016. Exploring the impact of the federal tax credit on the plug-in vehicle market. Transportation Research Record Journal of the Transportation Research Board 2572(1):95–102. January 1.
Thaler, R.H. 2015. Misbehaving: The Making of Behavioral Economics. New York: W.W. Norton and Company.
Tom, S.M., C.R. Fox, C. Trepel, and R.A. Poldrack. 2007. The neural basis of lass aversion in decision-making under risk. Science 315:515–518.
Toyota Motor Company. 2020. “Environmental Initiatives.” Toyota Motor Corporation Official Global Website. https://global.toyota/en/sustainability/esg/environmental/index.html.
TRB and NRC (Transportation Research Board and National Research Council). 2002. Effectiveness and Impact of Corporate Average Fuel Economy (CAFE) Standards. Washington, DC: The National Academies Press. https://doi.org/10.17226/10172.
TRB and NRC. 2015. Overcoming Barriers to Deployment of Plug-in Electric Vehicles. Washington, DC: The National Academies Press. https://doi.org/10.17226/21725.
Trueblood, J.S. 2012. Multialternative context effects obtained using an inference task. Psychonomic Bulletin & Review 19(5):962–68. https://doi.org/10.3758/s13423-012-0288-9.
Trueblood, J.S., S.D. Brown, and A. Heathcote. 2014. The multiattribute linear ballistic accumulator model of context effects in multialternative choice. Psychological Review 121(2):179–205. https://doi.org/10.1037/a0036137.
Turrentine, T.S., and K.S. Kurani. 2007. Car buyers and fuel economy? Energy Policy 35:1213–1223.
Tushman, M.L., and P. Anderson. 1986. Technological discontinuities and organizational environments. Administrative Science Quarterly 31(3):439–465.
Volkswagen Group. 2020. “Climate Change: Nine Facts.” Volkswagen. https://www.volkswagenag.com/en/news/stories/2019/09/nine-facts-on-climate-change.html.
Wali, B., D.L. Greene, A.J. Khattak, and J. Liu. 2018. Analyzing within garage fuel economy gaps to support vehicle purchasing decisions–A copula-based modeling and forecasting approach. Transportation Research Part D 63:186–208.
Wee, S., M. Coffman, and S. LaCroix. 2019. Data on U.S. state-level electric vehicle policies, 2010–2015. Data in Brief 23:103658. April 1.
Zhou, Y., M. Wang, H. Hao, L. Johnson, H. Wang, and H. Hao. 2015. Plug-in electric vehicle market penetration and incentives: A global review. Mitigation and Adaptation Strategies for Global Change 20(5):777–795. June 1.
Ziamou, P., and R.W. Veryzer. 2005. The influence of temporal distance on consumer preferences for technology-based innovations. Journal of Product Innovation and Management 22:336–346.


