
12
Regulatory Structure and Flexibilities
As the U.S. fuel economy program approaches a half-century of accomplishment, it is useful to examine how the premises and context of the program have changed, and how it may need to adapt going forward, especially with its statutory reauthorization authority scheduled to expire in 2030. This chapter considers key elements of the Corporate Average Fuel Economy (CAFE) program, whose effects will be especially meaningful as fuel economy regulation evolves in the context of climate change. Given the scope of this study, the committee focuses on policies affecting passenger vehicles rather than broader policies such as carbon or fuel taxes. This chapter begins by describing the history of U.S. vehicle regulation, followed by a discussion of the test cycles, off-cycle corrections, and discrepancies with real-world fuel economy. As alternative powertrain technologies continue to be adopted, considerations of life cycle environmental impacts and how vehicle policies may affect multiple sectors become especially important, and are described here. Regulatory flexibilities and the credit trading system are then presented, along with the rationale for these flexibilities, a review of credit trading, and how they affect compliance costs and are affected by changes in utilization. The final section of the chapter discusses global issues related to the U.S. program, including several case studies of programs administered by other countries.
12.1 HISTORY OF VEHICLE FUEL ECONOMY REGULATION
As introduced in Chapter 2, vehicle fuel economy regulations began with the passage of the Energy Policy and Conservation Act of 1975 (EPCA), providing the National Highway Traffic Safety Administration (NHTSA) with the ability to regulate manufacturer fleet-averaged fuel economy of light-duty vehicles beginning with MY 1978. The legislation set a goal of 27.5 miles per gallon (MPG) for passenger cars for each vehicle manufacturer, to be met by MY 1985. The key U.S. light-duty vehicle fuel economy and greenhouse gas (GHG) emissions statutes, regulations, and features are summarized in Table 12.1.
Under the EPCA mandate, NHTSA set a standard for light trucks which peaked at 20.5 MPG in 1987. In the late 1980s, Congress relaxed both the passenger car and light truck standards by a few MPG but returned to 27.5 MPG for passenger cars by 1990 and to 20.7 MPG for light trucks by 1996. From 1996 until 2004, standards stayed flat. Light truck efficiency standards were improved to 22.2 MPG between 2005 and 2007, and to 23.5 MPG by 2010. Fuel economy standards as set by NHTSA can be complied with by achieving the appropriate weighted average of tested fuel economy, by paying a fine, and through various credit mechanisms, described further below (EPA/NHTSA, 2012).
TABLE 12.1 Vehicle Fuel Economy and GHG Emissions Statutes, Regulations, and Key Features
| Statutory Mandates | Regulated Periods and Key Regulatory Features |
|---|---|
| Energy Policy and Conservation Act of 1975 (EPCA) EPCA established a federal program to set energy targets for consumer products, including the U.S. Department of Transportation (DOT) regulation of vehicles. The goal was to reduce energy and petroleum consumption. Statutorily required fuel economy of 27.5 MPG by MY 1985. |
Passenger cars 1978–1985: no standard, 27.5 MPG 1986–1989: relaxed standards, 26–26.5 MPG 1990–2010: 27.5 MPG Light trucks 1978–1987: no standard, 20.5 MPG 1988–1993: relaxed standards, 20–20.4 MPG 1994–2010: 20.5–23.5 MPG Major regulatory features
|
| Energy Independence and Security Act of 2007 (EISA) Updated EPCA with the first statutory increase in fuel economy standards since EPCA in 1975. Mandated average of 35 MPG for each manufacturer for the total of the passenger car and light truck fleet by 2020. Then maximum feasible average fuel economy from 2021 to 2030. DOT must issue regulations for at least 1 but not more than 5 MYs. Clean Air Act of (CAA) 1963, Endangerment Finding of 2007 CAA gives the U.S. Environmental Protection Agency (EPA) authority to set standards for any air pollutant which “may reasonably be anticipated to endanger public health.” Supreme Court judgment in Massachusetts v. EPA (2007) led to EPA regulation of GHGs from light-duty vehicles, under the CAA mandate. Clean Air Act of 1963, Section 202, 177 Waiver for California Air Resources Board (CARB) to set higher emissions standards for vehicles. Option for other states to join in the more stringent California standards, which 13 states and District of Columbia did. |
Passenger cars 2012–2016: 33.3–37.8 MPG 2017–2020 (originally 2017–2025 for GHG, 2017–2022 for fuel economy): 3.5%/ year 2017–2021, 5%/year 2022–2025 Light trucks 2008–2010, unreformed optional footprint-based standard: 22.4–23.4 MPG 2011: 24.3 MPG 2012–2016: 25.3–28.8 MPG 2017–2020 (originally 2017–2025 for GHG, 2017–2022 for fuel economy): 3.5%/year 2017–2021, 5%/year 2022–2025 Major regulatory features
|
| EPCA, EISA, and CAA, withdrawal of California waiver |
Passenger cars 2021–2026: 1.5%/year increase Light trucks 2021–2026: 1.5%/year increase Major regulatory features
|
NOTE: Years reported in model year (MY).
With the passage of the Energy Independence and Security Act of 2007 (EISA), NHTSA established regulations that maintained vehicle performance while raising fuel economy of light-duty vehicles to a minimum of 35 MPG by 2020 and to “maximum feasible average fuel economy” from 2021 to 2030 (110th Congress, 2007). Beginning in model year (MY) 2008, the structure of the fuel economy standards changed. The first change was to use vehicle footprint as an attribute to adjust the standard requirements, implemented for the light truck standards optionally from 2008 to 2010 and required from 2011. Previously, manufacturers had to comply with one sales-weighted average fuel economy for passenger cars and one sales-weighted average fuel economy for light trucks. Under the footprint standards beginning in 2008 for light trucks and 2012 for passenger cars, the required fuel economy target for a manufacturer was weighted not only on its sales of passenger cars and light trucks but also on the sales-weighted average footprint of the vehicles it sold in a given model year.
The Massachusetts v. EPA Supreme Court ruling determined that carbon dioxide (CO2) and other GHGs from motor vehicles must be regulated under Section 202 of the Clean Air Act (CAA; United States Code, 1990). Following from this ruling, California was enabled to request a waiver to regulate such emissions under CAA Section 209. With EISA and motor vehicle GHG emissions falling under the CAA, the MY 2012–2016 and MY 2017–2025 single standards were produced by NHTSA, the U.S. Environmental Protection Agency (EPA), and the California Air Resources Board (CARB). The new standards were structured around a footprint-based requirement and attempted to harmonize standards for fuel economy under the EISA mandate with GHG emissions standards under the CAA. These differed from the original CAFE structure, which had three groups of domestic passenger cars, imported passenger cars, and light trucks (Lattanzio et al., 2020). The national program standards included increased flexibilities in trading and banking of credits earned for overcompliance with the CAFE standards. There were credits for dual-fueled vehicles such as electricity and 85% ethanol blends, and in the GHG program, for improved refrigerants and for use of advanced technologies, such as electrification. It should be noted that NHTSA cannot consider alternative-fueled vehicles. The national program standards through MY 2018 reached an average of 25.1 MPG, with 29.9 MPG for passenger cars and 21.9 MPG for light trucks (EPA, 2019). These values were projected to reach 56 MPG for passenger cars and 40.3 MPG for light trucks by MY 2025, presenting an average fuel economy value of 49.6 MPG (EPA/NHTSA, 2012). EPA undertook a mid-term evaluation of the light-duty GHG standards for 2022–2025, with the proposed determination finding that automakers had outperformed the standards for the first 4 years of the program (MY 2012–2015) and that automakers were poised to meet the standards at lower costs than were previously estimated, in addition to the consumer and environmental benefits provided. However, in 2018, the EPA Mid-Term Evaluation Final Determination concluded that the MY 2022–2025 emissions standards were not appropriate and were in need of revision (EPA Press Office, 2020), prompting the development of the Safer Affordable Fuel Efficient (SAFE) Vehicles Final Rule. As noted in Chapter 2, the SAFE Rule results in lower fuel economy and emissions standards for MY 2021–2026 than previous regulations, with a projected 40.4 MPG required fuel economy in 2026, compared with 46.7 MPG previously (NHTSA, 2020).
U.S. automakers have typically expressed a preference for consistent and predictable regulations, given long product planning cycles (MacDuffie and Orts, 2019). Additionally, automakers do not want to create different vehicle models for different markets (Temple, 2019), making consistent regulations across markets desirable.
12.2 MEASURING FUEL ECONOMY AND GHG EMISSIONS
12.2.1 Discrepancies with Real-World Fuel Consumption
It has long been recognized that the combined city and highway test cycle estimates on which compliance with fuel economy and GHG standards are based are neither accurate nor unbiased estimates of what is achieved in actual vehicle use (McNutt et al., 1978). After extensive analysis of real-world data, the EPA proposed adjustment factors in 1984 that lowered the combined estimates by about 15%, on average (Hellman and Murrell, 1984). The adjusted MPG estimates were used to provide approximately unbiased fuel economy information to the public on window stickers, gas mileage guides, distribution to the media, and websites.
The problem of accuracy for individual drivers remained; as the vehicle labels say, “Actual results will vary for many reasons. . . .” For consumers, the chief limitation of existing fuel economy information is inaccuracy not bias. Analysis of almost 75,000 MPG estimates by individual motorists found that the variability around the label MPG estimates was substantial: root-mean-square errors of 21% for gasoline vehicles, 16% for hybrids, and 14% for diesels (Greene et al., 2017). In addition, the same data indicate that deviations from the label estimates are only weakly correlated among vehicles owned by the same household, suggesting that the variability decreases the usefulness of label estimates for comparing makes and models (Wali et al., 2018).
Given that changes in driving behavior, traffic conditions, and vehicle technologies could potentially increase the divergence between the combined cycle ratings and average real-world fuel economy, the EPA again revised adjustment factors in 2008 (EPA, 2006). The EPA revised its methodology again in 2017 to adapt to changes in vehicle technologies (EPA, 2017a). The relationship between combined cycle and label fuel economy is illustrated in Figure 12.1. A recent analysis of a large but self-selected database of on-road fuel economy collected by the website fueleconomy.gov suggests that the original 1984 correction factors may still be valid, but this cannot be known for certain without a statistically rigorous sample design and validity checks (Greene et al., 2017).
Technological advances have the potential to greatly reduce the cost and improve the accuracy of survey-based fuel economy information. Most vehicles now monitor their own fuel consumption and can report fuel economy estimates to the driver, log estimates in the onboard vehicle diagnostic, or even send them back to the manufacturer via an internal internet connection. There are issues with the accuracy of onboard estimates, but they are relatively small and solvable (e.g., Posada and German, 2013). GHG standards adopted in 2019 require the European Commission to monitor the real-world fuel and electricity use of light-duty vehicles and prevent the real-world emissions gap from growing, with some studies of options being carried out (e.g., Dornoff, 2019). Similar studies for the United States could help formulate a cost-effective plan for meeting a variety of needs for real-world fuel economy and GHG emissions data. One example is CARB’s pilot study using onboard diagnostic and global positioning system data to assess vehicle emissions (CARB, 2020).
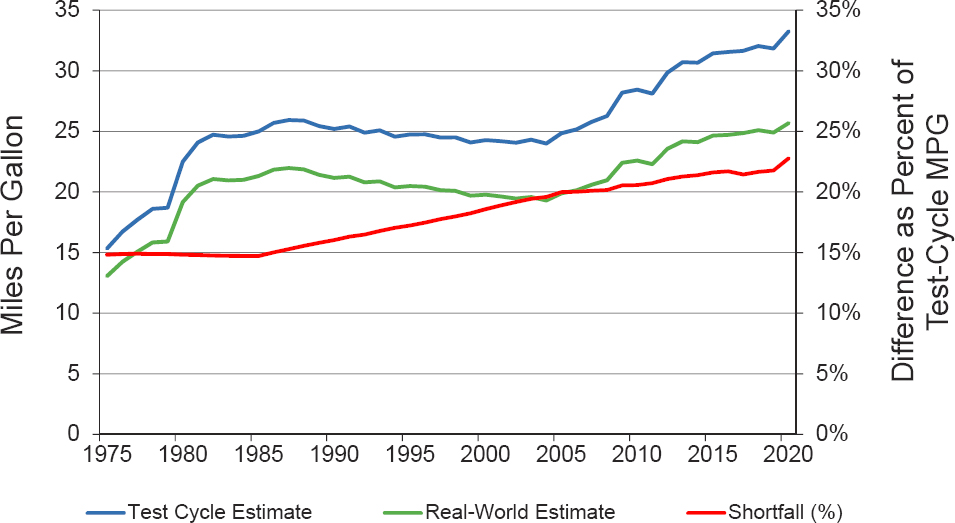
SOURCE: Committee generated using data from EPA (2020).
Given the magnitude of costs and benefits, a modest expenditure on real-world outcomes to validate fuel savings is called for. Given the importance of consumer choices for the direct and indirect consequences of the programs, research to develop more accurate fuel economy information for individual consumers seems appropriate. Traditionally, crediting has been based on test cycle, per the law governing the U.S. Department of Transportation (DOT) fuel economy standards. However, vehicles currently being produced/sold in the U.S. market can record fuel consumption over specific periods of time, which provides the capabilities for verifying performance and could enable a shift from the test cycle-based approach of estimating emissions to an approach of directly measuring emissions.
FINDING 12.1: There have been substantial improvements in onboard technology, allowing vehicle performance to be monitored and providing data that can be used to validate performance assumptions.
RECOMMENDATION 12.1: The agencies should undertake a large-scale data collection process, possibly in collaboration with automakers, which measures, records, and reports the real-world fuel economy of vehicles to evaluate fuel consumption and emissions reductions caused by certain off-cycle technologies. The agencies should consider a transition to using on-road fuel consumption and emissions data to adjust future crediting with the standards.
12.2.2 Test Cycles and Off-Cycle Corrections
The procedure of the two-cycle test for measuring vehicle fuel economy is described in Chapter 2 (Section 2.4). The test cycles, codified for fuel economy in EPCA 1975, were designed to measure fuel consumption while the vehicle operated a given speed versus time on a dynamometer. They were based on test cycles originally developed to measure vehicle tailpipe emissions. A comprehensive description of the Federal Test Procedure for city and highway driving is available in Kühlwein et al. (2014).
The regulations include an off-cycle credit program to account for technologies that improve the fuel efficiency and GHG emissions of a vehicle in real-world driving conditions but are not able to be measured in the test cycle conditions. For example, if vehicles have higher efficiency exterior lights, these can result in some fuel efficiency and GHG benefits on the road, but because lights are not turned on during the test-cycle, they would not be accounted for in the tests. To recognize the benefits of these types of technologies and incentivize automakers to adopt them, the agencies provide the ability for manufacturers to earn off-cycle credits for relevant technologies. Additionally, automakers can apply for additional off-cycle credits for other technologies if they present sufficient supporting data, which are evaluated by the agencies. EPA allows manufacturers to provide data justifying off-cycle credits either using the 5-cycle tests, or by using their own test procedure that is approved by EPA and subject to public comment. In 2012, EPA streamlined the off-cycle crediting process by preapproving credits in 13 technology areas. EPA converts approved credits to corresponding fuel consumption credits for NHTSA.
Provided that off-cycle credits are assigned accurate values representing real-world benefits of the technologies in terms of reducing fuel consumption and GHG emissions, they offer a mechanism of correcting for the inability of the test conditions to simulate real-world operation. However, in practice it is difficult to accurately estimate the real-world benefit, or verify whether the fuel consumption and GHG reductions assigned by the credits are realized on the road. The benefits of several off-cycle technologies such as solar/thermal control and active climate-controlled seats depend on human behavior to realize fuel consumption and GHG benefits. For example, actively cooled seats reduce fuel consumption by more effectively cooling the driver or passengers such that they would operate the air conditioning less or on a lower setting. These effects of human behavior are not easy to examine in test settings, and it is unclear if the manufacturers’ estimated effects accurately represent real-world behavior. Currently, the evidence manufacturers present to the agencies is often not described in enough detail so that it is clear how the test procedures were conducted. Furthermore, the submission of off-cycle applications, and the agencies’ approval process, is done on an ad-hoc basis. It is not clear what the agencies’
criteria are for approval, creating an environment where automakers are developing detailed requests for how to change off-cycle crediting.
FINDING 12.2: Provided that off-cycle credits are assigned accurate values that represent the actual real-world benefits of the technologies in terms of reducing fuel consumption and greenhouse gas (GHG) emissions, they offer a mechanism of correcting for the inability of the test conditions to simulate real-world operation. However, in practice it is difficult to accurately estimate the real-world benefit, or verify whether the fuel consumption and GHG reductions assigned by the credits are realized on the road. Furthermore, the submission of off-cycle applications, and the agencies’ approval process, is often done on an ad-hoc basis.
FINDING 12.3: Telemetric technologies exist that would allow agencies to collect fuel consumption and emissions data from vehicles on the road.
12.2.3 Emerging Technologies and Test Cycles
12.2.3.1 Crediting Promoting New Technologies
In the GHG regulations, flex-fuel and alternative fuel vehicles receive credits based on their potential to lower emissions in the long run. However, crediting likely raises emissions in the short term by effectively weakening the standard that manufacturers must attain. Over crediting may foster other social goals like promoting new technologies.
Electric and fuel cell vehicles are overcredited in two ways. First is that upstream emissions from electricity or hydrogen generation are not counted. Second is the multiplier, which counts each vehicle as more than one. Since these vehicles have emission rates below standard (partly because of the first type of over crediting), the multiplier effectively weakens the GHG standards. Jenn et al. (2016) show that these over crediting provisions raise emissions substantially. These provisions also mean that any other policy promoting these vehicles will raise emissions. For example, a federal tax credit for EVs increases sales of those vehicles, effectively loosening the standards and raising emissions.
The provisions could reduce emissions in the long term if they successfully boost near-term market shares, and if these higher market shares reduce market failures associated with new technology. For example, there may be spillovers in learning across firms in electric vehicle (EV) production. These spillovers would cause firms to underinvest in producing EVs. Boosting EV sales via over crediting could generate spillovers, reducing costs in the long term. In turn, lower costs could enable agencies to set tighter GHG standards in the future, reducing emissions in the long term.
This argument for over crediting may be valid in theory, but there are a few open questions. First, whether the trade-off between short-term and long-term emissions benefits society depends on the magnitude of market failures, and the committee is not aware of research assessing whether the market failures are sufficiently important (Linn and McConnell, 2019).
Second, there is not a strong argument for using the GHG standards to boost EV market shares rather than being technology neutral. Standards may not be the most economically efficient means through which to resolve market failures. That being said, to the extent that market failures would cause market shares under neutral standards to be lower than optimal, federal and state governments can subsidize them and use other policies to boost market shares. Some of the market failures, such as network externalities for charging infrastructure, likely vary at local levels, making local and state governments an appropriate level for policy. Eliminating over crediting would prevent perverse outcomes where states attempting to reduce emissions in the short term may actually increase U.S. emissions.
12.2.3.2 Battery Electric Vehicles
Calculations of EV range differ depending on the test cycle procedure used (Pike, 2012). The extent of the difference between test miles per gallon of gasoline-equivalent (MPGe) and real MPGe (and the resulting electric
range calculated) influences whether a different test cycle procedure should be considered for battery electric vehicles (BEVs). Currently, most EVs use an EPA test cycle adjustment where values are adjusted by 0.7 to derive fuel economy label estimates reflecting real-world performance (Good, 2017). The effects of real-world use on BEV performance and exposure to weather are not captured as part of the test cycle. As described in Chapter 5, BEV efficiency and aging patterns depend on their use and on climate. In colder climates, extra energy is used for battery warm-up (Hu et al., 2020) and range will be negatively affected. The EPA test procedures drive each cycle several times until the battery is depleted. By this time (particularly for >250 mile range packs), the pack will be thermally equilibrated, so the average electricity consumption over time will disguise the MPGe one gets for short trips. In particular, short commuting trips and limited access to overnight parking with plug-in capability (allowing for slow charging and thermal maintenance) will be an important factor in colder climates. Similar efficiency and aging issues in addition to safety-related issues will need to be addressed for hot-weather use of BEVs, although EPA testing can modify the MPGe testing to do a hot/cold soak in between every cycle to check the discrepancy. Additionally, electric and fuel cell vehicles are also differently impacted by congestion than internal combustion engine (ICE) vehicles, as they are found to perform proportionally better in congestion, compared to free-flow conditions (Bigazzi and Clifton, 2015).
12.2.3.3 Fuel Cell Vehicles
As with BEVs, fuel cell electric vehicles (FCEVs) face performance challenges in cold climates, which would affect vehicle performance. As noted in Chapter 6, proton-exchange membrane fuel cells produce water as a by-product, and the fuel cell membrane must be properly hydrated for efficient ionic conduction and operation. At very high temperatures, water may evaporate, and the membrane may dry out, leading to degradation in performance. However, at sub-freezing temperatures, water in the pores of the membrane, catalyst, and gas diffusion layers may freeze. This can obstruct the flow of air (oxygen) and hydrogen, causing a decrease in power generation. Ice expansion can also lead to membrane electrode assembly (MEA) degradation, particularly over many freeze-thaw cycles. During normal operation, the heat generated by the fuel cell prevents the MEA components from freezing; however, control strategies are required during shutdown and start-up of FCEVs to prevent damage and enable quick start-up in sub-freezing climates. The details of control strategies implemented by automakers are proprietary; however, a number of reports have indicated their success. Fuel cell and vehicle manufacturers have developed successful strategies to mitigate the effects of sub-freezing temperatures on FCEV performance and prevent damage to the fuel cell over the short term. What is not clear in the public literature is the impact on fuel cell durability and performance of many freeze-thaw cycles that occur over a long period of time and the impacts of climate control and cold start strategies on FCEV fuel economy and range. However, researchers continue to study these issues—cold-start impacts (Gaoi et al., 2019; Wan et al., 2014), effects of freezing on fuel cell durability (Macauley et al., 2016), and climate effects on drive cycle and fuel economy (Henning et al., 2019; Lee et al., 2019).
12.2.3.4 Connected and Automated Vehicles
Connected and automated vehicles (CAVs) are not subject to substantial regulation at the federal level. As discussed in Chapter 7, in principle CAV technologies could be eligible for earning off-cycle credits; however, doing so would require effective documentation of the fuel savings that result from CAV technologies. Additionally, while many of the potential energy-saving benefits of CAVs would be undocumented on the test cycle, some CAV technologies could negatively influence fuel economy as measured on the test through drag or energy demands for CAV devices. These considerations present the need to think about how CAVs would integrate into the test cycle procedure and fuel economy standards. In the most recent guidance issued by the National Science and Technology Council and U.S. DOT, tests to study the performance of advanced driver assistance systems and automated driving systems performed by EPA are discussed in the context of informing fuel economy regulations with high-quality information (NSTC/DOT, 2020). In 2017, Senate legislation was introduced that would have established (among other committees) an expert panel on transportation and the environment that included fuel
consumption in its scope (Canis, 2020). However, outside of these mentions, government discussion of how CAVs may be treated in fuel economy regulations has been limited.
12.2.4 Policies Affecting Passenger Vehicles
Other policy types can affect crediting, compliance, benefits, and costs of standards in complex ways. To explain how these policies interact with one another, it is helpful to distinguish between quantity- and price-based policies.
A quantity-based policy targets a quantity such as the level or rate of emissions. For example, a cap-and-trade program fixes the quantity of emissions that are permitted over a certain period of time. The fuel economy and GHG standards are quantity-based policies that determine the rate of fuel consumption or emissions per mile traveled.
In contrast, a price-based policy affects the cost of emissions or the cost of using a technology that depends on its emissions. For example, a carbon tax imposes a cost of emitting carbon. A subsidy for constructing new wind or solar generators is also a price-based policy because it reduces the cost of those investments. Note that market-based quantity policies introduce a price on emissions, such as the emissions credit price in a cap-and-trade program, but the distinction between quantity- and price-based policies depends on whether the policy targets the quantity or price of emissions.
A price-based policy that affects consumer demand for vehicles will also affect the compliance costs of the standards. For example, given the fuel economy and GHG standards, introducing a carbon tax on transportation fuels raises the cost of driving vehicles in proportion to their emissions. The tax reduces demand for vehicles with high emissions and raises demand for vehicles with low emissions, reducing the societal costs of achieving a particular emissions objective.
Likewise, price-based policies for EVs reduce the costs of the standards, including policies that reduce the cost or raise the benefit of having an EV, such as permitting access to HOV lanes, to the extent that they affect consumer demand for EVs. Information campaigns that increase demand for EVs have similar effects on the costs of the emissions standards.
Scrappage programs, such as Cash-for-Clunkers, that subsidize scrapping older vehicles and incentivize purchases of low-emitting new vehicles would reduce the costs associated with meeting fuel economy standards. Such programs would not affect the average emissions rate of new vehicles, but they would likely reduce economy-wide emissions by hastening the turnover of the vehicle. In short, any price-based policy that raises demand for low-emitting vehicles reduces the cost of achieving the standards.
The situation is more complex with quantity-based policies that affect new vehicles. A policy that affects only vehicles that are covered by the standards does not affect total emissions of new vehicles but does reduce the incremental costs of the standards. This is the situation with the zero-emission vehicle (ZEV) policy, which could mandate a combined market share of BEVs, plug-in hybrid electric vehicles (PHEVs), or FCEVs. (Strictly speaking, because of a ZEV crediting system, the program does not fix a market share of ZEVs, but this was ignored for expositional reasons. Accounting for the crediting provisions does not affect the main conclusions). Compared to a hypothetical case in which there are federal standards and no ZEV program, adding ZEVs does not affect the overall national emissions rate of new vehicles (again, putting aside the over crediting in the national programs), as long as the national program remains binding. Mandating a particular technology, such as ZEV, increases costs relative to a purely (non-zero-emissions) performance-based standard. If the federal programs contain a uniform set of standards across the car and truck classes and do not restrict trading across firms or classes, the total cost of ZEV and the federal programs exceeds the cost of the federal programs without this program. This is because the federal program without ZEV would be cost effective, minimizing the cost of achieving the standard (putting aside long-run technology considerations discussed above). Consequently, since market shares and technology choices would differ when ZEV is layered on top of the standards, costs per ton of emissions reduction must be higher than with federal standards only. Note that the existence of ZEV appears to reduce the estimated costs of fuel economy and GHG standards because the agencies estimate the incremental costs of their policies, assuming other policies are included in the baseline scenario considered. It should also be noted that ZEV and price-based policies, while they do not influence emissions in the contemporaneous CAFE regime, could lead to tighter standards in the next regime because of their ability to reduce compliance costs.
Policy making to promote ZEV sales and speed the retirement of older, higher-emitting vehicles may raise the possibility of establishing accelerated scrappage programs. These programs could increase the removal of older vehicles from the fleet, providing progress toward emissions reductions goals. However, the impact of accelerated scrappage programs on emissions reduction, used car markets, shift in travel to other vehicles and other modes, and equity between new and used car buyers is not well understood. Before an accelerated scrappage policy were to be implemented, further study would be required to analyze the ideal policy design of such a program.
RECOMMENDATION 12.2: Because the effectiveness and impacts of an accelerated scrappage program are not well understood, the U.S. Environmental Protection Agency, in conjunction with the U.S. Department of Energy and U.S. Department of Transportation, should study the effectiveness of accelerated scrappage programs at emissions reduction, increasing zero-emission vehicle sales, and addressing equity considerations. Such a scrappage study could assess factors including which vehicles should qualify for the program, the impact of altering vehicle age mix on vehicle miles traveled, the shift of travel to other vehicles and modes from the scrapped vehicles, and the impact on the used vehicle market and on travel in used vehicles, especially for lower-income vehicle buyers and users. The cost and effectiveness of accelerated scrappage programs should be compared to other means of reducing greenhouse gas emissions from the light-duty vehicle sector.
12.2.5 Policies Affecting Other Sectors
Federal standards and policies may affect multiple sectors. Regulations pertaining to EV emissions may relate to the electricity sector, for example. Emissions reduction is one of the three primary goals of the CAFE/GHG regulations. When considering all three goals of fuel consumption, energy, and emissions reduction, there are other policies that relate to and influence the light-duty sector’s impact on these goals. Notably, if deep GHG emissions reduction is a goal, then there will need to be consideration of not only onboard vehicle emissions but also the emissions from related sectors, like electricity (for vehicle charging) and manufacturing (of vehicles and their materials and components). This motivates the need for life cycle thinking.
12.2.5.1 Background on Vehicle Life Cycle
The life cycle of a vehicle encompasses the creation of its materials, the assembly process, use of the vehicle, and disposal and recycling at its end of life. The life cycle energy or environmental impacts are the total of these impacts from each of these stages. Typical systems boundaries for vehicle life cycle assessments and what processes are included in their system boundaries are depicted in Figure 12.2. The well-to-wheels life cycle for a vehicle encompasses stages from resource extraction through onboard vehicle energy use. The well-to-tank life cycle encompasses resource extraction through the distribution of energy carriers but does not include vehicle use.
Life cycle thinking becomes particularly important when considering the total fuel consumption and environmental impacts from different vehicle types, especially when some do not directly combust or emit themselves. In the 1990s, California among other states set regulations to attain 2% ZEV sales by 1998. At the time, EVs were constructed with lead acid batteries, and when comparing the life cycle environmental impacts of an electric car using a lead acid battery with those from a conventional automobile, the ZEV resulted in 60 times more lead releases per km of vehicle use than a conventional car using leaded gasoline (Lave et al., 1995). CARB did not follow through with this early ZEV mandate, influenced in part by life cycle studies (Matthews et al., 2014).
For ICE vehicles, the majority of a vehicle’s environmental impacts are created during the use phase of its life cycle. For example, a life cycle assessment of a Volkswagen Golf VII (assumed to be driven 200,000 km) found the use phase comprising 79% of total GHG emissions, compared with 20% of the total coming from vehicle production, and 1% from end-of-life impacts (Broch et al., 2015). This finding indicates that the GHG emissions from fuel production, transportation, and combustion from driving 200,000 km outnumber those from manufacturing, assembling, and end of life for vehicle components by nearly a factor of four. However, the breakdown of life cycle emissions is very different for an EV, whose manufacturing phase emissions exceed those of conventional
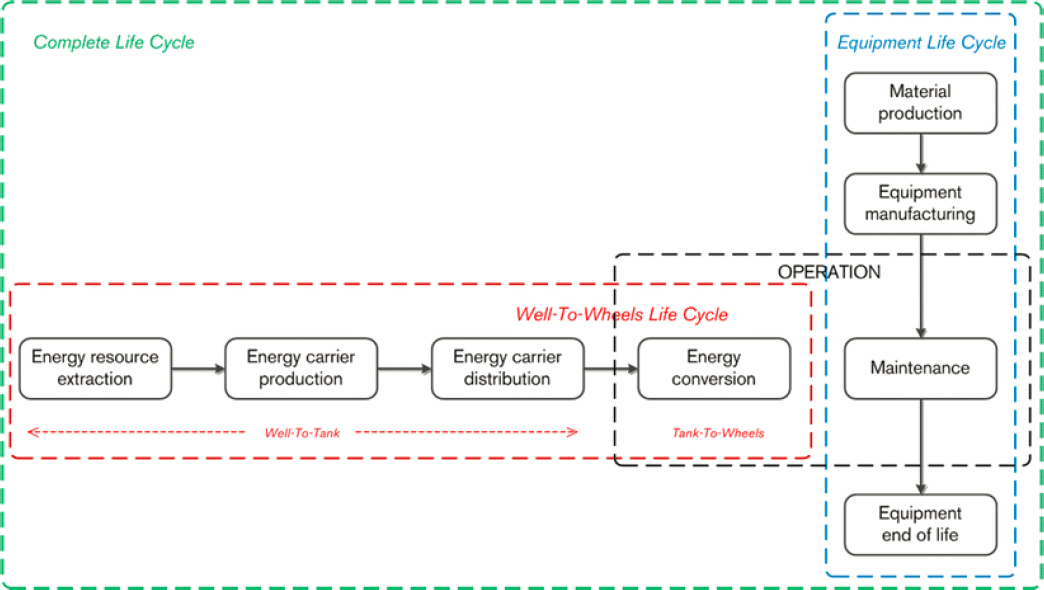
SOURCE: Nordelöf et al. (2014).
vehicles owing to battery production (although often with lower total life cycle emissions, owing to the use phase) (Hall and Lutsey, 2018).
With emissions from fuel combustion typically creating the large majority of a vehicle’s life cycle burdens, the composition of a vehicle’s fuel takes on an important role. Policies like the Renewable Fuels Standard draw on life cycle comparisons of fuel GHG emissions, with EPA’s approved fuel pathways requiring life cycle GHG reductions in substitute fuels ranging from 20% for ethanol derived from corn starch to a 60% reduction for cellulosic biofuel, when compared with a 2005 petroleum baseline, excluding older facilities grandfathered into the program (EPA, 2017b). Regulating fuels can provide meaningful GHG emissions reductions, with an analysis of California’s Low Carbon Fuel Standards finding them resulting in a 10% reduction in CO2 in California’s transportation sector (Huseynov and Palma, 2018). This standard also treats electricity as fuel, with the discussion of different fuels’ emissions presented in Chapter 10.
The regulatory accounting for use-phase energy and environmental impacts from vehicles without direct combustion during use is more complex. A review of life cycle assessments of BEVs finds them to be often more energy efficient and less polluting than conventional vehicles, and their GHG emissions are highly sensitive to the carbon-intensity of the electricity mix (Helmers and Weiss, 2017). In the SAFE Rule, there is an extension of EPA assigning EVs 0 grams of upstream emissions per mile through MY 2026 (NHTSA/EPA, 2020), excluding the burdens from electricity used to power the vehicle. This assumption will be revisited beginning for MY 2027. For PHEVs and BEVs, NHTSA applies a petroleum equivalency factor to the measured electrical consumption to determine the gasoline equivalent fuel economy for operation on electricity, although with an incentive only counting 15% of the energy consumed as electricity.1 The extent
___________________
1 The petroleum equivalency factor is derived from physics, and this 15% is based on a carryover of identical incentives for all alternative fuels from E-85, without any physical meaning except for E-85 vehicles.
to which automakers should or should not be held accountable for emissions attributable to the electricity grid mix remains a contentious topic.
With vehicle use driving the bulk of a vehicle’s environmental impacts, lightweighting presents a potential means for reducing the amount of fuel consumed per mile driven, with an extensive discussion present in Chapter 7. However, the manufacturing of materials to attain vehicle lightweighting does influence the life cycle impacts of the vehicle. For example, an analysis comparing lightweighting using high strength steel or aluminum found that the impacts varied notably depending on the location of aluminum production and whether secondary (recycled) aluminum could be used (Kim et al., 2010). While this analysis found the vehicle’s use-phase to still contribute 87%–95% of life cycle GHG emissions, the choice of lightweighting material did still matter, with it taking longer for use-phase emissions reductions to offset the added manufacturing emissions for aluminum than for high strength steel. The SAFE Rule does not account for upstream materials production emissions, citing the complexity of processes involved and in providing comparisons across materials (NHTSA/EPA, 2020). Automakers have sustainability goals, which often include reducing manufacturing emissions. Twelve green design principles have been proposed to guide applications of lightweighting and attain environmental improvements, including resolving technical, economic, and environmental performance trade-offs while maintaining vehicle safety; sourcing abundant and low-impact materials; and designing for material recovery, among others (Lewis et al., 2019). In general, effective recycling programs for vehicle components could decrease life cycle energy and environmental burdens.
The SAFE Rule’s Final Environmental Impact Statement reviews the relevant life cycle assessment literature, concluding that most efficiency-increasing technologies would decrease GHG emissions, energy use, and other environmental impacts on a life cycle basis (NHTSA/EPA, 2020). Uncertainty related to the upstream production is noted, with its potential to reduce environmental improvements attained. Regulations pertaining to upstream and connected sectors will have implications for vehicle life cycle emissions, with the electric sector and EVs being a prominent and timely example.
12.2.5.2 Scenarios of GHG Regulation for the Electricity Sector
As EVs become a more prominent element of the fleet, the emissions-intensity of the electricity sector will have a larger influence on light-duty vehicle emissions. Given recent history of GHG regulation from the electricity sector, several cases are considered. The simplest would be a binding cap on national GHG emissions from the electricity sector. In this case, charging an EV has no effect on electricity sector emissions because any increase in fossil-fuel fired generation caused by the charging would be offset by an equivalent decrease in emissions somewhere else in the electricity system, leaving total electricity sector emissions unchanged. In other words, the cap determines total emissions, and an increase in consumption caused by charging an EV cannot affect total emissions. Consequently, if there is a national, binding cap on electricity sector emissions, EPA should consider EVs to have zero emissions for crediting purposes (and likewise for the electric portion of a PHEV). A similar argument would pertain to a binding national cap on multiple sectors including electricity.
The second case is a regional cap on emissions, such as the Regional Greenhouse Gas Initiative or AB 32. In the context of an electricity sector cap, emissions leakage refers to a situation in which pricing emissions from one region cause electricity generation to increase in other unregulated regions because the cap raises the cost of generating electricity inside the region, relative to the cost outside the region. As long as there is transmission connecting the two regions, electricity generation could increase outside the region, causing an increase in emissions. For example, AB 32 covers California but not Arizona, and California often imports electricity generated in Arizona. Capping emissions in California raises the cost of fossil fuel-fired generation in California relative to Arizona, which could increase fossil fuel-fired generation in Arizona and imports from Arizona to California. This would cause total emissions across California and Arizona to increase, compared to a hypothetical in which there is no transmission between the two states. In other words, the cap is attained by shifting emissions from California to Arizona, which does not reduce aggregate emissions.
With a regional cap, if one ignores emissions leakage outside of the program, charging EVs in the region does not affect total emissions for the same reason as with a national cap. In that case, EVs charged in that region should be considered zero-emission vehicles for crediting purposes. In principle, EPA could allow for emissions
leakage in its crediting calculations based on scenario analysis of electricity sector models or a review of the literature on emissions leakage.
The final case is a regional or national electricity emissions rate standard, rather than a cap. For example, the Clean Power Plan (CPP) and Affordable Clean Energy (ACE) rule set GHG emissions rates for certain fossil fuel-fired generators. If the standard includes all generators (which it could have with the CPP but not ACE), then the emissions from an EV equal the amount of electricity consumed in charging multiplied by the emissions rate set by the standard.
Well-to-wheels and the equipment lifetime emissions can also be addressed through regulations that do not pertain to light-duty vehicle fuel economy. For example, certain fuels may be used in a variety of sectors, so attaining emissions reductions via a fuels-based light-duty vehicle standard may not be the most straightforward or effective method.
12.3 REGULATORY FLEXIBILITIES
12.3.1 Credit Trading System
Both the CAFE and GHG regulations allow manufacturers to earn credits for exceeding the standards, transfer credits within their firm, carry credits forward and backward within specific time windows, trade credits with other firms, and use credits to comply with the standards. Rules and penalties differ between the two regulations, and credits earned under one regulatory regime may not be used in another. Further background on the historical regulations and current CAFE and GHG targets is provided in Chapter 2.
The objective of the credit systems is to improve the regulations’ economic efficiency and to reduce the chances of severe harm to any manufacturer. Banking and borrowing credits makes it easier for manufacturers to deal with shocks such as changes in fuel prices, and to achieve a more-uniform marginal cost of compliance over time. In the global automotive market, many fuel economy technologies are available to all manufacturers. However, some technologies are proprietary to a particular manufacturer, and others are patented, which can increase their cost to competing manufacturers. Firms may also differ with respect to their internal expertise or assessment of the technological prospects or market acceptance of different strategies. Firms serving different market segments may also find that their customers’ preferences for fuel economy, technological solutions, or other vehicle attributes differ. Because vehicle design decisions must be made years in advance and manufacturers’ expectations may differ, some strategies for meeting standards may prove to be more successful than others. For all these reasons, the costs of meeting CAFE and GHG standards may vary from one manufacturer to another.
When manufacturers face different costs of compliance, credit trading can enable firms with higher costs to purchase credits from firms with lower costs at favorable prices. Credit trading thereby allows firms to meet the standards at lower costs than would be possible if every manufacturer were individually required to meet the standards. NHTSA CAFE credits (or deficits) are calculated as 10 times the difference between the manufacturer’s sales-weighted harmonic mean fuel economy (MPG) and its regulatory requirement, multiplied by the number of vehicles sold in the model year in question. Because there are separate car and truck standards, car and truck credits are earned separately.2 Because the credits are defined in terms of fuel economy, the car and truck credits are not equivalent in terms of expected fuel savings or GHG emissions. Credits traded between car and truck fleets must be adjusted to approximate equivalence in terms of expected gallons of fuel saved. The amount of credits that can be transferred from one category to another is capped at 2 MPG from 2018 on (He, 2014). The EPA GHG standards, on the other hand, are calculated as the expected difference in CO2 emissions over a vehicle’s lifetime, meaning these credits can be accurately directly traded between car and truck fleets.
According to (49 CFR 536.6), CAFE credits earned before 2008 could be carried forward for only 3 years. EPA credits GHG emissions and NHTSA credits fuel economy, but fuel economy credits can be traded across vehicles after converting to fuel consumption. In the CAFE program, firms can pay a penalty for non-compliance
___________________
2 A manufacturer’s sales-weighted harmonic mean fuel economy is equal to the inverse of the sales-weighted arithmetic average of rates of fuel consumption.
TABLE 12.2 Comparison of Credit Provisions under NHTSA and EPA Programs
| Regulation | NHTSA CAFE Program | EPA GHG Program |
|---|---|---|
| Definition of a credit | 1/10 MPG above manufacturer’s required MPG standard for fleet. | 1 Mg of CO2 below the manufacturer’s required standard.a |
| Credit banking (carry forward) | 5-year banking period. | From 2009 to 2011, companies banked credits through the Early Crediting Program; 5-year banking period, with the exception that credits earned between 2010 and 2016 can be carried forward through 2021. |
| Credit borrowing (carry back) | 3-year carry back period. | 3-year carry back period. |
| Limits on manufacturers’ credit transfers between car and truck fleets | Limits on creditsb that can be transferred between cars and trucks: MY 2011–2013, 1.0 MPG MY 2014–2017, 1.5 MPG MY 2018 on, 2.0 MPG |
No limits on transfers between cars and trucks in each manufacturer’s fleet. |
| Monetary cost of noncompliance | Fee of $5.50/tenth mile over standard, per vehicle; starting 2019, $14/tenth mile over standard. | Unknown penalty, but could be as high as $37,500 per car for violation of the CAA. |
| Provisions for alternative fuel vehicles | Credits for ethanol and methanol in fuels are being reduced. For electric vehicles, electricity use is converted to equivalent gallons of gasoline and only 15% of that is counted for compliance. | Allows manufacturers to count each alternative fuel vehicle as more than a single vehicle. Multipliers range from 2.0 to 1.3, depending on the extent of alternative fuel used and the MY. Emissions from battery electric vehicles assumed to be zero. |
| Exemptions | No exemptions for manufacturers with limited product lines; fines can be paid. | Temporary Lead-Time Allowance Alternative Standards for manufacturers with limited product lines through 2015. |
a Vehicle and fleet average compliance for EPA’s GHG program is based on a combination of CO2, hydrocarbons, and carbon monoxide emissions, which are the carbon containing exhaust constituents. These GHG emissions are referred to here as CO2 emissions for shorthand.
b There are also some restrictions by NHTSA on transfers and trades between imported and domestically produced car fleets and truck fleets. SOURCE: Leard and McConnell (2017).
of $55 per vehicle per MPG. Non-compliance with the GHG standards puts the firm in violation of the CAA, and applicable fines are assessed in court on a case-by-case basis. For example, in 2014 Hyundai-Kia paid a penalty of $100 million for violating the CAA and emitting an estimated excess of 4.75 million metric tons CO2-equivalents from their MY 2012–2013 vehicle fleets (EPA, 2014). Under the CAA, EPA also has the authority to revoke a non-complying manufacturer’s ability to continue to sell vehicles in the United States.
The value of fuel economy and GHG credits may differ because of the different penalties for non-compliance with the two standards. The fine for failure to meet the CAFE standards (49 CFR § 578.6(h)) was initially set at $5 per 0.1 MPG per vehicle and was raised in 1997 to $5.50 per 0.1 MPG per vehicle (62 Fed. Reg. 5167). Authority to do so was given by the Debt Collection Improvement Act of 1996 (P.L. 104-134 Sec. 31001). This fine was increased to $14 per 0.1 MPG as directed by the Federal Civil Penalties Inflation Adjustment Act Improvements Act of 2015 (P.L. 114-74 Sec. 701), which requires fines to be adjusted for inflation (Laing, 2018), but then later reduced to $5.50, although this remains in litigation at the time of writing (81 Fed. Reg. 43524; modified by 81 Fed. Reg. 95489).
The key differences between the CAFE and GHG credit provisions are summarized in Table 12.2.
12.3.2 Rationales for Flexibilities and Trading
The crediting system allows manufacturers to average the emissions rates and fuel economy across their vehicles. Consequently, each vehicle sold by a manufacturer does not have to achieve its particular requirement, and the manufacturer can sell vehicles that fall short of their requirement as long as the manufacturer sells a sufficient number of vehicles that exceed their respective requirement or else the manufacturer obtains sufficient
credits by other means (e.g., purchasing from another firm). Firms can transfer credits across car and truck fleets, and under the CAFE program, firms can transfer credits to increase fuel economy up to 2 MPG. There is no limit on credit transfers in the EPA program.
This section considers how the agencies could implement a uniform standard that applies across cars and light trucks, where the term “uniform” is used to mean that a vehicle’s fuel economy requirement depends only on its footprint and not on its class. NHTSA has argued that the law prevents it from considering compliance credits when setting standards, and therefore it cannot set uniform standards across cars and light trucks. NHTSA uses a computational model to estimate costs and benefits of particular levels of standards, and the agency uses the modeling results to help choose levels of standards. If NHTSA were to allow cross-class credit trading when it models the standards, the agency would estimate lower costs for any level of standards, compared to modeling costs without cross-class trading. Consequently, the agency could justify more stringent standards by including cross-class credit trading when determining the level of the standards. In contrast with NHTSA, there does not appear to be anything in the statutes preventing EPA from setting a uniform standard and allowing unlimited credit trading across classes, which would be cost effective.
Compliance flexibility reduces the overall cost of achieving a particular fuel economy or GHG emissions rate target, compared to a hypothetical policy in which each vehicle has to achieve its particular standard. Marginal abatement costs—the change to the manufacturer in cost per unit of emissions or fuel consumption reduction—may vary across the vehicles a manufacturer sells. For example, suppose a manufacturer specializes in large cars and sport utility vehicles (SUVs), and that the cost of adding fuel-saving technology is higher for the SUVs than for the large cars—either because the cost of installing the technologies is higher or because consumers of the SUVs are less willing to pay for fuel economy improvements than consumers of its mid size cars. In this hypothetical, the manufacturer can offer a fuel economy in the large cars that exceeds the fuel economy requirement for those cars and can offer a fuel economy for the SUVs that falls short of the requirement for the SUVs. This compliance strategy would be less costly than choosing fuel economy of both vehicle types that exactly equal the respective requirements, because in that case the manufacturer would have to add extra technology to the SUV, which is relatively expensive.
Aside from offering flexibility to average across a manufacturer’s vehicles to determine overall compliance with the standards, the standards have required lower emissions and fuel consumption rates for cars than for light trucks. The rationale appears to be that technology costs vary across classes and that trucks often have different uses. For example, pickup trucks and SUVs may be used for towing heavy loads or off-roading capabilities.
However, this argument is faulty, particularly for EPA (which does not impose restrictions on credit trading across classes), and it places too much burden on regulatory agencies to estimate the costs of reducing emissions and fuel consumption across the two classes. As explained here, setting separate standards raises the costs of meeting standards compared to setting uniform standards across the two classes.
Consider a hypothetical regulator that knows the marginal abatement costs of each vehicle. The regulator would minimize the cost of achieving a given emissions reduction by setting standards to equate marginal abatement costs across vehicles. This is true because if the regulator did not equalize marginal costs, it could always adjust standards to reduce total costs. For example, suppose the regulator sets the standard such that the marginal cost of raising fuel economy is higher for light trucks than for cars. The regulator could reduce the total cost of compliance by weakening light truck standards and tightening car standards. Therefore, if the regulator is setting standards separately for cars and light trucks, and if marginal costs are expected to be higher for light trucks than for cars, the regulator would impose weaker standards on light trucks than cars (in this case, weaker means a lower fuel economy and higher GHG emissions rate conditional on footprint). Of course, it should be noted that a single set of standards would harm some manufacturers and help others.
Although EPA and NHTSA have a lot of information about technology costs and performance, they do not have perfect foresight, and their predictions of costs may turn out to be inaccurate. In that case, setting standards based on expectations will cause realized marginal costs to be unequal across vehicles. Hence, with incomplete information, setting different standards across vehicles is not cost effective.
Cost effectiveness is only achieved if there are uniform standards with unlimited trading; allowing one but not the other would raise compliance costs. With unlimited trading across classes, a firm could minimize compliance costs by equalizing marginal costs across vehicles. For example, if EPA and NHTSA set standards for future
model years and costs turn out to be higher for light trucks than for cars, the firm could over-comply for cars and under-comply for trucks, transferring the excess credits for cars to its trucks. Such overcompliance would not be allowed without credit trading across classes. Likewise, restrictions on the amount of credit trading a firm can use, as currently exist in the NHTSA program, raise compliance costs.
The recent fluctuations in gasoline prices—such as the 25% decrease that occurred in March and April 2020 owing to COVID-19—illustrate the importance of setting uniform standards and allowing unlimited trading. Low gas prices generally reduce demand for fuel economy and raise compliance costs, and probably by different amounts across vehicles (Leard et al., 2019). Standards finalized in 2020 were set based on gas price projections from 2019. If actual gas prices turn out to differ from those expected prices, actual compliance costs will differ from expectations. Consequently, if agencies had tried to equate marginal costs across vehicles when they finalized the standards, those standards would likely not be cost effective. If low gas prices persist past 2020, unlimited trading across firms and classes would allow manufacturers to minimize compliance costs given the realized lower gasoline prices. That is, unlimited trading gives manufacturers the flexibility to respond to unexpected changes in market conditions.
To be cost effective, marginal costs would have to be equated not just across vehicles within a firm but also across firms. Trading credits across firms could equalize marginal costs, as low-cost firms over-comply and sell to high-cost firms. But as shown below, credit trading has been fairly limited, and it is unlikely that marginal costs are equal across firms.
In principle, the agencies could use the fact that there has been limited trading to justify standards that vary across classes. The argument would be that because cross-firm trading does not equalize marginal costs across firms, the agencies could at least reduce variation in marginal costs across firms by equating marginal costs across classes. This would be a crude approach to trying to equalize costs across firms, because although it might reduce variation across firms, it would increase variation across classes. Another way to reduce the variation in marginal costs across firms would be to include a cost containment mechanism—sometimes called a safety valve—which would be similar conceptually to features of many cap-and-trade programs and renewable portfolio standards. Under this approach, a firm with high compliance costs could purchase credits from EPA at a specified price.
FINDING 12.4: Compared to setting separate fuel economy and greenhouse gas standards for cars and light trucks, a single standard across cars and light trucks would reduce the total societal costs of achieving a particular level of fuel consumption or emissions, if cross-class trading is included. Equivalently, a single standard would cause greater fuel consumption and emissions reductions than separate standards that have the same cost as the single standard.
12.3.3 Review of Credit Trading to Date
12.3.3.1 Data on Fuel Economy Trading
NHTSA (2019) publishes an annual Credit Status Report listing the number of positive or negative credits for each manufacturer by three categories: (1) domestic passenger cars, (2) imported passenger cars, and (3) light trucks. At the time of writing, the most recent year data were available is 2017. An estimate of credits earned by MPG performance only from 2008 to 2012 can be calculated from NHTSA’s Manufacturer Performance Report. NHTSA does not report credit trades between manufacturers, nor does it report the prices of credits traded. NHTSA CAFE reports also provide manufacturer CAFE numbers with and without the credits earned by selling dual and flex fueled vehicles. These allow some inferences to be made about credit trades and transfers by a manufacturer but, in general, do not allow complete estimation of trades and transfers.
From 2008 to 2011, the industry accumulated credits at an annual rate of 35–40 million per year. Manufacturers with deficits reduced the net credits earned by 1.6%, 0.9%, 1.2%, and 7.4% in 2008, 2009, 2010, and 2011, respectively.
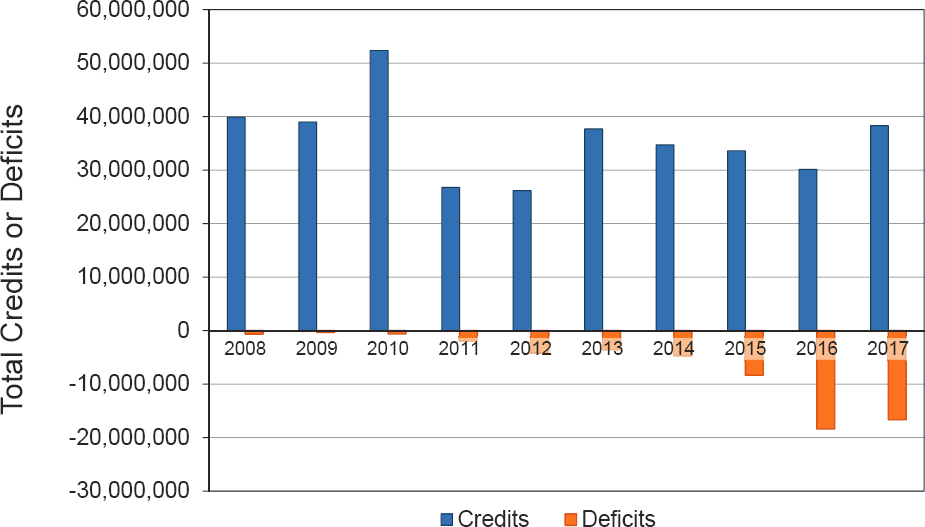
SOURCE: Committee generated using data from NHTSA (2019).
The number of manufacturers with annual deficits increased after 2008, and total deficits grew to 61% of earned credits in 2016 followed by 44% in 2017 (Figure 12.3). Possible explanations for the increase in deficits include the sudden drop in gasoline prices of approximately $1 per gallon in 2015, the increasing stringency of the standards, and the expiration of 75 million credits earned in 2009 at the end of 2014.
12.3.3.2 Data on GHG Trading
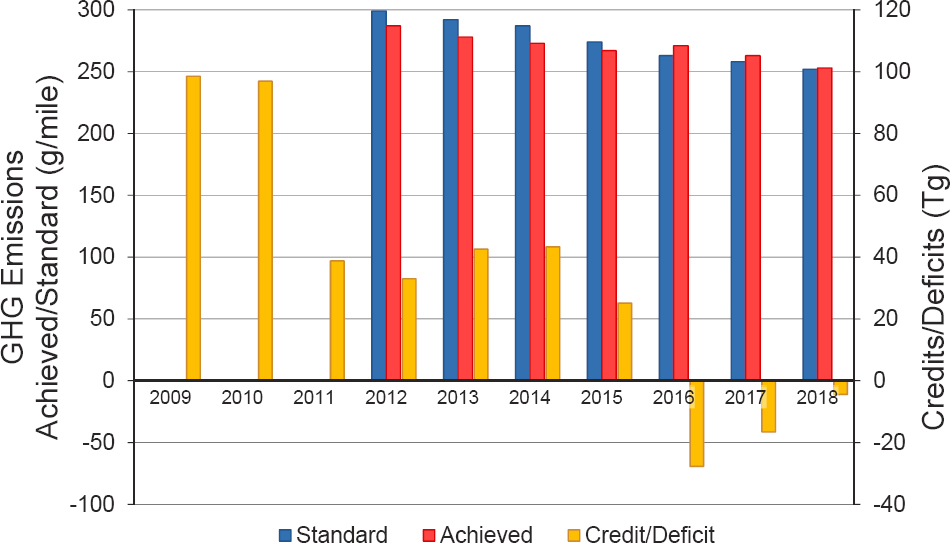
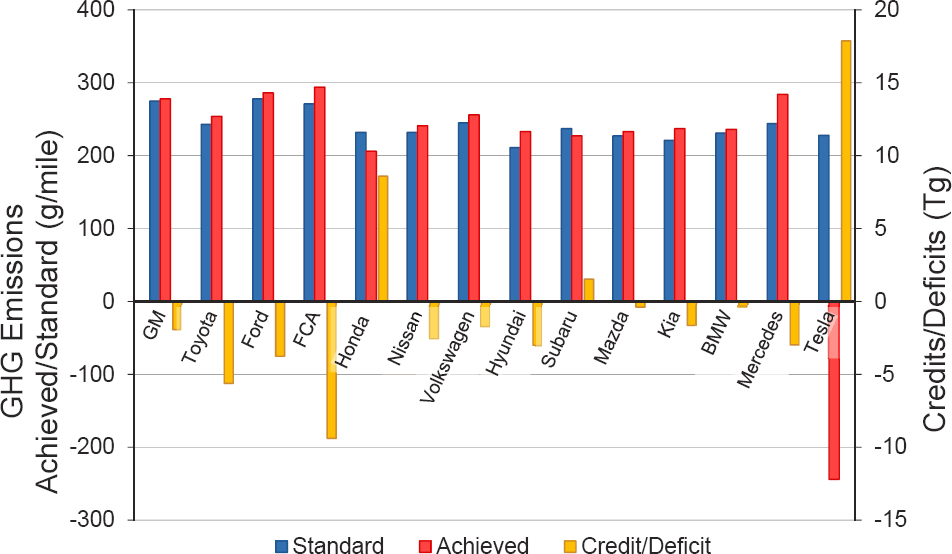
EPA publishes data on GHG credits and credit sales and purchases in annual performance reports for manufacturers (EPA, 2020), as well as a substantial amount of related data. Compliance numbers (achieved MPG) are reported by manufacturer, vehicle class, and model year. Figure 12.4 shows the industry average GHG emissions (blue bars) and standard (green bars) for 2009–2018. EPA reports that in 2014 74,843,471 (76%) of the 98,520,511 early credits earned in 2009 expired unused. All credits earned between 2010 and 2016 expire in 2021; all credits earned in subsequent years expire after 5 years.
Although the industry’s net deficit decreased from 2016 to 2018, all but five manufacturers experienced deficits in 2018, and the great majority of credits (91%) were earned by just two manufacturers: Tesla and Honda. The manufacturers shown in Figure 12.5 are arranged from left to right in order of sales volume and account for 99% of 2018 sales.
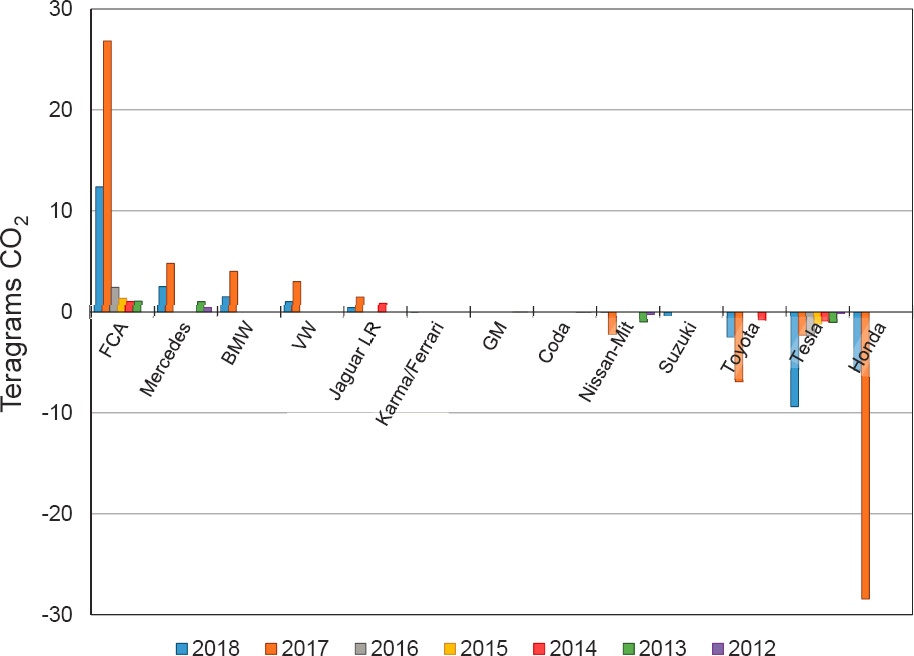
EPA reported credit sales and purchases by manufacturers from 2010 to 2015, but has reported only cumulative purchases and sales by manufacturer at year end since 2015. The data reveal a very thin market for trades between 2010 and 2015 (Figure 12.6). In 2015, only one trade for MY 2017 was reported, for Fiat Chrysler Automobiles (FCA). From 2012 to 2015, less than 1% of the credit balance existing in any given year was traded. In 2018, 7.1% of the existing credit balance was traded, but FCA alone accounted for 71% of credits purchased. They were the dominant buyer and Honda the dominant seller. Although the published EPA data provide sales and purchases,
SOURCE: Committee generated using data from EPA (2020).
SOURCE: Committee generated using data from EPA (2020).
SOURCE: Committee generated using data from EPA Automotive Trends Reports and Manufacturer Performance Reports.
they do not include bilateral trades or prices paid. Over 2012–2018, nine manufacturers did not buy or sell GHG credits, including Ford, Hyundai/Kia, Mazda, Mitsubishi, Subaru, and Volvo. Figure 12.6 shows only the manufacturers that actually bought or sold credits.
Forty-eight Teragrams (Tg) of CO2 credits were traded in 2017, a substantial increase over the 12.7 Tg traded in 2016. However, 76 Tg of credits were allowed to expire. Toyota allowed 29.7 Tg of credits to expire, while 14.1 Tg of Honda’s credits expired—58% of total expired credits in MY 2017. Overall, the industry had a credit deficit of 18 Tg CO2 in MY 2017.
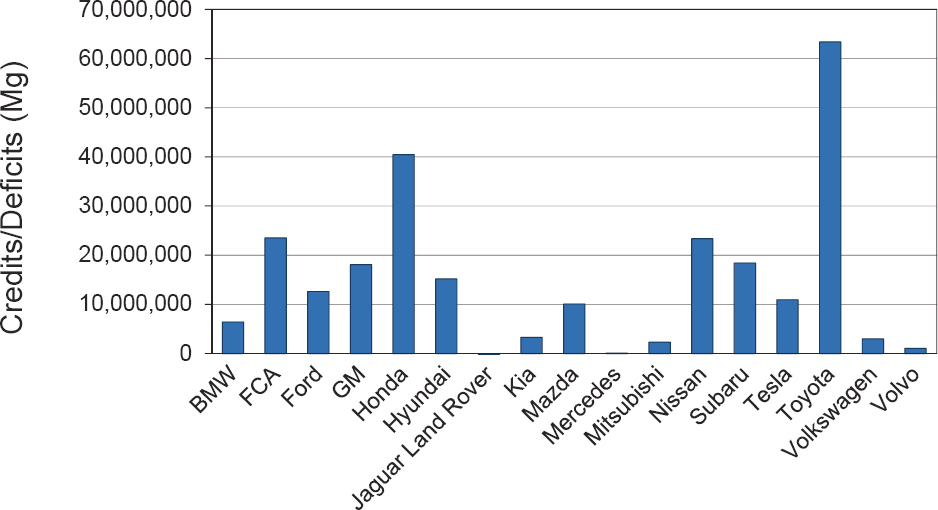
The largest credit balance is held by Toyota, with credits of more than 60 million tons of CO2 banked at the end of MY 2017 (Figure 12.7). Although Tesla has earned a large number of credits through its sales of EVs, it had sold most of the credits it had earned by the end of 2018.
12.3.3.3 Credit Prices
Leard and McConnell (2017) used SEC filings by Tesla to estimate the price of GHG credits in 2012 and 2013. They divided the reported proceeds from the sales by the quantity of credits Tesla traded. They estimated prices of $36 per credit in 2012 and $63 per credit in 2013 (2014$). They also used the results of a 2014 settlement between the U.S. government and Hyundai/Kia to derive a credit price estimate. The settlement required the firm to forego 4.75 million GHG credits that the EPA estimated to be worth in excess of $200 million, resulting in an estimated credit price of $42 (2014$). The NHTSA fine is $5.50 per extra
SOURCE: Committee generated using data from EPA (2020).
0.1 MPG exceeded, recently reduced from $14. Given the very small number of trades, these estimates should be interpreted with caution.
FINDING 12.5: Credit trades are not transparent (i.e., prices not observed), which makes evaluation of manufacturer compliance costs more difficult.
RECOMMENDATION 12.3: The National Highway Traffic Safety Administration should publicly report credit trade quantities and prices between manufacturers. This reporting would increase transparency and provide useful information for economic analysis of the regulations.
12.3.4 Effect of Credit Trading on Compliance Costs
Several studies have estimated that the flexible use of credits provides substantial benefits to manufacturers. Using simulation modeling and the CAFE standards for 2001 as the base case, Kiso (2017) estimated that CAFE credit trading lowered the total cost of compliance by $110–$140 million. Liu et al. (2014) used optimization modeling to estimate the effects of air conditioning and flex fuel vehicle credits and banking of credits on the shadow price of compliance with GHG standards from 2011 to 2020. They found that removing the ability to use air conditioning and flex fuel vehicle credits induced non-zero shadow prices in years in which the standards were otherwise not binding and increased shadow prices by 75% to 133% in years in which the standards were binding in their base case (e.g., from $12.60 to $29.40 in year 2019; 2007$). Rubin et al. (2009) estimated the benefits to manufacturers of credit transfers across vehicle classes within a firm and credit trading among firms. Recognizing the relatively small number of firms that would participate in a credit trading market, they assumed an imperfect market characterized by oligopoly and oligopsony. Assuming perfectly competitive credit markets, they found that allowing within firm transfer of credits among vehicle classes reduced the average cost of compliance by 7%–10%, depending on assumptions about the cost of fuel economy technology, gasoline prices, and consumer payback periods. Adding inter-firm trading reduced costs by another 3%–8%, depending on assumptions. Assuming
Cournot-Nash oligopolistic competition had almost no effect on the average benefits of credit trading. The effects of an oligopolistic versus competitive credit market on individual small producers could be large, however. Rubin and Leiby (2000) estimated the value per vehicle of fuel economy credits for alternative fuel vehicles during the 1991 to 1998 period to be $1,100 for a dedicated alternative fuel vehicle and $550 for a dual or flexible fuel vehicle.
FINDING 12.6: Credit trading across a manufacturer’s car and truck fleets appears to have reduced overall compliance costs. Trading across firms is limited, however, so it is not clear to what extent it is lowering the costs of compliance.
12.3.5 How Changing Utilization Affects Crediting
EPA and NHTSA estimate the changes in fuel consumption and emissions caused by standards using assumptions on vehicle use over the life of the vehicle. The agencies make assumptions about the relationship between vehicle age and probability of being scrapped, as well as miles traveled by age, conditional on surviving to that age. These estimates are the basis for crediting lifetime GHG emissions in the EPA program and for trading fuel economy credits in the NHTSA program.
New technologies like CAVs could affect vehicle use, as well as the timing and magnitude of fuel consumption/emissions changes. Magnitude matters because crediting is based on lifetime emissions and fuel consumption. Timing matters because of discounting. If two vehicles have the same lifetime emissions and one vehicle is used more heavily at beginning of life, discounting at a strictly positive rate would mean that this vehicle has a higher present-day value of lifetime fuel costs and emissions.
The possibility that new technologies affect vehicle utilization really is not any different conceptually from changes in driving and scrappage. Agencies have been updating scrappage and vehicle miles traveled (VMT) assumptions using newer and better data, such as accounting for longer vehicle lifetimes and higher VMT. In principle, the agencies could adjust assumptions as technologies affect utilization and scrappage. A better alternative would be to track on-road emissions as the basis for evaluating compliance. Considerations and the basis for tracking on-road emissions have been presented further in Section 12.2.1 Discrepancies with Real-World Fuel Consumption.
12.4 INTERNATIONAL CONTEXT OF REGULATORY ENVIRONMENT
The U.S. programs to regulate fuel economy and GHG emissions from light-duty vehicles are not taking place in a vacuum. Rather, they are part of an increasingly globalized motor vehicle market where regulatory requirements in one jurisdiction can affect and even drive the availability and cost of vehicle technologies in other jurisdictions. This section examines international efforts to promote (1) more efficient and alternative fueled vehicles and (2) autonomous and connected vehicles, and the impacts and consequences these international efforts may have on the U.S. fuel economy and GHG emissions programs for light-duty vehicles.
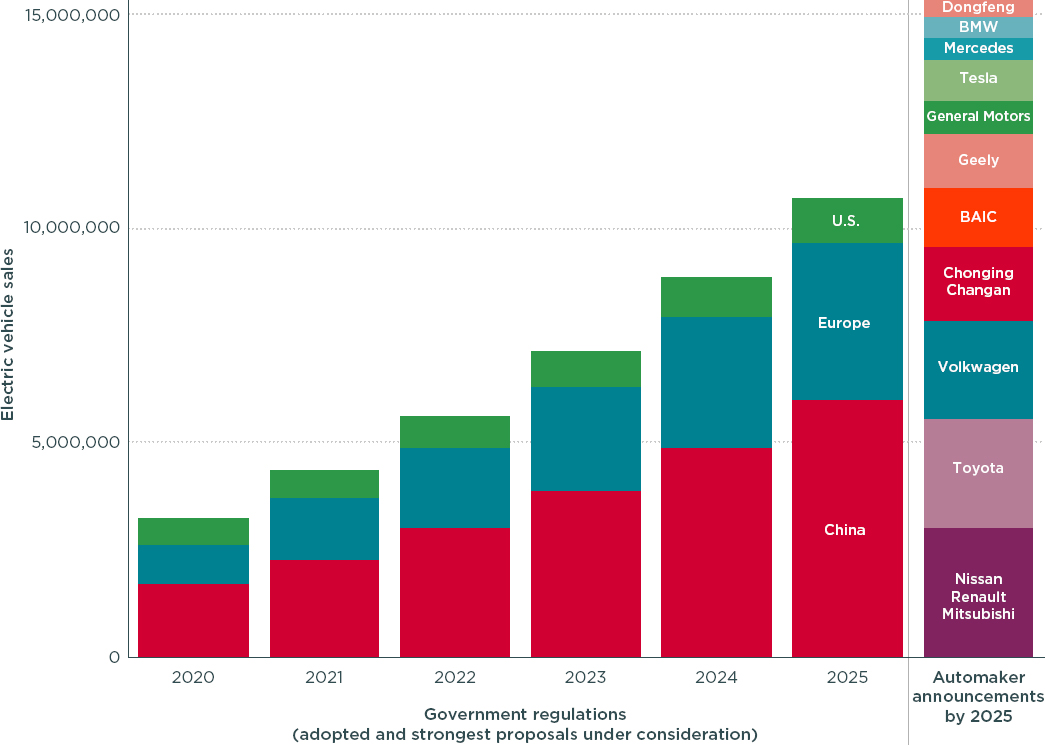
International standards and automakers’ announcements on global technology deployment provide important broader context on expected vehicle technology deployment in the time frame for this analysis. Many governments around the world (including Brazil, Canada, China, the European Union, India, Japan, Mexico, Saudi Arabia, South Korea, and the United States) have established fuel economy or GHG emission standards for passenger vehicles typically going through 2025 or later. The standards cover more than 80% of global passenger vehicle sales (ICCT, 2020). These vehicle regulations influence the technology investment and deployment decisions of all major global vehicle manufacturers. As a result, even with the uncertainty in the U.S. regulatory situation, global vehicle manufacturing companies plan for continuous year-on-year technology improvements that lower the per-mile CO2 emissions, and increase the efficiency, of new vehicles. The 2025 automaker targets for EVs based on government regulations are shown in Figure 12.8.
Although regulatory agencies around the world have taken different approaches with the design, test cycles, certification, and crediting procedures in their regulations, there are similarities in their approaches. The standards generally require annual reductions of 2% to 5% in new vehicles’ per-mile CO2 emissions. Increasingly, the
SOURCE: Lutsey (2018).
regulatory agencies around the world are taking advantage of declining battery costs and integrating EV within their regulatory frameworks and their setting of regulatory stringency. China also has direct regulations requiring EVs be deployed in greater percentages of new vehicles sales over time (Cui, 2018; Ministry of Industry and Information Technology, 2019). In the European Union, there are more stringent CO2 standards through 2030 and built-in incentives for EVs (Mock, 2019). In addition to the 11 U.S. states with ZEV regulations, Washington state has recently passed legislation to adopt a ZEV regulation (Washington State Legislature, 2020). Minnesota and New Mexico are considering similar regulations (State of Minnesota, 2019; State of New Mexico, 2019), but ZEV state authority is being litigated. Quebec has adopted a similar ZEV regulation (Gouvernement du Québec, 2019). British Columbia’s in-development ZEV Act as proposed will also include an enforceable requirement for 100% ZEV sales by 2040 (British Columbia, 2019).
12.4.1 Fuel Efficiency and Alternative-Fueled Vehicles
Several other jurisdictions have taken, or announced plans to take, aggressive regulatory actions to improve light-duty vehicle fuel economy and to advance ZEV technologies such as BEVs. To the extent that these international programs are implemented successfully, they could have significant impacts on the costs and feasibility of more fuel efficient or alternative vehicle technologies in the United States, thus affecting both regulatory feasibility and manufacturers’ plans and capabilities in the United States.
For example, strong regulatory targets for EVs or ZEVs in some countries can serve as demonstration programs that can inform other jurisdictions what strategies are successful or unsuccessful in encouraging manufacturers to offer such vehicles and consumers to purchase or lease these vehicles. Mandates to sell EVs or ZEVs in some countries may force manufacturers to invest in the platforms and technologies to make such vehicles succeed in those jurisdictions, and that learning and technology can then be transferred by those same manufacturers to the United States and other markets. Mandates or incentives in other countries may help overcome economies of scale in the production of more efficient or alternative-fueled vehicles.
On the negative side, strong requirements for ZEVs in other countries may increase demand and prices for some inputs to EVs and other efficient vehicle technologies, and may divert and occupy the engineering resources and budgets of some global vehicle manufacturers. Additionally, for U.S. automakers, a potential negative outcome of other countries enacting these ZEV regulations prior to the United States is that these countries will have the opportunity to establish and shape relevant supply chains, which may put them in a stronger position to supply the U.S. market if ZEV policy is enacted. For instance, China is the biggest market for vehicle sales in the world and a jurisdiction that has staked out an ambitious program to convert its fleets to EVs. The policies of China and other jurisdictions with significant programs are summarized in Sections 12.4.1.1 through 12.4.1.7.
12.4.1.1 China
China is the largest passenger vehicle market. In 2018, new vehicle sales reached 28.1 million (including 23.7 million passenger vehicles), adding to a vehicle population of 240 million (China Daily, 2019; Li et al., 2019). Although vehicle sales have decreased since 2018 (Kubota, 2020), the vehicle population in China is expected to grow substantially in the next decade, as the per-capita vehicle ownership is still less than approximately 20% of the U.S. level and Chinese income growth is expected to continue (Li et al., 2019). The rapid growth of vehicle population has posed serious challenges to energy security, with around 70% of China’s oil consumption imported (Azihu and Xu, 2020). Promoting vehicle efficiency and new energy vehicles (NEVs)3 has become a national strategy (CATARC, 2019).
China’s passenger vehicle fuel efficiency is regulated at both the vehicle level and the corporate level. Each new vehicle must not exceed the maximum fuel consumption limit based on the vehicle curb weight, as regulated by the policy GB19578-2014 (IEA, 2019). Starting from 2012, vehicle manufacturers need to meet the production-weighted corporate average fuel consumption (CAFC) target, also based on curb weight.4 China’s fuel economy standards could exceed those in the United States and even California by 2025. However, it is unclear which country’s fuel economy standards have more compliance flexibilities and how the two countries may compare with respect to the actual ICE vehicle fuel economy. China’s CAFC target compared to other countries’ fuel economy targets is displayed in Figure 12.9.
CAFC regulation is integrated in the Dual-Credit policy5 for 2018–2020 with NEV quota policies through very generous flexibilities. The CAFC compliance flexibility with NEVs is realized in three ways: each NEV is treated as 0 liters per 100 kilometers (L/100 km), unit sales of NEVs are treated as multiple units, and NEV surplus credits can be used to offset CAFC deficits. The achieved fuel consumptions in 2018 were 6.60 L/100 km for ICE passenger vehicles only and 5.80 L/100 km with NEV flexibility, a 12.12% difference. These flexibilities strongly indicate the intention of promoting NEVs and accepting the potential temporary leakage effect on ICE vehicle average efficiency. In theory, generous NEV flexibility may cause higher sales of large, heavy, and less efficient vehicles and therefore higher average fuel consumption of new ICE vehicles than without such flexibilities. Although such leakage effect has been demonstrated by counterfactual modeling results (Lin and Ou, 2019), no definitive evidence would indicate that such a leakage effect has actually occurred in the real world. In fact,
___________________
3 In China, NEV is defined to include plug-in hybrid electric, battery electric, and fuel cell vehicles.
4 In contrast to footprint, as used in the United States.
5 The official name of the policy is in Chinese and has been translated into Parallel Administration of Passenger Car Enterprise Average Fuel Consumption and New Energy Vehicle Credits.
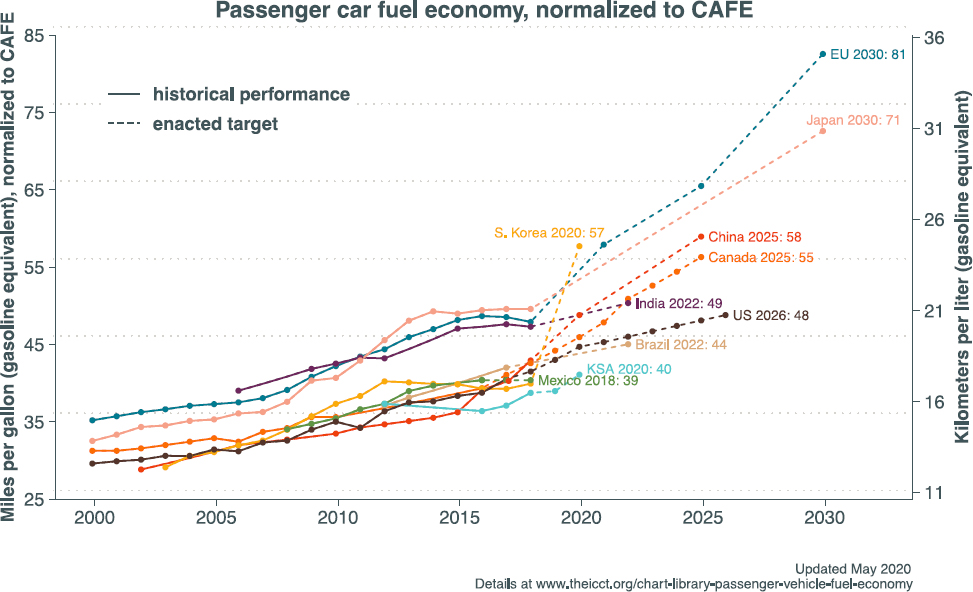
SOURCE: ICCT (2020).
average fuel consumption of Chinese ICE passenger vehicles continues to decrease, despite increases in vehicle footprint, weight, and power and the CAFC compliance flexibility with NEV sales, as shown in Figure 12.10.
The 2018–2020 dual-credit policy has been significantly over-complied. According to compliance data released by the Chinese government (Ministry of Industry and Information Technology of the People’s Republic of China, 2020a), in 2019, among the 144 vehicle manufacturers or importers responsible for a total of 20.93 million passenger vehicles (exports excluded), 6.4 million positive CAFC credits and 5.1 million negative CAFC credits were achieved (overcompliance by 25%). Meanwhile, 4.2 million positive NEV credits and 0.86 million negative NEV credits were generated (overcompliance by 388%). This overall overcompliance, however, is accompanied by a significant number of undercomplying manufacturers or importers. The achieved production-weighted average fuel consumption in 2019 was 5.56 L/100 km, down by 4% from 5.8 L/100 km in 2018.6 Achieving the 5 L/100 km goal (non-binding) by 2020, a 10% reduction from 2019, has become extremely difficult, if not impossible.
China is still pursuing the non-binding goal of 4 L/100 km by 2025 on the average fuel consumption of new passenger vehicles, which requires an average 5.3% annual reduction from the 2019 level. From 2013 to 2018, the average fuel consumption of new ICE passenger vehicles decreased from 7.33 L/100 km to 6.60 L/100 km, an annual reduction of 2.08% (CATARC, 2019). Including NEVs, the average fuel consumption of new passenger vehicles for 2016–2019 are 6.43, 6.05, 5.80, and 5.56 L/100 km, corresponding to an annual reduction of 8.7%, 5.9%, 4.1%, and 4.1%, respectively. It appears that achieving the 2025 goal of 4 L/100 km will require an accelerated market penetration of NEVs in addition to continued improvements in the efficiency of new ICE passenger vehicles.
Given the over-compliance results and the challenging 2025 goal, the Chinese government in June 2020 released an extended dual-credit policy for 2021–2023 with some important modifications that tighten the rules (Ministry of Industry and Information Technology of the People’s Republic of China, 2020b). The NEV quota is
___________________
6 2018, ICE vehicle 6.6 L/100 km; all including plug-in electric vehicles is 5.8 L/100 km.
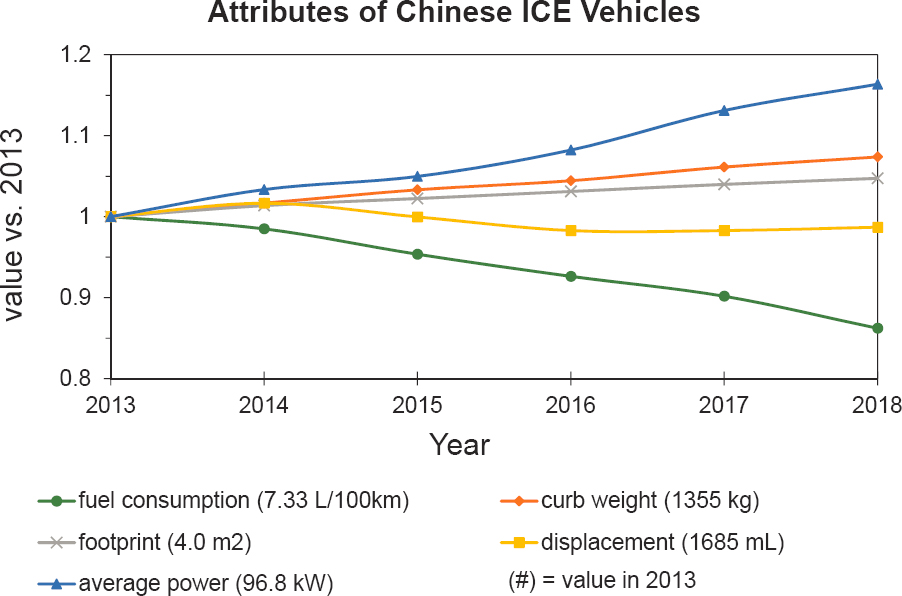
SOURCE: Committee generated using data from CATARC (2019).
increased from 12% for 2020 to 14%, 16%, and 18% for 2021, 2022, and 2023, respectively, while the credits for a given NEV type have overall decreased. For example, credits per PHEV decrease from 2 in the 2018–2020 rules to 1.6 in the 2021–2023 rules. Credits per BEV are tightened from 2 to 5 in the 2018–2020 rules to 1 to 3.4 in the 2021–2023 rules, depending on the electric range. In the old rules, a BEV could be treated as up to 1.2 units if its electric consumption per mile was low enough. Such a multiplication treatment is also less generous in the new rules. Another important change is the introduction of low-fuel-consumption (LFC) vehicles. Each conventional ICE vehicle has a curb-weight-based fuel consumption target. An ICE vehicle with a fuel consumption rate lower than a given ratio of this target is qualified as an LFC vehicle. This ratio is stipulated as 123%, 120%, and 115% for 2021, 2022, and 2023, respectively. Each LFC vehicle will be treated as a partial vehicle in the calculation of total production and multiplied by the NEV quota to calculate the required number of NEV credits. The partial vehicle ratios are stimulated to be 0.5, 0.3, and 0.2 for 2021, 2022, and 2023, respectively. The LFC concept clearly intends to encourage adoption of efficiency technologies for ICE vehicles for the return of a relaxed NEV credit requirement. The 2021–2023 rules also modified the rules for credit carryover and trade and explicitly include alcohol ether fuels in the category of conventional vehicle fuels.
12.4.1.2 European Union
Since 2009, the EU has set standards for the average CO2 emissions of each vehicle manufacturer, with the initial standards set at 130 grams of CO2 per kilometer (g CO2/km) by 2015 and subsequent standards that take effect in 2021 set at 95 g CO2/km (EU, 2009). In April 2019, the European Union adopted a new regulation that set out new CO2 emission performance standards for new passenger cars and for new vans in the EU (EU, 2019). This regulation began to apply in 2020, maintaining the original regulatory targets set forth in 2009 for 2020, but setting new targets that apply from 2025 and 2030. These targets are defined as a percentage reduction from the
2021 starting points, with passenger cars required to achieve a 15% reduction in CO2 emissions by 2025 and a 37.5% reduction by 2030. Vans are required to achieve a 15% reduction by 2025 and a 31% reduction by 2030 from their 2021 targets. The specific emission targets for each manufacturer to comply with are based on the EU fleet-wide targets, taking into account the average test mass of a manufacturer’s new vehicle fleet. The new regulations also include provisions to verify CO2 emissions of vehicles in-service and to ensure that the emission test procedure yields results that are representative of real-world emissions. According to an analysis by the International Council on Clean Transportation (ICCT), the EU’s CO2 standards are the most stringent in the industrial world (Yang and Rutherford, 2019).
The new EU regulatory program also incentivizes electric and other low carbon alternative fuel technologies, defined in the regulations as zero- and low-emission vehicles (ZLEVs) (EU, 2019). A ZLEV is a passenger car or a van with CO2 emissions between 0 and 50 grams per kilometer (g/km). A crediting system for ZLEVs commences in 2025, in which the CO2 emission target of a manufacturer is relaxed if its share of ZLEV registered in a given year exceeds the following benchmarks: (1) cars—15% ZLEV from 2025 on and 35% ZLEV from 2030 on; and (2) vans—15% ZLEV from 2025 on and 30% ZLEV from 2030 on. A 1 percentage point exceedance of the ZLEV benchmark will increase the manufacturer’s CO2 target by 1%, up to a maximum of 5%.
Individual EU nations have reinforced the EU regulations, and in particular the promotion of ZEVs, with robust financial incentives. France has implemented a “bonus-malus” that combines a tax charge on high-emitting CO2 models with a bonus payment of €3,000–6,000 (depending on vehicle value and year) for low-carbon vehicles, which as of 2020 will be restricted to BEVs and fuel cell vehicles (Randall, 2019). Similarly, Germany announced an increased financial incentive program in February 2020 that will extend at least through 2025, that will pay €5,000–6,000 for EVs and €3,750–5,000 for plug-in hybrids (Randall, 2020).
12.4.1.3 Non-EU European Nations
The most proactive nation in Europe, and in fact globally, with respect to BEV implementation is Norway. BEVs represented 31% of new vehicle sales in Norway in 2018, which raised BEVs to 7% of the total national on-road fleet (Figenbaum and Nordbakke, 2019). Norway has set a goal in its national vehicle policy to require all new vehicles sold from 2025 on to be ZEVs (Figenbaum and Nordbakke, 2019). The United Kingdom, which recently left the EU through Brexit, has set forth a goal of 100% ZEVs by 2040 (U.K. Department for Transport, 2018). It has set an interim goal for 2030 of at least 50%, and as many as 70%, of new car sales and up to 40% of new van sales being ultra-low emission (U.K. Department for Transport, 2018).
12.4.1.4 Japan
Japan’s current fuel efficiency standards for passenger cars were adopted in 2009 and took effect in 2020. In June 2019, Japan promulgated new fuel efficiency standards to take effect in 2030. The new standards require a fleet-wide average fuel efficiency of 25.4 kilometers per liter (km/L), which represents a 32.4% improvement compared to the actual performance in 2016 (Japanese Ministry of Economy, Trade, and Industry, 2020). The 2020 standards were based on different vehicle weight bins, with the heavier vehicle bins having the least stringent fuel efficiency targets, whereas the 2030 standards are based on a continuous curve that plots fuel efficiency targets against vehicle weight (Yang and Rutherford, 2019). In addition, the 2020 standards only applied to gasoline and diesel vehicles, while the 2030 standards will also apply to BEVs and plug-in hybrid vehicles. In order to calculate the energy consumption efficiency of electric and plug-in hybrid vehicles relative to gasoline vehicles, a well-to-wheels model is used that considers the energy consumption efficiency on the upstream side of the supply of gasoline, electricity, or other fuel source (Japanese Ministry of Economy, Trade, and Industry, 2020). The standards estimate that 20% of new passenger car sales in 2030 will be BEVs and PHEVs (Yang and Rutherford, 2019). A comparative analysis by the ICCT concluded that the new Japanese fuel efficiency standards are less stringent than the European standards but more stringent than those of the United States, Canada, and China (Yang and Rutherford, 2019).
12.4.1.5 India
India has adopted fuel economy norms in two phases. The CAFC standard that took effect in 2017–2018 is 130 g CO2/km (or 19.2 km/L), decreasing to 113 g/km (or 20.96 km/L) in 2022–2023 (Vishvak and V V, 2019). India has indicated consistent and strong support for EVs, although the specific goals and requirements have fluctuated in recent years. The government announced in 2017 that the goal will be 100% EVs by 2030 but subsequently backed off to a target of 30%. The government is currently offering financial incentives for EV purchases, recently cutting the Goods and Services tax on EVs from 12% to 5% and cutting the tax on electric chargers and charging stations from 18% to 5% (Carpenter, 2019). The government has also recently committed $1.4 billion (10,000 crore rupees) in EV subsidies in its Faster Adoption and Manufacturing of Hybrid and Electric Vehicles, or FAME, program (Carpenter, 2019).
12.4.1.6 Canada
Canada has sought to align its fuel economy and GHG emissions standards for LDVs with those of the United States. The most recent Canadian standards were adopted in 2014, adopting standards similar to those previously adopted by the United States for MY 2017 and beyond (Government of Canada, 2014). Canada has not yet adopted standards equivalent to the U.S. standards for 2020–2025 but is expected to do so soon. The federal government has established a goal of 30% ZEVs in new passenger car sales by 2030, and 100% by 2040. In May 2019, the Canadian province of British Columbia legislated the world’s first 100% ZEV mandate for passenger vehicles. The Zero-Emission Vehicles Act of 2019 enacted 10%, 30%, and 100% ZEV sales targets by 2025, 2030, and 2040, respectively (Government of British Columbia, 2019).
12.4.1.7 Overview
Many industrial countries have now adopted more aggressive fuel economy standards than the United States, including more ambitious targets for ZEV sales (Cui et al., 2020). This is a goal shared by many automotive companies as well, with General Motors announcing plans to manufacture one million EVs by 2025, as an example (Pyper, 2020). Of course, some of these targets may be more aspirational than realistic; for example, Canada targeted selling 500,000 EVs by 2018, but less than 100,000 were sold (Rabson, 2019). Nonetheless, these international regulatory pressures for more and sooner EV sales will influence the timing and volume of commercial EV sales in the United States, with one of the heaviest and largest mass fleets. This influence comes both from providing learning and experience on consumer, infrastructure, and incentive strategies to enhance EV sales, and from providing economy of scale and technology leverage for vehicle manufacturers.
FINDING 12.7: The global regulatory push for more efficient vehicles—in particular, electric vehicles—and lower greenhouse gas emissions by many industrialized nations will provide an important impetus for both technology availability and adoption by manufacturers for the U.S. market and valuable learning experience for incentivizing consumer adoption of electric vehicles.
RECOMMENDATION 12.4: The 2025–2035 Corporate Average Fuel Economy standard should be set and designed to depend on and incentivize a significant market share of zero-emission vehicles (plug-in hybrid electric vehicles, battery electric vehicles, and fuel cell electric vehicles).
12.4.2 “Internationalization” of Vehicle Platforms/Technologies
Automakers are global companies that sell their vehicles in multiple countries around the world. Vehicle models will often need to be customized for individual countries according to their specific regulatory specifications and unique demand characteristics. However, automakers do use many shared components across their vehicles sold around the world in global platforms and powertrain families.
The use of the same platforms and powertrain families can reduce production costs through economies of scale over multiple international markets. The global integration of automotive development means that regulations in international markets can influence an automaker’s vehicle production in the United States and their capabilities to implement various vehicle technologies. For instance, advances in powertrain and non-powertrain technologies that an automaker achieves in order to meet international emission regulations could then be available to transfer to the U.S. market. Examples of these advances include mass reduction through design and material substitution; battery cell design and cathode materials; fuel cell materials and manufacturing; and power and control electronics. Furthermore, cost reductions made possible by learning-by-doing and manufacturing improvements from implementing these technologies in other countries may also be able to transfer to the U.S. context.
12.5 FUEL ECONOMY REGULATION IN A WARMING WORLD
Over the course of the CAFE program, its objectives and scope have evolved. The initial drivers of the CAFE program, including energy security and energy conservation, remain relevant public policy objectives, although their relative importance has diminished as the United States has become self-sufficient in energy supply. At the same time, new priorities underlying the program have emerged, especially minimizing GHG emissions through increased energy efficiency and substitution with clean energy sources and technologies. The alignment of the EPA motor vehicle GHG emission control program with the NHTSA CAFE program reflects this evolving policy focus.
These shifting objectives of the CAFE program have been accompanied by an expansion in the scope and diversity of vehicles regulated by the program. When the program commenced in the mid-1970s, virtually all regulated vehicles had gasoline-fueled, ICEs. Over the years, the program has expanded to encompass engines fueled by other liquid fuels including diesel, natural gas, and ethanol-blended fuels. More importantly, alternative powertrains are now becoming an increasing percentage of the regulated fleet, including hybrid engines, BEVs, and fuel cell vehicles. CAVs will further add to the diversity of light-duty vehicles subject to the CAFE standards. As the diversity of fuels, powertrains, and technologies continues to expand, developing metrics to compare fuel economy across these various vehicle types becomes a challenge. The most common and relevant metric is GHG emissions, which have become the most useful and widespread metric for measuring overall fuel efficiency.
Another implication of the focus on GHG emissions is that light-duty vehicles are only a part of the GHG problem. It is quite possible that during the time frame of this study, 2025–2035, the United States will adopt a more comprehensive program to regulate GHG emissions from all sources, such as a carbon tax or a national CO2 cap-and-trade program. Such a national program may encompass GHG emissions from light-duty vehicles, which will raise the issue of whether such a national program will or should complement or substitute for the CAFE program.
FINDING 12.8: Vehicle efficiency has been regulated since 1978 by the U.S. Department of Transportation in liquid fuel used per mile, which met two goals of reduced energy use and reduced petroleum use onboard the vehicle. The U.S. Environmental Protection Agency began to regulate greenhouse gas (GHG) emissions from the light-duty fleet in 2009, and the regulations have been paired ever since, as they have significant shared features. In the period of 2025–2035, where climate goals are continually increasing in importance and the diversity of light-duty vehicle fueling sources is growing, GHG emissions reduction will become an important metric for meeting the goals of both vehicle efficiency and GHG emissions reduction.
RECOMMENDATION 12.5: The National Highway Traffic Safety Administration should continue to align the Corporate Average Fuel Economy program with the U.S. Environmental Protection Agency greenhouse gas emissions program for light-duty vehicles, seeking to reduce or eliminate any inconsistencies between the programs.
12.6 REFERENCES
110th Congress. 2007. “H.R.6—110th Congress (2007–2008): Energy Independence and Security Act of 2007.” Legislation. 2007/2008. December 19, 2007. https://www.congress.gov/bill/110th-congress/house-bill/6.
Azihu, C., and M. Xu. 2020. “China Opens Up Oil and Gas Exploration, Production for Foreign, Domestic Firms.” Reuters. January 9. https://www.reuters.com/article/us-china-oil-mining-idUSKBN1Z806Q.
Bigazzi, A.Y., and K.J. Clifton. 2015. Modeling the effects of congestion on fuel economy for advanced power train vehicles. Transportation Planning and Technology 38(2):149–161. https://doi.org/10.1080/03081060.2014.997449.
British Columbia. 2019. Zero-Emission Vehicles Act. https://www2.gov.bc.ca/gov/content/industry/electricity-alternative-energy/transportation-energies/clean-transportation-policies-programs/zero-emission-vehicles-act.
Broch, F., J. Warsen, and S. Krinke. 2015. “Implementing Life Cycle Engineering in Automotive Development as a Helpful Management Tool to Support Design for Environment.” In Life Cycle Management, edited by G. Sonnemann and M. Margni, 319–329. Dordrecht: Springer Netherlands. https://doi.org/10.1007/978-94-017-7221-1_23.
Canis, B. 2020. “Issues in Autonomous Vehicle Testing and Deployment.” Congressional Research Service. https://fas.org/sgp/crs/misc/R45985.pdf.
CARB (California Air Resources Board). 2020. “Light-Duty Vehicle Research.” https://ww2.arb.ca.gov/resources/documents/light-duty-vehicle-research.
Carpenter, S. 2019. “India’s Plan to Turn 200 Million Vehicles Electric in Six Years.” Forbes. December 5. https://www.forbes.com/sites/scottcarpenter/2019/12/05/can-india-turn-nearly-200-million-vehicles-electric-in-six-years/?sh=73f4ad7915db.
CATARC (China Automotive Technology and Research Center). 2019. Annual Report on Energy-Saving and New Energy Vehicle in China 2019. https://www.sanmin.com.tw/Product/index/007569348.
China Daily. 2019. “China Ahead in Car Sales Race for 10 Consecutive Years.” January 16. http://www.china.org.cn/business/2019-01/16/content_74377606.htm.
Cui, H. 2018. “China’s New Energy Vehicle Mandate Policy.” International Council on Clean Transportation. https://theicct.org/publications/china-nev-mandate-final-policy-update-20180111.
Cui, H., D. Hall, and N. Lutsey. 2020. “Update on the Global Transition to Electric Vehicles through 2019.” International Council on Clean Transportation. https://theicct.org/sites/default/files/publications/update-global-EV-stats-20200713-EN.pdf.
Dornoff, J. 2019. One goal, multiple pathways: A review of approaches for transferring on-board fuel consumption meter data to the European Commission. White Paper. International Council on Clean Transportation. https://theicct.org/sites/default/files/publications/OBFCM_data_transfer_20191022.pdf.
EPA (U.S. Environmental Protection Agency). 2006. Fuel Economy Labeling of Motor Vehicles: Revisions to Improve Calculation of Fuel Economy Estimates: Final Technical Support Document. EPA420-R-06-017. Office of Transportation and Air Quality.
EPA. 2014. “Hyundai and Kia Clean Air Act Settlement.” Other Policies and Guidance. October 31. https://www.epa.gov/enforcement/hyundai-and-kia-clean-air-act-settlement.
EPA. 2017a. “Derived 5-Cycle Coefficients for 2017 and Later Model Years.” Guidance memorandum. National Vehicle and Fuel Emissions Laboratory, Plymouth, MI. https://iaspub.epa.gov/otaqpub/display_file.jsp?docid=35113&flag=1.
EPA. 2017b. “Overview for Renewable Fuel Standard.” Overviews and Factsheets. US EPA. June 7. https://www.epa.gov/renewable-fuel-standard-program/overview-renewable-fuel-standard.
EPA. 2019. Greenhouse Gas (GHG) Emission Standards for Light-Duty Vehicles: Manufacturer Performance Report, and Excel tables. https://www.epa.gov/automotive-trends/download-data-automotive-trends-report.
EPA. 2020. The 2019 Automotive Trends Report. EPA-420-R-20-006, Detailed Data. https://www.epa.gov/automotive-trends/explore-automotive-trends-data#DetailedData.
EPA/NHTSA (U.S. Environmental Protection Agency and National Highway Traffic Safety Administration). 2012. “2017 and Later Model Year Light-Duty Vehicle Greenhouse Gas Emissions and Corporate Average Fuel Economy Standards.” Federal Register 77(99). https://www.govinfo.gov/content/pkg/FR-2012-10-15/pdf/2012-21972.pdf.
EPA Press Office. 2020. “U.S. DOT and EPA Put Safety and American Families First with Final Rule on Fuel Economy Standards.” Speeches, Testimony, and Transcripts. US EPA. March 31. https://www.epa.gov/newsreleases/us-dot-and-epa-put-safety-and-american-families-first-final-rule-fuel-economy-standards.
EU (European Parliament and Council of the European Union). 2009. Regulation (EC) No 443/2009. https://eur-lex.europa.eu/legal-content/EN/TXT/PDF/?uri=CELEX:32009R0443&from=EN.
EU. 2019. Regulation (EU) 2019/631. https://eur-lex.europa.eu/legal-content/EN/TXT/PDF/?uri=CELEX:32019R0631&from=EN.
Figenbaum, E., and S. Nordbakke. 2019. Battery Electric Vehicle User Experiences in Norway’s Maturing Market. Oslo, Norway: Norwegian Centre for Transport Research. August. https://www.toi.no/getfile.php?mmfileid=50956.
Gaoi, J., M. Li, Y. Hu, H. Chen, and M. Yan. 2019. Challenges and developments of automotive fuel cell hybrid power system and control. Science China Information Sciences 62:51201. http://scis.scichina.com/en/2019/051201.pdf.
Good, D. 2017. “EPA Test Procedures for Electric Vehicles and Plug-in Hybrids.” Draft Summary—Regulations Take Precedence. US EPA. https://www.fueleconomy.gov/feg/pdfs/EPA%20test%20procedure%20for%20EVs-PHEVs-11-14-2017.pdf.
Gouvernement du Québec. 2019. The Zero-Emission Vehicle (ZEV) Standard. http://www.environnement.gouv.qc.ca/changementsclimatiques/vze/index-en.htm.
Government of British Columbia. 2019. “Zero-Emission Vehicles Act.” Government of British Columbia. May 30. https://www2.gov.bc.ca/gov/content/industry/electricity-alternative-energy/transportation-energies/clean-transportation-policies-programs/zero-emission-vehicles-act.
Government of Canada. 2014. Regulations Amending the Passenger Automobile and Light Truck Greenhouse Gas Emissions Regulations. Pub. L. No. SOR/2014-207 (2014). https://gazette.gc.ca/rp-pr/p2/2014/2014-10-08/html/sor-dors207-eng.html.
Greene, D.L., A.J. Khattak, J. Liu, X. Wang, J.L. Hopson, and R. Goeltz, 2017. What is the evidence concerning the gap between on-road and Environmental Protection Agency fuel economy ratings? Transport Policy 53:146–160.
Hall, D., and N. Lutsey. 2018. “Effects of Battery Manufacturing on Electric Vehicle Life-Cycle Greenhouse Gas Emissions.” Briefing. International Council on Clean Transportation. https://theicct.org/sites/default/files/publications/EV-life-cycle-GHG_ICCT-Briefing_09022018_vF.pdf.
He, H. 2014. “Credit Trading in the US Corporate Average Fuel Economy (CAFE) Standard.” Briefing. International Council on Clean Transportation. March. https://theicct.org/sites/default/files/publications/ICCTbriefing_CAFE-credits_20140307.pdf.
Hellman, K.S., and J.D. Murrell. 1984. “Development of Adjustment Factors for EPA City and Highway MPG Values.” SAE Technical Paper, 840496. Warrendale, PA: Society of Automotive Engineers.
Helmers, E., and M. Weiss. 2017. Advances and critical aspects in the life-cycle assessment of battery electric cars. Energy and Emission Control Technologies 2017(5):1–18. https://doi.org/10.2147/EECT.S60408.
Henning, M., A.R. Thomas, and A. Smyth. 2019. An analysis of the association between changes in ambient temperature, fuel economy, and vehicle range for battery electric and fuel cell electric buses. Urban Publications. https://engagedscholarship.csuohio.edu/urban_facpub/1630.
Hu, X., Y. Zheng, D.A. Howey, H. Perez, A. Foley, and M. Pecht. 2020. Battery warm-up methodologies at subzero temperatures for automotive applications: Recent advances and perspectives. Progress in Energy and Combustion Science 77: 100806. March. https://doi.org/10.1016/j.pecs.2019.100806.
Huseynov, S., and M.A. Palma. 2018. Does California’s low carbon fuel standard reduce carbon dioxide emissions? PLOS ONE 13(9):e0203167. https://doi.org/10.1371/journal.pone.0203167.
ICCT (The International Council on Clean Transportation). 2020. “Chart Library: Passenger Vehicle Fuel Economy.” May. https://theicct.org/chart-library-passenger-vehicle-fuel-economy.
IEA (International Energy Agency). 2019. GB 19578-2014 Fuel consumption limits for passenger cars (stage VI). Policy of the People’s Republic of China. Updated October 22, 2019. https://www.iea.org/policies/2999-gb-195782014-fuel-consumption-limits-for-passenger-cars-stage-vi.
Japanese Ministry of Economy, Trade, and Industry. 2020. “Fuel Efficiency Standards for Passenger Vehicles in FY2030 Formulated.” Ministry of Economy, Trade, and Industry. March 31. https://www.meti.go.jp/english/press/2020/0331_009.html.
Jenn, A., I.M.L. Azevedo, and J.J. Michalek. 2016. Alternative fuel vehicle adoption increases fleet gasoline consumption and greenhouse gas emissions under United States corporate average fuel economy policy and greenhouse gas emissions standards. Environmental Science and Technology 50(5):2165–2174. https://doi.org/10.1021/acs.est.5b02842.
Kim, H.-J., C. McMillan, G.A. Keoleian, and S.J. Skerlos. 2010. Greenhouse gas emissions payback for lightweighted vehicles using aluminum and high-strength steel. Journal of Industrial Ecology 14(6):929–946. https://doi.org/10.1111/j.1530-9290.2010.00283.x.
Kiso, T. 2017. Evaluating new policy instruments of the corporate average fuel economy standards: Footprint, credit transferring, and credit trading. Environmental and Resource Economics 72(2):445–476. https://doi.org/10.1007/s10640-017-0200-1.
Kubota, Y. 2020. “China Auto Sales Slid 8.2% Last Year.” Wall Street Journal. January 13, sec. Business. https://www.wsj.com/articles/china-auto-sales-slid-8-2-last-year-11578898123.
Kühlwein, J., J. German, and A. Bandivadekar. 2014. Development of test cycle conversion factors among worldwide light-duty vehicle co2 emission standards. White paper. International Council on Clean Transportation. https://theicct.org/sites/default/files/publications/ICCT_LDV-test-cycle-conversion-factors_sept2014.pdf.
Laing, K. 2018. “Carmakers Face Higher MPG Fines.” Detroit News. April 24. https://www.detroitnews.com/story/business/autos/2018/04/24/higher-MPG-fines/34214385/.
Lattanzio, R.K., L. Tsang, and B. Canis. 2020. “Vehicle Fuel Economy and Greenhouse Gas Standards.” Congressional Research Service. https://fas.org/sgp/crs/misc/IF10871.pdf.
Lave, L.B., C.T. Hendrickson, and F.C. McMichael. 1995. Environmental implications of electric cars. Science 268(5213):993–995.
Leard, B., and V. McConnell. 2017. New Markets for Credit Trading Under US Automobile Greenhouse Gas and Fuel Economy Standards. RFF Report, Resources for the Future, Washington, DC. August.
Leard, B., V. McConnell, and Y.C. Zhou. 2019. The effect of fuel price changes on fleet demand for new vehicle fuel economy. Journal of Industrial Economics 67(1):127–159. https://doi.org/10.1111/joie.12198.
Lee D., A. Elgowainy, and R. Vijayagopal. 2019. Well-to-wheel environmental implications of fuel economy targets for hydrogen fuel cell electric buses in the United States. Energy Policy 128:565–583. May.
Lewis, G.M., C.A. Buchanan, K.D. Jhaveri, J.L. Sullivan, J.C. Kelly, S. Das, A.I. Taub, and G.A. Keoleian. 2019. Green principles for vehicle lightweighting. Environmental Science & Technology 53(8):4063–4077. https://doi.org/10.1021/acs.est.8b05897.
Li, Y., L. Miao, Y. Chen, and Y. Hu. 2019. Exploration of sustainable urban transportation development in China through the forecast of private vehicle ownership. Sustainability 11(16):1–18.
Lin, Z., and S. Ou. 2019. “Dual-Credit Policy: Impact on PEV Sales and Industry Profits in China.” University of Michigan Energy Institute. October 18. https://energy.umich.edu/te3/wp-content/uploads/sites/2/2019/10/Lin-slides-TE3-2019.pdf.
Linn, J., and V. McConnell. 2019. Interactions between federal and state policies for reducing vehicle emissions. Energy Policy 126(March 1):507–517. https://doi.org/10.1016/j.enpol.2018.10.052.
Liu, C., D.L. Greene, and D.S. Bunch. 2014. Vehicle manufacturer technology adoption and pricing strategies under fuel economy/emissions standards and feebates. Energy Journal 35(3):71–89.
Lutsey, N. 2018. “Modernizing Vehicle Regulations for Electrification.” International Council on Clean Transportation. October. https://theicct.org/sites/default/files/publications/ZEV_Regulation_Briefing_20181017.pdf.
Macauley, N., R.W. Lujan, D. Spernjak, D.S. Hussey, D.L. Jacobson, K. More, R.L. Borup, et al. 2016. Durability of polymer electrolyte membrane fuel cells operated at subfreezing temperatures. Journal of the Electrochemical Society 163(13):F1317–F1329. https://www.osti.gov/servlets/purl/1374332.
MacDuffie, P., and E. Orts. 2019. “Why Automakers Are Driving for Uniform Fuel Efficiency Standards.” Knowledge@ Wharton. July 14. https://knowledge.wharton.upenn.edu/article/end-california-emissions-standards/.
Matthews, H.S., C.T. Hendrickson, and D. Matthews. 2014. Life Cycle Assessment: Quantitative Approaches for Decisions That Matter. Open access textbook. https://www.lcatextbook.com/.
McNutt, B.D., D. Pirkey, R. Dulla, and C. Miller. 1978. “A Comparison of Fuel Economy Results from EPA Tests and Actual In-Use Experience 1974–1977 Model Year Cars.” SAE Technical Paper 780037. Warrendale, PA: Society of Automotive Engineers.
Ministry of Industry and Information Technology. 2019. 工业和信息化部关于《乘用车企业平均燃料消耗量与新能源汽车积分并行管理办法》修正案(征求意见稿)公开征求意见的通知. [Notice of the Ministry of Industry and Information Technology on the Public Consultation on the Amendments to the “Dual Regulation for the Average Fuel Consumption of Passenger Vehicle Enterprises and New Energy Vehicles” (Draft for Comment).] http://www.miit.gov.cn/n1146285/n1146352/n3054355/n3057585/n3057592/c7027601/content.html.
Ministry of Industry and Information Technology of the People’s Republic of China. 2020a. Measures for the Parallel Administration of the Average Fuel Consumption and New Energy Vehicle Credits of Passenger Vehicle Enterprises. http://www.miit.gov.cn/n1146295/n1652858/n7280902/c7988463/content.html.
Ministry of Industry and Information Technology of the People’s Republic of China. 2020b. “中华人民共和国工业和信息化部 商务部 海关总署 市场监管总局公告.” http://miit.gov.cn/n1146295/n1652858/n1652930/n4509607/c7991697/content.html.
Mock, P. 2019. CO2 emission standards for passenger cars and light-commercial vehicles in the European Union. International Council on Clean Transportation. https://theicct.org/publications/ldv-co2-stds-eu-2030-update-jan2019.
NHTSA (National Highway Traffic Safety Administration). 2019. CAFE Public Information Center: Manufacturer Performance Report, Credit Status Report. https://one.nhtsa.gov/cafe_pic/CAFE_PIC_Mfr_LIVE.html and https://one.nhtsa.gov/cafe_pic/CAFE_PIC_Credit_LIVE.html.
NHTSA. 2020. “Fact Sheet: SAFE Vehicles Rule.” March 31. https://www.nhtsa.gov/corporate-average-fuel-economy/safe-fact-sheet.
NHTSA/EPA (National Highway Traffic Safety Administration and U.S Environmental Protection Agency). 2020. The Safer Affordable Fuel-Efficient (SAFE) Vehicles Rule for Model Year 2012-2026 Passenger Cars and Light Trucks: Final Environmental Impact Statement. Docket No. NHTSA-2017-0069. https://www.nhtsa.gov/sites/nhtsa.dot.gov/files/documents/safe_vehicles_rule_feis.pdf.
Nordelöf, A., M. Messagie, A. Tillman, M.L. Söderman, and J. Van Mierlo. 2014. Environmental impacts of hybrid, plug-in hybrid, and battery electric vehicles—What can we learn from life cycle assessment? International Journal of Life Cycle Assessment 19(11):1866–1890. https://doi.org/10.1007/s11367-014-0788-0.
NSTC/DOT (National Science and Technology Council and U.S. Department of Transportation). 2020. “Ensuring American Leadership in Automated Vehicle Technologies: Automated Vehicles 4.0.” https://www.transportation.gov/sites/dot.gov/files/2020-02/EnsuringAmericanLeadershipAVTech4.pdf.
Pike, E. 2012. “Calculating Electric Drive Vehicle Greenhouse Gas Emissions.” International Council on Clean Transportation. https://theicct.org/sites/default/files/publications/ICCT_CalculatingEdriveGHG_082012.pdf.
Posada, F., and J. German. 2013. Measuring in-use fuel economy in Europe and the US: Summary of pilot studies. Working Paper. International Council on Clean Transportation. https://theicct.org/sites/default/files/publications/ICCT_FuelEcon_pilotstudies_20131125.pdf.
Pyper, J. 2020. “Automaker Electric Vehicle Plans ‘Progressing at a Rapid Pace’ Despite Pandemic, Economic Downturn.” Atlantic Council (blog). June 24. https://www.atlanticcouncil.org/blogs/energysource/automaker-electric-vehicle-plans-progressing-at-a-rapid-pace-despite-pandemic-economic-downturn/.
Rabson, M. 2019. “Sales of Electric Cars in Canada Fall Well Short of Goal Set in 2009.” Globe and Mail. January 7. https://www.theglobeandmail.com/business/article-sales-of-electric-cars-are-soaring-in-canada-but-still-fall-short-of/.
Randall, C. 2019. “France Increases EV Subsidy System.” electrive.com. December 19. https://www.electrive.com/2019/12/19/france-revises-their-ev-subsidy-system/.
Randall, C. 2020. “Germany doubles EV subsidies, no more diesel support.” electrive.com. June 4. https://www.electrive.com/2020/06/04/germany-doubles-ev-subsidies-no-more-diesel-support/.
Rubin, J., and P. Leiby. 2000. An analysis of alternative fuel credit provisions of US automotive fuel economy standards. Energy Policy 13:589–601.
Rubin, J., P.N. Leiby, and D.L. Greene. 2009. Tradable fuel economy credits: Competition and oligopoly. Journal of Environmental Economics and Management 58:315–328.
State of Minnesota. 2019. “Governor Tim Walz Announces Clean Car Standards in Minnesota.” https://mn.gov/governor/news/?id=1055-403887.
State of New Mexico. 2019. Executive order 2019-003: Executive order on addressing climate change and energy waste prevention. https://www.governor.state.nm.us/wp-content/uploads/2019/01/EO_2019-003.pdf.
Temple, J. 2019. “Automakers Have Agreed with California to Make More Efficient Cars, in a Rebuke to Trump.” MIT Technology Review. July 25. https://www.technologyreview.com/2019/07/25/134052/automakers-have-agreed-with-california-to-make-more-efficient-cars-in-a-rebuke-to-trump/.
U.K. Department for Transport. 2018. “The Road to Zero: Next Steps Towards Cleaner Road Transport and Delivering Our Industrial Strategy.” London. https://assets.publishing.service.gov.uk/government/uploads/system/uploads/attachment_data/file/739460/road-to-zero.pdf.
United States Code. 1990. Clean Air Act Amendments, Pub. L. No. 101–549 (1990). https://www.govinfo.gov/content/pkg/STATUTE-104/pdf/STATUTE-104-Pg2399.pdf.
Vishvak, R., and R. V V. 2019. Quest for control of fuel consumption and CO2 emission in Indian passenger cars—an analysis of the progress and prognosis. International Journal of Mechanical Engineering and Technology 10(3):1094–1099.
Wali, B., D.L. Greene, A.J. Khattak, and J. Liu. 2018. Analyzing within garage fuel economy gaps to support vehicle purchasing decisions–A copula-based modeling and forecasting approach. Transportation Research D 63:186–208.
Wan, Z., H. Chang, S. Shu, Y. Wang, and H. Tang. 2014. A review on cold start of proton exchange membrane fuel cells. Energies 7:3179–3203. doi:10.3390/en7053179.
Washington State Legislature. 2020. An act relating to reducing emissions by making changes to the clean car standards and clean car program. http://search.leg.wa.gov/search.aspx#document.
Yang, Z., and D. Rutherford. 2019. “Japan 2030 Fuel Economy Standards.” Policy update. International Council on Clean Transportation. September 27. https://theicct.org/publications/japan-2030-fuel-economy-standards.


