
2
Offshore Oil and Gas Operations and Safety
Over the past 10 years, oil production from the U.S. Outer Continental Shelf (OCS) has increased from 594 million barrels to more than 697 million barrels in 2019. The Gulf of Mexico (GOM) region experienced all of this oil production increase, while the Pacific and Alaska regions saw dramatic decreases (see Table 2-1). Over this same period, total natural gas production on the OCS declined in all three regions by more than half, from 2.5 trillion cubic feet to just more than 1 trillion cubic feet. Once again, the Pacific and Alaska regions saw the largest decreases. At the same time, total U.S. production from all domestic sources (onshore and offshore) increased (see Table 2-1). The three OCS regions accounted for approximately 16 percent of all domestic oil production and almost 3 percent of domestic natural gas production in 2019. For many reasons, such as a very active hurricane season, the current pandemic, and depressed prices for oil and gas, production for 2020 is expected to be down significantly.
As noted above, the vast majority of OCS oil and gas is produced in the GOM, and the bulk of this production over the past 10 years is from wells in water depths greater than 1,000 feet (see Table 2-2).
Dozens of operators, including large energy companies and midsize and smaller independent producers, hold leases and work on the OCS.1 These leases can have one or multiple owners, with various percentages of working interests, but one holder is usually designated as the operating company (or as designated operator). This designated operator generally
___________________
1 G. Southworth, Offshore Operators Committee, presentation to the committee, December 2018.
TABLE 2-1 Annual OCS Oil and Gas Production by BSEE Region and Total U.S. Production, 2009–2019
| Oil (Barrels) | |||||
|---|---|---|---|---|---|
| Year | Alaska | Pacific | Gulf | OCS Totala | Total U.S. Productionb |
| 2009 | 1,823,426 | 22,306,167 | 570,309,328 | 594,438,921 | 1,955,194,000 |
| 2010 | 1,337,999 | 21,707,342 | 566,628,383 | 589,673,724 | 2,001,805,000 |
| 2011 | 1,057,866 | 19,816,849 | 481,697,096 | 502,571,811 | 2,068,540,000 |
| 2012 | 627,108 | 17,678,493 | 464,786,485 | 483,092,086 | 2,386,534,000 |
| 2013 | 669,148 | 18,565,833 | 459,046,740 | 478,281,721 | 2,735,354,000 |
| 2014 | 625,303 | 18,506,540 | 510,467,459 | 529,599,302 | 3,208,127,000 |
| 2015 | 609,912 | 11,451,040 | 553,007,049 | 565,068,001 | 3,447,970,000 |
| 2016 | 548,343 | 6,142,614 | 585,712,140 | 592,402,097 | 3,239,657,000 |
| 2017 | 513,420 | 5,714,391 | 613,670,834 | 619,898,645 | 3,420,545,000 |
| 2018 | 491,616 | 4,873,812 | 642,071,188 | 647,436,616 | 4,001,892,000 |
| 2019d | 479,711 | 4,448,922 | 692,638,479 | 697,567,112 | 4,470,528,000 |
| Gas (MCF) | |||||
|---|---|---|---|---|---|
| Year | Alaska | Pacific | Gulf | OCS Totala | Total U.S. Productionc |
| 2009 | 29,609 | 41,282 | 2,451,076 | 2,521,968 | 21,647,936 |
| 2010 | 29,659 | 41,251 | 2,250,426 | 2,321,325 | 22,381,873 |
| 2011 | 37,801 | 36,591 | 1,826,593 | 1,900,969 | 24,036,352 |
| 2012 | 21,960 | 27,263 | 1,535,897 | 1,585,120 | 25,283,278 |
| 2013 | 29,293 | 27,505 | 1,328,279 | 1,385,038 | 25,562,232 |
| 2014 | 31,264 | 28,313 | 1,276,676 | 1,336,186 | 27,497,754 |
| 2015 | 32,249 | 14,808 | 1,307,390 | 1,354,374 | 28,772,044 |
| 2016 | 31,705 | 4,501 | 1,220,854 | 1,257,061 | 28,400,049 |
| 2017 | 29,056 | 3,949 | 1,078,719 | 1,085,235 | 29,237,825 |
| 2018 | 3,211 | 3,428 | 993,098 | 999,737 | 33,008,867 |
| 2019d | 2,749 | 2,876 | 1,034,174 | 1,039,798 | 36,515,188 |
NOTES: MCF = 1,000,000 cubic feet; OCS = Outer Continental Shelf. Data as of December 31, 2020.
a See https://www.data.bsee.gov/Production/OCSProduction/Default.aspx; OCS data as of December 31, 2020.
b See https://www.eia.gov/dnav/pet/PET_CRD_CRPDN_ADC_MBBL_A.htm; data as of December 30, 2020.
c See https://www.eia.gov/dnav/ng/hist/n9050us2a.htm; data as of November 30, 2020.
d See https://www.data.bsee.gov/Production/OCSProduction/Default.aspx; data as of December 31, 2020.
TABLE 2-2 U.S. GOM Deepwater Production as a Percentage of All GOM OCS of Oil and Gas Production, 2009–2020
| GOM Deepwater Production | Total GOM OCS Production | % of Deepwater Production of Total GOM OCS Production | ||||
|---|---|---|---|---|---|---|
| Year | Oil, STB | Gas, MCF | Oil, STB | Gas, MCF | Oil | Gas |
| 2009 | 457,552,497 | 1,103,081 | 570,309,328 | 2,451,076 | 80 | 45 |
| 2010 | 460,656,543 | 1,065,132 | 566,628,383 | 2,250,426 | 81 | 47 |
| 2011 | 378,436,357 | 854,653 | 481,697,356 | 1,826,593 | 79 | 47 |
| 2012 | 367,560,384 | 725,123 | 464,791,806 | 1,535,890 | 79 | 47 |
| 2013 | 361,704,729 | 637,924 | 458,988,197 | 1,328,228 | 79 | 48 |
| 2014 | 416,366,555 | 687,821 | 510,467,600 | 1,276,607 | 82 | 54 |
| 2015 | 463,450,899 | 785,208 | 553,006,947 | 1,307,847 | 84 | 60 |
| 2016 | 507,768,232 | 783,258 | 585,712,140 | 1,220,856 | 87 | 64 |
| 2017 | 545,535,166 | 716,010 | 613,670,834 | 1,078,438 | 89 | 66 |
| 2018 | 575,658,938 | 645,676 | 641,955,266 | 993,055 | 90 | 65 |
| 2019 | 629,677,538 | 721,598 | 692,730,312 | 1,034230 | 91 | 70 |
| 2020 | 561,740,780 | 589,545 | 604,999,871 | 803,752 | 93 | 73 |
NOTES: For this table, BSEE defines deepwater as water depth greater than 1,000 feet. GOM = Gulf of Mexico; MCF = 1,000,000 cubic feet; STB = stock tank barrel. Data as of February 1, 2021.
SOURCE: https://www.data.bsee.gov/Production/ProductionData/Summary.aspx.
contracts with other service providers (i.e., contractors) who specialize in the different phases of drilling and production, including seismic assessments of fields, exploration and development drilling, field development, construction, production and processing activity, and the decommissioning of depleted or economically unviable fields.
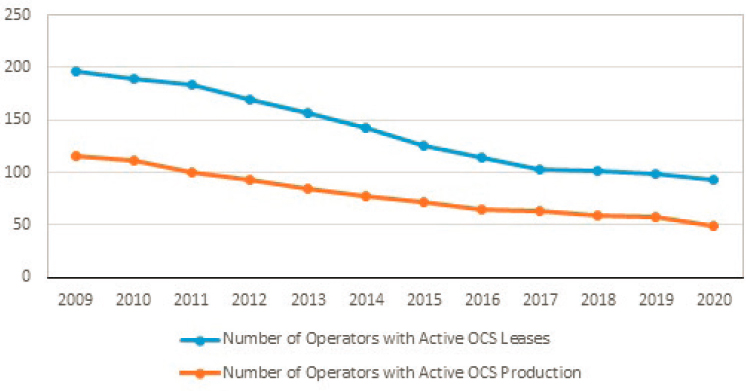
Over the past 30 years, the number of companies holding leases on the OCS and the number of contractors have fluctuated. For instance, 65 companies held leases in 1988 (NRC 1990), nearly 200 in 2009, and fewer than 100 by the end of 2020. For a variety of reasons (e.g., partnerships, business entities, or funding sources), some companies conduct business under the names of multiple designated operators, so the true number of distinct operators can be difficult to identify. Additionally, about half of all operators hold leases that are not actively producing oil and gas. Figure 2-1 shows how the number of operators who are actively producing oil or gas has declined over the past decade, so that by late 2020 only 49 operators had active leases with production.
NOTES: GOM = Gulf of Mexico; OCS = Outer Continental Shelf. Data as of December 1, 2020.
SOURCE: www.bsee.gov.
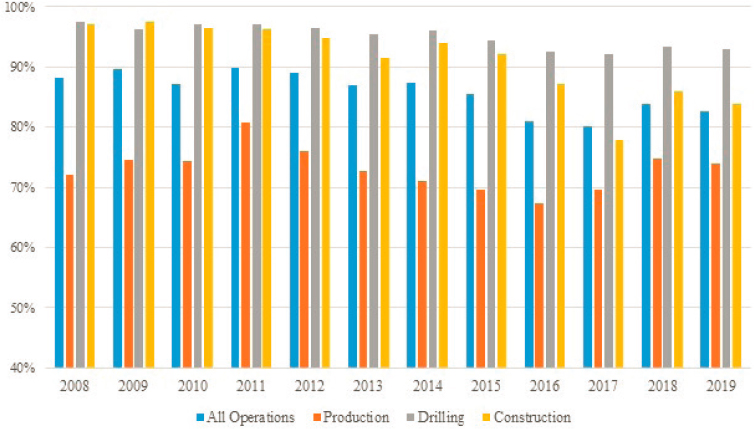
A focus on operators, however, tells only part of the story as most of the active work on the OCS is conducted by scores of contractors and their employees. Data from the BSEE website show the total number of offshore work hours performed by operators and contractors between 2008 and 2019. On average, contractors performed more than 86 percent of all work over this period.2 Accordingly, the contractor workforce is both large and diverse, including specialists in areas as varied as drilling; production operator staffing; crane, vessel, and helicopter operations; diving; welding; painting; mechanical engineering; maintenance; and even catering.3 In some cases, the contractors who hire and oversee these specialists are small companies with a handful of employees, whereas in other cases the contractors themselves are multinational corporations, managing thousands of offshore workers. Like operators, some contractors operate exclusively in the shallow waters of the OCS, whereas others focus on the services needed for deepwater activity (or sometimes both shallow water and deepwater). At any given time, a large offshore facility will have workers provided by multiple contractors, each engaged in its specialized activities.
The two major phases of offshore oil and gas operations are drilling and production, each having its own specialized contractors and workforces. As
___________________
2 Data provided at https://www.bsee.gov/sites/bsee.gov/files/performance-datatable-2010-2019-12-16-2020.pdf.
3 See Dismukes 2010 for an overview of the various companies and activities that support the offshore oil and gas industry.
shown in Figure 2-2, 95 percent of the work related to exploratory and development drilling is performed by contracted workers, compared to 73 percent of production work. For example, when undertaking exploratory and development drilling, the operator generally hires a drilling contractor for a set period of time or for a set number of wells.
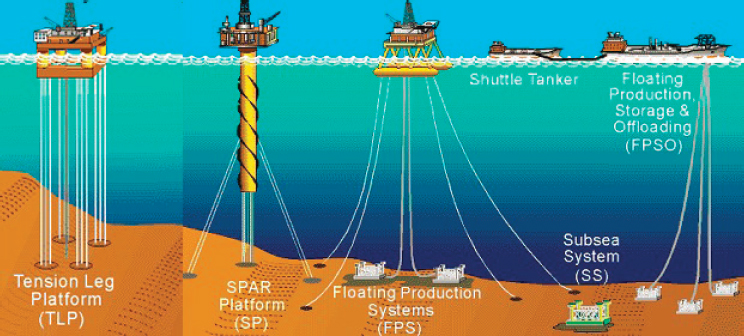
The choice of a contractor will depend on numerous considerations, including the contractor’s experience, capabilities, safety and environmental performance record, and equipment availability (e.g., drilling rig type requirements) relevant to the location, size, water depth, and physical properties of the field and reservoirs. Exploratory and development drilling may be undertaken from several kinds of floating (e.g., Drillships or Semisubmersibles) or bottom-supported (e.g., Jackups) rigs, with rig choice depending on site-specific factors such as water or drilling depth (see Figure 2-3).
Most rigs used for drilling deepwater wells on the OCS are mobile offshore drilling units (MODUs), which are designed for operations in complex subsurface environments with higher temperatures and pressures (see Table 2-3). Even when contracted, the MODUs may be custom built
NOTES: OCS = Outer Continental Shelf. Data are self-reported by industry via BSEE Form 0131. Data for the previous year are not due to BSEE until March 31 of the following year.
SOURCE: www.bsee.gov.
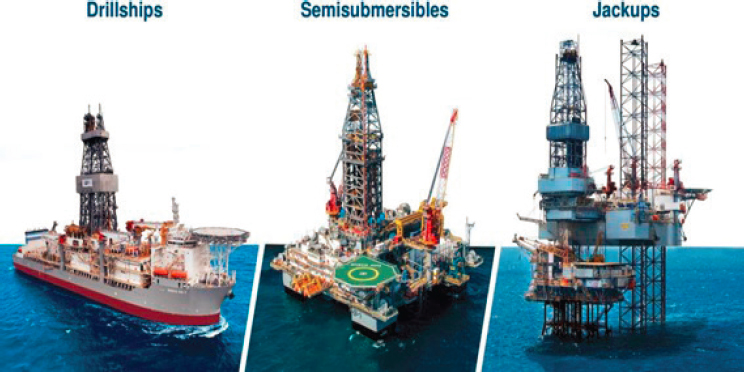
NOTE: Jackups generally operate in depths of less than 500 feet, whereas drillships and semisubmersibles operate in depths of more than 500 feet.
SOURCE: www.bsee.gov.
for their specific application,4 sometimes with the operators coordinating with the drilling contractors during design and construction to incorporate technical advancements.
As a result, rigs that specialize in deepwater drilling can have significant variations in design, instrumentation, controls, and capabilities, requiring specially trained and knowledgeable operating personnel (TRB 2016b). Although the operator’s onboard representatives are ultimately responsible for rig operations, the drilling contractor will generally be responsible for employing the technical personnel charged with maintaining well control and making operational decisions. Also, it is not unusual for the operator or contractor to hire subcontractors for many other specialized and technical services such as mud logging, directional drilling, cementing, and wireline services, as well as the operation and maintenance of mechanical systems and components, such as cranes and generators, and to provide transportation and other support services. Meanwhile, the operator holding the lease will assign onboard representatives (some of whom are contractors) on the rig to oversee the work of the drilling contractor and subcontractors.
Once a field has been explored, evaluated, and determined to be commercially viable, the operating company will prepare a development plan,
___________________
4 More detail about the different generations of MODUs and their individual capabilities is available at http://petrowiki.org/PEH%3AOffshore_Drilling_Units#Rig_Types.2C_Designs_and_Capabilities.
TABLE 2-3 Number of Drilling Rigs on the U.S. OCS by Type, Water Depth, and Year
| Year | |||||||||||
|---|---|---|---|---|---|---|---|---|---|---|---|
| Facility Type | 2009 | 2010 | 2011 | 2012 | 2013 | 2014 | 2015 | 2016 | 2017 | 2018 | 2019 |
| Rigs (platform) total | 33 | 29 | 26 | 28 | 29 | 32 | 28 | 19 | 17 | 18 | 20 |
| Deepwater ≥500 feet | 18 | 19 | 14 | 18 | 16 | 20 | 21 | 15 | 14 | 15 | 18 |
| Shallow water <500 feet | 14 | 10 | 12 | 10 | 13 | 12 | 7 | 4 | 3 | 3 | 2 |
| Rigs (MODU) total | 106 | 89 | 76 | 81 | 84 | 98 | 82 | 60 | 45 | 42 | 44 |
| Deepwater ≥500 feet | 37 | 37 | 30 | 40 | 44 | 61 | 61 | 48 | 34 | 31 | 32 |
| Shallow water <500 feet | 69 | 52 | 46 | 41 | 40 | 37 | 21 | 12 | 11 | 11 | 12 |
| Non-rigs (generic vessels) total | 11 | 10 | 26 | 47 | 63 | 65 | 61 | 47 | 46 | 24 | 10 |
| Deepwater ≥500 feet | 2 | 2 | 2 | 6 | 10 | 9 | 17 | 12 | 10 | 5 | 4 |
| Shallow water <500 feet | 9 | 8 | 24 | 41 | 53 | 56 | 44 | 35 | 36 | 19 | 6 |
NOTES: OCS = Outer Continental Shelf. Discrepancies in the tables due to inconsistencies in the raw data, such as missing or incorrect entries. Deepwater was historically defined as having a depth greater than 500 feet, as in this table. Over the past decade, deepwater is more often defined as water depths greater than 1,000 feet. The historical definition is used here to maintain consistency with other available statistical data.
SOURCE: Data provided by BSEE, December 2020.
leading to the installation of a production platform and facilities supporting hydrocarbon extraction, processing, and transportation operations. Many of the older facilities are in shallow water, closer to shore. Shallow-water facilities can be as simple as a single platform, consisting of a caisson or well protector, or they can be classified as a minor or major platform depending on the amount of production.5 Production facilities may also have multiple platforms or a subsea installation located on the seafloor and connected to a platform that may be several miles away (see Figure 2-4). Larger platforms will generally have lodging rooms and catering facilities for crews, as well as maintenance shops, warehouses, laboratories, and control rooms. Such platforms will have facilities to receive vessels such as supply vessels, anchor-handling tugs, diving support boats, and pipe-laying ships, along with helipads for the air transport of crews and supplies.
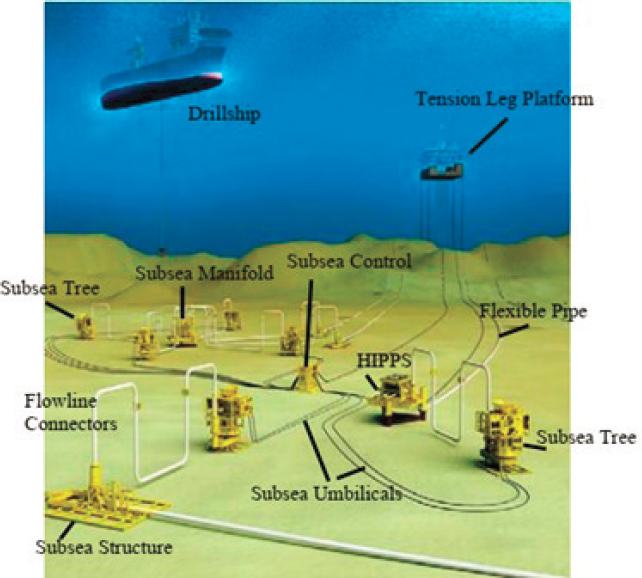
NOTE: HIPPS = high-integrity pressure protection system.
___________________
5 “A major platform is defined as a structure with either six or more completions or zero to five completions with more than one item of production process equipment.” See NTL No. 2006-G04 at https://www.bsee.gov/sites/bsee.gov/files/06-g04.pdf.
SOURCE: www.bsee.gov.
Nearly all of these types of facilities (see Figure 2-5) have operational and safety systems for monitoring and controlling critical equipment such as heat exchangers, pumps, generators, and compressors, as well as sensor, alarm, and automatic shutdown systems for wells, flowlines, and export pipelines.
In most cases, operators will own or lease the production platforms and a majority of the equipment installed on the facility. Operators will nevertheless contract for many of the specific technical and support services that are necessary for the operation of the platform. With the industry movement to deeper water and the increase in well-depth production volumes, installations have tended to become larger and more complex, necessitating even more specialization among companies supplying the needed technologies and services. Although they consist of less than 5 percent of all production platforms, deepwater platforms produce 90 percent of all oil on the GOM OCS (see Table 2-2).6
At any given time, a large deepwater facility can have more than 100 workers, including management, operators, mechanics, electricians, derrickhands, welders, instrument and information technology technicians, medics, cleaners, painters, and cooks as well as workers in supervisory positions. Many of these workers are likely to be employed by different contractors and subcontractors. A challenge for the operating company, therefore, is to maintain a high degree of oversight and integration of systems, processes, cultures, and workforces. This oversight and integration is particularly important inasmuch as many of the processes that occur on
___________________
6 T. Trosclair, BSEE, presentation to the committee, March 2019.
the production platform involve risks, such as the separating and certain processing of oil and natural gas, handling and disposing of produced water and gases, and some storing of the extracted products. Ultimately, operators (and not the contractors) are legally responsible for compliance with BSEE regulations.7
TYPICAL SYSTEM COMPONENTS AND TECHNOLOGIES FOR OCS OPERATIONS
The many engineering, mechanical, process, machinery, instrumentation, and electrical systems used on drilling and production facilities on the OCS demonstrate the complexity of the work and the inspector’s task. This section briefly describes some of the typical drilling and production components but is not intended to be an exhaustive or a comprehensive overview.
Drilling Operation Components
The main purpose of the rig is to safely drill a hole in the ground (see Bommer 2008). The following discussion of the drilling operations reviews several categories of systems common to most drilling rigs, such as power, hoisting, rotating, circulating, and well control.
Power Generating Systems
These systems, typically gas turbines or diesel/electric engines, generate electricity that runs the main components of the facility, such as the hoisting, rotary, electronic and monitoring systems, and circulating systems, as well as other secondary systems not directly related to drilling.
Hoisting System
The hoisting system performs all lifting and lowering activities of drilling equipment and casing or pipe on the rig and includes items such as cranes, masts and derricks, drawworks, catheads, pipe handling equipment, and the blocks and drilling line. Many newer systems are controlled by computers or are automated.
___________________
7 See United States v. Moss, No. 16-30561 (5th Cir. 2017), at http://www.ca5.uscourts.gov/opinions/pub/16/16-30561-CR0.pdf.
Rotating System
The rotating system includes the equipment necessary to rotate the drill bit at the bottom of the wellbore. This equipment consists of the entire drill string and rotary table system on the deck that surrounds the drill string, the downhole motors, and the bit at the bottom of the drill hole. An older, conventional rotary rig includes the swivel, the kelly, and the rotary table as part of the drill string that rotates the drill pipe and drill bit. A top-drive system, used on many modern rigs, incorporates the functions of these three pieces of equipment to apply torque to the drill pipe.
The drill bit is located at the bottom of the drill string, and right above the bit is the bottom-hole assembly, which provides the force on the bit and the ability to control the direction. The bottom-hole assembly consists of equipment necessary to drill the well, such as drill collars, stabilizers, and downhole motors. On older systems, drill pipes were moved to and around the rig floor by elevators, which are hinged mechanisms that can grip and transfer the pipes to their necessary position. Much of this process is automated now, but before the introduction of automation, this pipe handling system required several workers to use large torque wrenches and the rotary table to link pipe together or to break it down. Modern systems use automated systems to rack pipe in the derrick and pick up pipe and move it to the rig floor, as well as an automated floor wrench (sometimes called an iron roughneck) to connect or disconnect the stands of drill pipe as they go in or out of the well.
Circulating System
The circulating system allows for the continuous flow of drilling fluid, also known as “drilling mud,” down through the drill string to the drilling bit and then back up through the annular space—space between drill string and the casing—to the surface for cleaning the debris. This system, consisting of fluid pumps, compressors, distribution lines, storage tanks, storage pits, screen shakers (which remove cuttings), and other cleansing units, allows the drilling fluid to fulfill its primary objectives of operating the drill bit and other downhole tools; cooling and lubricating the drill bit; maintaining well integrity, control, and pressure; removing debris and cuttings; coating the walls of the well; and recirculating drilling fluid.
The system includes specific circulating equipment such as the mud tanks or pits, which hold the drilling fluids. Mud pumps then push the drilling fluid through the swivel, kelly, and rotary table down to the drill string to bottom-hole assembly and to the bit. As the drilling fluid returns to the surface, it travels through the shale shaker to remove larger cuttings and debris before entering the desander and desilter to remove the smaller
solids from the drilling fluid. Finally, the drilling fluid passes through a degasser to remove any gas bubbles that have accumulated or been entrapped during the process and then back to the mud pit to start the circulation process over again.
Well Control System
The well control system prevents the uncontrolled, catastrophic release of fluids from the subsurface formations. This system consists of two main pieces of equipment: the blowout preventer (BOP) and the accumulator. The BOP, also called a BOP stack, is an extremely large assembly of heavy-duty valves that are typically stacked and capable of isolating and controlling the subsurface, high-pressure fluids of the well. Typically, BOPs have different types of valves, such as an annular preventer, pipe rams, blind rams, and shear rams. Depending on design, the BOP usually contains more than one type. Annular preventers are doughnut-shaped elements that prevent the flow of fluid and close the annular space. The pipe rams have a notch for a specific size pipe and can close around the pipe to seal the annular space. Although less common, blind rams can isolate the drill pipe and the annular space by crushing the pipe and pinching it closed. Shear rams isolate the drill pipe and the annular space by shearing off and closing the pipe. There are also variable bore rams that isolate the annular space by wrapping around the drill pipe. The accumulator stores enough compressed energy (e.g., with the use of non-explosive, pressurized gas and hydraulic fluid) to operate the blowout preventers even if the power system of the rig is not operating. Some BOPs will have more than one accumulator.
Production Operation Components
Many systems exist on a production platform and can include some of the following: separation, chemical treatment, water treatment, gas compression, and gas treatment (see Devold 2013). The fluids produced from the well use equipment such as control valves, pressure vessels, manifolds, pumps, mechanical devices, heating systems, gas compressors, power generators, instrumentation, electrical, and lifting components, all of which involve potential safety hazards. To run properly, these components also support many monitoring sensors and gauges that ensure fluid pressure, level, and temperature are properly controlled throughout the process. Deepwater platforms are typically outfitted with a control room and monitoring center, and a staff that monitors these systems 24 hours per day, 7 days per week, and 365 days per year. Some companies can also monitor the systems from an onshore remote real-time monitoring center (TRB 2016b).
Separation Systems
As part of these systems, pressure vessels and/or tanks are commonly used to separate the different parts of the well fluids such as oil, gas, condensates, water, and other residues and sediment. Most separators include multiple vessels or tanks of adequate capacity that operate at different pressures or temperatures during the various stages and allow the controlled separation of the different fluid and gas components. The components of the well fluid have different densities that allow stratification as each moves through the separator with the sediment settling in the bottom. Throughout the process, instrumentation, controls, and valves are used to regulate and monitor the levels, pressures, and temperature of the fluid, such as discharge control valves, pressure relief valves, and emergency shutdown valves. Many of these are safety devices that issue an alert and include valves that can automatically activate if a fluid level, pressure, or temperature strays outside a predetermined low or high range. If initiated, the valve can sound a warning, open a bypass, activate a shut-in, or execute other functions that protect personnel, the component, or the facility.
Treatment Systems
Generally, the residency time for produced oil on more modern deepwater facilities is minimal, due to production volumes. On older facilities, after the initial separation, treatment systems remove additional solids and water left in the oil, and include equipment such as settling tanks, pressure vessels, and electrostatic “treaters.” Settling tanks (also called “gun barrels”) rely on gravity to separate emulsions and are typically found on older facilities. Fired pressure vessels (sometimes referred to as a “heater treater” and usually found on shallow-water facilities) employ an external heat source to hold liquids or gases at a higher pressure than the surrounding pressure. An electrostatic treater, also called a chem-electric or electrochemical treater, uses both heat and chemicals to separate an emulsion.
Water Treatment System
Water from the separation system and oil treatment processes still contains a certain amount of residual oil. The water treatment system receives this water and removes the remaining oil to less than the limit allowed by the government regulator (the U.S. Environmental Protection Agency), before disposing of the treated water at sea or reinjecting it into disposal wells or the producing formation.
Gas Compression Systems
Compression systems are mechanical devices that take recovered gas from the lower pressure production systems and increase the gas pressure to help transport it through pipelines. Offshore compressors are generally based on reciprocating or centrifugal designs (Devold 2013).
Gas Treatment Systems
These systems typically absorb or limit the amount of water vapor contained in the natural gas. The gas must meet specific limits established by the pipeline transport companies before entering the sales pipeline.
Data Management Systems
As noted above, most of the drilling and production systems and processes use data management systems to monitor, collect, store, and report relevant data streams—often in real time—that help to provide more informed and timelier decisions. From optimizing the drilling process and improving reservoir production to reducing maintenance costs of equipment and improving asset management, data management systems help with efficiencies, reduce costs and risks, and improve safety (TRB 2016b).
Guidelines and Standards
While they encounter some uncertainties, drilling rig and production facilities and components must function according to detailed requirements for safe design and operation. The many guidelines, standards, and recommended practices—often mandated by regulations—dictate the necessary equipment and safety devices incorporated.8 The next section describes industry changes in safety processes that have occurred over the past 30 years.
INDUSTRY HISTORY AND APPROACHES TO OFFSHORE SAFETY
While advances in technology have allowed the industry to develop oil and gas fields in deeper waters farther from the shore, this move has exposed the need for the industry to better manage the risks of the human technology interaction. Specialization and organizational complexity have likewise created risks, and so too perhaps has the prevalence of many smaller companies operating aging facilities in shallow water. Throughout its history,
___________________
8 For a list of offshore standards and guidelines, see https://www.api.org/oil-and-naturalgas/wells-to-consumer/exploration-and-production/offshore/api-standards-for-safe-offshoreoperatio.
the offshore industry has analyzed and studied major accidents in order to improve engineering design and operational procedures. Prior to 2000, the offshore industry focused many of its efforts for improving safety on equipment design and operational concerns as newer facilities were constructed on the OCS.
By January 2000, the number of platforms located on the OCS had increased to almost 4,000, with 98 percent located on the shelf (shallow water) and 31 percent of those being more than 25 years old.9 These shelf platforms tend to be older, closer to shore, maintained with smaller crews, and often unmanned or manned only during daylight hours. Although more than half of the platforms on the shelf have been removed since 2000, the average age of the remaining shelf platforms at the start of 2021 was more than 36 years, and 70 percent are at least 25 years old (see Table 2-4).
Older platforms are not necessarily unsound, nor are their systems or components deficient. However, older platforms may require additional inspections of their operating or structural systems. The main concern of aging platforms is more about deteriorating onboard systems and facilities, and less about structural integrity. In comparison, more than 75 percent of deepwater platforms are less than 25 years old; are frequently farther from shore; have more sophisticated instrumentation, controls, monitoring, and safety systems; and are more likely to have personnel on board 24 hours per day and to provide living quarters. While more productive (see Table 2-2), these deepwater wells are often more complicated to drill and produce. Accordingly, their designs, structures, and operations tend to be more complex and costlier, with a larger number of components, and the companies that own and operate them tend to be larger oil and gas production companies. As shown in Table 2-4, the number of shelf facilities has decreased by almost half since 2010, and this reduction could explain a corresponding decrease in the number of components on production facilities in GOM districts such as Lake Jackson and Lake Charles (see Table 2-5). However, the total number of components on production platforms in the remaining three districts (New Orleans, Houma, and Lafayette) has actually increased over the same period.
Ensuring the safety of projects has long been a public concern in countries that permit offshore oil and gas development. The April 2010 loss of well control by the Deepwater Horizon drilling rig led to major changes in the U.S. regulatory regime as well as to reassessments of regimes worldwide.10 Earlier disasters, such as the 1988 explosion of the Piper Alpha platform in the UK sector of the North Sea that killed 167 and the 1980 capsizing of the Alexander L. Kielland rig in the Norwegian sector that
___________________
9 See https://www.data.bsee.gov/Main/Platform.aspx. Data as of December 31, 2020.
10 See Chief Counsel 2011 and NAE and NRC 2012 for additional details.
TABLE 2-4 Total Annual Number of GOM Production Platforms by Age and Water Depth
| All Platforms | Platforms <500 Feet Water Depth | Platforms ≥500 Feet Water Depth | ||||||||||
|---|---|---|---|---|---|---|---|---|---|---|---|---|
| As of Jan. 1 of | Total | Avg. Age | No. >25 Years Old | % >25 Years Old | Total | Avg. Age | No. >25 Years Old | % >25 Years Old | Total | Avg. Age | No. >25 Years Old | % >25 Years Old |
| 2010 | 3,557 | 24.0 | 1,635 | 46 | 3,484 | 24.2 | 1,628 | 47 | 73 | 12.7 | 7 | 10 |
| 2011 | 3,367 | 25.0 | 1,639 | 49 | 3,295 | 25.2 | 1,632 | 50 | 72 | 13.2 | 7 | 10 |
| 2012 | 3,093 | 25.9 | 1,548 | 50 | 3,020 | 26.2 | 1,540 | 51 | 73 | 13.7 | 8 | 11 |
| 2013 | 2,819 | 26.7 | 1,433 | 51 | 2,746 | 27.0 | 1,425 | 52 | 73 | 14.7 | 8 | 11 |
| 2014 | 2,613 | 27.8 | 1,374 | 53 | 2,539 | 28.1 | 1,364 | 54 | 74 | 15.5 | 10 | 14 |
| 2015 | 2,431 | 28.6 | 1,315 | 54 | 2,355 | 29.0 | 1,302 | 55 | 76 | 15.9 | 13 | 17 |
| 2016 | 2,307 | 29.6 | 1,299 | 56 | 2,231 | 30.0 | 1,287 | 58 | 76 | 16.4 | 12 | 16 |
| 2017 | 2,110 | 30.8 | 1,234 | 58 | 2,034 | 31.3 | 1,220 | 60 | 76 | 16.9 | 14 | 18 |
| 2018 | 2,004 | 32.2 | 1,225 | 61 | 1,929 | 32.7 | 1,211 | 63 | 75 | 17.5 | 14 | 19 |
| 2019 | 1,870 | 33.5 | 1,195 | 64 | 1,794 | 34.2 | 1,181 | 66 | 76 | 17.9 | 14 | 18 |
| 2020 | 1,783 | 34.8 | 1,184 | 66 | 1,708 | 35.4 | 1,167 | 68 | 75 | 18.9 | 17 | 23 |
| 2021 | 1,763 | 35.7 | 1,202 | 68 | 1,689 | 36.4 | 1,184 | 70 | 74 | 19.7 | 18 | 24 |
NOTES: GOM = Gulf of Mexico. Discrepancies in the tables are due to inconsistencies in the raw data, such as missing or incorrect entries. Deepwater was historically defined as having a depth greater than 500 feet, as in this table. Over the past decade, deepwater has more often been defined as water depths greater than 1,000 feet. The historical definition is used here to maintain consistency with other available statistical data.
TABLE 2-5 Total Number of Components on GOM Production Facilities by District and Year
| GOM Districts | 2014 | 2015 | 2016 | 2017 | 2018 | 2019 |
|---|---|---|---|---|---|---|
| New Orleans | 24,187 | 24,230 | 25,197 | 25,605 | 25,846 | 26,120 |
| Houma | 19,211 | 19,231 | 21,504 | 22,419 | 23,748 | 23,774 |
| Lafayette | 11,763 | 11,985 | 14,324 | 14,745 | 15,170 | 15,728 |
| Lake Jackson | 10,487 | 10,052 | 9,361 | 8,924 | 8,337 | 8,338 |
| Lake Charles | 9,804 | 9,678 | 10,913 | 10,850 | 9,668 | 9,328 |
| Total | 75,452 | 75,176 | 81,299 | 82,543 | 82,769 | 83,288 |
NOTE: GOM = Gulf of Mexico.
SOURCE: BSEE, National Consolidated Information System.
killed 123, also prompted reevaluations and changes in offshore regulatory regimes abroad (Bennear 2015).
Although disasters rightly attract the attention of policy makers and the public, offshore facilities are subject to a wide range of safety and environmental risks. Low-frequency, high-consequence events, such as the Deepwater Horizon incident, are less likely than other OCS occupational safety hazards that lead to injuries and fatalities, sometimes referred to as “slips, trips, and falls.” Far more common than well blowouts and explosions are helicopter crashes, diving accidents, vessel collisions, crane lifting accidents, and equipment and operational failures that cause human injuries or casualties, property loss, and hydrocarbon spills and releases. While mandated by regulations, offshore incident reporting by every operator might not be consistent by each operator, which makes assessing the safety performance of the industry and its methods of regulation more difficult. Yet, from what has been reported on an annual basis from 2009 to 2019, the United States averaged 3 fatalities, 237 injuries, and 24 spills of 1 or more barrels of oil from offshore incidents, including the Deepwater Horizon disaster in 2010 (see Table 2-6).
As noted above, the offshore industry studied major accidents as a way to improve engineering design and operational procedures. Many reports produced over the past 30 years indicated that accidents were more attributable to human error stemming from inadequate worker training and supervision, an automatic reliance on regulations, or overall poor operating practices and less to do with technological/equipment problems and noncompliance with industry standards. Accordingly, the industry realized that achieving advances in safety required an improved safety culture and a safety management system with a commitment to improved worker training and increased supervision and oversight of work sites. Furthermore,
TABLE 2-6 Number of Incident Types and Consequences on the U.S. OCS Reported by Year
| 2009 | 2010a | 2011 | 2012 | 2013 | 2014 | 2015 | 2016 | 2017 | 2017b 4th Q. | 2018c | 2019 | |
|---|---|---|---|---|---|---|---|---|---|---|---|---|
| Incident Types | ||||||||||||
| Lifting | 185 | 91 | 105 | 143 | 165 | 177 | 138 | 110 | 97 | 26 | 111 | 169 |
| Fires | 144 | 130 | 106 | 141 | 109 | 121 | 92 | 82 | 71 | 15 | 77 | 84 |
| Explosions | 2 | 4 | 1 | 2 | 1 | 4 | 2 | 0 | 2 | 1 | 3 | 4 |
| Musters | 43 | 22 | 31 | 41 | 63 | 49 | 69 | 52 | 71 | 24 | 82 | 87 |
| Gas Releases | 26 | 16 | 16 | 18 | 22 | 10 | 14 | 18 | 9 | 1 | 19 | 20 |
| Collisions | 27 | 8 | 11 | 9 | 18 | 12 | 11 | 6 | 13 | 3 | 6 | 10 |
| Loss of Well Control | 3 | 2 | 5 | 4 | 9 | 4 | 3 | 1 | 0 | 0 | 1 | 2 |
| Incident Consequences | ||||||||||||
| Fatalitiesd | 4 | 12 | 3 | 4 | 3 | 1 | 1 | 1 | 1 | 1 | 1 | 6 |
| Injuries | 239 | 220 | 249 | 282 | 310 | 280 | 290 | 174 | 154 | 37 | 171 | 222 |
| Numbere of Oil Spills >1 bbl | 51 | 28 | 10 | 33 | 24 | 21 | 25 | 19 | 10 | 4 | 19 | 14 |
| Total Volume of Oil Spills >1 bbl | 1,970 | 4,928,371 | 182 | 634 | 42 | 258 | 586 | 2,162 | 16,198 | — | 38 | 46 |
NOTES: bbl = barrel of oil; OCS = Outer Continental Shelf. Data for 2009–2017 reported by fiscal year (FY). Beginning January 1, 2018, data reported by calendar year. Data as of November 25, 2020.
a For FY2010, the number of fatalities includes the 11 people killed and the estimated total volume of oil spilled (4,928,100 bbls) from the Deepwater Horizon explosion.
b 2017 4th quarter calendar year only; Total volume of oil spills not provided for 4th quarter.
c 2018 and 2019 data reported by calendar year.
d In accordance with BSEE regulations, all fatalities are required to be reported; however, not all fatalities are within BSEE’s jurisdiction.
e The numbers in the spills column include spills of oil, drilling mud, and other chemicals.
SOURCE: www.bsee.gov.
achieving a safe work environment required a greater focus on enhanced operating practices and procedures and a reduced reliance on merely just complying with regulations. As reported in previous studies, during the 1990s, the offshore industry continued to focus on equipment design and operational practices and procedures—with accidents still attributed mostly to human error. Yet the industry and the regulator, as explained below, also started to expand their emphasis on safety to include management systems and process safety, which places the focus on the interrelationships among the components of the entire system.11
Also notable over the past 30 years is the decline in the presence of major operators in large areas of the GOM and the proliferation of smaller, independent operators. Many accidents during this time continued to involve entry-level workers, an issue likely worsened by the “increasing turnover rate in the offshore labor market, the growing use of contract personnel, and the emergence of smaller, independent operators without the necessary organizational structure for managing safety” (Priest 2008, p. 150).
As noted in Figure 2-2, contractors and subcontractors have performed a large percentage of the total work on the OCS, and large, midsize, and small operators have used contractors over the past two decades. Although operators are required to use “bridging” documents to coordinate the safety management systems between different contractor companies, such a scenario can lead to potential safety concerns as there are more players in a given location with different understandings of safety procedures, work conditions, and decision-making responsibilities. The high percentage of contractor and subcontractor usage has also meant that there may be less “teamwork” and crew continuity, which has created uncertainty about who had legal responsibility when work was being performed and raised new questions about how to specify safety responsibilities and liability in contract text (TRB 2016a).
Based on recommendations from a previous report (see NRC 1990), industry representatives, through the American Petroleum Institute (API) and in cooperation with the Minerals Management Service, developed and published API Recommended Practice (RP) 75, Recommended Practices for Development of a Safety and Environmental Management Program for Outer Continental Shelf (OCS) Operations and Facilities, and API RP 14J, Recommended Practice for Design and Hazards Analysis for Offshore Production Facilities—a companion hazard analysis document. By the early 2000s, industry groups had examined how the environmental component of API RP 75 could be enhanced, and in response to suggestions, API had expanded RP 75 to incorporate concepts from International Organization for Standardization 14001–Environmental Management Systems. Yet,
___________________
11 For a more complete history, see Priest 2008 and TRB 2016a.
throughout this period, the lack of sufficient safety data has hindered the evaluation of safety improvements in the offshore industry. This lack of a comprehensive database was acknowledged and largely attributed to the inability of offshore regulators “to collect data systematically from all parties involved offshore—operators, independents, contractors, and subcontractors—which limited the ability to analyze trends and help the industry make continuous and timely improvements in offshore safety” (TRB 2016a, p. 77).
As noted above, offshore oil exploration had shifted to the deeper water by the year 2000 and included the discovery of 11 major oil fields located in 7,000 feet of water or deeper. A major challenge for deepwater projects included the need for larger and more advanced equipment and technology to support and monitor conditions at such depths in order to operate and manipulate equipment remotely on the seafloor. This also included a need for blowout preventers capable of containing higher pressures operating at deeper water depths, where reservoir and environmental conditions are more demanding.
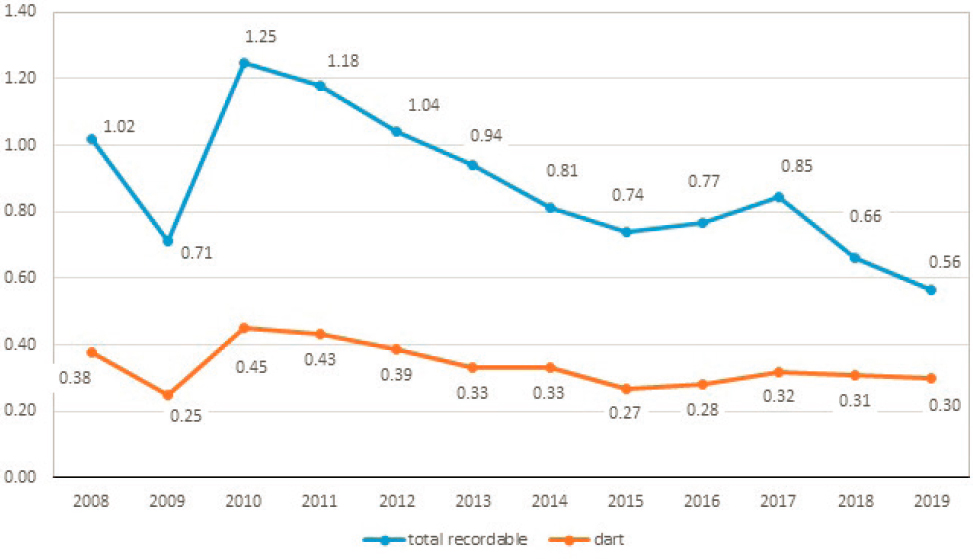
The industry continued into deeper waters of the GOM, and some accidents continued to occur. Yet, overall, there was a downward trend in rates of recordable and lost workday incidents across all segments of the offshore industry (TRB 2016a). According to data from 2000 to 2009, total recordable incident12 rates on the U.S. OCS fell from 2.72 to 0.71 and lost workday incident rates fell from 0.75 to 0.25 (per 200,000 person-hours). Although 2010 experienced an increase from 2009 in both recordable incidents and days away, restricted, and transfer (DART) incidents, there has been a downward trend in incident rates since then.13 Prior to passage of the 2010 Safety and Environmental Management Systems (SEMS) rule, data reported on BSEE Form 0131 was optional.
Figure 2-6 reflects data from 2008 to 2019 and shows that total recordable incident rates decreased from 1.02 to 0.56, and lost workday incident rates fell slightly from 0.38 to 0.30 (per 200,000 man person-hours, which is the equivalent of 100 workers working for 1 year).
Aftermath of Deepwater Horizon Incident
After years of not experiencing a catastrophic incident on the U.S. OCS, a blowout caused by a loss of well control occurred on the Deepwater Horizon drilling rig in April 2010 that led to an explosion and fire. Ultimately, 11 people died from the explosion and, until the well was finally capped,
___________________
12 See 30 CFR § 250.188 for a list of incidents that must be reported to BSEE. See https://www.law.cornell.edu/cfr/text/30/250.188.
13 See data from Figure 3-1, TRB 2016a, p. 78.
NOTES: BSEE = Bureau of Safety and Environmental Enforcement; DART = days away, restricted, and transfer; OCS = Outer Continental Shelf. Prior to the passage of the 2010 SEMS rule, submission of data on Form 0131 was optional. Rates include both company and contractor. Data as of December 20, 2020, and self-reported by industry via BSEE Form 0131.
SOURCE: BSEE Technical Information Management System at www.bsee.gov.
an estimated 4.9 million barrels of oil was released over a 3-month period. The many investigations into the Deepwater Horizon incident all reached the conclusion that a lack of process safety and deficient safety culture were primary causes of the event.14 That conclusion signaled a significant change in the attribution of the causes of such catastrophic incidents. Instead of focusing on individual behavior, these reports emphasize the importance of looking more broadly at the systems designed to promote safety and the culture that supports safe working behaviors (TRB 2016a).
In response to the event, the U.S. oil and natural gas industry launched four joint industry task force groups. The groups would focus not only on the incident but would also examine existing safety procedures and environmental protection for the areas of offshore drilling equipment and operations, and the capabilities of oil spill response and well containment and intervention. The goal of the joint industry task force projects was to evaluate and revise industry guidelines and procedures and identify best practices in offshore drilling operations and oil spill response. Since the 2010 event, API has published more than 200 new or revised standards and recommended practices for offshore drilling exploration and production operations.15
Center for Offshore Safety
An additional response to the Deepwater Horizon event was the creation of the Center for Offshore Safety (COS), an API-affiliated organization, in 2011. COS membership is open to all companies (operators and contractors) operating on the U.S. OCS and was created to focus exclusively on offshore safety on the U.S. OCS.16 Based on information from its members, COS produces an annual performance report with information about safety performance indicators, SEMS performance, and incident data. The information identifies areas for improvement, develops good practices, and ultimately shares learnings to promote continual improvement.17 COS is also a recognized BSEE-approved accreditation body that accredits qualified third-party audit service providers, allowing them to audit the SEMS of an offshore operator. The audit will evaluate whether an operator has implemented SEMS in accordance with API RP 75, COS guidance documents, and BSEE regulatory requirements. COS now receives anonymized SEMS audit findings from all operators, which allows for further analysis.
___________________
14 See Chief Counsel 2011 and NAE and NRC 2012.
15 See https://www.api.org/~/media/Files/EHS/Clean_Water/Oil_Spill_Prevention/AfterMacondo-report-April-2020.pdf.
16 COS mission and objectives are located at https://www.centerforoffshoresafety.org/About.
In December 2019, API released the 4th edition of RP 75, which provides guidance for establishing, implementing, maintaining, and continually improving SEMS for offshore oil and gas operations. This newer edition includes sections on contractors and subcontractors, as well as advancements in technology and advancements to improve risk management.
The Marine Well Containment Company and Helix Well Control Group
To better prepare for a potential well control incident, four major operators founded the Marine Well Containment Company (MWCC)18 in 2010 as an independent, not-for-profit organization. MWCC’s overall mission is to be continuously ready in providing immediate response to a deepwater incident in the GOM to stop any unplanned discharges and capture the liquid aboard its vessels. With its membership now up to 10 operating companies, MWCC represents the majority of deepwater wells and production currently in the GOM. The organization’s containment system and services are available to any operator in the GOM that is a member, or once a nonmember company enters into an agreement designating MWCC as their well containment response provider when filing its drilling permit application with BSEE.
In addition to MWCC, a consortium of GOM deepwater operators and non-operators have come together as the Helix Well Containment Group (HWCG)19 with the common goal of expanding capabilities to respond to a subsea well containment event to protect people, property, and the environment.
Before providing approval for deepwater operations, BSEE, as part of its post-Macondo reforms, now considers whether operators have the capability to contain a subsea blowout such as the one seen in the Deepwater Horizon explosion and resulting spill. Operators must demonstrate that they have access to all necessary equipment for subsea well control and containment, including a capping stack, and membership in MWCC or HWCG satisfies this requirement.
Well Control Institute
The International Association of Drilling Contractors established the Well Control Institute20 in 2013 to provide industry with a forum for working on initiatives with a goal of a single, universal well control training and
___________________
18 See https://marinewellcontainment.com.
19 See https://www.hwcg.org.
assessment standard. This industry organization promotes and encourages safe well control practices and well bore integrity through collaboration among its stakeholders, which includes operators, contractors, equipment manufacturers, regulators, and service providers.
Use of Newer Technologies
As noted in Table 2-1, the quantity of oil produced from the U.S. OCS increased slightly between 2010 and 2019, while total U.S. oil production more than doubled over the same period, mostly from an increase in onshore production sources. With oil market volatility and the high costs and technological demands of developing, designing, building, and managing custom drilling rigs and platforms in deeper water, operators and contractors sought ways to increase efficiency and reduce costs to stay competitive.21 Companies (operators and contractors) commonly introduce newer technologies and development concepts as part of their regular business plans, and lower oil prices made this goal even more important. Over the past 10 years, the annual average price of oil (West Texas Intermediate) has fluctuated from a high of $98.07 in 2013 and a low of $38.56 in 2020 (see Table 2-7).
As a way to reduce costs, companies could be tempted to forgo potential maintenance and safety enhancements in the form of technological improvements. Yet, there can be a positive relationship between a company’s safety record and its financial performance. Profitability can be connected to efficiency, reduced risk, and, ultimately, increased safety (TRB 2016b).
Innovation and advancement of technology can help offshore operations manage risk and function more efficiently, and continual improvements of technologies can help to promote safer offshore operations. For example, with a greater capacity to process information, offshore facilities are utilizing increasing numbers of instrumentation sensors on equipment and are collecting and analyzing considerably more data. Leveraging newer digital technologies provides opportunities to make processes more efficient, resulting in more automation and smaller crews, decreasing nonproductive time on facilities, and improving offshore safety through better decision making. Remote real-time monitoring is one example where operators have started using and monitoring data. The business case for remote real-time monitoring has always been centered on the promise of increased efficiencies and improved risk management that would allow companies to achieve better operational planning and implementation. However, some operators
___________________
21 A recent example is the introduction of drones to inspect offshore facilities. See https://www.houstonchronicle.com/business/energy/article/Drones-taking-off-in-energy-industry15384928.php#photo-19632321.
TABLE 2-7 Average Daily Price of Crude Oil, by Year (dollars per barrel)
| Year | West Texas Intermediate | Europe Brent |
|---|---|---|
| 2009 | $61.95 | $61.74 |
| 2010 | $79.64 | $79.61 |
| 2011 | $95.17 | $111.26 |
| 2012 | $94.18 | $111.57 |
| 2013 | $98.07 | $108.56 |
| 2014 | $92.85 | $98.97 |
| 2015 | $48.83 | $52.32 |
| 2016 | $43.56 | $43.64 |
| 2017 | $50.89 | $54.12 |
| 2018 | $64.88 | $71.34 |
| 2019 | $57.05 | $64.28 |
| 2020a | $38.56 | $41.35 |
a The 2020 average as of December 10, 2020.
SOURCE: https://www.eia.gov/dnav/pet/PET_PRI_SPT_S1_A.htm.
have suggested that onshore monitoring facilities can also improve health, safety, and the environment and their ability to manage their leases, providing an “additional set of eyes” for both drilling and production operations offshore (TRB 2016b). Indeed, the American Bureau of Shipping has provided guidance for use of remote inspection technologies for supporting safer, more effective, and more efficient inspections.22 In fact, for three quarters of 2020 during pandemic travel restrictions, Det Norske Veritas–Germanischer Lloyd (DNV-GL) reports that it conducted more than 4,000 remote surveys for the oil and gas industry, providing a safer and more efficient option for inspections of certain equipment or components.23
SUMMARY
The oil and gas industry has operated offshore for decades. The number of operators on the OCS has grown since 1980, reflecting a larger number of smaller, independent companies. Yet, starting in 2009, the total number of operators has declined by more than half. Contractors still
___________________
22 See https://ww2.eagle.org/content/dam/eagle/rules-and-guides/current/other/242-gnremote-inspection-tech/rit-gn-feb19.pdf.
23 See https://www.dnvgl.com/oilgas/perspectives/remote-survey-a-new-normal-for-oil-andgas.html.
perform a majority of all work on the OCS, including 95 percent of drilling and more than 80 percent of all combined work. The contractor workforce is diverse and specialized, with varied levels of skills, knowledge, and training in multiple technical and service disciplines.
Offshore operations are complex and require the coordination of many service companies. These drilling and production environments also present many challenges and risks. Newer MODUs are typically larger and have greater capabilities and more advanced technologies for working in deeper water and more complex subsurface environments. Although rigs can often vary in capability, much of the equipment and components used are common across rigs and can include hoisting, rotating, and circulating systems. As operations have moved farther offshore and are drilled at increased water depths, often with higher temperatures and pressures, a greater percentage of oil and gas comes from deepwater wells.
Production facilities will often vary between platforms. The design and configuration of a production facility will depend on factors such as water depth, distance from shore, sea conditions, expected volumes of oil or gas, and the need to store hydrocarbons. Over the past 20 years, the number of floating platforms in deeper water has increased, while the number of bottom-founded shallow-water facilities has decreased by more than half. The facilities in deeper water are larger and more costly, with more components, more complex systems, and technology that is more intricate. These larger offshore facilities operate 24 hours per day, 365 days per year, and have enough personnel to support two shifts and as many as two or more different crews that rotate on and off every 12 hours. While the overall number of shallow-water platforms has decreased, the average age of remaining platforms is more than 36 years, with two-thirds of the platforms being at least 25 years old.
REFERENCES
Bennear, L. S. 2015. Positive and Normative Analysis of Offshore Oil and Gas Drilling Regulations in the U.S., U.K., and Norway. Review of Environmental Economics and Policy, Vol. 9, No. 1, pp. 2–22.
Bommer, P. M. 2008. A Primer of Oilwell Drilling: A Basic Text of Oil and Gas Drilling, 7th ed. The University of Texas at Austin.
BSEE (Bureau of Safety and Environmental Enforcement). 2013. Final Safety Culture Policy Statement; Notice. Federal Register, Vol. 78, No. 91, May 10, pp. 27419–27421. https://federalregister.gov/a/2013-11117.
Chief Counsel. 2011. Macondo: The Gulf Oil Disaster. Chief Counsel’s Report, National Commission on the BP Deepwater Horizon Oil Spill and Offshore Drilling.
Devold, H. 2013. Oil and Gas Production Handbook. An Introduction to Oil and Gas Production, Transport, Refining and Petrochemical Industry, edition 3.0. ABB Oil and Gas, Oslo. https://library.e.abb.com/public/34d5b70e18f7d6c8c1257be500438ac3/Oil%20and%20gas%20production%20handbook%20ed3x0_web.pdf.
Dismukes, D. E. 2010. Fact Book: Offshore Oil and Gas Industry Support Sectors. U.S. OCS Study BOEMRE 2010-042. Department of the Interior, Bureau of Ocean Energy Management, Regulation and Enforcement, Gulf of Mexico OCS Region, New Orleans, La. https://www.lsu.edu/ces/publications/2010/2010-042.pdf.
NAE and NRC (National Academy of Engineering and National Research Council). 2012. Macondo Well Deepwater Horizon Blowout: Lessons for Improving Offshore Drilling Safety. The National Academies Press, Washington, D.C.
NRC. 1990. Alternatives for Inspecting Outer Continental Shelf Operations. National Academy Press, Washington, D.C.
Priest, T. 2008. Wake-Up Call: Accidents and Safety Provision in the Gulf of Mexico Offshore Industry. In History of the Offshore Oil and Gas Industry in Southern Louisiana, Vol. I, OCS Study MMS 2008-042 (D. E. Austin, T. Priest, L. Penney, J. Pratt, A. G. Pulsipher, J. Abel, and J. Taylor), U.S. Department of the Interior, Minerals Management Service, Gulf of Mexico OCS Region, New Orleans, La., pp. 139–155.
TRB (Transportation Research Board). 2016a. Special Report 321: Strengthening the Safety Culture of the Offshore Oil and Gas Industry. Transportation Research Board, Washington, D.C.
TRB. 2016b. Special Report 322: Application of Remote Real-Time Monitoring to Offshore Oil and Gas Operations. Transportation Research Board, Washington, D.C.
This page intentionally left blank.


