
5
Distribution and Fate of Plastic Waste in the Ocean
The distribution and fate of plastic waste in the ocean is a reflection of the amount and type of plastic waste that enters the environment from a diversity of sources, the efficiency of its transport from upstream locations to the ocean, and the transport and transformation of the material once it is in the ocean. For this report, the “distribution” of plastic waste is the concentration or abundance of plastics contained in a particular component of the ocean or the Laurentian Great Lakes, including coastal boundaries (Browne et al. 2015, Gray et al. 2018, Wessel et al. 2016), the water column (Choy et al. 2019, van Sebille et al. 2020, Woodall et al. 2015), the seafloor (Goldberg 1997, Williams, Simmons, and Fricker 1993), and within marine biota (e.g., Lusher et al. 2016). The “fate” is the final form of the plastic waste after undergoing physical and chemical transformations, and the permanent or semi-permanent location in the ocean dependent on this physical and chemical fate. Thus, the concepts overlap in defining the location of plastics within the ocean, though distribution may be a reflection of both short- and long-term storage occurring at any given time.
Transformation of plastic waste resulting from physical abrasion, photodegradation, chemical breakdown, or biodegradation will inform plastic waste life cycles, transport, and environmental sinks. This alteration of plastic waste is known to contribute to the generation of micro- and possibly nanoplastics as larger items are transformed ever smaller. The size of plastic waste greatly affects where it will be distributed in the ocean. Quantifying the rate of these transformations is a challenge described in this chapter.
In what form and where plastic waste resides determines its effects on natural, cultural, industrial, and recreational resources at local, regional, national, and global scales. Furthermore, understanding the distribution and fate of plastic waste is critical to informing mitigation strategies (described further in Chapter 7) such as cleanup and recovery options, understanding of global ocean plastic waste sources to achieve prevention, economic policies and other rulemaking, and citizen and consumer interest and engagement.
This chapter presents, synthesizes, and evaluates key information, where available, on the distribution and fate of plastic waste in the marine environment and Laurentian Great Lakes. It also identifies associated knowledge gaps and research opportunities, and reports associated findings. The chapter begins by examining estimates of plastic waste flows to the environment, which includes land, aquatic ecosystems, coastlines, and the ocean. It then describes the various reservoirs of plastic waste in coastlines and estuaries, the water column, seafloor, and aquatic life. Next, it explains the mechanisms involved in the transformation and ultimate fate of plastics in the marine environment. The final two sections present prioritized knowledge gaps and the committee’s findings.
ESTIMATED PLASTIC WASTE INPUTS TO THE ENVIRONMENT
Table 5.1 summarizes estimates of plastic waste inputs to the environment, including land, aquatic ecosystems, coastlines, and the ocean, in the United States and globally. All estimates follow the basic modeling framework first presented in Jambeck et al. (2015), in which data on plastic waste generation and management are used to first estimate the amount of plastic municipal solid waste not collected in formal infrastructure (Jambeck et al. 2015). Nearly all studies, except for Lebreton and Andrady (2019) and Meijer et al. (2021), primarily used global municipal solid waste data compiled and reported by the World Bank. While Jambeck et al. (2015) estimated mismanaged plastic waste generated by coastal populations that entered the ocean, subsequent studies considered waste generated by populations living in inland watersheds, where mismanaged waste could enter and contaminate rivers and other waterways and ultimately reach the ocean. Studies focused on riverine input of plastic waste to the ocean included available (albeit limited) field data to calibrate and test their models (Lebreton et al. 2017, Meijer et al. 2021, Schmidt, Krauth, and Wagner 2017). Later models included additional pathways of plastic waste to the environment, including flows of microplastics (Lau et al. 2020) and export of plastic waste for reprocessing (Law et al. 2020), and Lau et al. (2020) also estimated the impact of the informal sector of waste collectors on the recovery of plastics with market value.
Estimates of global input of plastic waste to the environment vary by orders of magnitude, although few are directly comparable because of differences in modeling approaches, and none are grounded in extensive empirical measurements of plastic waste abundance or transport into the environment. However, these estimates do convey the scale of the problem, with up to 100 million metric tons (MMT) of plastic waste generated in a single year estimated to be uncollected in formal waste management systems globally. In the United States, despite a well-developed formal waste management system, approximately 1 to 2 MMT of plastic waste generated domestically was estimated to enter the environment at home and abroad (after export for recycling) in 2016 (Law et al. 2020).
ENVIRONMENTAL RESERVOIRS OF AQUATIC PLASTIC WASTE
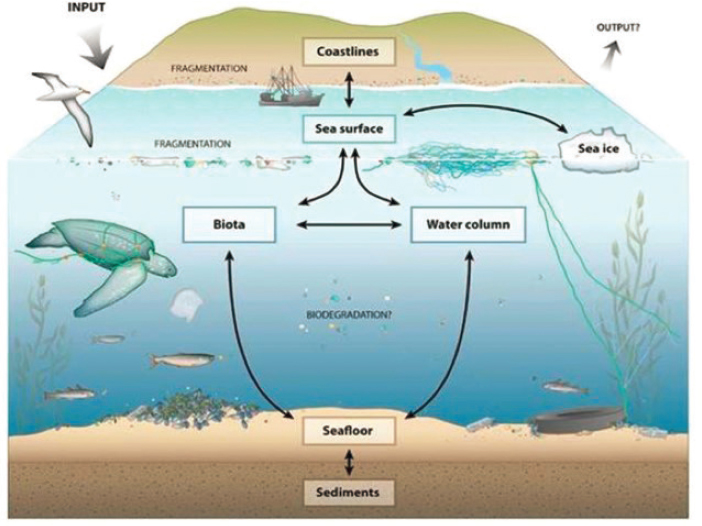
There is an incomplete understanding of the distribution of plastic waste in aquatic (freshwater and seawater) environments, though the question is much investigated. For example, a recent scholarly review of the transport and associated distribution of floating ocean plastic waste cites 400 reference sources or studies (van Sebille et al. 2020). Since the ocean is a large and complex environment, it can be helpful to break it down into smaller components to better study and address plastic pollution at various spatial and temporal scales. These smaller scales can be considered reservoirs because they are regions where plastics are being held. Reservoirs considered in this report include coastlines and estuaries, ocean water column, seafloor, and marine life (Figure 5.1). This conceptualization necessarily involves some imprecision, for example, at the water column–seafloor interface and across stratified but contiguous water column depths. Furthermore, a comprehensive assessment of the amount of plastic waste in any particular environmental reservoir has yet to be achieved.
This section reviews a selection of the scholarly literature to illustrate and explore some of these reservoirs. Information and criteria related to each reservoir reflect its unique nature, as well as available data. This section does not present a comprehensive review of the literature, which continues to grow at a staggering rate. Chapter 4 describes inland reservoirs of plastic waste, which may remain in those areas and are thus not treated in this chapter.
The varying methods and units used across these studies make it difficult to understand the distribution of plastic waste in the ocean. The abundance of plastic waste is typically reported either as mass (weight) of items or as item count. Both measures are important and useful to inform strategies on ocean plastic waste. Mass budgeting is a tool used to assess stocks and flows of waste and is a sensible metric to assess the outcome of
TABLE 5.1 Estimates of Plastic Waste Inputs to the Environment, Including Land, Aquatic Ecosystems, Coastlines, and the Ocean, in the United States and Globally
| Study | Estimate of Plastics Entering Environment (land, aquatic ecosystems, coastline, ocean) | Receiving Environment | USA | Global | Year of Estimate | MSW Not Collected in Formal Infrastructure | Illegal Dumping (USA only) | Littering |
|---|---|---|---|---|---|---|---|---|
| Jambeck et al. 2015 | 4.8–12.7 MMT | Ocean | 2010 | |||||
| 31.9 MMT | Coastline (50-km buffer) | 2010 | ||||||
| 0.04–0.11 MMT | Ocean | 2010 | ||||||
| 0.28 MMT | Coastline (50-km buffer) | 2010 | ||||||
| Lebreton et al. 2017 | 1.15–2.41 MMT | Ocean | 2010 | Unknown | ||||
| Schmidt, Krauth, and Wagner 2017 | 0.47–2.75 MMT | Ocean | 2010 | |||||
| 76 MMT | Land | 2010 | ||||||
| Lebreton and Andrady 2019 | 60–99 MMT | Land | 2015 | |||||
| 0.0029–0.29 MMT | Land | 2015 | ||||||
| Borrelle et al. 2020 | 19–23 MMT | Aquatic ecosystems | 2016 | |||||
| 0.20–0.24 MMT | Aquatic ecosystems | 2016 | ||||||
| Lau et al. 2020 | 9.0–14 MMT | Aquatic ecosystems | 2016 | |||||
| 13–25 MMT | Land | 2016 | ||||||
| Law et al. 2020 | 1.13–2.24 MMT | Land | 2016 | |||||
| 0.51–1.45 MMT | Coastline (50-km buffer) | 2016 | ||||||
| Meijer et al. 2021 | 0.80–2.7 MMT | Ocean | 2015 | |||||
| 67.5 MMT | Land | 2015 | ||||||
| 0.0024 MMT | Ocean | 2015 | ||||||
| 0.27 MMT | Land | 2015 |
NOTE: This table represents best available estimates, which were made using data, methods, and assumptions that vary by study or source. Gray highlighted lines indicate estimates for the United States. MMT = million metric tons, MSW = municipal solid waste.
| Microplastics Input | Informal Sector | Export of Waste | Entire Population | Population in Inland Watersheds (via rivers) | Coastal Population (50 km buffer) | # Countries Included (global estimates only) | Primary Data Source for Plastic Waste (MSW) Estimation |
|---|---|---|---|---|---|---|---|
| 192 countries | World Bank (Hoornweg and Bhada-Tata 2012) | ||||||
| 182 countries | World Bank (Hoornweg and Bhada-Tata 2012) | ||||||
| 233 countries | World Bank (Hoornweg and Bhada-Tata 2012); also Jambeck et al. 2015 | ||||||
| 160 countries | Waste Atlas 2016; Hoornweg and Bhada-Tata 2012; also Jambeck et al. 2015 | ||||||
| 173 countries | World Bank (Kaza et al. 2018); also Jambeck et al. 2015, Lebreton and Andrady 2019 | ||||||
| Unknown number of countries | World Bank (Kaza et al. 2018) | ||||||
| World Bank (Kaza et al. 2018); also USA-specific data | |||||||
| 160 countries | Lebreton and Andrady 2019 | ||||||
source reduction activities. On the other hand, item count is more suitable for impact assessments, especially for microplastics, when the objective is to understand exposure to microplastics relative to natural prey during feeding, for example. Furthermore, abundance may be reported per unit area (e.g., mass or count per square meter or per square kilometer) or per unit volume (e.g., mass or count per liter or per cubic meter). In the absence of standardized field sampling protocols, each investigator appropriately determines the reporting unit(s) for their specific study. However, this creates difficulty when comparing results from different studies that followed different protocols and reported numerical data in different units.
The need for, and challenge of, defining standardized or harmonized (i.e., comparable) sampling and analysis protocols is commonly asserted in the scientific literature (e.g., GESAMP 2019, Hung et al. 2021), and researchers are working to evaluate existing methods (e.g., Hanvey et al. 2017, Löder and Gerdts 2015, Wang and Wang 2018) and to define guiding frameworks to collect data that would better inform risk assessments,
for example (Connors, Dyer, and Belanger 2017). Until a time when such protocols may exist, researchers stress the importance of proper sampling design to address the stated scientific objective, strict quality assurance and quality control measures, and comprehensive reporting of methods utilized in studies quantifying plastic waste (especially microplastics) in the environment (Hermsen et al. 2018, Hung et al. 2021).
Throughout this chapter, the terms “abundance” and “amount” are used to describe quantitative measurements without specifying a particular unit. Interested readers should refer to original studies for further information about reported quantities.
Shorelines and Estuaries
Coastlines, including sandy beaches, rocky shorelines, and estuarine and wetland environments, are the recipients of plastic waste that may be generated locally, carried from inland sources (e.g., rivers, as described in Chapter 4), or brought ashore by storms, tides, or other nearshore processes. Microplastic and macroplastic waste, including litter and abandoned, lost, or otherwise discarded fishing gear (ALDFG), have been reported along coastlines worldwide, including in the United States. Historically, attention has been focused on litter found on sandy beaches (Browne et al. 2015), in part because of the decades-long International Coastal Cleanup (ICC) coordinated by Ocean Conservancy. Since the mid-1980s, when the first cleanup was carried out in Texas, citizen volunteers have participated in a 1-day annual beach cleanup on shores spanning the U.S. states and territories and more than 100 countries worldwide. In 2019, more than 32 million individual items were collected and categorized from more than 24,000 miles of beaches around the globe (International Coastal Cleanup 2020). The Top 10 list (highest number of items collected) has included the same familiar consumer products year after year, including cigarette filters, food wrappers, beverage bottles and cans, bags, bottle caps, and straws. In 2017, for the first time all items on the Top 10 list were composed of plastics (International Coastal Cleanup 2018). In 2013, in response to increasing attention to smaller debris, including microplastics, the category “Tiny Trash (less than 2.5 cm)” was added to the ICC data card.
The National Marine Debris Monitoring Program, which ran from 1996 through 2007 (and continued later under the National Oceanic and Atmospheric Administration’s (NOAA’s) Marine Debris Monitoring and Assessment Project, described in Chapter 6), was a federal beach monitoring program designed by the U.S. Environmental Protection Agency with support from other federal agencies and implemented by Ocean Conservancy, with goals to identify major sources of coastline debris and trends
in the amount of debris over time (Ribic et al. 2010). Regionally coordinated monthly surveys were conducted by trained volunteers to assess the net accumulation of indicator items on beaches across the contiguous United States, Alaska, Hawaii, Puerto Rico, and the U.S. Virgin Islands (U.S. EPA 2002). An analysis of survey data (see Ribic et al. 2010, Ribic, Sheavly, and Klavitter 2012) identified regional differences in amounts and trends of land-based, ocean-based, and general-source debris that were, in some cases, related to presumed drivers of debris sources including population size, land use, and fishing activity. The complexity of the results of these scientific surveys is indicative of the challenges inherent in assessing the amounts, sources, and trends of plastic waste in any environmental reservoir.
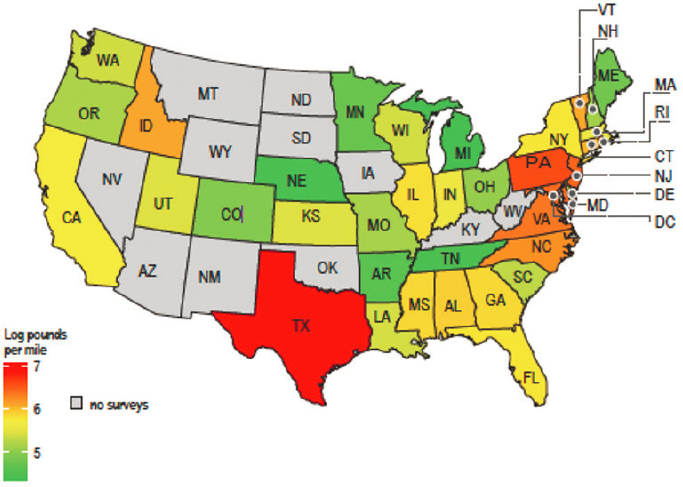
More recently, Hardesty et al. (2017) reported an estimated 20 million to 1.8 billion pieces of plastic debris along the shoreline of the United States, based on a statistical analysis of beach data (average mass per mile of shoreline) from the NOAA Marine Debris Monitoring and Assessment Project, ICC data, and additional survey data collected for the project. In this analysis several states were identified as national “hotspots” for marine debris (see Figure 5.2), possibly related to coastal population density, urbanization (Mid-Atlantic states), transport by coastal currents and wind patterns (Texas), and contributions from inland waterways.
The state of Hawaii is also particularly well known to suffer a disproportionately heavy marine debris burden, not only from locally based marine litter (Carson et al. 2013) but also due to the state’s mid-Pacific Ocean location and associated exposure to widely circulated plastic pollution originating throughout the Pacific Rim (Donohue 2005, Ebbesmeyer et al. 2012, Ingraham and Ebbesmeyer 2001, Kubota 1994, Matsumura and Nasu 1997, McDermid and McMullen 2004, Moy et al. 2018). As a result of oceanic convergence zones, aggregated debris of all types regularly intersects the archipelago, including the northwestern Hawaiian Islands that comprise the uninhabited and remote Papahānaumokuākea Marine National Monument, an area of conservation and cultural importance (Dameron et al. 2007, Donohue et al. 2001, McDermid and McMullen 2004, Morishige et al. 2007, and see Howell et al. 2012).
The aggregation of plastic ALDFG in the nearshore waters and coastlines of the Hawaiian archipelago is particularly destructive as these “ghost” gears and nets entangle marine life of commercial, cultural, and environmental concern (Boland and Donohue 2003, Dameron et al. 2007, Donohue et al. 2001, Donohue and Foley 2007, Henderson 2001). Fishing gear becomes abandoned, lost, or otherwise discarded for many reasons such as adverse weather; gear conflicts; “operational fishing factors including the cost of gear retrieval; illegal, unreported, and unregulated fishing; vandalism/theft; and access to and cost and availability of
shoreside collection facilities” that may incentivize deliberate at-sea disposal (Macfayden, Huntington, and Cappell 2009). Worldwide, industrial trawl, purse-seine, and pelagic longline fisheries are estimated to lose a median of 48.4 kt (95% confidence interval: 28.4 to 99.5 kt) of gear during normal fishing operations annually (Kuczenski et al. 2022). This estimate, based on fishing activity in 2018, did not include abandoned or discarded gear; other gear known to become derelict such as pots and traps, poles and lines, and driftnets/gillnets; or gear from nearshore and small-scale fisheries (Kuczenski et al. 2022). By percentage, a separate study estimated annual ALDFG worldwide at 5.7% of all fishing nets, 8.6% of all traps, and 29% of all lines (Richardson, Hardesty, and Wilcox 2019).
At least 46% of the debris (by mass) in the Great Pacific Garbage Patch, an area of ocean plastic accumulation in waters between California and Hawaii, is estimated to be ghost gears and nets (Kuczenski et al. 2022, Lebreton et al. 2018). In 2007, it was estimated that 52 metric tons of ALDFG accumulate each year in the northwestern Hawaiian Islands alone (Dameron et al. 2007); more current estimates are unavailable. Furthermore, plastic debris is known to increase the susceptibility of reef-building corals to disease (Lamb et al. 2018) and was recognized at least as early as 2001 as a threat to Hawaiian coral reef ecosystems (Donohue et al. 2001).
Marine debris on Hawaii’s coastlines is not limited to ALDFG. A 16-year study from 1990 to 2006 on one small atoll islet at French Frigate Shoals in the Papahānaumokuākea Marine National Monument documented more than 50,000 marine debris items with an annual deposition ranging from 1,116 to 5,195 items per year (Morishige et al. 2007). Morishige et al. (2007) reported that more than 70% of these items were composed of plastics. Smaller plastics, including microplastics, are also increasingly known to be found on the coastline and nearshore Hawaiian Island environments with potentially dire effects (Gove et al. 2019, McDermid and McMullen 2004, Morishige et al. 2007). On Hawaii’s most visited and populous island, Oahu, beach microplastic densities of up to 1,700 particles per square meter have been documented—among the highest worldwide on remote island beaches (Rey, Franklin, and Rey 2021).
Alaska coastlines are also a known reservoir for significant amounts of plastic debris (Merrell 1980, Polasek et al. 2017). As early as 1974, 349 kg of plastic litter per kilometer of beach was recorded on Amchitka Island in the Aleutian Island chain (Merrell 1980). In one study, 80 km of coastline in five national park service units in Alaska were cleaned of more than 10,000 kg of debris, the majority of which was composed of plastics (Polasek et al. 2017), a finding consistent with earlier seabed studies offshore of Kodiak Island, Alaska (Hess, Ribic, and Vining 1999). Plastic waste on Alaska beaches is often characterized by large, buoyant objects
of maritime origin such as lines, buoys, and fishing nets that are likely wind- and current-driven to shore (Pallister 2012).
Several major estuaries and inland freshwater waterways in the United States have been surveyed for plastic debris, especially microplastics in the water column or buried in sediments (studies and their results detailed in Appendix D). These studies are widespread geographically—carried out in California (Los Angeles, San Francisco), the Pacific Northwest, and along the eastern seaboard from New York to Florida, as well as in regions far from the ocean (Illinois, Montana, Wyoming, Wisconsin, western Virginia). While these are a small number of studies relative to the number of estuaries and rivers in the United States, they have found microplastics to be ubiquitous.
In two estuary studies, particle concentrations were higher after rainfall or storm events (for San Francisco Bay, see Sutton et al. 2019; for Chesapeake Bay, see Yonkos et al. 2014), whereas in a study of the inland Gallatin River basin (Montana and Wyoming), microplastic concentration was inversely related to discharge, suggesting that microplastic sources
are decoupled from discharge sources (Barrows et al. 2018). Studies in the metropolitan Chicago area found, at most sites, a higher microplastic abundance downstream of wastewater treatment plant outfalls than upstream, although no change in concentration was detected with increasing distance downstream (Hoellein et al. 2017, McCormick et al. 2016). A wide range of particle types, or forms, were reported across studies, with the proportion of fibers, fragments, pellets, films, and foams variable in each study. Some studies reported an abundance of polyethylene, polypropylene, and/or polystyrene, which are all polymers used extensively in packaging and other single-use applications. Direct comparison of results across studies is made difficult by differences in sampling methods, including particle sizes collected (dependent on net mesh size), sediment volumes or masses collected, and number of samples collected at a location (one-time versus repeated samples over time).
Plastic debris has also been well documented in the Laurentian Great Lakes, including in major Great Lakes tributaries, on shorelines, in surface water, and in benthic sediment (see systematic review by Earn, Bucci, and Rochman 2021). Individual studies reported plastic abundances comparable to or higher than those in ocean environments, with similarly large variation within studies due to environmental variability, and between studies due to different sampling and analysis methods (Earn, Bucci, and Rochman 2021). In one study, following similar methods to those estimating plastic input to the ocean (see Table 5.1), an estimated 10,000 metric tons of plastic debris from mismanaged solid waste entered the Great Lakes from the United States and Canada in 2010 (Hoffman and Hittinger 2017). In the same study, using a hydrodynamic model calibrated with field data, the authors identified likely accumulation zones across the Great Lakes and predicted the highest mass of floating plastic debris in Lake Erie (4.41 metric tons), followed by Lake Huron (1.44 metric tons) and Lake Superior (0.0211 metric tons).
Ocean Water Column
Floating Plastics
Some of the earliest reports of plastic debris in the ocean described small particles floating at the sea surface in estuarine (Kartar, Milne, and Sainsbury 1973), nearshore (Buchanan 1971, Carpenter and Smith 1972), and offshore waters of the North Atlantic Ocean (Carpenter et al. 1972) and large, identifiable objects (plastic bottles, balloon, sandal) floating in the open ocean of the North Pacific (Venrick et al. 1973). A more recent reanalysis of data from the North Atlantic Ocean and adjacent seas found that plastic contamination by large, entangling debris occurred as early
as the 1950s, with significant increases observed in subsequent decades (Ostle et al. 2019). Since the 1970s, the majority of studies of the abundance and distribution of plastic marine debris have sampled the sea surface using plankton nets of varying types (van Sebille et al. 2015). The longest continuous data sets have been collected by undergraduate Sea Education Association Semester students sailing in the western North Atlantic since the mid-1980s (Law et al. 2010) and in the eastern North Pacific Ocean since 2001 (Law et al. 2014). The widespread coverage of surface plankton net data reported by a multitude of international research groups has allowed scientists to assess the large-scale accumulation of floating debris across ocean basins, which occurs in subtropical convergence zones centered around 30° latitude in ocean gyres in both the northern and southern hemispheres. These accumulation zones, commonly referred to as “garbage patches,” are mainly composed of microplastics that have broken apart from larger items, although large floating debris (especially derelict fishing gear, including nets, floats, and buoys) is also found in these regions. The origin of these debris items (especially microplastics) typically cannot be determined except in rare instances, such as after the 2011 Tohoku earthquake and tsunami in Japan. Debris from this event, such as docks, vessels, and buoys, was identified for many years afterward, floating on the sea surface and washing ashore in Hawaii and North America (Carlton et al. 2017).
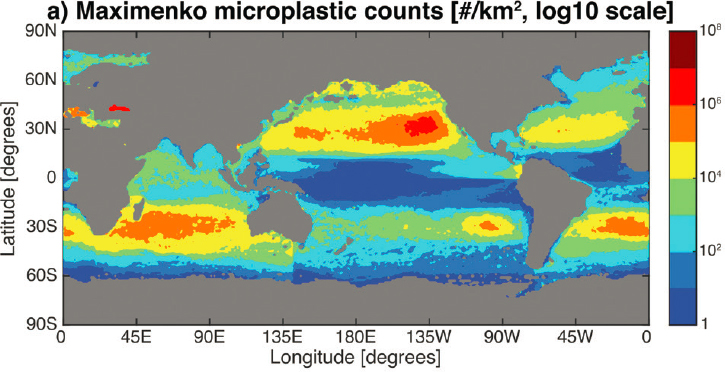
Contrary to common misperceptions of “garbage patches,” floating plastic debris is not aggregated in a single large mass in the subtropical gyres but instead is dispersed across an area estimated to be millions of square kilometers in size (Lebreton et al. 2018). Even within the accumulation zones, particle concentrations (measured using plankton nets) can vary by orders of magnitude across spatial scales of tens of kilometers or less (Goldstein, Titmus, and Ford 2013), driven, at least in part, by physical transport processes creating small-scale convergences that are difficult to predict (see Figure 5.3).
Global estimates of the mass of floating plastics at the ocean surface have been made by synthesizing and extrapolating field data (Cózar et al. 2014), and with field data in combination with models of wind-driven ocean circulation to account for dispersal and variability across the ocean (Eriksen et al. 2014, van Sebille et al. 2015). Estimates vary depending on the data set used and data analysis methodologies, and range from 7,000–35,000 tons (6,350–31,751 metric tons) (Cózar et al. 2014) to 93,000–236,000 metric tons of microplastics (van Sebille et al. 2015), to 268,940 tons (243,980 metric tons) of microplastics and larger items (Eriksen et al. 2014) at the global ocean surface. All estimates of the mass of plastic waste in this sea surface “reservoir” have been only a small fraction of the estimated input of plastic waste to the ocean in a
single year (Jambeck et al. 2015). There are many possible explanations for this discrepancy. One explanation is the incomplete measurement of the size spectrum of floating plastic waste using plankton nets (which typically sample items from ~0.33 to 1 m) compared to visual observations by observers on ships or in aircraft, in which case only larger debris is detected because detection is dependent on the distance from observer to object. Furthermore, visual surveys are very resource-intensive and typically cover only small areas over short time periods. Bulk water samples filtered on very fine mesh filters have identified particles as small as 10 µm (Enders et al. 2015); however, sample volumes are very small and relatively few samples of this kind have been collected. Thus, the abundance and distribution of floating plastics across the known size spectrum (microns, and possibly nanometers, to many meters in size) is a major knowledge gap.
Suspended Plastics in the Water Column
Microplastics and occasional larger items, such as plastic bags, have also been detected in the water column between the sea surface and the seafloor. Vertical mixing of the water column driven by wind energy can distribute
buoyant plastics to depths of tens of meters or greater (Kukulka et al. 2012, Reisser et al. 2015), and interactions with organic matter and biota may also cause initially buoyant particles to become dense enough to sink. A study in the nearshore environment of Santa Monica Bay, California (depths up to 15 m) found plastics larger than 0.333 mm at all depths sampled (Lattin et al. 2004), whereas a coastal survey off the U.S. West Coast only measured subsurface plastics (sampling to 212-m depth with plankton nets) in one out of four seasonal surveys (winter survey) (Doyle et al. 2011). Discrete water samples collected from remotely operated vehicles in Monterey Bay, California collected microplastics at 10 depths between 5 m and 1,000 m, with the highest concentrations (up to 15 particles per m3) found between 200- and 600-m depth (Choy et al. 2019). In this study, the majority of microplastics were composed of polyethylene terephthalate (PET) and polyamide, polymers denser than seawater. Furthermore, eight discarded mucus feeding structures (“sinkers”) of filter-feeding giant larvaceans and the gastrointestinal tracts of 24 pelagic red crabs examined in this study all contained microplastics. The known distribution and feeding behaviors of these animals are consistent with intake of microplastics between 100- and 200-m depth, indicating important interactions with organisms in pelagic ecosystems and a potential mechanism for vertical transport of microplastics to the seafloor (e.g., in sinkers).
Seafloor
Macroplastics and microplastics have been found in benthic environments around the world. Observed concentrations vary greatly, suggesting that source proximity and water currents and seafloor topography acting as concentrating mechanisms may play important roles in determining benthic loading.
Kuroda et al. (2020) conducted 63 surveys for seafloor marine debris in three areas of the waters off Japan between 2017 and 2019, using bottom trawls with 60- to 70-mm mesh nets at depths ranging from 67 to 830 m. The surveys identified debris concentrations averaging 2,962 items (53 kg) per km2 in Hidaka Bay to 81 items (9 kg) in the East China Sea. Of all debris items, plastics accounted for 89% in Hidaka Bay, 69% off Joban, and 34% in the East China Sea. Based on information from labels on several debris items, Kuroda et al. (2020) estimated that about 30 years had elapsed between their manufacture and their retrieval from the seafloor. Comparison by Kuroda et al. (2020) to other studies in Japan and in Europe confirmed that plastics frequently account for the largest percentage of debris on the seafloor, though the percentage varies by location, from 22.2% (Hakata Bay, see Fujieda 2007) to up to 95% (eastern Mediterranean, see Ioakeimidis et al. 2014).
Peng et al. (2020) reviewed studies of the concentration of microplastics in seawater, beach sands and marine sediments, and marine biota. Abundance measurements varied greatly, which may provide a rough understanding of geographic variation, though they did not reflect standardized sampling methodologies, analyses, or units of measure. Smaller quantities have been detected in marine sediments in the Arctic (Kanhai et al. 2019) and Antarctic (Reed et al. 2018). Not surprisingly, higher, though variable, abundances are found near more populated areas (for Mediterranean Sea, see Guven, Gökda![]() , and Kideys 2016; for North Sea, see Lorenz et al. 2019; for Plymouth, UK, see Thompson et al. 2004). Some studies that have measured microplastics in the water column and sediment have found higher abundances in sediments, suggesting the sediment is a significant sink for microplastics as they deposit over time (Kanhai et al. 2019, Song et al. 2019; however, see Zheng et al. 2019 for a reverse situation).
, and Kideys 2016; for North Sea, see Lorenz et al. 2019; for Plymouth, UK, see Thompson et al. 2004). Some studies that have measured microplastics in the water column and sediment have found higher abundances in sediments, suggesting the sediment is a significant sink for microplastics as they deposit over time (Kanhai et al. 2019, Song et al. 2019; however, see Zheng et al. 2019 for a reverse situation).
Nanoplastics have been identified in seawater using the presence of chemical markers (ter Halle et al. 2016), but their concentration and distribution have not been well resolved (Piccardo, Renzi, and Terlizzi 2020) as methods do not yet exist to directly detect and identify nanoplastics in the environment.
Benthic organisms may be impacted by exposure to deposited plastics and to toxic additives to the plastics. For example, hexabromocyclododecanes (HBCDs) are flame retardants commonly used as additives with expanded polystyrene and extruded polystyrene foam insulation, and with textile coatings. HBCD has been found in marine sediments (de la Torre et al. 2021, Klosterhaus et al. 2012, Sutton et al. 2019) and Laurentian Great Lakes sediments (Yang et al. 2012).
Marine Life
The intersection of the distribution of aquatic plastic waste, as well as its abundance, and freshwater and marine wildlife habitat use necessarily informs how and to what extent organisms encounter and entrain this pollution. The nexus of marine life and the distribution and fate of aquatic plastic waste has been illustrated through two primary mechanisms: ingestion/egestion of and entanglement in plastic waste by living organisms (Gall and Thompson 2015, Gregory 2009, Kühn, Bravo Rebolledo, and van Franeker 2015, Kühn and van Franeker 2020, Laist 1997, Shomura and Yoshida 1985). Ingestion is the taking in or consuming of food or other substances into the mouth or body. Egestion is discharging or voiding undigested food or other material, such as through feces or vomiting. One review by Kühn and van Franeker (2020) found documented cases of entanglement or ingestion by marine biota in 914 species
from 747 studies—701 species having experienced ingestion and 354 species having experienced entanglement. When ocean- or lake-borne plastic waste becomes bioavailable to and is ingested by living organisms, they may serve as de facto vectors. As vectors, they could potentially distribute plastics through complex ecological mechanisms, such as foraging strategies, diurnal or seasonal movements, or via trophic transfer. The distribution and fate of ocean plastic waste thus both affects and is affected by the marine lifescape in ways not fully understood.
Ingestion of Plastics
The ingestion of plastic waste by aquatic life has been documented for hundreds of species (e.g., Figure 5.4, Kühn, Bravo Rebolledo, and van Franeker 2015, Kühn and van Franeker 2020). It occurs at spatial scales ranging from the planktonic ingestion of microplastics and nanoplastics
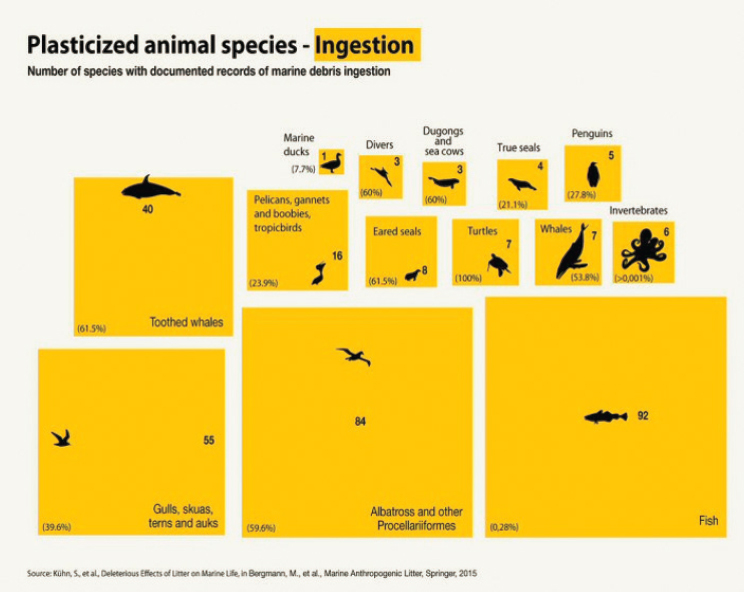
(Botterell et al. 2019, Desforges, Galbraith, and Ross 2015, Lee et al. 2013, Sun et al. 2018) to the ingestion of all sizes of plastic debris by whales (Alzugaray et al. 2020, Baulch and Perry 2014, Besseling et al. 2015, de Stephanis et al. 2013, Im et al. 2020, Jacobsen, Massey, and Gulland 2010, Lusher et al. 2017, Unger et al. 2016). Nearly 60% of all whale and dolphin species have been shown to ingest debris with associated fatal results in up to 22% of stranded animals (Baulch and Perry 2014, de Stephanis et al. 2013, Jacobsen, Massey, and Gulland 2010). Figure 5.4 shows one global estimate of plastic ingestion by terrestrial, freshwater, and marine animals.
Entry of plastics into the ocean food web can occur when environmental plastics are consumed by organisms as a putative food source (Cadée 2002, Campani et al. 2013, Carr 1987, Lutz 1990, Mrosovsky, Ryan, and James 2009, Provencher et al. 2010, Ryan 1987, Schuyler et al. 2012, 2014, Tourinho, Ivar do Sul, and Fillmann 2010), via plastic-contaminated prey (Bourne and Imber 1982, Cole et al. 2016, Ryan 1987, Ryan and Fraser 1988), or indirectly through ambient seawater or sediments during foraging or other encounters (Beck and Barros 1991, Bravo Rebolledo et al. 2013, Di Beneditto and Ramos 2014, Murray and Cowie 2011). The interaction among such variables as availability of plastics in the environment, prey resemblance to plastics, prey selection, and the nutritional state of an organism has been hypothesized to increase the risk of plastic ingestion by individual organisms, a hypothesis largely supported by studies to date (reviewed by Santos, Machovsky-Capuska, and Andrades 2021). The preferential ingestion of plastics by some organisms has been shown to result from plastics’ size, color, shape, age, abundance, or a combination of these factors (e.g., Botterell et al. 2019, Lavers et al. 2020, Lee et al. 2013). In certain seabirds, and perhaps other marine wildlife, plastic ingestion has been hypothesized to be facilitated by an olfactory signal—emanating from a complex biofilm that develops on aquatic plastic particles—that attracts birds to floating plastics (Savoca et al. 2016), though questions remain (Dell’Ariccia et al. 2017). When an organism’s traits or behaviors become maladaptive in the face of environmental change it is termed an evolutionary trap; plastic ingestion has been identified as an evolutionary trap as a result of the availability of environmental plastics, plastics’ mimicking of food options, and the proclivity of organisms to ingest plastics (Santos, Machovsky-Capuska, and Andrades 2021).
High concentrations of both microplastics and microscopic larval fish and invertebrates have been found in oceanographic features known as surface slicks, which are “lines of smooth water on the ocean surface” (Gove et al. 2019, Whitney et al. 2021). This discovery raises concerns regarding the trophic transfer of these plastics and associated toxins within the food web and ultimately to humans (Gove et al. 2019).
The presence of plastics in the excrement of secondary and tertiary marine predators has been offered as empirical evidence of trophic transfer in both captive (Nelms et al. 2018) and wild marine mammals (Donohue et al. 2019, Eriksson and Burton 2003, Le Guen et al. 2020, Perez-Venegas et al. 2018, and see Perez-Guevara, Kutralam-Muniasamy, and Shruti 2021 for a recent review of microplastics in fecal matter).
Plastic ingestion has been documented in the Laurentian Great Lakes, though a recent systematic review of the scientific literature demonstrates that the body of knowledge on plastics’ effects on freshwater biota lags that which is known for the marine environment (Earn, Bucci, and Rochman 2021). Studies of the effects of plastics on freshwater biota have been predominantly laboratory based and hence not readily applied or extrapolated to the complexity of real-world conditions, among other caveats (Earn, Bucci, and Rochman 2021). Nonetheless, Earn, Bucci, and Rochman (2021) report that 60% of studies reviewed detected effects of plastics on freshwater biota (Earn, Bucci, and Rochman 2021). Notably, a recent study of fish in Lake Superior and Lake Ontario documented some of the highest abundances of microplastics and other anthropogenic particles in bony fish (marine or freshwater) reported to date (Munno et al. 2021). Of the two lakes, Lake Ontario fish had the greatest mean number of anthropogenic microparticles at 59 ± 104 standard deviations per fish and the greatest number to date in a single fish at 915 microparticles (Munno et al. 2021). Plastics in seafood being sold for human consumption have also been documented both in the United States (Rochman et al. 2015) and abroad (Naji, Nuri, and Vethaak 2018, Rochman et al. 2015, van Cauwenberghe and Janssen 2014), highlighting a potential route of trophic transfer of plastic contaminants to humans (Smith et al. 2018). Microplastics in particular have been identified as an emerging permanent contaminant of increasing concern in seafood (Farady 2019), though understanding of the relevance of this pollution to human health via seafood consumption is presently limited (Dawson et al. 2021).
Once entrained in aquatic food webs, within the bodies and tissues of living organisms across diverse taxa, plastic waste is subject to a diversity of spatiotemporal distribution mechanisms. An example is the transport of ingested plastic vertically in the water column through the diurnal vertical migration of zooplankton and fish, termed the “plastic pump.” This plastic pump is also postulated as a mechanism by which plastics are delivered from shallower waters to the deep ocean including through fecal pellets (Choy and Drazen 2013, Cole et al. 2016, Katija et al. 2017, Lusher et al. 2016, van Sebille et al. 2020, Wright, Thompson, and Galloway 2013). As such, zooplankton have been postulated as a reservoir for microplastics (Sun et al. 2018), as have the water column and animals of the deep sea (Choy et al. 2019, Hamilton et al. 2021).
Animals that demonstrate high site fidelity to particular geographic locations, such as nesting or birthing sites, but ingest plastics during distant foraging may transport and distribute ingested plastics long distances upon their return (Buxton et al. 2013, Le Guen et al. 2020). The intergenerational transfer of plastics in seabirds that regurgitate ingested plastics to feed chicks has been known since the 1980s (Pettit, Grant, and Whittow 1981, Ryan 1988, Ryan and Fraser 1988). An additional example is the transport and distribution of microplastics by northern fur seals (Callorhinus ursinus) in the eastern North Pacific Ocean (Donohue et al. 2019). These seals forage offshore, returning to land in repeating cycles to rest, breed, or attend to their pups (Gentry and Kooyman 1986) and distribute microplastics ingested during foraging to novel locations, as feces containing microplastics are deposited on land (Donohue et al. 2019).
The biotic distribution of microplastics can also occur at smaller geographic scales, for example, through the sedimentary ingestion and subsequent concentrated egestion of microplastics by the sea cucumber (Holothuria tubulosa) (Bulleri et al. 2021). Bulleri et al. (2021) show that microplastic resuspension rates in the water column are greater from sea cucumber fecal material than surface sediments, facilitating microplastic bioavailability (Bulleri et al. 2021). While not an exhaustive treatment, the above examples demonstrate the diversity of taxa that may serve as reservoirs of ocean plastic waste and highlight the importance of considering marine life when addressing the distribution and fate of environmental plastic waste.
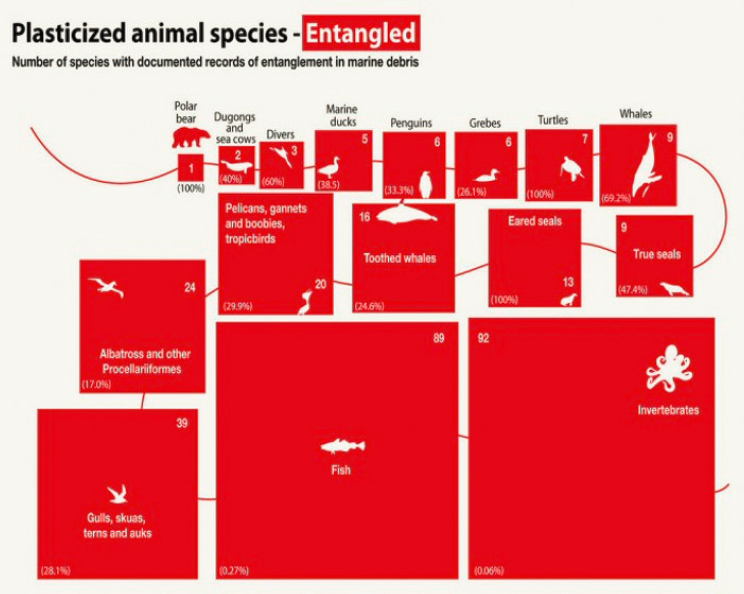
Entanglement in Plastics
The prevalence and distribution of ocean plastic waste is reflected in the ever-increasing number of species with plastic entanglement records—354 species by 2019, including birds, marine mammals, turtles, sea snakes, fish, and invertebrates (Kühn and van Franeker 2020, Kühn, Bravo Rebolledo, and van Franeker 2015; see also Figure 5.5). As with ingestion of plastics, studies of entanglement and other impacts of environmental plastics in freshwater systems have lagged those in marine systems, with assertions that freshwater impacts have been both underestimated and understudied (Blettler and Wantzen 2019). Entanglement in plastics, primarily derelict and operational/active fishing gear, has been identified as a primary threat to the endangered Hawaiian monk seal (Neomonachus schauinslandi) (Boland and Donohue 2003, Donohue et al. 2001, Henderson 2001) and North Atlantic right whale (Johnson et al. 2005, Knowlton and Kraus 2001, M. L. Moore et al. 2021, Myers and Moore 2020).
Entanglement of marine life in ocean plastic waste may distribute this pollution via the active or passive movement of living or dead entangled organisms across aquatic habitats, though the frequency and
ramifications of this mode of plastic waste distribution and transport are essentially unstudied. Scholarship has, understandably, focused primarily on understanding or documenting the effects of marine debris parameters (e.g., distribution, density) on individual species and biodiversity (e.g., Woods, Rødder, and Verones 2019). Seals entangled in derelict fishing gear are routinely observed returning to land with associated injuries such as deep and advanced wounds (Allen et al. 2012, Boren et al. 2006), suggesting they have been entangled for some time transporting the entangling net, line, rope, or other plastic waste with them. Individual North Atlantic right whales entangled in fishing gear are known to have carried the entangling debris on average at least 10 months and it is speculated that as the animals starve, lose body fat, and become denser, they sink at death, both concealing this marine debris-mediated mortality and distributing plastic debris to depth (Moore et al. 2006). In addition to the grave animal
welfare issue entanglement presents (Butterworth, Clegg, and Bass 2012, Knowlton and Kraus 2001, Moore et al. 2006), the movement of ocean plastic waste by entangled organisms may also transport and distribute any living organisms present on the plastic waste, such as potentially invasive species (Kiessling, Gutow, and Thiel 2015, Miralles et al. 2018, Rech et al. 2018, Vegter et al. 2014) and novel viral or bacterial assemblages (Amaral-Zettler et al. 2016, Barnes 2002, Keswani et al. 2016, Kirstein et al. 2016, Masó et al. 2003, Zettler, Mincer, and Amaral-Zettler 2013).
Technical and design solutions to reduce entanglement threats to marine life have largely focused on reducing bycatch in actively fished (rather than derelict) gear (Hamilton and Baker 2019). Successful design advances include pingers (acoustic deterrent devices) for small cetaceans; exclusion devices for pinnipeds and turtles; and guard-type designs to reduce marine mammal entrapment in pots and traps (Hamilton and Baker 2019), though the effectiveness of these mitigation measures once gear become derelict is uncertain. Biodegradable panels on traps and pots have demonstrated success in reducing threats to marine life when traps and pots become derelict (Bilkovic et al. 2012). Some designs envisioned or proposed may ultimately reduce derelict fishing gear and associated entanglements, such as advances in gear marking (He and Suuronen 2018), ropeless trap and pot fishing (Myers et al. 2019), and biodegradable trap and pot panels (Bilkovic et al. 2012).
The Plastic Microbiome
Plastic litter can harbor unique microbial assemblages and may even facilitate the spread of antibiotic resistance across aquatic systems (Arias-Andres et al. 2018, Liu et al. 2021, Zettler, Mincer, and Amaral-Zettler 2013). Plastic microbial communities are distinct and more variable than those in the surrounding water and serve as effective disease vectors (Bryant et al. 2016, Kirstein et al. 2016, Lamb et al. 2018, Zettler, Mincer, and Amaral-Zettler 2013). Environmental DNA methods show the plastic microbiome may contain human and wildlife pathogens (Pham, Clark, and Li 2021). Most types of flotsam can serve as a vector of diseases and pollutants; however, the persistence of plastic litter and its transport and distribution exceed that of organic materials (Harrison et al. 2011). Multiple taxa associated with human gastrointestinal infections have been identified on microplastics downstream of wastewater treatments—but not in the surrounding water or organic matter—suggesting certain microbes may have an affinity for plastics (McCormick et al. 2016), though a recent comparative review of the science failed to confirm this (Oberbeckmann and Labrenz 2020). Members of the bacterial genus Vibrio are common in the plastic microbiome; many are harmless, but some are pathogens
to humans and corals, and they frequently plague aquaculture facilities (Amaral-Zettler, Zettler, and Mincer 2020, Ben-Haim et al. 2003, Curren and Leong 2019, Lamb et al. 2018, Zettler, Mincer, and Amaral-Zettler 2013). Though understanding of the plastic microbiome remains incomplete, its role in microbial ecology underscores the diversity of impacts of ocean plastic waste.
Microbes may affect the distribution and fate of ocean plastic waste through colonization. Functioning as a microhabitat sometimes termed the “plastisphere,” microbial colonization of aquatic plastic litter begins within hours and develops an amalgamated, crowded, complex three-dimensional structure of prokaryotes, archaea, protists, and detritus (Amaral-Zettler, Zettler, and Mincer 2020, Andrady 2011, Wright et al. 2020, Zhao et al. 2021). As this biofilm develops it can decrease the buoyancy of a microplastic particle forcing it to sink, thus enhancing its bioavailability (Andrady 2011, Eriksen et al. 2014, van Sebille et al. 2020). As mentioned previously, chemical signatures associated with biofilms on plastic waste may also serve as an attractant to foraging wildlife (Savoca et al. 2016). Microbial colonization, then, joins entanglement and ingestion-egestion as a biotic distribution mechanism for plastic aquatic waste.
TRANSFORMATION OF PLASTICS IN THE OCEAN
Two mechanisms are involved in the transformation and ultimate fate of plastics in the ocean: chemical and physical degradation, and potential for biodegradation.
Chemical and Physical Degradation
In the ocean, plastics are subject to wave and wind forces and solar radiation. Under these conditions, these plastics weaken and fragment into smaller and smaller particles (MacLeod et al. 2021). Physical degradation involves the breakage of bulk pieces of plastic into smaller fragments. Chemical degradation involves the breakage of chemical bonds in the plastic structure and may be accelerated by exposure to ultraviolet (UV) radiation, high temperatures, and elevated humidity (Chamas et al. 2020). This typically results in the creation of more microplastics and potentially nanoplastics that can accumulate in the ocean and be transported up the food chain through ingestion by fish, birds, and other aquatic species. Fragmentation into microplastics and nanoplastics increases the particle surface area, which facilitates the release of toxic additives into the environment (Arp et al. 2021). Despite the tendency to break into smaller pieces, plastics are known to have long half-lives, though specific degradation rates under various conditions are not well known (Chamas et al. 2020). The potential to degrade is dependent on both the
plastic polymer type and the environmental conditions, which are most favorable at the ocean surface due to exposure to UV radiation, higher temperatures, and energetic waves.
Potential for Biodegradation
Nonmicrobial Marine Biota Transformation
As described in Chapter 2, both fossil-based and biobased plastics can have carbon-carbon bonds that require substantial energy to break apart. Degradation and, specifically, biodegradation depend on the chemical and physical structure of the plastics and the receiving environment, not where the carbon originates from. Therefore, biobased plastics are not necessarily more readily biodegradable than fossil-based plastics (Law and Narayan 2022).
While there are numerous records of ingestion of plastics by marine biota (described earlier in the chapter), there is a nascent understanding of the role marine biota may play in the transformation and ultimate fate of ocean plastic waste. In one study, microplastic particle size was not altered through the sedimentary bioturbation process (ingestion and egestion) of the sea cucumber (Bulleri et al. 2021). However, size reductions in ocean plastic debris have been observed in Antarctic krill (Dawson et al. 2018) and attributed to grinding of ingested plastics in the muscular gizzard of fulmarine petrel seabirds, followed by egestion (van Franeker and Law 2015).
Microbial Interaction with Plastics
Microbial utilization of plastics as a carbon (energy) source, possibly resulting in complete biodegradation (and removal) of the material, has been proposed. Recent work on ocean microbes has focused on characterizing the microbial communities found on ocean plastics compared to those on natural substrates and in free-living communities in seawater, and on understanding the interactions between colonizing marine microbes and specific polymers. As described in an earlier section, some of the first studies on marine microbes reported different microbial communities on plastics than on natural substrates or in seawater (e.g., Zettler, Mincer, and Amaral-Zettler 2013). However, in a recent critical review and comparative analysis of the scientific literature, Oberbeckmann and Labrenz (2020) found little evidence of polymer-specific microbial communities or of an increased affinity of pathogenic species for plastic substrates. Instead, they concluded that microbial communities on plastics tend to be opportunists that will readily colonize both synthetic and natural surfaces.
The vast majority of studies examining potential biodegradation of plastics in the marine environment (i.e., complete assimilation of plastic carbon by microbes and remineralization to CO2, H2O, and inorganic molecules) have focused on weathering (mainly photochemical degradation) and fragmentation (reduction in particle size) processes, which are necessary precursors to microbial assimilation and mineralization, particularly in the ocean (see Figure 5.6). However, relatively few studies have addressed microbial assimilation of carbon in traditional plastics to complete mineralization (removal) (Wang et al. 2018). Plastics with hydrolysable chemical backbones (e.g., PET and polyurethanes) may be more susceptible to enzymatic degradation and eventual biodegradation than those with carbon-carbon backbones (Amaral-Zettler, Zettler, and Mincer 2020), as illustrated by the discovery of PET-degrading bacteria
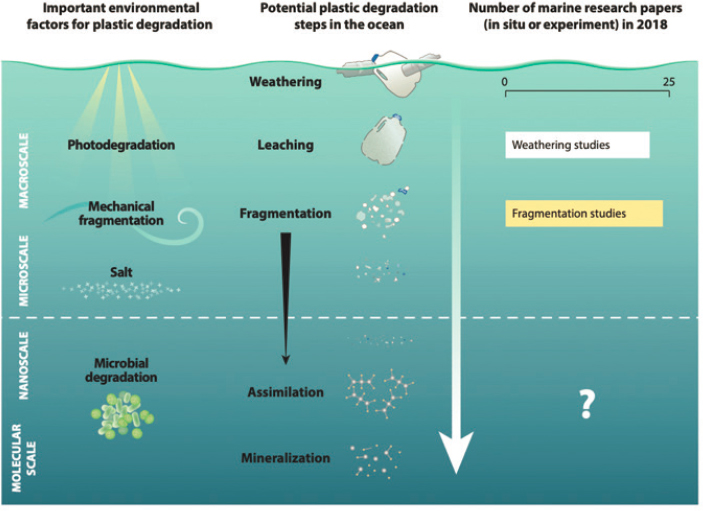
isolated from a bottle recycling plant (Yoshida et al. 2016). However, Oberbeckmann and Labrenz (2020) argue, based upon Alexander’s (1975) paradigm on microbial metabolism of a substrate, that the very low bioavailability and relatively low concentration of plastics in the ocean together with their chemical stability render these molecules very unlikely candidates for biodegradation by marine microbes, despite their potential as an energy and carbon source. Whether marine microbes have the evolutionary potential to adapt to plastic biodegradation in the future, especially if the concentration of plastics increases substantially in the ocean or in localized hotspots, remains an open question.
CHAPTER SYNOPSIS
A large and rapidly growing body of research documents the presence and characteristics of plastic waste throughout the marine environment, from the sea surface to seafloor sediments, coastlines to the open ocean, and in marine biota. The scale of plastic waste flows to the environment and the ocean has been estimated based on plastic waste generation rates and leakage outside of waste management systems, in the United States and globally. However, challenges remain in refining these global estimates and in identifying accumulation hotspots because of limited environmental data that are not readily comparable due to a lack of standardized methods, combined with large variability in ocean plastic concentrations in time and space. Addressing these knowledge gaps will improve estimates of plastic waste flows to the ocean from the United States and globally as a baseline from which to assess the impact of mitigation actions. Based on existing polymer chemistry and microbiology research, plastics (mainly carbon-carbon backbone polymers) are persistent in the marine environment, experiencing little to no biodegradation, and thus accumulate over timescales of decades or more.
KNOWLEDGE GAPS
There is insufficient information to create a robust (gross) mass budget for marine plastic waste and its distribution in ocean reservoirs. Measurements to date of plastic concentrations in individual locations over short time periods are difficult to extrapolate to larger areas and in time.
In order to improve understanding of the fate of plastics in the ocean, research is needed on the following issues:
- The rate at which plastics physically and chemically degrade into smaller particles at various depths in the ocean, and how this varies by polymer type.
- The fate of plastics in marine biota, including residence time, digestive degradation, and excretion rates.
- The physical, chemical, and biological consequences of marine microbial interaction with different plastics.
FINDINGS AND CONCLUSION
Finding 10: Plastics are found as contaminants throughout the marine environment, including in marine life, but plastic amounts and volume in specific reservoirs or in the ocean as a whole cannot currently be accurately quantified from existing environmental data.
Finding 11: Research to date suggests that the distribution and concentrations of plastic waste in the ocean and Laurentian Great Lakes reservoirs can vary substantially across multiple spatial and temporal scales.
Finding 12: Plastics, especially those with carbon-carbon polymer backbones, are persistent and accumulating in the ocean. Even though plastics are chemically and physically transformed into smaller particles in the environment (e.g., through weathering-induced fragmentation and by interaction with biota), evidence suggests that biodegradation (complete carbon utilization by microbes) does not readily occur in the marine environment.
Conclusion 7: Without modifications to current practices in the United States and worldwide, plastics will continue to accumulate in the environment, particularly the ocean, with adverse consequences for ecosystems and society.


