
Appendix G
Rare-Event Species: Uninformative Priors and Bayes’ Rule
Suppose that in a particular time period and in a particular geographic location/area/region, fishers catch r fish of a particular rare species and c fish of other species (including both common species and other rare species). Suppose that this is all of the information that fishery managers have about the particular rare species in that location/area/region; that is, fishery managers are starting from almost nothing.
Assume that the distribution of catch across species is proportional to the abundance of each species in the fish population at the fishing location; that is, the probability P of catching a fish of the particular rare species is the same as the proportion P of that particular species of rare fish in the general fish population in that location. For example, if 5 percent of the fish in the fish population in that location are of the particular rare species, then a fisher has a 5 percent chance that any fish caught will be of that rare species. (Note that the discussion below can be modified to account for the “selectivity-adjusted” probabilities of catching the various fish species.)
Suppose now, as is likely to be the case, that the proportion P of the particular rare fish species in the general fish population in the location is unknown. A common definition of an “unknown” proportion is that the proportion is equally likely to be any value between 0 and 1; this excludes 0 and 1, because it is known that some rare fish exist because r of them were caught, but it is also known that not all of the fish in the location are rare because c fish of other species were also caught. This definition of “unknown” is modeled using a uniform statistical distribution for P with parameters a = 0 and b = 1. (This is known as an “uninformative prior” distribution in a Bayesian modeling framework.) That is, P ~ uniform(a = 0, b = 1).
Given only one time period of catch information (r and c), what is the probability distribution of the proportion P of the particular species of rare fish in the general fish population in the location of interest? Furthermore, what is the expected (mean) catch of the particular species of rare fish and the variance of the catch of this rare species? If a fishery-independent estimate is available for the total fish population (including all species, both rare and common, together) caught in the fishery in the location, what is the expected total population (and variance) of the particular rare species in the location?
FINDING THE PROBABILITY DISTRIBUTION OF THE PROPORTION OF RARE FISH IN THE FISH POPULATION
Suppose that, from time period to time period, R + C is the total number of fish caught in the location of interest, where R is the number of fish of the particular rare species that are caught, and C is the number of fish of other species that are caught. Both R and C can vary from time period to time period. Fishery managers have catch data from only one time period, and for that time period, R = r and C = c (i.e., r and c are the numbers of fish that were caught in the one time period for which catch data are available).
In each time period, the probability that anglers will catch R = r rare fish in a batch of size r + c, given that the probability of a caught fish being rare is p, where p is a particular value of P, is given by the binomial probability distribution:
![]()
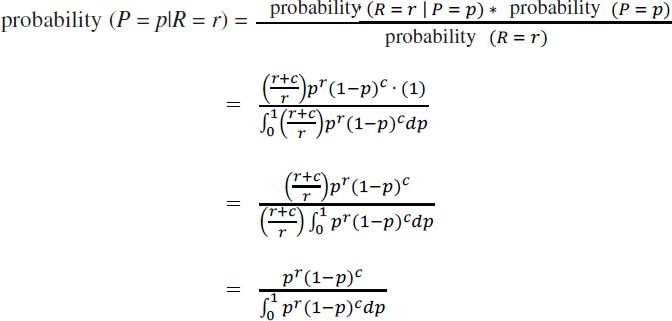
The probability distribution of P, given that r rare fish were actually caught (i.e., the conditional probability distribution of P, given R = fishers), is found via Bayes’ rule:
![]()
Given that, initially, P ~ uniform(a = 0, b = 1), it follows that probability (P = p) = 1/(b – a) = 1/(1 – 0) = 1 in the numerator of the above expression.
Substituting the expressions for probability (R = r) and probability (P = p) into the expression for probability (P = p|R = r):
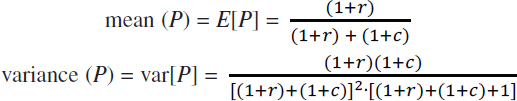
The last expression above is a beta (1 + r, 1 + c) distribution. Hence:
![]()
where, from the definition of a beta distribution with parameters (1 + r) and (1 + c), it follows that:
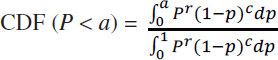
The probability that the proportion of rare fish P is less than a particular value, say, a, can be found using the cumulative distribution function (CDF) of the beta distribution:
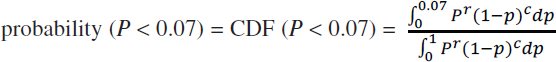
For example, the probability that the proportion of rare fish P is less than 7 percent (0.07) would be:
Similarly, to calculate the probability that the proportion of rare fish is between 5 percent and 10 percent:
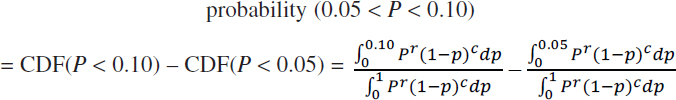
Likewise, the probability that the proportion of rare fish is greater than 3 percent is:

ESTIMATING THE MEAN AND VARIANCE OF THE CATCH OF A RARE SPECIES
Suppose fishery managers have an estimate of the average (mean) total fish catch (both rare and common fish species combined), E[R + C]), for the location of interest, and the variance of total fish catch, var[R + C], for the location of interest. For example, these values could come from past MRIP estimates for the location. Fishery managers also have the number of rare fish, r, and the number of other fish, c, caught at the location of interest for only one time period. If it is reasonable to assume that the proportion of rare fish in a particular location P is independent of the total fish catch (R + C) in that location,1 and that fish are caught in proportion to their prevalence in the population (i.e., the rare fish are not being “selected for” or “selected against”), then the expected value (mean) number of rare fish caught, E[R], is given by:
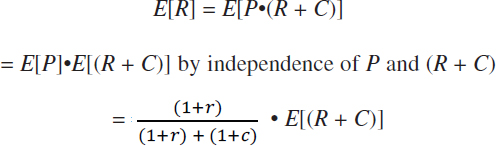
where E[(R + C)] is the MRIP estimate of mean catch of all fish in the location.
The variance in the number of rare fish caught, var(R), is given by Goodman’s (1960) formula for the variance of the product of two independent variables:
![]()
___________________
1 If P and (R + C) are not independent, then E[R] = E[P•(R + C)] = E[P]E[(R + C)] + cov(P,(R + C)), and var(R) = var [P•(R + C)] is given by equation 18 in Goodman (1960), where x = P and y = (R + C).
ESTIMATING THE MEAN AND VARIANCE OF THE POPULATION OF A RARE SPECIES
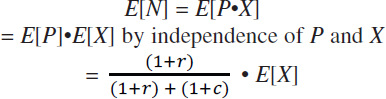
Suppose the total fish population (both rare and common fish species combined) in the location of interest is X, of which the number of rare fish is N, such that N = P∙X. Suppose, too, that fishery managers have a fishery-independent estimate of the expected (mean) total fish population, E[X], and the variance of the total fish population, var[X]. For example, the estimates E[X] and var[X] could come from a stock assessment. If it is reasonable to assume that the proportion of rare fish in the location of interest P is independent2 of the total fish population in that location X, then the expected number of rare fish in the population, E[N], is given by:
where E[X] is the fishery-independent estimate of the expected population of all fish in the location, and the variance in the number of rare fish in the population, var(N), is given by Goodman’s (1960) formula for the variance of the product of two independent variables:
![]()
Regarding software implementation of this approach, both Microsoft Excel and R have functions for the beta distribution.
In summary, the method uses the mean and variance (from MRIP) of the catch of all fish (both rare and common) in the location of interest, and the mean and variance (from a stock assessment) of the population of all fish (both rare and common) in the location of interest.
The mean and variance of the rare-species catch estimates based on the catch data from the initial time period could serve as the initial estimates for a Bayesian updating model of rare-species catch.
REFERENCE
Goodman, L. A. 1960. On the exact variance of products. Journal of the American Statistical Association 55:708.
___________________
2 If P and X are not independent, then E[N] = E[P•E] = E[P]•E[X] + cov(P,X), and var(N) = var[P•X] is given by equation 18 in Goodman (1960), where x = P and y = X.


