
2
The U.S. Fisheries Management and Assessment Framework
Management of marine recreational fisheries occurs within a framework of law, policy, and science that crosses both federal and state jurisdictions. The purpose of this chapter is to provide perspective on various components and legal requirements of the federal fishery management system to assist readers who may not be familiar with the U.S. fisheries management process. This includes a review of regional differences in execution, intersection with other management authorities, and practical application of federal requirements in the monitoring and management of marine recreational fisheries. Box 2.1 provides definitions of key terms and abbreviations salient to this review.
MAGNUSON-STEVENS ACT
Marine fisheries in U.S. federal waters (3–200 miles offshore) are managed under the Magnuson-Stevens Fishery Conservation and Management Act (MSA).1 Originally passed in 1976, the statute recognized the social and economic importance of fishery resources and established a national program for their conservation and management. This included the creation of eight Regional Fishery Management Councils (Councils), which comprise representatives of commercial and recreational fishing, as well as the marine fisheries agencies of the coastal states. Each Council is tasked with the development of fishery management plans and associated regulations for resources of significance in its region in accordance with a suite of national standards (see further discussion below) for conservation and management. Broadly, the purpose of the MSA is to prevent overfishing while achieving the optimum yield from each fishery on a continuing basis.
The MSA has been reauthorized and amended twice since its inception. The 1996 reauthorization (the Sustainable Fisheries Act)2 added several obligations and authorities, including three new
___________________
1 Fishery Conservation and Management Act of 1976, Pub. L. No. 94-265 (see https://www.congress.gov/94/statute/STATUTE-90/STATUTE-90-Pg331.pdf).
2 Sustainable Fisheries Act of 1996, Pub. L. No. 104-297 (see https://www.congress.gov/104/plaws/publ297/PLAW-104publ297.pdf).
national standards. It also mandated that all fishery management plans contain specific information to document catch, such as a standardized method for quantifying bycatch, and an assessment of the amount and mortality of fish caught in recreational catch-and-release programs.
The 2007 reauthorization (the MSA Reauthorization Act)3 established requirements for Councils to set annual catch limits (ACLs) (annual limits on pounds or numbers of fish that prevent overfishing for all managed species), as well as accountability measures (AMs) (management controls that prevent ACLs from being exceeded or mitigate overages). An important provision was the role of each Council’s Scientific and Statistical Committee (SSC) in determining biologically acceptable levels of catch that cannot be exceeded when setting ACLs. Specific to recreational fisheries, the legislation required development of a national angler registry and a comprehensive program to improve the quality and accuracy of recreational catch information collected through the then-existing Marine Recreational Fisheries Statistics Survey (MRFSS).
Throughout the 45-year history of the MSA, marine fisheries management has evolved into a multifaceted process with diverse participants: fishers, conservation organizations, trade and industry groups, scientists with expertise in a variety of disciplines (social, economic, biological, and statistical), and managers. The involvement of each category of participant is essential for successful management outcomes. The Regional Fishery Management Councils created by the MSA, while a central component of the process, are but one piece (see Figure 2.1). In particular, stake-
___________________
3 Magnuson-Stevens Reauthorization Act of 2006, Pub. L. No. 109-479 (see https://www.congress.gov/109/plaws/publ479/PLAW-109publ479.pdf).
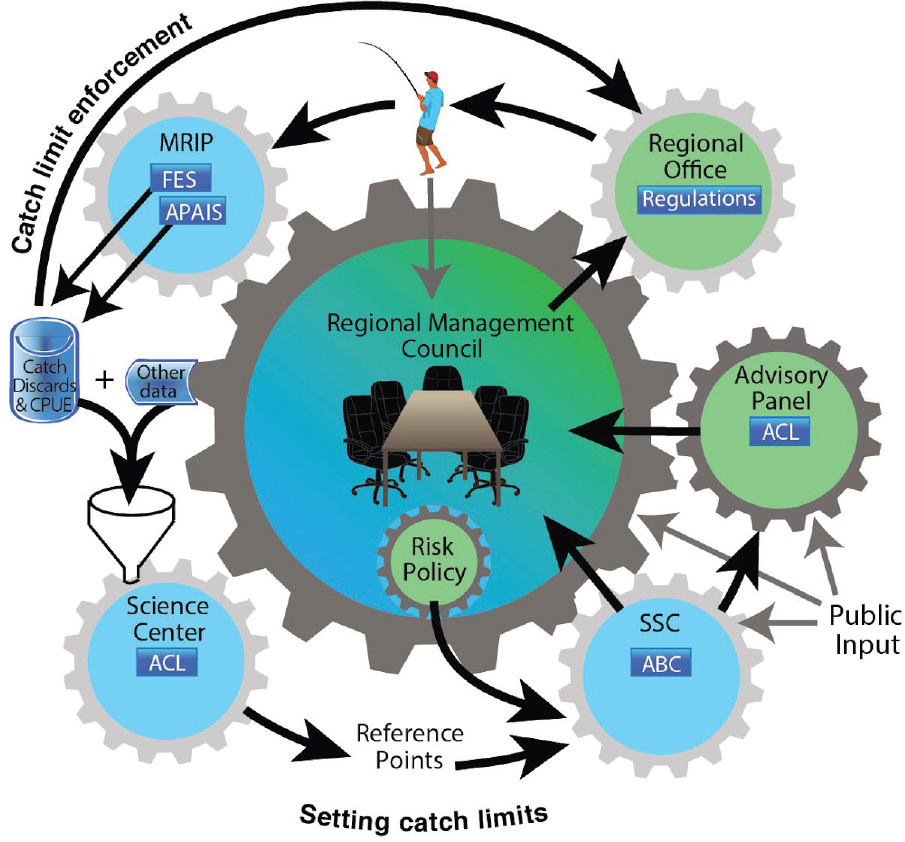
SOURCE: Adapted from NASEM, 2017.
holder participation is necessary for Councils to understand how management approaches under consideration may affect fisher behavior and, ultimately, conservation and use of fishery resources.
Likewise, the information needs of managers to meet legal mandates have evolved with each reauthorization of the MSA. The 2007 requirement for ACLs and AMs imposed new challenges for the use of commercial and recreational catch data, particularly the latter. Prior to this mandate, most marine recreational fisheries were rarely managed in season. Recreational catch estimates were reviewed annually to evaluate and adjust management measures (e.g., size, season, and bag limits) to constrain harvest to a target.
Although the restructuring of the MRFSS into the MRIP resulted in significant improvements to recreational catch and effort surveys, the demands of in-season management of ACLs frequently exceed the temporal and spatial design parameters of the surveys (NASEM, 2017). Whereas commercial catch data are collected using census-based techniques (e.g., logbooks, fish dealer trip tickets), often electronically with very short lag times, survey-based recreational catch estimates are produced at 2-month intervals, making it difficult for managers to respond to changes in a fishery as they are happening. This can result in estimates of harvest with a high degree of imprecision requiring the application of AMs (e.g., early season closures or reductions in future recreational ACLs to offset potential exceedance of the ACL). Despite the successes and improvements in U.S. fisheries management under the MSA, many recreational fisheries continue to pose unique challenges for managers. These challenges have led to frustrations among some recreational fishing organizations that perceive the administration of ACLs and application of AMs as more suited to commercial than to recreational fisheries (ASA and TRCP, 2018; CCC, 2016; CSRFM, 2014). Other recreational fishing and independent professional organizations (American Fly Fishing Trade Association [AFFTA, 2021], American Fisheries Society [Miller et al., 2018]) have remained supportive of the MSA’s provisions for recreational fisheries, viewing them as essential to ensure fisheries sustainability despite implementation challenges.
THE NATIONAL STANDARDS
The cornerstone of the U.S. fisheries management process under the MSA is the 10 national standards,4 a set of statutory principles for conservation and management of the nation’s fishery resources. All management measures and regulations developed by the Councils must be consistent with these standards, which are summarized as follows:
- National Standard 1: Prevent overfishing while achieving optimum yield on a continuing basis.
- National Standard 2: Use the best scientific information available in decision making.
- National Standard 3: Manage an individual fish stock as a unit throughout its range where feasible.
- National Standard 4: Ensure that there is no discrimination among residents of different states and that fishery allocations are fair and equitable.
- National Standard 5: Promote efficient use of fishery resources.
- National Standard 6: Consider and allow for variations among fisheries and fishery resources.
- National Standard 7: Minimize costs and duplication.
- National Standard 8: Account for the importance of fishery resources to fishing communities.
- National Standard 9: Minimize and avoid bycatch and bycatch mortality.
- National Standard 10: Promote the safety of life at sea.
___________________
4 16 U.S.C. § 8151.
Each of the national standards is accompanied by a set of guidelines5 developed by the National Marine Fisheries Service of the National Oceanic and Atmospheric Administration (NOAA Fisheries) on behalf of the secretary of commerce, as required by the MSA. The guidelines are meant to assist the Councils in the development of fishery management plans and implementing regulations by providing the secretary’s interpretation of the national standards, against which plans will be reviewed. The guidelines provide detailed instructions for how the Councils may meet these statutory principles and factors they may need to consider in doing so. Together, the national standards and the guidelines create a comprehensive framework for conservation and management of fishery resources. Although the national standards are not listed in order of importance, the precedence of National Standard 1 is clear, as its mandate to prevent overfishing and achieve optimum yield6 on a continuing basis is at the heart of the MSA.7 While it intersects with many of the other national standards (e.g., National Standards 2, 3, 6, 8, and 9), consideration of these mandates must not be at the expense of preventing overfishing. It can be challenging for a Council to effectively meet all of the national standards for each management action, as many may be mutually orthogonal depending on the action under development.
National Standards 1 and 2 are most directly related to the committee’s Statement of Task. The National Standard 1 guidelines address a number of items, including the development of ACLs; AMs; and status determination criteria, which are measurable factors used to evaluate whether a stock of fish is overfished or undergoing overfishing. In particular, the establishment of an ACL for a stock is directly dependent on its status determination criteria. The National Standard 2 guidelines describe what counts as scientific information, the criteria for evaluating best scientific information, the validation and verification of scientific methods, and the peer review process. Recreational catch data are but one component of the scientific information used by the Councils and their SSCs to develop ACLs, and are subject to review under National Standard 2.
National Standard 9, which addresses bycatch, is tangentially related to the committee’s Statement of Task. The MSA defines bycatch as “fish which are harvested in a fishery, but which are not sold or kept for personal use, and includes economic discards and regulatory discards.”8 Bycatch contributes to the determination of total catch, where total catch includes all fish retained for any purpose (e.g., sale as food, personal use) plus the mortality of any fish that are discarded.9 When establishing ACLs, Councils are required to account for the total catch from all sources. Accurate quantification of bycatch and bycatch mortality can be challenging, however, particularly for recreational fisheries. Individual angler skills can impact the survivability of discarded fish, and current recreational surveys collect only information on the total number of discards for a species (i.e., no length or weight data are obtained). Both factors can contribute to scientific uncertainty, which directly impacts the determination of an ACL and may indirectly impact the management of a fishery.
Fishery Management Plans
Fishery Management Plans (FMPs) are the vehicles by which Councils meet the MSA mandate to conserve and manage the nation’s fishery resources in a manner that provides optimum yield on a continuing basis. The MSA requires the Councils to develop FMPs for all fisheries that
___________________
5 50 CFR § 600(d).
6 16 U.S.C. § 1802(33).
7 16 U.S.C. § 1801(b)(4).
8 16 U.S.C. § 1802(2). This does not include species managed under a recreational catch-and-release only program, in which possession is prohibited.
9 50 CFR § 600.305(f)(1)(i).
are determined to be in need of conservation and management.10 The national standards provide the foundation upon which all FMPs are built and against which they are evaluated. Each FMP describes a set of comprehensive management objectives for the fishery and any problems those objectives are meant to address. This includes balancing diverse social and economic interests with the biological needs of the stock or stocks under management. Ideally, FMP objectives are reviewed periodically as conditions in the fishery change.
In addition to management objectives, FMPs have a number of statutorily required elements.11 These include a description of the fishery (e.g., affected species; gear types; number of vessels; harvest; revenues; commercial, recreational, and for-hire participation; social and economic information); identification of essential fish habitats; development of a standardized method for reporting and assessing bycatch; specification of management reference points for the stock(s) of interest (e.g., maximum sustainable yield, optimum yield, and ACLs); development of AMs to prevent ACLs from being exceeded; and rebuilding plans for stocks that are overfished. FMPs must also contain a fishery impact statement that analyzes the biological, social, and economic impacts of conservation and management.
Additionally, the MSA provides for discretionary provisions12 that Councils may include in their FMPs to achieve management goals, such as the use of fishing permits; closed seasons or areas; restrictions on catch composition (e.g., minimum size and possession limits); conditions or limits on the use and types of fishing gear; limits on participation and access; incentives to reduce and avoid bycatch; and requirements regarding the submission and collection of data. Collectively, these provisions represent the management measures that Councils typically use (either singly or in combination) to meet the objectives of an FMP. Councils may amend FMPs at any time to adjust their required or discretionary provisions to ensure that management goals and statutory obligations are addressed.
The development of an FMP or amendment is an open, public process. It begins with the identification of an issue (or set of related issues) by a Council and/or stakeholders. Once the issue has been characterized, the Council solicits general public input through a process called “scoping,” which provides an opportunity for the public to express concerns about the issue or issues, suggest approaches or solutions, and identify impacts that may occur. The information thus gathered is used to inform the Council’s development of management alternatives for addressing the issue. Once these alternatives have been analyzed, a second round of stakeholder feedback is obtained through public hearings to gather input on the alternatives. After review of public comments, the Council selects preferred alternatives and submits the FMP or amendment to the secretary of commerce for review. The secretary may approve, partially approve, or disapprove the FMP or amendment based on whether it meets the national standards and additional MSA requirements, as well as other applicable laws. Further opportunity for public input is provided during secretarial review of the amendment, as well as during the rulemaking process to implement proposed management measures.
Management Reference Points
One of the statutorily required components of FMPs is the specification of reference points for a stock or stocks of fish. Reference points include stock status determination criteria, as well as maximum sustainable yield (MSY), optimum yield (OY), acceptable biological catch (ABC), and ACLs for all species or stocks within an FMP.13 Reference points serve as thresholds or limits, and are a means of evaluating the effectiveness of management measures in preventing overfishing.
___________________
10 16 U.S.C. § 1852(h)(1).
11 16 U.S.C. § 1853(a).
12 16 U.S.C. § 1853(b).
13 50 CFR § 600.310(b)(2)(iv).
One of the most important reference points is MSY, which is defined as the largest long-term average catch or yield that can be taken from a stock or stock complex under prevailing ecological, environmental, and fishery conditions.14 Estimates of MSY are most often derived from quantitative stock assessment models and should incorporate biological, ecological, and environmental factors as well as catch information. Because MSY for a stock is influenced by interactions with other stocks and the surrounding ecosystem, it should be reestimated as conditions change. Status determination criteria (SDCs), the measurable factors used to determine whether a stock is overfished or undergoing overfishing, are established on the basis of MSY. These criteria include the minimum stock size threshold, which is a minimum level of biomass below which the stock is considered overfished (i.e., no longer able to produce MSY); the maximum fishing mortality threshold (MFMT), which is an annual rate of maximum exploitation above which the stock is undergoing overfishing (i.e., jeopardizing its ability to produce MSY); and the overfishing limit (OFL), which is the annual level of total catch in numbers or pounds of fish associated with the MFMT. Any catch above the OFL will result in overfishing.15
ABC and ACL reference points are derived directly from the OFL. To determine an ABC, each Council must first establish a risk policy that ensures a 50 percent or less likelihood of exceeding the OFL for each species under management.16 A Council’s SSC is responsible for incorporating the Council’s risk policy with the scientific uncertainty in the estimate of OFL to produce a recommended ABC, such that ABC ≤ OFL. This management procedure (i.e., accounting for both risk and scientific uncertainty in the determination of an ABC) is known as an ABC control rule and must be included in Council FMPs.17 A Council then uses the ABC as the basis for setting an ACL that accounts for management uncertainty (e.g., ability to accurately monitor and/or control harvest), such that ACL ≤ ABC for each managed stock. Councils are not allowed to exceed the ABC recommendations of their SSCs when setting an ACL.18
The MSA defines OY as the amount of fish that will provide the “greatest overall benefit to the nation” with respect to food production, recreational opportunities, and the protection of marine ecosystems.19 It is also established on the basis of MSY, but is reduced from MSY according to relevant social, economic, and ecological factors. Similar to MSY, it is a long-term average yield, although it represents the desired rather than the maximum yield from a stock and therefore cannot be greater than MSY. Defining OY for a stock can be challenging for Councils given the range of factors to be considered, available information, and differing stakeholder priorities and needs. It may be expressed quantitatively (as numbers or pounds of fish) or qualitatively, but it must be defined using the best scientific information available and supported by the management measures and reference points within an FMP. The National Standard guidelines describe OY as a “decisional mechanism” for resolving the conservation and management objectives of the MSA and balancing multiple interests in determining the greatest overall benefit to the nation.20 Above all else, OY must prevent overfishing. While OY (a long-term yield) is not directly linked to ACLs (annual yields),
___________________
14 50 CFR § 600.310(e)(1)(i)(A).
15 A description of these various elements related to ACL monitoring and a visual representation of the difference among OFL, ABC, ACL, and annual catch target (ACT) can be found at https://www.fisheries.noaa.gov/southeast/sustainable-fisheries/frequent-questions-annual-catch-limit-monitoring.
16 The requirement that ABC have a 50 percent or less likelihood of exceeding the OFL is included in the National Standard 1 guidelines at 50 CFR § 600.310(f)(2). The legal precedent for this is Natural Resources Defense Council v. Daley, 209 F.3d 747 (D.C. Cir. 2000), in which the court held that harvest levels approved by the National Marine Fisheries Service must have at least a 50 percent likelihood of achieving the target fishing mortality rate.
17 50 CFR § 600.310(f)(2).
18 16 U.S.C. § 1852(h)(6).
19 16 U.S.C. § 1802(33).
20 50 CFR § 600.310(b)(2)(ii).
the ACL framework supports achievement of OY by preventing overfishing. For further discussion of OY with respect to management of recreational fisheries, see Chapter 5.
INTERSECTION OF STATE AND INTERSTATE FISHERIES MANAGEMENT WITH THE MSA
The provisions of the MSA apply only to species under federal management and only in waters from 3 to 200 miles offshore; the states retain management authority for all marine species within 3 miles of shore (“state waters”) or the outer limit of their jurisdictions.21 For those fish and fisheries subject to the MSA, all catch, regardless of whether it occurs in state or federal waters, is applied to the federal ACL. States are encouraged to implement compatible regulations for federally managed species within state waters to aid in conservation and management, enforcement, and public understanding of regulations.22 Several states (e.g., South Carolina and Georgia) have statutes or regulations that automatically complement federal rules in state waters for species subject to the MSA, while others (e.g., North Carolina and Florida) have a flexible administrative process that allows for timely adoption of regulations in state waters to complement any federal rule changes. The MSA does provide for the secretary of commerce to intervene should a state’s actions (or inaction) threaten the effectiveness of a federal fishery management plan.23 However, this provision has rarely been applied.
The MSA also allows for Councils to delegate management authority for a species to the states. For example, the North Pacific Fishery Management Council’s (NPFMC’s) Salmon FMP has delegated all authority to the State of Alaska to manage both commercial and recreational Salmon fisheries in federal waters open to those activities (NPFMC, 2018). Likewise, the Gulf of Mexico Fishery Management Council recently delegated authority for management of specific components of the recreational Red Snapper fishery in federal waters to the states, after several years of inconsistent state and federal regulations that led to shortened recreational seasons in federal waters.24 The Pacific Fishery Management Council (PFMC) employs a slightly different approach for all of its FMPs, whereby the Council develops commercial management measures, while the states of California, Oregon, and Washington develop preferred recreational management measures that are adopted by the Council during the specifications process.25
Interstate Fisheries Commissions
Prior to the adoption of the MSA in 1976, three Interstate Fisheries Commissions were formed by compacts of the coastal states: the Atlantic States Marine Fisheries Commission (ASMFC) (1942), the Pacific States Marine Fisheries Commission (1947), and the Gulf States Marine Fisheries Commission (1949). Each of the interstate compacts was ratified by Congress and established to promote a coordinated approach to research, conservation, and management of shared fishery resources among the states within their jurisdictional waters. All of the interstate commissions provide data warehousing and management of fisheries information networks, as well as coordination of various programs of interest to member states (e.g., habitat, fishery-independent surveys, aquaculture, social and economic data, and stock assessments). Additionally, the ASMFC and the Gulf
___________________
21 The state waters boundaries of Texas, Puerto Rico, and the Gulf Coast of Florida extend to 9 nautical miles offshore. See https://www.gc.noaa.gov/gcil_maritime.html#3m.
22 50 CFR § 600.310(f)(4)(iii).
23 16 U.S.C. § 1856(b).
24 See https://gulfCouncil.org/fishery-management/implemented-plans/reef-fish.
25 As an example, see documentation of the Groundfish FMP specifications process: https://www.pCouncil.org/documents/2019/10/fs12-Groundfish.pdf.
States Marine Fisheries Commission have developed interstate FMPs for species of interest. However, the ASMFC is unique among the three commissions in that any Atlantic Coast state included in an interstate FMP must implement the measures required for conservation and management of a species or risk the secretary of commerce’s imposing a noncompliance moratorium in that state’s waters.26 This authority was not conferred until passage of the Atlantic Striped Bass Conservation Act (1985) and the Atlantic Coastal Cooperative Fisheries Management Act (ACFCMA; 1993).27 Under the ACFCMA, the ASMFC is responsible for determining whether a state is in compliance with the required management measures and for forwarding any determination of noncompliance to the secretary of commerce for consideration and possible action. No similar federal oversight applies to the programs and activities of the other interstate commissions.
While the ACFCMA is less prescriptive than the MSA, it does mandate development of a set of standards and procedures for preparation and implementation of interstate FMPs, which is detailed in the ASMFC’s Interstate Fishery Management Program Charter (ASMFC, 2019). The statute specifically states that interstate FMPs should promote conservation and be based on the best scientific information available.28 However, the ACFCMA does not require the use of ACLs or AMs as does the MSA. Furthermore, interstate FMPs are not subject to such federal laws as the National Environmental Policy Act or Administrative Procedure Act, as each state’s legislative and/or administrative procedures are used to implement required management measures.29
The ACFCMA also provides for support from the secretaries of commerce and the interior in the development of interstate management programs, and requires coordination and collaboration with the East Coast Councils for fisheries that occur in state and federal waters. Currently, the ASMFC has joint management authority with the Councils for four species, and complementary management for four species and one species complex (coastal Sharks). For species under joint management, both the ASMFC and the respective Council must agree upon management measures for implementation to occur, and they usually meet together to facilitate this collaboration. For species under complementary management, the ASMFC can implement measures in state waters that allow for more flexible utilization of the resource by the states, but with the intent of providing comprehensive management across state and federal jurisdictions.
Regardless of whether a joint or complementary management approach is used, the ASMFC is subject to the requirements of the MSA in a de facto manner for species cooperatively managed with the Councils, in particular the requirements for ACLs and AMs.30 This has created some challenges in managing fisheries with a significant recreational component, given the administrative requirements of the MSA; the National Standard 1 guidelines; and the timeliness, accuracy, and availability of recreational catch information through MRIP. Currently, the ASMFC and the Mid-Atlantic Fishery Management Council are engaged in a cooperative “Recreational Reform Initiative” for the four species under joint management (Summer Flounder, Scup, Black Sea Bass, and Bluefish). This effort is focused on addressing stability in recreational management measures, flexibility in the management process, and alignment of recreational access with fish availability and stock status. Issues under consideration include approaches for better incorporating MRIP uncertainty into management (e.g., methods for smoothing outlier catch estimates and use of an “envelope of uncertainty”), protocols for use of multiyear management measures, and possible
___________________
26 In the case of Atlantic Striped Bass, the secretary of the interior is responsible for determining whether a moratorium is required.
27 Atlantic Striped Bass Act of 1985, 16 U.S.C. §§ 5151–5158; Atlantic Coastal Fisheries Cooperative Management Act of 1993, 16 U.S.C. §§ 5101–5108.
28 16 U.S.C. § 5104(a)(2)(A).
29 16 U.S.C. § 5104(b)(1); AFMFC (2019, Section 7).
30 16 U.S.C. § 5103(b)(1)(B).
approaches to improving recreational catch accounting, among others (see Chapter 5 for a detailed description of these issues).
THE MODERNIZING RECREATIONAL FISHERIES MANAGEMENT ACT
The Modernizing Recreational Fisheries Management Act of 2018, also known as the Modern Fish Act (MFA), was signed into law on December 31, 2018, and amended specific portions of the MSA to highlight the differences between management of commercial and recreational fisheries. In addition to the current study, it commissioned reports regarding allocations in mixed-use fisheries and use of limited access privilege programs. It also required development of guidance and best practices for state recreational licensing programs, and a cooperative effort to incorporate additional sources of data (particularly with regard to recreational fisheries) from state agencies and nongovernmental entities into management and scientific processes. Finally, it identified the use of specific management approaches for recreational fisheries.
It is important to note that the MFA did not change the fundamental requirements of the MSA for ACLs and AMs for all managed species. It amended the findings of the MSA to include a policy statement acknowledging the benefits of both commercial and recreational fishing activities, but declares that “science-based conservation and management approaches should be adapted to the characteristics of each sector” because of their differences.31 The MFA also added a paragraph to the MSA that, as part of their required functions, Councils have the authority to use “extraction rates, fishing mortality targets, harvest control rules, or traditional or cultural practices of native communities” in managing recreational fisheries.32 However, the legislation specifically states that this is in addition to complying with the requirements to establish ACLs and AMs, rebuild overfished fisheries, prevent overfishing, and comply with the National Standards.
Extraction rates, fishing mortality targets, and harvest control rules are among the methods currently used by the Councils in managing fisheries, but the degree to which they are employed is determined by the quality and availability of information. Regardless of the method used to set a management target, any of these approaches can be translated into an amount of fish in pounds or numbers associated with that target. Even for management frameworks that do not require the use of ACLs (see Chapter 5), the potential effectiveness of recreational management measures (e.g., season, size, and possession limits) is generally evaluated based on the total catch likely to be produced.
ROLES OF STOCK ASSESSMENT IN FISHERIES MANAGEMENT
Stock assessments are the backbone of sustainable fisheries management and provide critical scientific information necessary for the conservation and management of fish stocks. Stock assessments are designed to answer such management questions as the following: What is the current status of a fish stock relative to established targets (e.g., Is the stock experiencing overfishing? Is the stock overfished?)? How much can fishers catch while maintaining a healthy and sustainable fish stock? If a stock is overfished and/or subject to overfishing, what management action is needed? The answers to these questions are required by the MSA, which calls for the use of the best available scientific information to advise U.S. commercial and recreational fisheries management so as to ensure a healthy balance among sustainable fish stocks, ecosystem health, and productive coastal communities. In the United States, NOAA Fisheries conducts annual stock assessments to
___________________
31 Pub. L. No. 115-405 § 2.
32 Pub. L. No. 115-405 § 102(a).
monitor the condition of approximately 200 federally managed fish stocks and stock complexes (defined as fish groups of similar stocks managed) per year under relevant FMPs produced by the eight Councils.
A typical stock assessment usually involves defining stock structure, collecting and processing fisheries-dependent and fisheries-independent data, performing mathematical and statistical modeling of the data to estimate the dynamics of fish stock status and size, evaluating the impacts of fishing on the stock, and projecting harvest levels following harvest control rules predefined in FMPs to achieve the management target (e.g., maximum sustainable long-term yield). Stock assessments also estimate reference points (see the previous section on management reference points), which are often used in harvest control rules to quantify management goals for target fishing mortality and fish stock biomass and to define management limits for fishing mortality and stock biomass levels to avoid. Comparing estimated fishing mortality and fish stock biomass against fishing mortality and stock biomass reference limits, respectively, makes it possible to determine whether overfishing occurs (i.e., rate of removal is too high) and whether a fish stock is overfished (i.e., stock biomass is too low). Based on the harvest control rules defined in the relevant FMPs, the stock assessment results are used to develop ABCs that can be then used to set ACLs. High-quality stock assessments, often depending on the quality and quantity of input data used in assessment modeling, provide scientific information with which to ensure continuity and consistency in developing fisheries management actions.
DATA AND MODELS USED IN STOCK ASSESSMENTS
Stock assessments usually require three primary categories of data: catch, stock abundance measures, and biological data. These data are usually obtained from fisheries-dependent and fisheries-independent monitoring programs. Fisheries-dependent programs target commercial and recreational fisheries to collect such key fisheries statistics as catches, discards, and biological data. Fisheries-independent programs collect data reflecting spatiotemporal changes in fish stock size and relevant biological data, such as size composition and key life history information, and are based on statistically rigorous field surveys. The quality and quantity of these data determine the quality of stock assessment results, which in turn influences the effectiveness of fisheries management in achieving defined goals. To ensure the highest-quality stock assessments, these data must be accurate and sufficient for describing the dynamics of fish stocks and must be made available for stock assessments in a timely fashion. The quantity and quality of the data available for a stock assessment play a critical role in the choice of stock assessment models, as well as in determination of whether an assessment is feasible. For some stocks, the available data preclude the use of model-based approaches, and alternative methods (e.g., average catch or third-highest catch over some time period) must be used to generate catch advice.
Stock assessment models usually consist of three different types of submodels: population dynamics models that describe fish life history and stock dynamics, observational models that link predictions of population dynamics models with observed values for key fisheries statistics, and statistical models that quantify observational and/or process errors for use in formulating statistical likelihoods in modeling for estimation of fish population dynamics. Stock assessment models vary greatly in their formulations and complexity, depending on the data quality and quantity and the biological and statistical assumptions made in assessment modeling (see Table 2.1).
For a fishery with only catch data available, the stock assessment models used often require no assumptions about fish population dynamics The input data include catch and some expert opinions on either natural mortality and stock depletion or sustainability of the recent catch. The output includes advice on whether the recent average catch is sustainable. The assessments estimate no biological reference points. An example of such a model is the depletion-corrected average catch
(MacCall, 2009). This type of model usually provides only a placeholder until direct information on stock status and/or trends becomes available.
Time-series models used in stock assessments also have minimal or no assumptions on fish population dynamics. The minimum data requirement is catch or an abundance index time series (e.g., An Index Method [AIM], NOAA Fisheries Toolbox). The output does not include biological reference points and is restricted to qualitative advice about whether the stock is trending up or down or is stable and whether it is approaching a possible trigger for management action. The models cannot provide advice on the absolute level of a fish stock or the direct effect of fishing on the stock.
Biomass dynamics and production models consider only aggregate biomass and require a time series of catch and relative abundance index (e.g., Dynamic Schaefer or Pella-Tomlinson model; Prager, 1994). The models can provide estimates of such biological reference points as MSY, BMSY (the total stock biomass at MSY), and FMSY (the fishing mortality rate that produces MSY). They can also yield current biomass relative to BMSY and current F relative to FMSY. These models require good contrast in the time series of catch and abundance index data and cannot incorporate any individual life history information.
Delay-difference models have assumptions about population dynamics similar to biomass dynamics models but include at least two life stages, one typically for fish before recruitment, and some somatic growth relationship and natural mortality. Minimum data requirements include catch, an abundance index, and inputs for body growth function and natural mortality (e.g., Catch-Survey Analysis; Collie and Sissenwine, 1983). Their outputs and limitations are similar to those of biomass dynamics models, although these models have more flexibility and more biological realism.
Age-structured production models incorporate the full age structure of a stock and consider a spawner-recruitment relationship, natural mortality, body weight-at-age, maturity-at-age, fishery selection-at-age, and multiple fishing fleets. Minimum data requirements include catch, abundance index with specified selection pattern at age, natural mortality, body weight-at-age and maturity/fecundity-at-age (e.g., age-structured production model [ASPM]; depletion-based stock reduction analysis) (Dick and MacCall, 2011). The outputs and limitations of these models are generally similar to those of biomass dynamics models, but more closely match the actual age-selection characteristics of fisheries and abundance indices.
Virtual population analysis (VPA)-based models calculate population abundance-at-age directly from catch-at-age data and natural mortality, with age-specific abundance indices being used for tuning. Minimum data requirements include complete and high-quality catch-at-age and weight-at-age data for every time step, as well as one abundance index for calibration (e.g., XSA, ADAPT, VPA2BOX). The models can provide such key information as estimates of stock size and fishing mortality. Estimation of uncertainty in these models can be challenging, and the models work best when fishing mortality rates exceed natural mortality rates.
Statistical catch-at-age (SCAA) models assume age-structured population dynamics, with the minimum data requirements being catch, a statistical sample of catch age composition, and an abundance index (e.g., ASAP, AMAK, SAM, and many custom ADMB coded applications). Some missing catch-at-age data are allowed (in contrast to VPA). The models can estimate stock size, fishing mortality, and biological reference points to provide complete advice on status determinations and forecasts of which limit and target catch levels are attainable.
Integrated analysis (IA) models are highly general with regard to the types of data that can be included. They analyze data with as little preprocessing as possible, such as by using length composition data in the age-length key directly rather than inputting the derived age composition data into the model. IA models have two subcategories: length-based and age-based. For the length-based IA models, population dynamics are length structured, with a growth transition matrix to update length composition between consecutive time steps. The models can incorporate natural mortality,
growth, and size composition data, allowing for the estimation of (possibly time-varying) selection patterns for fishery and abundance indices. The minimum data requirements include catch, an abundance index, and length composition data (missing data allowed). Some examples of the length-based IA models include CASAL, CASA (Sullivan et al., 1990), and the American lobster stock assessment model (Chen et al., 2005). The models can generally provide complete advice on status determinations and forecasts of limit and target catch levels. The structure of the age-based IA models is similar to that of the age-structured models discussed above, which includes modeling of recruitment as deviations, allowance for multiple areas and multiple growth patterns, use of time-varying dynamic and observational processes with possible environmental covariates, and internal estimation of growth using age-at-length data. Typical input data include catch, multiple abundance indices, age and/or length composition data, age-at-length data, tagging, natural mortality, and movement (e.g., Stock Synthesis version v.3.30.15; Methot et al., 2020).
STOCK ASSESSMENT PROCESS
NOAA Fisheries works with its partners in each management region to conduct stock assessments. Fisheries scientists from a variety of backgrounds and institutions often participate in these assessments. The public and the industry have increasingly been involved in stock assessment and regional review processes and are able to involve themselves in discussions and ask questions during assessment and review. This participation helps the public better understand assessment results and provides scientists valuable information about the fishery under review. The complete stock assessments are peer-reviewed by an independent panel of experts. Although the general process, inputs, and outputs are similar, under the auspices of NOAA Fisheries, each management region has developed stock assessment and review processes that suit its particular needs. Each region can determine the frequency of scheduling, reviewing, and using stock assessment results in management based on the quality and quantity of available fisheries, abundance, and biological data; the structure and diversity of local fisheries; available technical and financial resources; and the defined regional stock assessment and management processes.
New England and Mid-Atlantic Management Regions
The NOAA Fisheries Northeast Fisheries Science Center conducts stock assessments to support the New England and Mid-Atlantic Fishery Management Councils and the Atlantic States Marine Fisheries Commission. The Northeast Region Coordinating Council directs the stock assessment process, which includes two assessment tracks: management and research. Management track assessments, designed to be simple, efficient, and flexible, provide routine updated advice to directly inform management action. This allows the inclusion of data that have recently been collected, revised, or corrected, ensuring that the estimates of stock biomass and other stock parameters used for quota setting are updated on a regular basis. The management track assessment process includes the collection and compilation of all relevant data and input information and development of primary and backup assessment plans, which are then reviewed by the Assessment Oversight Panel and the Northeast Region Coordinating Council; conduct of the assessment; and scientific peer review. The management track assessment yields catch estimates from all commercial and recreational sources, including landings and discards; abundance index estimates; annual fishing mortality, recruitment, and stock biomass estimates over time; biological reference points; and stock status determination.
Research track assessments are much more complex, focusing on research topics or individual stocks. Such an assessment evaluates an issue (e.g., retrospective problem), new dataset (e.g., new survey and revised recreational data), or new model applicable to many stocks and considers exten-
TABLE 2.1 Stock Assessment Models
| Stock Assessment Model | Population Dynamics Assumption | Minimum Data | Typical Input Data | Management Advice | Comments |
|---|---|---|---|---|---|
| Catch-only model (e.g., depletion-corrected average catch [MacCall, 2009]) | Often not assumed | Catch | Catch and expert opinion on natural mortality, stock depletion, or suitability of the recent catch | Advice on the sustainability of recent average catch | Often used as a placeholder until other models become available |
| Time-series model (e.g., An Index Method [AIM], NOAA Fisheries Toolbox) | Often not assumed | Catch or abundance index time series | Catch and abundance index time series | Advice on stock trends | No advice on the absolute level of fish stock or the fishing mortality |
| Biomass dynamics or production model (e.g., A Stock-Production Model Incorporating Covariates [ASPIC] [Prager, 1994]) | Aggregate biomass dynamics controlled by a low number of parameters | Catch and one relative abundance index | Minimum data and additional relative abundance indices | Maximum sustainable yield (MSY), BMSY, FMSY, and current and historical B and F | Good contrast in the time series and no consideration of life history and size or age compositions |
| Delay-difference model (Catch-Survey Analysis [Collie and Sissenwine, 1983]) | Similar to biomass dynamics but with at least two life stages, one typically for fish before recruitment; often includes some somatic growth relationship and natural mortality | Catch, abundance index, inputs for body growth function and natural mortality | Minimum data, with the abundance index consisting of a recruitment index and a recruited (adult) index | MSY, BMSY, FMSY, and current and historical B and F | Good contrast in the time series |
| Age-structured production model (ASPM; e.g., Dick and MacCall [2011]) | Consider full age structure, a spawner-recruitment relationship, natural mortality, body weight-at-age, maturity-at-age, fishery selection-at-age, and multiple fishing fleets | Catch, abundance index with specified selection pattern at age, natural mortality, body weight-at-age and maturity/fecundity-at-age | Minimum data plus additional abundance indices | MSY, BMSY, FMSY, and current and historical B and F | When using a deterministic stock-recruitment relationship (as in “standard” ASPM), biases will arise if fluctuations in recruitment are a prominent feature of the stock’s dynamics |
| Stock Assessment Model | Population Dynamics Assumption | Minimum Data | Typical Input Data | Management Advice | Comments |
|---|---|---|---|---|---|
| Virtual population analysis (VPA)-based models (e.g., XSA, ADAPT) | Population abundance at age directly calculated from catch-at-age and natural mortality; often use age-specific abundance indices for tuning; minimal assumptions concerning selection-at-age patterns | High-quality catch at age and weight at age for every time step and one abundance index for calibration | Minimum data and several age-specific abundance indices | Historical and current B and F, and biological reference points if stock-recruitment relationship can be defined | Needs complete, high-precision catch-at-age data; best when fishing mortality rates exceed natural mortality rates |
| Statistical catch-at-age models (e.g., ASAP, SAM) | Age-structured, incorporating natural mortality, recruitment deviations, and selectivity | Catch, statistical sample of catch-age composition, abundance index; some missing catch-at-age data are allowed | Catch, abundance index, statistical sample of age composition of catch and abundance index | Generally, complete advice on stock status determinations and forecasts of limit and target catch levels are attainable | If the spawner-recruitment dynamics are not embedded in the model, a separate analysis is usually needed to derive MSY-based quantities |
| Integrated models with length-structured population dynamics (e.g., CASA [Sullivan et al., 1990; Chen et al., 2005]) | Length-structured life history and fishery processes, with growth transition matrix to update length composition between consecutive time steps | Catch, abundance index, length composition data (missing data allowed) | Catch, abundance index, length composition data | Generally, complete advice on status determinations and forecasts of limit and target catch levels | Mainly for species difficult to age |
| Integrated models with age-structured population dynamics (e.g., Stock Syntheses [Methot, et al., 2020]) | Age-structured life history and fishery processes | Catch and an abundance index | Catch, multiple abundance indices, age and/or length composition data; age-at-length data; tag-recapture data, natural mortality and movement, and stock structure (including genetics) data | Generally, complete advice on status determinations and forecasts of limit and target catch levels | High model complexity, potential overparameterizing and overfitting |
sive changes in data, models, or stock structures. The results can provide the basis for future management assessments. The research track assessment process usually includes selecting a research topic, creating a working group to develop research goals and objectives through a research plan and terms of reference, conducting research, presenting research results to a peer review panel, and advising management and future management track assessment.
For both management and research track assessments, the Stock Assessment Workshop (SAW) and working groups prepare stock assessments, which are peer-reviewed by the Stock Assessment Review Committee and the Council’s Scientific and Statistical Committee (SSC), composed of leading scientists in fisheries stock assessment, economics, and social science. The reviewed stock assessment reports are then published. These published peer-reviewed reports form the scientific basis for managing fish and invertebrate marine resources in the Northeast and Mid-Atlantic regions of the United States.
South Atlantic, Gulf of Mexico, and Caribbean Management Regions
NOAA’s Southeast Fisheries Science Center and Southeast Regional Office use the SouthEast Data, Assessment, and Review (SEDAR) process for stock assessments to develop best available scientific information for advising fisheries management in the South Atlantic, Gulf of Mexico, and Caribbean Fishery Management Councils; the Atlantic States and Gulf States Marine Fisheries Commissions; and NOAA’s Highly Migratory Species (HMS) Division. The SEDAR program guidance is provided through a steering committee, composed of representatives from the three Councils, two Commissions, and three NOAA Fisheries Offices.
SEDAR is operated as a Council process and originally included three approaches with varying levels of complexity: the SEDAR benchmark, standard, and update assessments. In 2014, the Southeast Fisheries Science Center and other regional partners proposed a number of changes designed to increase both assessment throughput and thoroughness. One of these changes was a shift to a cycle of research track and operational assessments similar to what is done in some other regions. The research assessment track is designed to produce a peer-reviewed stock assessment model that is updated in subsequent operational assessments to generate management advice. This cycle should increase quality because research track assessments are not rushed to completion under the pressure of needing to provide management advice (as often happened with benchmark assessments in the previous SEDAR process). It also should increase throughput because data providers can plan ahead. Additionally, data providers will not have to recalculate data inputs multiple times as they did for the original benchmark process because no management advice is produced during a research track assessment. Final updated inputs are not required until the operational assessment is conducted.
An operational assessment may be an update of the previous assessment or may allow for slight modifications. The Southeast Fisheries Science Center will decide what is necessary and can be accommodated in the overall schedule. The first SEDAR research track assessment began in 2019, and the first operational assessments were conducted in 2020.
All SEDAR workshops and webinars are open to the public, and all information related to those assessments is available online. Public comment, in person or in writing, is accepted throughout the process, as well as during subsequent review and action by the cooperating agencies.
Pacific Management Region
The PFMC also uses benchmark and update assessment approaches to develop stock assessments for advising fisheries management on the U.S. West Coast. A benchmark/full assessment usually includes developing and compiling input data from commercial and recreational fisheries and
scientific surveys; modeling stock dynamics (often using Stock Synthesis); conducting rebuilding analysis (for fish stocks subject to rebuilding plans) and additional analyses requested by the PFMC; estimating key fisheries parameters (e.g., selectivity, natural mortality, productivity, recruitment, stock size, and fishing mortality); considering uncertainty and model sensitivity; and estimating OFL using MSY proxy and stock status (percentage of virgin biomass). The Stock Assessment Review process is used for an independent and interactive 4- to 5-day peer review with a final SSC review. The goal of an update assessment is to update prior benchmark assessments with new or revised data in previously used series. No new series are allowed, and model structure remains the same for the update assessments, which are reviewed by the full SSC following initial review by the SSC Groundfish or Coastal Pelagic Species Subcommittee.
North Pacific Management Region
The Stock Assessment and Fishery Evaluation (SAFE), providing information concerning the past, present, and possible future condition of the stocks, marine ecosystems, and fisheries in the Bering Sea and Aleutian Islands Area and Gulf of Alaska Area, is used by the NPFMC to determine annual harvest levels for each managed stock in the North Pacific. The SAFE usually includes three separate reports: stock assessment report, economic status report, and ecosystem status report. SAFE reports, devoting one chapter to each stock or stock complex, are produced each year in time for the December meeting of the NPFMC. A SAFE with new or revised stock assessment models is usually previewed at the September Plan Team meeting and considered again by the team at its November meeting for recommending final specifications for the following two fishing years. The Plan Team review is based on presentations by Alaska Department of Fish and Game and NOAA Fisheries Alaska Fisheries Science Center scientists, with opportunity for public comment and input.
The SAFE stock assessment report also includes a recommendation for the OFL and ABC for each stock and stock complex managed under the FMP for the next two fishing years, in addition to the information on the dynamics of fish stock. The OFL and ABC recommendations of the Plan Team are reviewed by the SSC, which may confirm the team’s recommendations or develop its own. The team and SSC recommendations, together with social and economic factors, are considered by the Council in determining total allowable catches (TACs) and other measures used to manage the fisheries. Neither the author(s), team, nor SSC typically recommends TACs.
Western Pacific Management Region
The Western Pacific Stock Assessment (WPSA) is a cooperative effort of the Western Pacific Regional Fishery Management Council (WPFMC), NOAA Fisheries Pacific Islands Fisheries Science Center, and Pacific Islands Regional Office designed to provide the best available scientific information for advising the Pacific Islands region fishery management.
The WPSA includes two types of stock assessment: benchmark and update stock assessments. A benchmark stock assessment provides the first assessment of a specific stock or includes large changes in modeling and/or input data to previous assessments. An update assessment is conducted to rerun a previously reviewed model with additional years of data only.
Both benchmark and update stock assessments are reviewed in the WPSA Review (WPSAR) process. The WPSAR defines roles and responsibilities, summarizes the review scope and terms of references, and describes the review schedule in coordination with the larger WPFMC process. The reviewed stock assessments are then sent to the WPFMC SSC, which reviews them and provides catch advice based on the harvest control rules defined in the relevant FMP.
The stock assessment process in each management region has evolved over time. In general, data quality and quantity have been greatly improved for many stock assessments. The complexity of benchmark assessments has increased with more sophisticated and flexible modeling frameworks that can incorporate multiple sources of data, better quantify the dynamics of fish stocks and fishing fleets, and improve understanding of uncertainty. The assessment category or approach is usually determined based on uncertainty in data and model outputs. The complexity of some assessments is reduced with the use of data-moderate assessment methods and the simplification of appropriate benchmark assessments. Assessment contributions from state agencies have declined over time.
APPLICATION OF ABCs, ACLs, AND AMs IN THE MANAGEMENT PROCESS
According to National Standard 1 guidelines, for all stocks and stock complexes that are “in the fishery,” the Councils must evaluate and describe the following items in their FMPs and amend the FMPs, if necessary, to align their management objectives so as to end or prevent overfishing: (1) MSY and SDCs, (2) OY, (3) ABC control rule, and (4) mechanisms for specifying ACLs and AMs.
Although varying among the regions, ABC should be based, when possible, on the probability of overfishing when the ABC is in place, denoted P*. Because catch estimates are uncertain, an estimated catch equal to the ABC may result in a larger actual catch, and this larger actual catch may result in overfishing. An estimated catch equal to the stock’s ABC results in overfishing with probability P*. P* cannot by law exceed 50 percent. Choosing a lower level for ABC reduces P* and reduces the risk of overfishing. A control rule is often used to help characterize the risk of overfishing while optimizing yield for alternative proposed management measures under different levels of scientific uncertainty.
Each Council must develop ABC control rules in coordination with its SSC. The SSC must recommend the ABC to the Council. An SSC may not always follow the ABC control rules in recommending an ABC, but must justify such a recommendation. Actual ABC control rules vary by Council. Some Councils have adopted a single framework for all FMPs, while others have different frameworks for each FMP. Most Councils attempt to various degrees to set ABCs below the OFL in a way that reflects and captures scientific uncertainty.
As discussed previously, the MSA requires ACLs and AMs in federal fisheries to end and prevent overfishing. For a fishery, an ACL is typically developed from and may have a value lower than the ABC to account for management uncertainty (e.g., uncertainty in the ability of management measures to constrain catch). Alternatively, Councils may set an annual catch target (ACT) that is lower than the ACL to account for management uncertainty, but they are not required to do so. If the total catch of a stock is approaching or exceeds its ACL, fishery managers use AMs to ensure that the limit is not exceeded or to correct for any overage. AMs can be some combinations of size limits, trip limits, gear restrictions, and even seasonal closures. All federal fisheries currently operate under ACLs, with the exception of internationally managed fisheries and stocks with a short life span (<1 year) that are exempt from ACL requirements unless subject to overfishing.33 An ACL may be exceeded for many reasons: the population size of the stock is actually smaller than estimated in the stock assessment, catch rate or effort is higher than expected, and bycatch and/or catch in state waters may be higher than anticipated. Thus, data need to be collected throughout the fishing season to evaluate the amount of fish caught and determine whether the catch falls below or above the ACL. If a fishery meets or is approaching an ACL, managers may implement an inseason closure. If a fishery exceeds the catch limit, managers may consider whether to reduce the
___________________
33 See Pub. L. No. 109-479 § 104(b), MSA § 303 note (a)(15), which added the requirement for ACLs and AMs, “shall not apply to a fishery for species that have a life cycle of approximately 1 year unless the Secretary has determined the fishery is subject to overfishing of that species.” However, the requirement for status determination criteria, MSY, OY, and ABC still apply. One example of a species not subject to these requirements is the penaeid shrimp fishery off the Southeast.
following season to make up for overages, and whether to set measures more conservatively the next fishing season. Such AMs, whether in season or postseason, are required under the MSA as a key tool to prevent overfishing.
Many, particularly commercial, fisheries have in-season management mechanisms for which the amount and type of catch and bycatch in the fisheries are monitored in real time during the season according to the ACL and allocations by gear, sector, and seasonal apportionments that are prescribed in regulation and defined in the harvest specifications. The fisheries will be closed or remain open based on the catch estimated according to in-season monitoring in comparison with the ACL. In-season monitoring programs typically rely on both observer data and landings information to generate estimates of total catch, including at-sea discards. In commercial fisheries, observer information, dealer landing reports, and at-sea production reports are combined to provide an integrated source for fisheries monitoring and in-season decision making (Cahalan et al., 2010, 2014).
CHALLENGES POSED BY RECREATIONAL FISHERIES DATA FOR STOCK ASSESSMENTS
The most important piece of information for all of the stock assessment models is the amount of fish removed from a stock by commercial and recreational fishing activities. A national network of various fishery-dependent monitoring programs was developed to collect catch data for stock assessments. Port monitoring programs, often conducted in partnership with state agencies and fisheries commissions, record commercial catch receipts to provide an estimate of commercial landings and associated biological samples of the length, sex, and age of fish. Logbook programs recorded by commercial fishers track fishing location, gear, and catch. On-board observer programs have biologists observe fishing operations on a certain proportion of fishing vessels and collect data on the amount of catch and discards, which has greatly improved the quality of commercial fisheries data.
Recreational monitoring programs often use telephone interviews, mail surveys, creel surveys, and dockside sampling to estimate the level of catch and other relevant information (e.g., effort) by the recreational fishery. However, accurate and timely estimates of recreational fisheries catch, particularly discards, are especially challenging in monitoring program designs and statistical analysis because of wide-ranging coastlines and the large number of participants in recreational fisheries. Good spatiotemporal sampling coverage is often difficult, as is controlling the various factors that may influence the quality of the data collected in recreational sampling programs. Methods used in commercial fisheries, such as on-board observer programs, can be impractical to implement for the private component of recreational fisheries. To improve the quality of recreational data, NOAA Fisheries has worked with its partners to develop MRIP to collect information on the number of recreational fishing trips and the number of fish caught using in-person, telephone, and mail fishing surveys. A certification program has been developed to ensure that a specialized or supplemental recreational fisheries monitoring program is scientifically sound and yields high-quality recreational fisheries catch data.
In 2018, a series of changes was made to MRIP to provide more accurate estimates of fishing effort; these changes included transitioning from the Coastal Households Telephone Survey to the mail-based Fishing Effort Survey (FES) and incorporating private boat anglers in Hawaii and on the Atlantic and Gulf Coasts. These improvements resulted in increased catch estimates for the entire MRIP time series that also induced changes in the scale of assessment models, often altering managers’ previous understanding of stock status and dynamics. Overall, MRIP has greatly improved the quality and quantity of recreational fisheries statistics (NASEM, 2017), which, in combination with a commercial fisheries monitoring program, greatly improves the estimates of total removals for many fisheries. However, challenges remain in obtaining high-quality and timely estimates of recreational fisheries catch for stock assessments and management (e.g., average weights of dis-
cards). The advances and difficulties highlighted here are pertinent to the committee’s Statement of Task to evaluate how the design of MRIP might be improved or supplemented to meet both science and management needs.
MANAGEMENT AND MONITORING OF RECREATIONAL HARVEST
In-season management of commercial fisheries in the United States is possible because catches are obtained by a limited number of licensed commercial fishers, landed in a limited number of ports, and sold through licensed seafood dealers. Reporting is obligatory for many commercial fishers and seafood dealers. These features have evolved naturally and are reinforced by licensing requirements that restrict entry into the seafood sector.
As discussed previously, recreational fisheries are characterized by high numbers of participants, who on average spend only a small part of their time fishing; a large number of diffuse access points (boat ramps, marinas, and private docks); and absence of a marketing system and associated data collection. Moreover, the number of participants in recreational fishing is essentially uncontrolled because licenses often are not limited, and indeed, fisheries agencies typically strive to increase rather than limit license sales because unlicensed recreational anglers add to the uncertainty of catch estimates. For all of these reasons, it is difficult to obtain recreational catch estimates using census-based approaches or even surveys with a high level of coverage (recreational surveys typically cover at most a few percent of recreational fishing trips). As a consequence, recreational ACL management is hindered by catch sampling programs that lack both the precision and the timeliness needed to implement in-season management, and by a lack of direct control over recreational effort and catch.
Recreational ACL management therefore generally relies on a two-step process of (1) instituting size, season, and bag limits that are estimated to result in the ACL being met; and (2) monitoring catches using a survey-based approach to provide a catch estimate, normally after the recreational season has ended. If the catch estimate is at or below the ACL, no further action is taken, and any unused ACL is forgone. If the catch estimate is above the ACL, AMs may be in place that require overages to be paid back in the next fishing season. In any case, overages or underages will be accounted for in subsequent stock assessments, but such feedbacks are neither direct nor immediate.
The setting of size, bag, and season limits to achieve the recreational ACL involves forecasting catches in relation to these limits. A variety of forecasting approaches can be used for this purpose. For example, forecasts may be based on a deliberative committee process with ad hoc use of such considerations as changes in stock abundance or assumptions about angler responses to regulations (e.g., the PFMC Groundfish Management Team approach). Advanced statistical forecasting methods are widely used in other fisheries, and have proven to provide reliable forecasts, particularly in fisheries where consistent interannual and seasonal trends in catch rates are observed (Farmer and Froeschke, 2015; Farmer et al., 2020). Statistical forecasting methods use statistical models to forecast future catch without having to explicitly capture underlying mechanisms, such as by modeling angler behaviors. More recently, mechanistic (process-based) approaches that explicitly model angler behaviors and other factors have become available (Lee et al., 2017). The three approaches (committee-based ad hoc, statistical forecasting, and mechanistic models) have different advantages and disadvantages in terms of forecasting accuracy, process understanding, transparency, and opportunities for stakeholder participation. At present, different approaches are used in different fisheries, and therefore, a direct intercomparison has not been possible.
Recreational overages or underages may be the result of either implementation uncertainty (which occurs when the predetermined size, bag, and season limits fail to result in the projected catch) or uncertainty in the survey estimate of catch (e.g., it is possible that catches were actually
within the ACL, but the survey returned a higher catch estimate). Both are components of management uncertainty. Substantial underages or overages may be more commonly associated with implementation uncertainty than with uncertainty in survey estimates, though this has not been formally evaluated. For example, the Mid-Atlantic Fishery Management Council has noted that even when recreational management measures have remained consistent across years, resulting estimates of harvest have varied significantly.34 Because overages can have severe short- and long-term consequences (AMs, reduced future catches, and stock status changes to overfished/overfishing), Councils may enact safety buffers in recreational fisheries where overages occur frequently. For example, the Gulf of Mexico Fishery Management Council implemented a 20 percent buffer (20 percent reduction of ACT below ACL) for Red Snapper for several years to reduce the risk of overages resulting from implementation error.
The quest to implement in-season management for recreational fisheries stems from a provision in National Standard 1 that calls for FMPs to include in-season management and monitoring whenever possible, and from a desire to reduce management uncertainty in recreational fisheries, thereby avoiding underages and overages and the associated loss of fishing opportunities. As described above, there are substantial structural challenges associated with the implementation of in-season management in recreational fisheries that are not easily overcome with changes in survey design alone. Moreover, it should be noted that current methods of ACL management perform reasonably well in many recreational fisheries where underages or overages of more than a few percent are uncommon. The following chapters review recreational fisheries with ACLs in all regions to identify fisheries in which frequent underages or overages call for management improvements that could be achieved with in-season management approaches, and the specific challenges associated with implementation of such approaches in these fisheries. Also considered are alternative approaches to improving management outcomes that may be more feasible than in-season management in some cases.
We close by noting that, while effective in-season management of fisheries managed under open access maintains fisheries catches within ACLs and therefore avoids overfishing, it often leads to economically and socially suboptimal outcomes. This is well-documented for commercial fisheries, and similar arguments can be made for recreational fisheries (Abbott et al., 2018; Sutinen and Johnston, 2003). By contrast, rights-based approaches, such as catch shares for charter operators or harvest tags for private recreational anglers, may improve ACL compliance while simultaneously generating other economic and social benefits. Again, such approaches are discussed in subsequent chapters.
CONCLUSIONS
Conclusion: For all stocks in need of conservation and management, the MSA requires that Councils set ACLs to prevent overfishing and AMs to ensure that catches are constrained to ACLs. As required by the MSA, a Council cannot exceed the recommended ABC from its SSC when setting an ACL, and its FMPs must include reference points (MSY, OY, and SDCs, or reasonable proxies) for all managed species with which to make determinations of stock status (i.e., overfished and overfishing).
Conclusion: The MFA did not alter the MSA’s fundamental requirement for ACLs and AMs. Rather, it clarified that management approaches for commercial and recreational fisheries should be tai
___________________
34 See the January 2021 staff memo on the joint Atlantic States Marine Fisheries Commission/Mid-Atlantic Fishery Management Council Recreational Reform Initiative regarding potential challenges associated with development of a harvest control rule (pp. 10–11): https://www.mafmc.org/s/Tab01_Rec_reform_memo_Feb2021_v2.pdf.
lored to the needs of each sector, and highlighted specific approaches that Councils could consider for recreational fisheries.
Conclusion: Stock assessments are the scientific backbone of the fisheries management process and vary greatly in complexity depending on the quality and quantity of available data. While stock assessment models and outputs are similar, each NOAA Fisheries Council region has developed a process for scheduling, conducting, and reviewing assessments that meets regional needs and ensures the quality of scientific information. Implementation of MRIP has greatly improved the recreational catch data used in stock assessments, although challenges remain in obtaining high-quality and timely estimates of recreational fisheries catch.
Conclusion: A variety of approaches are used to monitor stocks and ensure that ACLs are not exceeded. In-season AMs compare harvest with the ACL as the fishery is under way and may trigger a closure or other adjustments (e.g., changes to possession limits or season length), while postseason AMs may modify future harvest limits to account for overages.
Conclusion: The characteristics of recreational fisheries make census-based approaches to monitoring and managing catch inherently challenging. Several forecasting approaches may be used to project how a given set of management measures (e.g., size, season, and bag limits) will perform in comparison with an ACL. Actual performance (i.e., realized versus projected catch) depends on management uncertainty, which includes both implementation uncertainty (how well management measures met expectations) and uncertainty in estimates of catch. Pursuit of in-season management is focused primarily on reducing management uncertainty to avoid or minimize forgone fishing opportunities.
REFERENCES
Abbott, J. K., P. Lloyd-Smith, D. Willard, and W. Adamowicz. 2018. Status-quo management of marine recreational fisheries undermines angler welfare. Proceedings of the National Academy of Sciences 115:8948–8953.
AFFTA (American Fly Fishing Trade Association). 2021. Recommendations to Improve the Health and Sustainability of America’s Marine Fisheries. Bozeman, MT: AFFTA.
ASA and TRCP (American Sportfishing Association and Theodore Roosevelt Conservation Partnership). 2018. Approaches for Improved Federal Saltwater Recreational Fisheries Management. Washington, DC: ASA and TRCP.
ASMFC (Atlantic States Marine Fisheries Commission). 2019. Interstate Fisheries Management Program Charter. http://www.asmfc.org/files/pub/ISFMPCharter_Aug2019.pdf.
Cahalan, J., J. Mondragon, and J. Gasper. 2010. Catch Sampling and Estimation in the Federal Groundfish Fisheries Off Alaska. U.S. Department of Commerce, NOAA Tech. Memo. NMFS-AFSC-205, 42.
Cahalan, J., J. Gasper, and J. Mondragon. 2014. Catch Sampling and Estimation in the Federal Groundfish Fisheries Off Alaska, 2015 Edition. U.S. Department of Commerce, NOAA Tech. Memo. NMFS-AFSC-286, 46.
CCC (Center for Coastal Conservation). 2016. A Vision for Marine Fisheries Management: Priorities for a New Administration. Washington, DC: CCC.
Chen, Y., M. Kanaiwa, and C. Wilson. 2005. Developing and evaluating a size-structured stock assessment model for the American lobster, Homarus americanus, fishery. New Zealand Journal of Marine and Freshwater Research 39(3):645–660. https://doi.org/10.1080/00288330.2005.9517342.
Collie, J. S., and M. P. Sissenwine. 1983. Estimating population size from relative abundance data measured with error. Canadian Journal of Fisheries and Aquatic Sciences 40(11):1871–1879.
CSRFM (Commission on Saltwater Recreational Fisheries Management). 2014. A Vision for Managing America’s Saltwater Recreational Fisheries. Washington, DC: Theodore Roosevelt Conservation Partnership.
Dick, E. J., and A. D. MacCall. 2011. Depletion-based stock reduction analysis: A catch-based method for determining sustainable yields for data-poor fish stocks. Fisheries Research 110(2):331–341.
Farmer, N. A., and J. T. Froeschke. 2015. Forecasting for recreational fisheries management: What’s the catch? North American Journal of Fisheries Management 35:720–735.
Farmer, N. A., J. T. Froeschke, and D. L. Records. 2020. Forecasting for recreational fisheries management: A derby fishery case study with Gulf of Mexico Red Snapper. ICES Journal of Marine Science 77(3):1248. https://doi.org/10.1093/icesjms/fsaa005.
Lee, M., S. Steinback, and K. Wallmo. 2017. Applying a bioeconomic model to recreational fisheries management: Groundfish in the Northeast United States. Marine Resource Economics 32(2):191–216.
MacCall, A. D. 2009. Depletion-corrected average catch: A simple formula for estimating sustainable yields in data-poor situations. ICES Journal of Marine Science 66(10):2267–2271. https://doi.org/10.1093/icesjms/fsp209.
Methot, R. D., Jr., C. R. Wetzel, I. G. Taylor, and K. Doering. 2020. Stock Synthesis User Manual Version 3.30.15. U.S. Department of Commerce, NOAA Processed Report NMFS-NWFSC-PR-2020-05. https://doi.org/10.25923/5wpn-qt71.
Miller, T., C. M. Jones, C. Hanson, S. Heppell, O. Jensen, P. Livingston, K. Lorenzen, K. Mills, W. Patterson, P. Sullivan, and R. Wong. 2018. Scientific considerations informing Magnuson-Stevens Fisheries Conservation and Management Act reauthorization: AFS Special Committee. Fisheries 43:533–541.
NASEM (National Academies of Sciences, Engineering, and Medicine). 2017. Review of the Marine Recreational Information Program. Washington, DC: The National Academies Press. https://doi.org/10.17226/24640.
NPFMC (North Pacific Fishery Management Council). 2018. Fishery Management Plan for the Salmon Fisheries in the EEZ off Alaska. https://www.npfmc.org/wp-content/PDFdocuments/fmp/Salmon/SalmonFMP.pdf.
Prager, M. H. 1994. A suite of extensions to a nonequilibrium surplus-production model. Fishery Bulletin 92:374–389.
Sullivan, P. J., H. L. Lai, and V. F. Gallucci. 1990. A catch-at-length analysis that incorporates a stochastic model of growth. Canadian Journal of Fisheries and Aquatic Sciences 47(1):184–198.
Sutinen, J. G., and R. J. Johnston. 2003. Angling management organizations: Integrating the recreational sector into fishery management. Marine Policy 27(6):471–487.


