


Below is the uncorrected machine-read text of this chapter, intended to provide our own search engines and external engines with highly rich, chapter-representative searchable text of each book. Because it is UNCORRECTED material, please consider the following text as a useful but insufficient proxy for the authoritative book pages.
6 The literature review chapter is organized into the following sections: ⢠Project Selection ⢠Pavement Design ⢠Individual Materials ⢠Mix Designs ⢠Construction Processes ⢠Pavement Performance ⢠Economic Benefits ⢠Environmental Benefits Project Selection A well-defined process for identifying projects that are good candidates for CIR and CCPR at the start of the project is key to comparing the economic and environmental factors asso- ciated with all options for pavement maintenance and rehabilitation. The most appropriate alternatives for a given project are identified during the project selection phase. Possible alter- natives should be selected because they can ⢠Address the specific pavement distresses present on the existing roadway, and ⢠Effectively use and/or reuse the existing pavement structure and materials. The condition of the existing roadway in an agencyâs network is usually expressed as a single- value number such as the pavement condition index (PCI) or pavement condition rating (PCR). This number is useful for the initial identification of roadways in need of maintenance or reha- bilitation, but an evaluation of the type and extent of individual pavement distresses is needed to identify alternatives that can address the causes of the individual distresses. Recycling processes use the existing pavement materials as a major component of the new pavement. Therefore, it is important to identify the types of materials that need to be incorpo- rated into the new mixture. A thorough review of any original construction and maintenance records can provide a preliminary estimate of likely variations in the pavement materials. The records review can also provide information on possible variations in the thickness pave- ment structure. Recycling processes also need minimum amounts of available materials to produce the mixes. The records can identify the probable pavement thickness variations in the project. A site investigation is needed to verify and expand the information collected with the records review. C H A P T E R 2 Literature Review
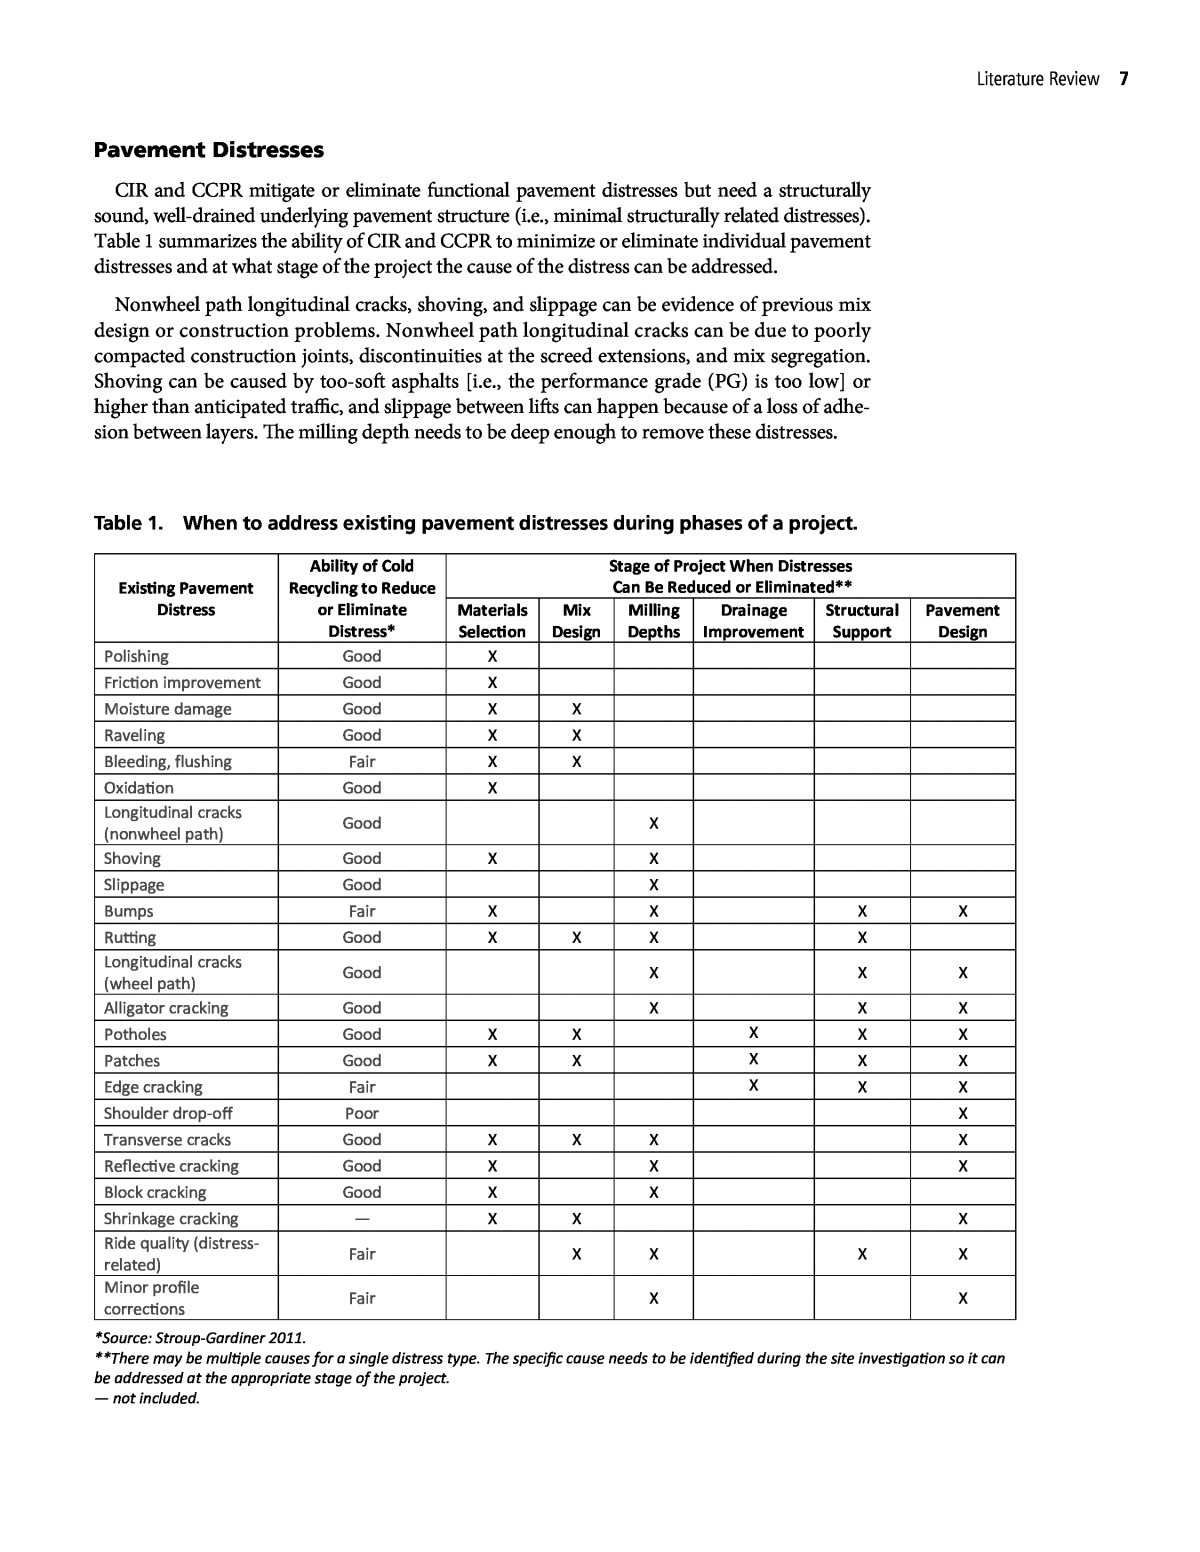
Literature Review 7  Pavement Distresses CIR and CCPR mitigate or eliminate functional pavement distresses but need a structurally sound, well-drained underlying pavement structure (i.e., minimal structurally related distresses). Table 1 summarizes the ability of CIR and CCPR to minimize or eliminate individual pavement distresses and at what stage of the project the cause of the distress can be addressed. Nonwheel path longitudinal cracks, shoving, and slippage can be evidence of previous mix design or construction problems. Nonwheel path longitudinal cracks can be due to poorly compacted construction joints, discontinuities at the screed extensions, and mix segregation. Shoving can be caused by too-soft asphalts [i.e., the performance grade (PG) is too low] or higher than anticipated traffic, and slippage between lifts can happen because of a loss of adhe- sion between layers. The milling depth needs to be deep enough to remove these distresses. Existing Pavement Distress Ability of Cold Recycling to Reduce or Eliminate Distress* Stage of Project When Distresses Can Be Reduced or Eliminated** Materials Selection Mix Design Milling Depths Drainage Improvement Structural Support Pavement Design Polishing Good X Friction improvement Good X Moisture damage Good X X Raveling Good X X Bleeding, flushing Fair X X Oxidation Good X Longitudinal cracks (nonwheel path) Good X Shoving Good X X Slippage Good X Bumps Fair X X X X Rutting Good X X X X Longitudinal cracks (wheel path) Good X X X Alligator cracking Good X X X Potholes Good X X X X X Patches Good X X X X X Edge cracking Fair X X X Shoulder drop-off Poor X Transverse cracks Good X X X X Reflective cracking Good X X X Block cracking Good X X Shrinkage cracking â X X X Ride quality (distress- related) Fair X X X X Minor profile corrections Fair X X *Source: Stroup-Gardiner 2011. **There may be multiple causes for a single distress type. The specific cause needs to be identified during the site investigation so it can be addressed at the appropriate stage of the project. â not included. Table 1. When to address existing pavement distresses during phases of a project.
8 Practice and Performance of Cold In-Place Recycling and Cold Central Plant Recycling Aggregates with round shapes or mineralogy that tends to polish under traffic can be recycled into a lower pavement layer, and moisture-sensitive mixes can be amended with an active filler (e.g., lime, Portland cement). Bleeding or flushing is a function of traffic combined with an over-asphalted mix or surface treatment. In some cases, bleeding or flushing can be evidence of a moisture-sensitive mix where, in hot weather, the asphalt is stripping off the aggregate and moving to the surface as the underlying water evaporates through the pavement. Raveling, which is accelerated by traffic working the fines out of the pavement surface, can indicate a moisture-sensitive mix, an originally under-asphalted mix, or the advanced age and oxidation of the surface mix. It is important to address any moisture or material distresses during the mix design phase. Bumps may have been generated by the paver stopping and starting during construction, or they may indicate an underlying patched areaâsuch as a Portland cement patch under an overlay. In some areas of the country, bumps can also be evidence of soil-related problems (e.g., frost heave, expansive clays). Any base or subgrade deficiencies that are identified as the cause of the bumps need to be addressed before any rehabilitation activities. If the bumps are the result of previous paving operations, then the milling depth needs to be deep enough to remove the distresses. Transverse cracks may be either thermal or reflective. Thermal cracking resistance can be improved by selecting a base asphalt for the recycled mix that is appropriate for the projectâs environmental conditions and that accounts for the influence of the oxidized binder on the com- bined binder properties. For reflective cracking, cold recycled mixtures can be used as a crack relief layer between the existing layer and the new wearing surface (Chan et al. 2009; Emerson 2017; Wagner 2018; Schellhammer 2019). Block cracking is the result of a combination of oxidation and fluctuations in temperature; an appropriate milling depth can reduce or eliminate this cracking. In some cases, block cracking may be reflective cracking caused by underlying Portland cement concrete (PCC) pavement. Edge cracking usually indicates a lack of support immediately adjacent to the roadway, which can be due to drainage problems or a lack of shoulders. Shoulder drop-off occurs when overlays are placed on a roadway without raising the shoulder material to match the new pavement eleva- tion; it can also be due to erosion of the shoulder material over time. The lack of edge support needs to be addressed during the pavement design phase. Structurally related distresses include longitudinal and alligator cracking as well as patching in the wheel paths. Rutting, longitudinal cracks in the wheel paths, alligator (fatigue) cracking, potholes, and patching all represent traffic-related distresses. Except for rutting, the distresses in this group are sequential. That is, longitudinal cracking is the first evidence of traffic-related cracking and evolves with additional load repetitions into fatigue cracking in the wheel paths. As fatigue crack counts increase, longitudinal crack counts decrease. As time goes on, both traffic and weather further damage the fatigue-cracked areas and a pothole forms, which is then patched. When a roadway has a significant number of patched areas, the support structure of the pavement is questionable and further testing is needed. Traffic Levels Cox and Howard (2013) reported that CIR projects typically had up to 3,000 annual average daily traffic (AADT) levels (Figure 1). Agencies with a number of years of experience with cold recycling processes frequently recycle roadways with higher AADT traffic levels (Table 2). The cold recycled layer includes an overlay at higher traffic levels and chip seals for lower AADT levels.
Literature Review 9Â Â Records Review The existing records are reviewed to determine the existing pavement layers and probable thicknesses, as well as the type, materials, and extent of previous maintenance and preservation activities. Factors that can influence the consistency of the cold recycled RAP mix include the amount of crack sealant, fabric interlayers, material properties in surface treatments, varia- tions in the surface mix [e.g., open-graded friction course, stone matrix asphalt (SMA)], and the narrowing of roadways from multiple overlays (Wagner 2018; Christianson and Mahoney 2019). If the project involves excessive crack sealing, then pre-milling the surface to remove the crack sealant may be beneficial. However, when fabric interlayers are present, the miller may not shred the fabric into acceptable particle sizes. These pieces of fabric can end up needing to be removed by hand, which can significantly slow production rates. Chip seal surface treatments N o. o f D oc um en te d CI R Pr oj ec ts Source: Based on Cox and Howard 2013. Figure 1. Documented traffic levels. Location Materials AADT Source Average Minimum Maximum State Agency Projects Iowa CIR with emulsions 1,217 130 5,842 Chen 2006; Lee and Kim 2007 Nevada CIR with chip seal 581 40 4,880 Busch 2012; Sebaaly et al. 2018CIR with overlay 2,558 233 15,875 Canadian Projects* Ontario Ministry of Transportation CIR with emulsions 5,086 1,950 8,600 Bhavsar 2015 CIR with foamed asphalt 7,975 1,100 35,800 United Counties of Stormont, Dundas, and Glengarry CIR with emulsions 2,168 356 4,536 CIR with foamed asphalt 1,589 526 5,674 Region of Waterloo CIR with emulsions 6,337 500 23,317 CIR with foamed asphalt 4,903 500 10,000 County of Perth CIR with emulsions 2,463 515 7,755 CIR with foamed asphalt** 6,710 6,710 6,710 *Wearing surface not identified in the report. **Different sections on the same roadway were rehabilitated under different contracts. Table 2. Summary of traffic levels on CIR projects.
10 Practice and Performance of Cold In-Place Recycling and Cold Central Plant Recycling tend to have high asphalt binder contents that are polymer or crumb rubber modified (Wagner 2018; Schellhammer 2019). Patching of the roadway is done intermittently, over time, with whatever patching materials are on hand at the time. This means the patching mix properties vary significantly from year to year. The variability in the milled material properties increases with the type and extent of surface treatments and patching. Thus, the materials that are in the existing pavement to be recycled significantly influence the selection of any new materials needed for the cold recycled mix. When there are areas within a single project with significantly different materials and layer thicknesses, then multiple mix designs are needed for each area. Site Investigation There are four components to the initial site investigation (Wagner 2018; Christianson and Mahoney 2019; Jones 2019): ⢠Visual inspection ⢠Confirmation of pavement layer thickness and thickness consistency ⢠Structural support evaluation ⢠Confirmation of roadway attributes (e.g., overhead clearance, utilities, signage, load restrictions) Visual Inspection A thorough visual evaluation of the project is necessary to identify any specific site drainage and support deficiencies that need to be addressed. Localized areas with edge cracking, excessive numbers of potholes and patching at the outer edges of roadways, alligator cracking that extends across the full lane width, wet areas in the pavement, and vegetation (such as cattails) in nearby drainage ditches are all indicators of potentially poor drainage conditions (Figures 2 and 3). Confirmation of Pavement Layer Thickness and Thickness Consistency Full-depth cores, obtained over the entire length and width of the project, are used to docu- ment individual and total layer thicknesses. The depth of any cracking is documented through Source: Schellhammer 2019. Figure 2. Alligator cracking and potholes across the full width of the lane indicate poor drainage.
Literature Review 11  a visual examination of the cores. The most successful projects ensure that the milling depth is deep enough to remove the cracking. When a milling depth of more than 5 in. (125 mm) is needed to remove deep cracks, then CCPR or full-depth reclamation (FDR) should be consid- ered (Schellhammer 2019). However, CCPR projects can leave a freshly milled surface open to traffic until milling is completed and the cold recycled mix is placed (see Milling in the Construc- tion Processes section). The total thickness of the existing pavement identifies if there will be sufficient RAP for the optimum performance of the recycling equipment. FHWA initially defined optimum milling depths as 2 to 4 in. (50 to 100 mm) (Kandhal and Mallick 1997, chap. 13). Cox and Howard (2013) reported that most of the CIR projects documented in publications (1983 through 2011) had recycled thicknesses of 5 in. (125 mm) or less (Figure 4). CIR âfluffsâ the mix so an existing thickness of 3 in. (75 mm) yields 4 in. (100 mm) of CIR. Recent recommendations define milling depths between 3 in. and 5 in. (75 mm and 125 mm), with 3 to 4 in. (75 to 100 mm) as optimum, for CIR processes (Wagner 2018). A milling depth of less than 3 in. (75 mm) may not be deep enough to produce sufficient cold recycled mix for optimum paving processes (Schellhammer 2019). A visual evaluation of the cores is used to log the thicknesses of each layer in the existing pavement. Different pavement layers can represent different types of asphalt mixtures, each with different material properties. These differences make it difficult to regulate the recycling agent and stabilizing agent quantities (Cross 2014). They further lead to increased variability in the cold recycled material properties and to potential differences in both service life and the length of the project. Ground-penetrating radar (GPR) technology provides a good visual log of the total thick- ness of the pavement for the entire length of the project (Cross 2014). However, identifying the thicknesses of individual layers of similar materials (e.g., original and subsequent overlays of dense-graded asphalt) is not always easy (Diefenderfer et al. 2017). Source: Schellhammer 2019. Figure 3. Cattails in the drainage ditch indicate poor drainage.
12 Practice and Performance of Cold In-Place Recycling and Cold Central Plant Recycling Structural Support Evaluation The load-carrying capability of the unbound pavement layers can be evaluated using a falling weight deflectometer (FWD, ASTM D4694) or a dynamic cone penetrometer (DCP, ASTM D6951). Some agencies, including the Nevada Department of Transportation (Nevada DOT), routinely use FWD testing when the structural support is questionable (Busch 2012). While the use of FWD is noted for evaluating the existing structural support, no information about acceptable values was found. DCP testing is usually conducted once full-depth cores are taken. Because the original use for the DCP was to indicate the load-carrying capability of soils and unbound materials, several correlation equations have been developed that estimate the soil bearing capacity [California Bearing Ratio (CBR)] to the DCP results (Burnham 1997; Davich et al. 2006; Alghamdi 2016; Minnesota DOT 2017). Burnham (1997) conducted over 700 tests during construction of the mainline and low-volume sections of Minnesotaâs pavement test track (MnROAD), which focused on developing threshold DCP values to indicate acceptable layer support (Table 3). The DCP value increases with decreasing moisture content (Davich et al. 2006). While varia- tions in moisture content in the unbound layers can make results more variable, the dependency on moisture content makes it useful for evaluating localized areas of poor support that need to be addressed before any rehabilitation project. Confirmation of Roadway Attributes The presence, frequency, and location of utility covers need to be assessed during the prelimi- nary project assessment (Wagner 2018). Any dimensional height and width restrictionsâsuch as overhead power lines, trees, bridges, mailboxes, and guardrailsâneed to be located and documented. Vertical clearances need close attention as CIR mix tends to âfluff.â For example, a milling depth of 3 in. (75 mm) can result in a CIR layer thickness of 4 in. (100 mm), not including the wearing surface. The increased volume is a function of the higher CIR mix air Figure 4. CIR layer thicknesses reported in documents. 1 8 50 59 55 6 1 2 1 0 10 20 30 40 50 60 70 N o. o f D oc um en te d CI R Pr oj ec ts CIR Layer Thicknesses Reported Source: Based on Cox and Howard 2013.
Literature Review 13  void content (typically 9% to 17%) and additional materials added to the milled material (e.g., corrective aggregate, recycling agents, fillers). It may be necessary to pre-mill and haul off a thin layer of the existing pavement to maintain the required vertical clearances (Brown 2013). Alter- natively, the extra volume of material can be used to widen the lane. For example, a CIR project can widen an existing lane width of 11 ft (3.4 m) to 12 ft (3.7 m) (D. Schellhammer, personal communication, April 24, 2020). The roadway profile and cross slope need to be evaluated to determine if any adjustments are needed. The cold planing process can be used to obtain a 0.5% cross-slope correction (Wagner 2018; Schellhammer 2019) although newer three-dimensional millers can provide tighter control on profile and cross-slope adjustments. If possible, shoulders should be recycled at the same time as the adjacent lane (Cross et al. 2010). Doing so helps minimize any potential for shoulder drop-off. It also helps prevent any transverse cracks remaining in the shoulders from initiating reflective-type cracking at the edge of the new surface. The minimum shoulder depth for recycling needs to be at least 1 in. greater than milling depth to keep from including unbound material in the recycled mix. Shoulders with severe alligator cracks can make it difficult to mill the shoulder material to the desired particle size, and the oversize material may end up in the recycled mix (Cross et al. 2010). Shoulders that are 4 ft (1.2 m) or less wide can be recycled in one pass with an appropriate extension to the milling machine. Alternatively, a smaller narrow-width miller can be used to mill and deposit material into the path of the full-sized miller. Other options include replacing shoulders before recycling the main pavement or milling the shoulders before the mainline, then paving the full width of the lane and shoulder at one time. Material DCP Value Estimated CBR Value from Equation Estimated Youngâs Modulus from Equation* Key Threshold Valuesa Silty clay soil < 25 mm/blow (< 1.0 in./blow) > 8 > 37 MPa (> 5,366 psi) Select granular aggregate < 7 mm/blow (< 0.28 in./blow) > 33 > 141 MPa (> 20,517 psi) MnROAD Class 3 special aggregate < 5 mm/blow (< 0.20 in./blow) > 48 > 202 MPa (> 29,298 psi) Range of Valuesb Clay (USCS for CL)** 15 to 127 mm/blow (0.6 to 5 in./blow) 2 to 17 7 to 63 MPa (1,015 to 9,137 psi) Sand (S-W) 6 to 15 mm/blow (0.2 to 0.6 in./blow) 17 to 45 63 to 167 MPa (9,137 to 24,221 psi) Gravel (G-W) 2.7 to 5 mm/blow (0.1 to 0.2 in./blow) 53 to 100 202 to 389 MPa (29,298 to 56,420 psi) ARRA Recommendationsc Poor support range > 25 mm/blow (> 1 in./blow) < 8 < 37 MPa (< 5,366 psi) Marginal support range 15 to 25 mm/blow (0.6 to 1 in./blow) 8 to 17 37 to 63 MPa (5,366 to 9,137 psi) Acceptable support range < 15 mm/blow (< 0.6 in./blow) > 17 > 63 MPa (> 9,137 psi) *Correlation equation evaluated by Davich et al. 2006. **USCS = Unified Soil Classification System, ASTM D2487. a Source: Based on Burnham 1997. b Source: Skinner n.d. c Source: Cross et al. 2014. Table 3. Estimated DCP values for various pavement layer materials.
14 Practice and Performance of Cold In-Place Recycling and Cold Central Plant Recycling Any load restrictions on roadways leading in and out of the project area need to be checked to avoid any problems with moving heavy recycling equipment in and out of the work area (Schellhammer 2019). Grades and curves can have an impact on recycling construction but are not limiting factors. Steeper grades may reduce milling and paving speeds. Also, recycling operations on downhill grades tend to encourage faster equipment speeds, which result in a rougher milling texture and larger maximum RAP particle sizes. Project Selection Summary Project selection is initially based on the types and extent of existing functional pavement distresses. Less experienced agencies tend to limit cold recycling to roadways with lower traffic levels, while agencies with more experience take on higher traffic levels with overlays and appro- priate pavement designs. Site investigations, coring, and assessments of adequate subgrade support and drainage are an essential part of the project selection process. Pavement Design The pavement design process involves considering the material properties for each layer in the pavement structure to select the appropriate materials and layer thicknesses needed to carry traffic for the design life of the road. Agencies with more cold recycled experience recognize the importance of selecting appropriate wearing surface materials and thicknesses for higher traffic volume roadways. Conventional dense-graded asphalt mix overlays from 1.5 to 3 in. (37 to 75 mm) are used when more structural support is needed to carry the traffic loads (Busch 2012). An SMA wearing surface can also be used (Kergaye 2017). Cold recycled mixes can be topped with simple surface treatments when an overlay is not needed to carry the traffic loads. The Nevada DOT uses a double chip seal on roadways with AADTs less than 5,000 (Busch 2012). Double chip seals are a good option when roadways need to tolerate snowplows (Cross et al. 2010). The AASHTO 1993 design methodology used the resilient moduli value of each material to establish an appropriate structural layer coefficient. The newer AASHTO Mechanistic Empirical Pavement Design Guide (MEPDG) updates that methodology: the Level 1 pavement design methodology requires the material dynamic moduli over a range of temperatures and loading frequencies to define how the layer stiffness changes with changes in the environmental and loading conditions. Additional testing can be used to define key permanent deformation and cracking characteristics that can be used in rutting and cracking prediction models. Resilient Modulus Asphalt mix resilient modulus is determined using the AASHTO TP 31-96 or ASTM D7369 standard. Research findings show that smaller maximum RAP particle size gradations produce cold recycled mixes with higher moduli than gradations with larger maximum particle sizes (Nemati 2019) (Table 4). The resilient moduli are strongly influenced by the RAP source (Soohyok et al. 2018) (Table 5). The use of corrective aggregate can substantially increase the mix stiffness (Table 6), but each RAP source seems to have an optimum percentage of correc- tive aggregate that will produce a maximum stiffness (Arambula-Mercado et al. 2018). Tables 4 through 6 show that foamed asphalt cold recycled mixes tend to have lower resilient moduli values than emulsion cold recycled mixes.
Literature Review 15  Corrective Aggregate, % Resilient Modulus @ 77°F (25°C), ksi Limestone RAP Granite RAP Emulsion Foamed Asphalt Emulsion Foamed Asphalt 0% 294 134 ND ND 20% 272 500 319 ND 40% 413 314 407 233 ND = no data. Source: Based on Arambula-Mercado et al. 2018. Table 6. Influence of corrective aggregate on laboratory-mixed, laboratory-compacted cold recycled mix resilient modulus. Emulsion Code* Resilient Modulus @ 77°F (25°C), ksi** 19 mm 12.5 mm 1 586 850 1a 550 1,050 *Specific emulsion types not identified in document. **Emulsions, 10% air voids. Source: Based on Nemati 2019. Table 4. Influence of maximum RAP size on emulsion CCPR resilient modulus. Roadway for RAP Source* Resilient Modulus @ 77°F (25°C), ksi** CSS-1H PG58- 28*** PG64-22*** US-60 370 180 160 I-40 390 180 220 FM-92 700 410 410 *Designations: US = U.S. highway route, I = Interstate highway, FM = farm to market route. **Estimated from graph, laboratory mixed. ***Foamed asphalt. Source: Based on Soohyok et al. 2018. Table 5. Influence of RAP source on CIR resilient modulus.
16 Practice and Performance of Cold In-Place Recycling and Cold Central Plant Recycling Diefenderfer and Apeagyei (2014) obtained cores from the foamed asphalt CIR and CCPR Virginia DOT I-81 project and measured the resilient modulus at three temperatures. The two CCPR test sections were 6 in. (150 mm) and 8 in. (200 mm) thick and, given the thickness, were likely paved in two lifts. The CIR test section was 5 in. (125 mm) and likely paved in a single layer. All cores were cut into upper and lower specimens to determine if there was any differ- ence in the modulus throughout the cold recycled mix layer (Table 7). The lower portion of the CCPR cores shows significantly lower moduli values at all three test temperatures compared to the top portion of the cores. The moduli values were more consistent for the thinner CIR cores. The average foamed asphalt cold recycled core moduli are generally higher than values reported by other researchers for laboratory-mixed foamed asphalt cold recycled mixes. Structural Layer Coefficients The AASHTO 1993 pavement design method uses structural layer coefficients to represent the relative contributions of each pavement layer to the overall structural number, SN. Each pave- ment layer contributes support through the layer depth, D, the structural layer coefficient, a, and the ability of the layer to manage drainage, m. The structural layer coefficient represents the contribution of each layerâs support (stiffness) and resistance to pavement distresses. The general equation is written as follows: 1 1 2 2 2 3 3 3= + + +SN a D a D m a D m a D mi i i The subscript indicates the pavement layer, starting with the wearing course as number 1. Layer coefficients for conventional dense-graded asphalt paving mixes as well as unbound aggregate subbase and base materials are well established and calibrated to fit each agencyâs specific materials, climate, and traffic conditions. However, a wide range of layer coefficients from 0.17 to 0.45 has been suggested or adopted for cold recycled mixes (Table 8). Actual local performance and experience can inform the selection of any adjustments. Dynamic Modulus The AASHTO MEPDG method uses fundamental material properties over a range of temper- atures as inputs. Level 1 allows the direct input of dynamic modulus and binder properties [three to eight test temperatures, three to six frequencies; the default temperatures (°F) are 14, 40, 70, 100, and 130; the default frequencies (Hz) are 0.1, 1, 10, and 25] (Vitillo 2012). The two AASHTO standards that apply to dynamic modulus testing and analysis are ⢠AASHTO T 342 â Standard Method of Test for Determining Dynamic Modulus of Hot Mix Asphalt (HMA), and ⢠AASHTO R 62 â Standard Practice for Developing Dynamic Modulus Master Curves for Asphalt Mixtures. Temperature Resilient Modulus, ksi CCPR CIR Top Bottom Top Bottom 39°F (4°C) 1,331 745 1,170 1,066 68°F (20°C) 574 412 555 595 100°F (38°C) 326 254 250 324 Source: Based on Diefenderfer and Apeagyei 2014. Table 7. Foamed asphalt CCPR and CIR core resilient modulus.
Literature Review 17  The dynamic moduli over a range of frequencies and temperatures were reported in several research reports (Table 9). These data represent cold recycled mixes with various binders (emul- sion, foamed asphalt), active fillers (Portland cement, lime slurry), and corrective aggregate. Cold recycled mixes are significantly less temperature sensitive than conventional dense- graded hot asphalt mixtures, regardless of the material used to produce the cold recycled mixes (Figure 5) (Carter et al. 2013; Stimilli et al. 2013; Bhavsar 2015; Schwartz et al. 2017; Arambula- Mercado et al. 2018; Buczynski and Iwanski 2018; Carvajal 2018; Soohyok et al. 2018; Cosenza and Robinson 2019; Nemati 2019). The moduli of the cold recycled mixtures are usually about only one-third of the conventional mix moduli at lower temperatures and similar at warmer temperatures. Either cement or lime additives further reduce the temperature sensitivity (i.e., flatten the slope of the relationship) and increase the moduli slightly at the warmer temperatures. Cement, depending on the percentage used, usually increases the dynamic moduli more than lime. Consistent trends reported by various researchers indicate ⢠Foamed asphalt cold mixes tend to be less sensitive to changes in temperature than emul- sion cold mixes (Bhavsar 2015), and ⢠CIR mixes are somewhat stiffer than CCPR mixes (Schwartz et al. 2017; Matthews et al. n.d.). Influence of Recycling Agent Content on Dynamic Moduli Foamed asphalt mixes show higher dynamic moduli values at higher temperatures (lower frequencies) and lower moduli at colder temperatures (higher frequencies) than cold recycled mixes with emulsions (Gandi et al. 2016; Gu et al. 2018). However, this trend is influenced by the foamed asphalt content. Location Structural Layer Coefficient Recycling Agents, Comments Source Indiana 0.22 Recycled base Cosenza and Robinson 2019 New Mexico 0.25 No information Jahren et al. 2016 Nevada 0.23 to 0.26 Based on fatigue analysis Carvajal 2018 Nevada 0.28 No information Jahren et al. 2016 Kansas 0.25 to 0.28 No information Jahren et al. 2016 Oregon Considered equivalent to conventional asphalt mixes No information Cox and Howard 2015 Quebec 0.30 No information Carter et al. 2013 General 0.30 Used in analysis Cross et al. 2010 AASHTO 1993 design guide 0.32 No information Schwartz et al. 2017 General 0.28 to 0.33 AASHTO 93 Wielinski 2017 General 0.25 to 0.35 0.30 to 0.35 most common Wagner 2018 General 0.30 to 0.35 No information Cross 2014 General 0.26 to 0.36 HF recycling agent CIR* Cox and Howard 2015 Virginia I-81 0.39 Foamed asphalt CCPR, CIR Cross 2014 National Center for Asphalt Technology Test Track 0.40 Foamed asphalt CCPR, CIR Schellhammer 2019 VDOT 0.36 to 0.44 No information Wagner 2018 General 0.17 to 0.44 Emulsion CIR Cox and Howard 2015 General 0.45 CMS-2 emulsion CIR Cox and Howard 2015 *HF = high float. Table 8. Structural layer coefficients found in the literature.
18 Practice and Performance of Cold In-Place Recycling and Cold Central Plant Recycling The cold recycled mix dynamic modulus tends to be dependent on the type and amount of recycling agent (Figure 6, Bhavsar 2015). Increasing the foamed asphalt content lowers the modulus at higher frequencies (lower temperatures) and increases it at lower frequen- cies (higher temperatures). Increasing the emulsion content produced little difference in the dynamic modulus except at the lowest frequencies (highest temperatures). Foamed asphalt cold recycled mix stiffness can be more sensitive to the asphalt content than cold recycled mixes with emulsions. Influence of RAP Source and Gradation on Dynamic Modulus Soohyok et al. (2018) used three sources of RAP to investigate the influence of both the RAP source and type of binder on cold recycled mix modulus. The source of RAP produced Temperature Dynamic Modulus at Various Frequencies, ksi Frequency, Hz 0.1 0.5 1 5 10 25 CIR, Foamed Asphalt, Limestone RAPa 14°F (â10°C) 833 986 1,050 1,188 1,243 1,311 40°F (4.4°C) 444 583 647 801 868 955 70°F (21.1°C) 174 253 294 407 463 541 100°F (37.8°C) 66 99 118 175 206 253 130°F (54.4°C) 29 42 50 73 87 110 CIR, Emulsion, Lime Slurryb 14°F (â10°C) 1,008 1,139 1,194 1,317 1,368 1,433 40°F (4.4°C) 631 761 819 953 1,010 1,085 70°F (21.1°C) 303 402 449 568 622 695 100°F (37.8°C) 121 177 206 286 325 382 130°F (54.4°C) 43 68 82 125 147 182 CCPRc 14°F (â10°C) No data 40°F (4.4°C) 532 625 705 839 897 973 70°F (21.1°C) 192 267 302 406 455 521 100°F (37.8°C) 61 93 109 165 196 237 130°F (54.4°C) 28 39 46 67 80 100 CIR, Foamed Asphalt (2.5%), Portland Cement (2%), Corrective Aggregate 20%d Temperature Frequency, Hz 0.1 0.3 1 3 10 20 19.4°F (â7°C) 998 1,058 1,119 1,180 1,244 1,298 41°F (5°C) 735 802 874 938 1,026 1,045 55°F (13°C) 580 654 731 805 897 928 77°F (25°C) 364 428 499 570 665 723 104°F (40°C) 217 257 304 360 573 497 aSource: Arambula-Mercado et al. 2018. bSource: Carvajal 2018. cSource: Cosenza and Robinson 2019. dSource: Buczynski and Iwanski 2018. Table 9. Documented dynamic modulus values for a range of laboratory-mixed, laboratory-compacted CIR and CCPR specimens.
Literature Review 19Â Â 10 100 1,000 10,000 0 20 40 60 80 100 120 140 Dy na m ic M od ul us , @ 1 H z, k si Temperature, F CIR, Foamed Asphalt, Texas CCPR, Foamed Asphalt, Indiana/Virginia CIR, Emulsion, Lime Slurry, Nevada CIR, 2.5% FA, 2% C, 20% Agg, Poland Surface Mix, Virginia Sources: Indiana/Virginia: Cosenza and Robinson 2019; Nevada: Carvajal 2018; Poland: Buczynski and Iwanski 2018; Texas: Arambula-Mercado et al. 2018; Virginia: Habib 2017. Figure 5. Comparison of cold mixes to conventional dense-graded hot asphalt mixture (laboratory-mixed, laboratory-compacted specimens). Source: Based on Bhavsar 2015. Figure 6. Influence of binder content on laboratory-mixed, laboratory-compacted cold mix dynamic modulus specimens.
20 Practice and Performance of Cold In-Place Recycling and Cold Central Plant Recycling significant differences in the moduli (Figure 7). The type of recycling agent for a given RAP source shows emulsion cold recycled mixes tend to have slightly higher moduli than foamed asphalt cold recycled mixes. Ma (2018) showed there was little impact on the dynamic moduli of foamed asphalt cold recycled mixes with different gradations (Figure 8). In general, the prop- erties of the RAP have more influence on cold recycled mix stiffness than the type of recycling agent does. Influence of Corrective Aggregate on Dynamic Moduli Corrective aggregate can increase the cold recycled mix dynamic moduli, and the differences are more significant at higher temperatures. Results reported by Arambula-Mercado et al. (2018) show the foamed asphalt cold recycled mixtures with 20% corrective aggregate signifi- cantly increase the mix stiffness (Figure 9). The stiffness increases only slightly more when the percentage of corrective aggregate increases to 40%. In a separate study, Buczynski and Iwanski (2018) demonstrated similar results for the dynamic modulus, which increases with increasing percentages of corrective aggregate in foamed asphalt mixtures (Figure 10). The percentage of corrective aggregate has more impact at lower temperatures than at high temperatures. CCPR and CIR Core Dynamic Modulus An extensive, recently completed, research program obtained cores from cold recycling proj- ects around the country. Average values for CCPR, CIR, CIR mixes with lime, and CIR mixes with Portland cement mixesâall using emulsion recycling agentsâare similar at lower temper- atures (B. Diefenderfer, personal communication, May 11, 2020). At higher temperatures, the CCPR average moduli are somewhat higher than the average CIR moduli. The use of lime noticeably increases the average high temperature of CIR moduli. Portland cement provides a further, but small, increase in the average CIR stiffness at a higher temperature (Figure 11). All the CIR and CCPR mixtures exhibit viscoelastic properties; however, the viscoelastic behavior is significantly different from conventional asphalt base. Source: Based on Soohyok et al. 2018. Figure 7. Influence of RAP source on laboratory-mixed, laboratory- compacted specimen dynamic modulus.
Literature Review 21Â Â Source: Based on Ma 2018. Figure 8. Influence of RAP gradation on foamed asphalt cold recycled mix laboratory-mixed, laboratory-compacted specimen dynamic modulus. Source: Based on Arambula-Mercado et al. 2018. Figure 9. Influence of corrective aggregate on foamed asphalt cold recycled mix laboratory-mixed laboratory-compacted specimen dynamic modulus.
22 Practice and Performance of Cold In-Place Recycling and Cold Central Plant Recycling Source: Diefenderfer, personal communication, 2020. Figure 11. Average dynamic moduli for emulsified asphalt CIR and CCPR cores. Source: Based on Buczynski and Iwanski 2018. Figure 10. Evidence of peak dynamic modulus due to percentage of corrective aggregate in laboratory-mixed, laboratory-compacted foamed asphalt cold mix specimens.
Literature Review 23  Pavement Design Summary Agencies using the older AASHTO 1993 pavement design methodology employ a wide range of structural layer coefficients. Some dynamic modulus data can be used in the MEPDG pave- ment design methodology, but data that can be used in cracking and rutting models have not been documented. Cold recycled mixtures have viscoelastic properties that are distinctly dif- ferent from those seen in conventional hot asphalt mixtures. Pavement performance prediction models were developed for conventional hot asphalt pavements and have not been validated for systems with cold recycled material layers. Individual Materials The materials used to produce cold recycled mixes include the following: ⢠RAP ⢠Fillers (e.g., lime, cement) ⢠Recycling agents (i.e., binders such as emulsions and foamed asphalt) ⢠Corrective aggregate RAP RAP material for mix designs needs to be obtained from the project roadway. Field sampling of the pavement at multiple locations can be accomplished using coring, block sawing, or milling with a small cold planer (Wagner 2018). RAP for more than one mix design may be needed if the roadway materials vary significantly throughout the project. Each mix design needs about 400 lb (180 kg) of usable RAP to prepare specimens 6 in. (150 mm) in diameter (AASHTO PP 86 2019). Only about 200 lb (90 kg) of RAP is needed to prepare specimens 4 in. (100 mm) in diameter (ARRA CR201, CR202). The cores need to be separated, and only the portion of the pavement that will be recycled in the field need be retained for mix designs. Once the desired portions of the core (or slab) are isolated from the remainder of the core or slab, a laboratory jaw crusher can be used to crush the RAP so that 100% passes the specified maximum particle size. The RAP needs to be crushed in the laboratory in such a way that the resulting RAP gradation represents the maximum particle size, shape, and gradation that will be obtained with the cold planer (i.e., miller) (Wielinski 2017; Cross 2018; Jones 2019). AASHTO PP 86 requires the RAP to be oven-dried to a constant mass at 104°F ± 4°F (40°C ± 2°C). ARRA CR201 and CR202 note that drying RAP at 104°F (40°C) can take several days to reach a constant mass. Researchers have used a range of RAP drying temperatures and drying times. For example, Arambula-Mercado et al. (2018) dried RAP for 4 hours at 230°F (100°C). Buczynski and Iwanski (2018) oven-dried RAP at 104°F (40°C). RAP that was not immediately used was stored in sealed containers to prevent the material from absorbing moisture from the environment. Bhavsar (2015) air-dried RAP for at least 24 hours at room temperature. The top RAP size varies, depending on the agency. McCarty (2017) with the Arizona DOT indicated that 100% of the processed RAP should pass the 1.25-in. (32-mm) sieve or the 1-in. (25-mm) sieve, depending on the thickness of the cold recycled mix layer to be placed. Cox and Howard (2013) reported that 22 of 28 documented CIR studies used gradations with 100% passing the 1-in. (25-mm) sieve. Cross (2012) reported the results from a survey of 13 agen- cies that showed ⢠One agency allowed particle sizes greater than 2 in. (50 mm), ⢠Three agencies required less than 1.5 in. (37 mm), ⢠Eight agencies required less than 1.25 in. (32 mm), and ⢠One agency required less than 1 in. (25 mm).
24 Practice and Performance of Cold In-Place Recycling and Cold Central Plant Recycling AASHTO PP 86, ARRA CR201, and ARRA CR202 require that 100% of particles pass the 1-in. (25-mm) sieve when preparing specimens 4 in. (100 mm) in diameter. The RAP gradation is a function of the pavement temperature, the forward speed of the recy- cling machine, the rate of rotation of the milling drum, and the positioning of the gradation control beam (Wirtgen Group 2004). Unlike gradations for conventional dense-graded hot asphalt mixtures, cold recycling gradations are characterized by three typical gradations: fine, medium, and coarse. The medium and coarse gradations represent cold planers in the up-cut mode (ARRA CR201, CR202) used with standard milling operations. Fine and medium grada- tions were developed to represent sizes produced by cold planers in the down-cut mode, but the fine gradation is not commonly used. Examples of cold recycling gradation bands are shown in Table 10. Changes in gradations during production can be a function of the pavement temperature, which changes as milling progresses throughout the day. Higher temperatures during milling can result in finer RAP gradations, and colder pavement temperatures result in coarser grada- tions (Cross 2012). Oversize RAP millings are sent to a crushing unit, which helps keep the overall project gradation relatively consistent throughout the day. Cross (2012) documented a comparison of gradations from materials sampled in the morning compared to the afternoon, which showed no significant differences in the gradation. Some agencies use AASHTO T 11 to determine the percentage passing the No. 200 (0.075- mm) sieve by washing before fractionating with AASHTO T 27 (Illinois DOT 2012). Others prefer to use the unwashed, crushed RAP (Utah DOT 2017, ARRA CR201). AASHTO PP 86 indicates that AASHTO T 11 can be used if there are appreciable fines in the RAP. Foamed asphalt cold recycled mixes need enough fine aggregate to form the asphalt mastic phase that âspot weldsâ the RAP particles together (Khosravifar 2012; Wirtgen Group 2004). During mixing, the water suspends the fines in the RAP, which helps the foamed asphalt form the asphalt-fines matrix. When the RAP does not have sufficient fines, active fillers can be added to increase the percentage of fines. Sieve Size Illinois DOT* Utah DOT** ARRA CR201, CR202 (Emulsion, Foamed Asphalt Cold Recycled Mixes) AASHTO MP 31, MP 38 (Emulsion, Foamed Asphalt Cold Recycled Mixes) Ideal Target for Crushed Cores Fine Med. Coarse Fine Med. Coarse 2 in. (50 mm) 100 --- --- --- --- --- --- --- 1.5 in. (37.5 mm) 87â100 100 --- --- --- --- --- --- 1.25 in. (31.5 mm) --- --- 100 100 100 100 100 100 1 in. (25 mm) 77â100 90 --- --- --- 100 100 85â100 3/4 in. (19 mm) 66â99 85 95â100 93â97 83â87 95â100 85â96 75â92 1/2 in. (12.5 mm) 67â87 68 --- --- --- --- --- --- 3/8 in. (9.5 mm) --- 59 --- --- --- --- --- --- No. 4 (4.75 mm) 35â56 40 60â70 48â52 38â42 65â75 40â65 30â45 No. 8 (2.36 mm) --- 20 --- --- --- --- --- --- No. 30 (0.60 mm) 18â33 8 20â30 8â12 3â7 15â35 4â14 1â7 No. 50 (0.30 mm) --- 5 --- --- --- --- --- --- No. 100 (0.15 mm) 10â24 1 --- --- --- --- --- --- No. 200 (0.075 mm) --- 0.6 1â7 1â3 0.5â2 --- --- --- *Washed gradation. **Unwashed gradation. ---: no requirements for sieve size. Sources: Illinois DOT based on Illinois DOT 2012; Utah DOT based on Utah DOT 2017. Table 10. Examples of RAP gradations used for cold recycled mix designs.
Literature Review 25  Foamed asphalt cold recycled mixes with finer gradations tend to produce tender mixtures that are susceptible to permanent deformation (i.e., rutting). Coarser RAP gradations tend to produce more rut-resistant mixes (Wirtgen Group 2004). Fillers Fillers can be nonactive or active. Nonactive fillers, such as mineral fillers, are used to increase the fines content of the foamed asphalt RAP gradation. Active fillers, such as lime and cement, react with one or more of the other cold mix materials. Fly ash, a pozzolan, can function as an active filler under certain circumstances but is infrequently used in cold recycled mixes. The Cox and Howard (2013) literature review showed that of the 146 instances of cold recycled mixes detailed in research studies, 13 used cement (8 with 1% or less, 4 with 2%, and 1 with 2.5%), 10 used lime (4 with 1% or less, 6 with 1.5%), and only 3 used fly ash (2 with 5%, 1 with 7%). Lime While lime is fine enough to be considered a filler, it is typically used to improve the mois- ture resistance of mixtures that are prone to stripping (Busch 2012; Illinois DOT 2012; Cross 2015; Utah DOT 2017; Carvajal 2018; Schellhammer 2019). Hydrated lime can be added dry or mixed with water at a 1:2 ratio to form a slurry (Carvajal 2018). The Nevada DOT requires lime slurries to be used in all CIR mixes to mitigate moisture sensitivity (Busch 2012; Carvajal 2018). In the past, the Utah DOT used a quicklime slurry to generate heat to help evaporate the water in the slurry (VanFrank et al. 2016). The current Utah DOT standard requires the use of 1% lime (Utah DOT 2017). AASHTO PP 86, for cold recycled mixes with emulsion, limits lime to a maximum of 1.5%; AASHTO MP 38, for foamed asphalt, limits lime to 1%. AASHTO MP 31 for emulsified asphalt and MP 38 for foamed asphalt cold recycled mixes require lime or quicklime to meet AASHTO M 216. Cement Cement can be used to improve moisture resistance but is more likely to be used to control the speed at which an emulsion breaks (Cross 2014). The cement hydration process uses the water in the mix to remove moisture and accelerate curing (Carter et al. 2013; Betti et al. 2017; McCarty 2017). Cement, typically 1%, is used with foamed asphalt to help improve the asphalt dispersion, increase the adhesion of the asphalt mastic to the aggregate, and increase the initial strength gain (Khosravifar 2012). AASHTO MP 31 for emulsified asphalt and MP 38 for foamed asphalt cold recycled mixes require Portland cement Type I or Type II to meet AASHTO M 85. Quebec, Canada, uses cement, typically around 1%, in its emulsion cold recycled mixes (Carter et al. 2013). A minimum ratio of emulsion residual asphalt content to cement of 3:1 is recommended to prevent brittle behavior (Cross 2015; AASHTO PP 86, MP 31). Excessive percentages of cement are to be avoided as the cement tends to make the mix more brittle (i.e., less ductile). Cement is alkaline and helps to counteract any acidic tendencies of the cationic emulsions (Fang et al. 2016). Recycling Agents Emulsions Emulsions are manufactured by introducing water (about 31%) and asphalt (68%) at the same time into a high shear milling process. This process produces fine asphalt droplets suspended in the continuous water phase. A chemical surfactant (about 1%) is added with the water to help
26 Practice and Performance of Cold In-Place Recycling and Cold Central Plant Recycling stabilize the asphalt droplets in the water (i.e., keep the droplets suspended) (Moors 2019). The surfactants give the asphalt droplets a surface charge (i.e., positive, negative). Emulsions are selected based on aggregate mineralogy, construction practices, and availability. Carbonate aggregates such as limestone and dolomite tend to have a positive surface charge; silicates such as granite, basalts, most gravels, and quartz have a negative surface charge. Slags and clay particles also have a negative charge. Aggregates and mineralogies with negative charges, if clean, work with cationic emulsions. Carbonate aggregates, which tend to be dusty, work well with high float (HF) emulsions. The opposite charges attract the emulsion to the aggregate surface, and the opposite charges neutralize each other, causing the emulsion to break. Emulsions âbreakâ when the droplets flocculate as they overcome the repulsive forces pro- duced by the same surface charge on each droplet surface (Yeung 2017). The Wirtgen Group (2004) defines breaking as the separation of the asphalt in the emulsion from the water phase. Damp aggregate surfaces help keep emulsions from breaking too fast and improve adhesion between the asphalt and aggregate surfaces (Christianson and Mahoney 2019). Engineered emulsions are designed to meet specific project requirements for mixing and coating ability, breaking times, curing times, moisture resistance, and the softening ability of aged RAP binder. Engineered emulsion formulations can be tailored for a specific project requirement by adjusting the stiffness of residual binder, using polymer modifications, adjusting the pH, and adding fluxing agents. Polymer modification can be used to improve cohesion, strength, and resistance to thermal cracking. High float emulsions typically have a small amount of fluxing agent (i.e., low-viscosity petroleum products) to promote coating and softening of the aged RAP binder. High float emulsions tend to more thickly coat smaller particles and leave larger particles only partially coated. In recent years, polymer-modified high float emulsions have become more common than traditional high float emulsions (Cross 2015; AASHTO MP 31). While medium-setting emulsions have been used in the past, cationic slow set (CSS) emul- sions provide longer times for workability. However, any moisture trapped in the cold recycled mix after compaction can lead to premature distresses. Like the high float emulsions, CSS emulsions tend to coat the finer particles. Rapid-setting emulsions are not typically used as they flocculate and coalesce rapidly (i.e., break) in the presence of fine aggregates and fillers. This results in balling of the bitumen and fines and only partial coating of the aggregates (Younes 2019). Solventless emulsions such as CSS-1, polymer-modified emulsions, and engineered emul- sions are commonly used to improve the RAP binder properties (Martin Asphalt 2016; Kergaye 2017; McCarty 2017). That is, most of the RAP particles are coated with the new binder, which diffuses into the oxidized RAP binder and eventually softens the RAP binder. Emulsions typically used by various agencies include CSS-1H (Iowa DOT, Minnesota DOT), high float medium set (HFMS-2s, Minnesota DOT), and engineered emulsions (Minnesota DOT, Illinois DOT) (Schellhammer 2019). AASHTO MP 31 lists the following emulsions as acceptable: ⢠Engineered emulsions with a base asphalt selected to meet the Long-Term Pavement Perfor- mance, LTPPBind, 98% reliability at a depth for the top of the CIR layer ⢠Cationic: CSS-1, CSS-1h ⢠Anionic: HFMS-2, HFMS-2h, HFMS-2s Cationic emulsions break because of chemical reactions. Anionic emulsions break because of evaporation, which is a mechanical process.
Literature Review 27  Influence of Cement on Emulsion Breaking Recent imaging research was used to describe how emulsion droplets coalesce in the presence of both mineral filler and Portland cement (Fang et al. 2016). When mineral filler was added, the asphalt droplets remained as uniform, discrete, round droplets typically 2 µm in diameter, or smaller. That is, the mineral filler did not influence the breaking of the emulsion. By compar- ison, using cement caused the small asphalt droplets to partially coalesce, forming much larger asphalt droplets close to 10 µm in diameter. This suggests the emulsion begins to break once the water in the emulsion comes into contact with the cement. That is, the hydration process starts in the presence of the water in the emulsion. Other researchers have also used imaging analysis to demonstrate the growth of hydration products when cement comes into contact with emulsions (Du 2015; Ma et al. 2015; Fang et al. 2016). Yang et al. (2019) demonstrated the increase in hydration products for a range of cement percentages added to emulsions. The hydration products form inside the asphalt droplets as they coalesce. At 2% or less cement, the hydration products are wrapped by the asphalt. The hydra- tion products become the main component when the percentage of cement is 3% or higher. When the cement content of the cold recycled mix is around 1%, the role of the cement is to control the rate of set of the emulsion and/or to provide increased fines content (Batista et al. 2014). At levels of cement over 1%, the cement begins to increase the mix strength but also tends to increase the cracking potential (i.e., mixes are more brittle) (Cox and Howard 2015). When the amount of Portland cement is between 3% and 5%, the cement increases the bearing capacity (load-carrying capability) of the layer (Batista et al. 2014), but the mix becomes more of a cement-stabilized base material. Foamed Asphalt Foamed asphalt is distributed throughout the cold recycled mix as discrete droplets that âweldâ RAP particles together (Wirtgen Group 2004). Fu (2009) and Fu et al. (2010) identify the different components in foamed asphalt cold recycled mixes as ⢠Asphalt mastic (foamed asphalt and finer particulates), ⢠Solid particles (e.g., RAP or corrective aggregate particles), and ⢠Active fillers, if used. Foamed asphalt uses standard PG asphalts (Bhavsar 2015). The solid particles provide the load transfer through the particle skeleton. The foamed asphalt comprises a combination of asphalt binder and fine aggregate particles (i.e., mastic) and is present in the cold recycled mix as discrete droplets that bond RAP particles together. The mineral filler portion of the mix consists of fine aggregates that are not incorporated into the asphalt mastic during mixing and help fill the voids between the larger particles. Foamed asphalt can require a higher percentage of No. 200 (0.075-mm) particles than is present in most milled materials. Active fillers such as cement or lime can be used to increase the fines content. Foamed asphalt is produced by injecting water into hot asphalt binder, which causes the asphalt to foam as the water turns to steam and is trapped inside the tiny asphalt bubbles (Khosravifar 2012; Wirtgen Group 2004). The asphalt temperature needs to be in the range 300°F to 360°F (149°C to 182°C), and the water content needs to be 2% to 3% for foaming. Two key characteristics are used to describe the foamed asphalt: (1) the foamed asphalt expansion ratio (ER), and (2) the time it takes the volume of the foamed asphalt to reduce by half [i.e., the half-life (HL)]. The expansion ratio is a ratio of the volume occupied by the expanded asphalt to the original asphalt volume, which influences how the binder will disperse in the mix (Jones et al. 2008).
28 Practice and Performance of Cold In-Place Recycling and Cold Central Plant Recycling The requirements for the ER are usually from 10 to 20, with 8 to 10 typically set as the minimum. The temperature of the aggregate can influence ER requirements. For example, an ER of 8 may be best when the solid particles are anticipated to be above 77°F (25°C); at cooler temperatures, an ER of 10 is more appropriate (Ma 2018). The half-life is the time needed for the volume to reduce by half and is an indication of the foamâs stability. The HL typically ranges from 6 to 15 seconds, with 6 seconds being a common minimum value. The temperature of the vessel for capturing foam and the relative humidity can influence measurements of both ER and HL characteristics, which influences the test results. The asphalt is selected at the appropriate PG grade for project site environmental conditions (Batista et al. 2014; Cross 2014; Schellhammer 2019). Higher viscosity asphalt needs higher temperatures to produce acceptable foamed asphalt characteristics. Part of the mix design process for foamed asphalt mixes is to determine the asphalt tempera- ture and percentage of water needed to achieve optimum foamed asphalt properties. This is accomplished by measuring the ER and HL characteristics at three temperatures using three different percentages of water. The Illinois DOT (2012) recommends 2%, 3%, and 4% by mass of asphalt. The process shown in Figure 12 needs to be repeated for three temperaturesâ320°F, 340°F, and 360°F (160°C, 170°C, and 180°C)âto identify the water content and temperature that produces the best ER and HL characteristics. Advantages of using foamed asphalt include the following (Bhavsar 2015): ⢠Mixes gain strength quickly and need shorter curing times. ⢠Less base binder is needed compared to emulsions. ⢠Mixes are somewhat less sensitive to adverse weather conditions during construction. Corrective Aggregate Corrective aggregate can be used to adjust the overall cold recycled mix gradation. If the percentage passing the No. 4 (4.75-mm) sieve is less than 65%, then corrective aggregate may be needed. RAP gradations with more than 65% passing the No. 4 (4.75-mm) sieve may benefit Figure 12. Example of how to determine the optimum water content for foaming asphalt at one temperature.
Literature Review 29  from amending the overall gradation; any benefit can be assessed during the mix design and with mix performance testing (Cross et al. 2010). Typically, cold recycled mixes contain no more than 20% of corrective aggregates. A survey of 13 agencies identified only 2 agencies that occasionally used corrective aggregate, and 1 agency that used corrective aggregate when widening the lane (Cross et al. 2010). The New York State DOT was the only agency that reported consistently using corrective aggregate. The Utah DOT uses the impact of temperature on RAP compactability at two temperatures, 80°F and 120°F (27°C and 49°C) to estimate when corrective aggregate is likely to be benefi- cial to the cold mix properties (Utah DOT 2017). The slope of the compaction-to-temperature relationship is developed by compacting graded RAP-only specimens at the two temperatures and then determining the specific gravity dimensionally and the RAP maximum gravity with AASHTO T 209. The percentage of the maximum density is used to calculate the upper and lower critical temperatures needed for adequate compaction. Additional mix designs with a 5% fine corrective aggregate need to be developed when the lower critical temperature is greater than 80°F (27°C). When the upper critical temperature is less than 120°F (49°C), additional mix designs with 5% coarse corrective aggregate are required. The function of the corrective aggre- gate is to fill the air voids with solid aggregate particles. If the original RAP material contains seal coat material, then mix designs are repeated without the seal coat material before using the corrective aggregate. Materials Summary Four materials commonly used to produce cold recycled mixes are RAP, active fillers, binders (emulsions or foamed asphalt), and corrective aggregate. Both active fillers and corrective aggre- gates are used only if the mix design process shows they are needed to meet mixture properties. RAP gradations are a function of miller speed, cutting head characteristics, and pavement temperature. The maximum RAP particle size is commonly specified as either 1.25 in. or 1 in. (37.5 mm or 25 mm) and is controlled during construction by scalping and crushing oversized material. Emulsions are typically solventless engineered emulsions, although some agencies use high float emulsions. Foamed asphalt uses standard PG asphalts. Lime is used to improve mois- ture resistance, while cement is used to facilitate emulsion breaking or to help distribute the foamed asphalt throughout the mix. Corrective aggregates are used to improve the strength and stiffness of the cold recycled mixes. Mix Designs Cold recycled laboratory mix design procedures are used to establish the correct gradation (RAP and any corrective aggregates), recycling, any stabilizing agent contents (Batista et al. 2014, Cross et al. 2014), and any active mineral fillers. The first step is to optimize the water content needed for workability (i.e., compactability). Some agencies skip this step by using a preset mois- ture content based on previous experience or research. Cox and Howard (2015) documented some of the mix design variables for nine agenciesâ mix design components (Table 11). More than one mix design may be needed, depending on how many areas of the pavement have different materials (Cross 2015). Regardless of the agency, the basic steps in either emulsi- fied or foamed asphalt cold recycled mix designs are similar. However, the specific procedures within each step vary substantially among the agencies. Regardless of the cold recycled mix design methods used by a given agency, they all start with obtaining sufficient existing pavement materials for the layers to be included in the field
30 Practice and Performance of Cold In-Place Recycling and Cold Central Plant Recycling recycling process for mix designs. The RAP is crushed and sieved into individual fractions so the required gradations can be batched. Most agencies dry the RAP to a constant mass at 104°F ± 4°F (40°C ± 2°C). Some agencies use washed gradations (e.g., the Illinois DOT), while others use unwashed RAP (e.g., the Utah DOT). Some agencies develop mix designs using two RAP gradations to bracket the likely production gradation variations, while others define a single ideal gradation for mix designs. Most agencies balance results for mix stiffness and/or indirect tensile strength, permanent deformation, and possibly cracking (Stimilli et al. 2013; Utah DOT 2017; Suleiman 2019). This process adjusts the mix design parameters to balance the best possible overall performance (Saidi 2019). Cox and Howard (2015) documented nine agenciesâ pavement performance test methods for stability and/or strength, moisture sensitivity, low-temperature cracking potential, and raveling under traffic (Table 12). Binder Contents The purpose of mix designs is to select an optimum binder content for a given gradation that produces a mix that meets the required mix properties such as air voids, strength, stiffness, and moisture resistance. Emulsion Contents Cox and Howard (2013) documented 145 instances in 63 documents of emulsified asphalt content in CIR mixes (Figure 13). The majority of the emulsion contents were from 0.5% to 2%, and the foamed asphalt contents ranged from 1% to 1.5%. More current examples of cold recycled mix binder contents tend to show somewhat higher contents. Mix Designs CA IL IA KS MS MT NY TX VA Moisture content Set range 1.5% to 2.55% --- 1.5% 1.5% to 2.5% --- --- 1.5% to 2.5% 1.5% to 4.5% --- AASHTO T 180, Proctor --- --- --- --- X --- --- --- X Other --- Needed for dispersion --- --- --- Expected during milling --- --- --- Compaction Marshall, 75 Blow X --- --- --- --- --- X --- X Gyratory, 30 X X X X X X X --- X Gyratory, 35 --- --- --- --- --- --- --- X Curing 60°C X X X X X X X 16 to 48 hours X X X X X 48 hours --- --- X --- --- --- --- --- --- Density Compacted, AASHTO T 166 X X X X --- --- --- --- --- Compacted, AASHTO T 331 (vacuum seal) --- X --- --- --- --- --- --- --- Maximum gravity, AASHTO T 209 X X --- X --- X X X --- ---: no requirements indicated. Source: Based on Cox and Howard 2015. Table 11. Various mix design practices for emulsion mix designs.
Literature Review 31  California Department of Transportation (Caltrans) uses three emulsion contents for mix designs that are selected from between 0.5% and 4.0% at increments of either 0.5% or 1%. The percentages are based on the dry mass of RAP. The Minnesota DOT identifies 3% emulsion content as a likely optimum content and recom- mends using engineered emulsion for urban projects. Three emulsion contents are selected for mix designs from 1.5%, 2.0%, 2.5%, 3.0%, 3.5%, and 4.0% levels (Jahren et al. 2016). The Utah DOT defines a single starting point for the optimum emulsion content, which is estimated using the Asphalt Institute Manual Series No. 2 equation for calculating the effective film thickness of 8.0 µm (Utah DOT 2017). Two other binder contents for the mix design are selected at 0.5% on either side of this value. Mix Designs CA IL IA KS MS MT NY TX VA Testing AASHTO T 245, Marshall stability X X X X --- X X X X AASHTO T 245, Retained strength X X X X --- X X X X AASHTO T 322, Low temperature creep compliance --- X X --- X X X X ASTM D7196, Raveling X --- X X --- X X X X Agency specific Raveling Boil test, indirect tensile, TSR, Marshall quotient --- --- Tex 226, F, St, Hamburg --- ---: no requirements indicated. TSR = tensile strength ratio. Source: Based on Cox and Howard 2015. Table 12. Emulsion pavement performance test methods. N o. o f D oc um en te d CI R Pr oj ec ts Binder Content, % Figure 13. Binder contents documented in literature review by Cox and Howard (2013).
32 Practice and Performance of Cold In-Place Recycling and Cold Central Plant Recycling Foamed Asphalt Contents Cox and Howard (2013) documented 37 instances in 63 documents of foamed asphalt con- tent in CIR mixes (Figure 13). Most of the foamed asphalt contents were from 1.5% to 2.5%. More recent research documents show most of the foamed asphalt contents are at least 2% (Table 13). Optimum Water Content Water is added during construction to cool the millerâs cutting drum and needs to be factored into the mix design process. Laboratory studies use ranges of moisture content from 1.5% to 4.5%, but the actual water added during construction usually ranges from 1.5% to 2.5% (not including water in the emulsion) (Ortiz 2017). At appropriate amounts, water improves the workability of both emulsified and foamed asphalt cold recycled mixes (Batista et al. 2014; Gandi et al. 2016). Water also facilitates coating the particles by emulsions, helps keep the emul- sion from setting too quickly, improves the dispersion of the foamed asphalt within the solid particles, and improves compactability of cold recycled mixes in general. A balance is needed between high liquid contents (water and emulsion) for compaction improvement and low liquid contents that are desirable for rut and raveling resistance (Cross 2014). Cox and Howard (2013) documented the optimum water contents (OWC) found in their literature review (Figure 14). Most of the reported optimum moisture contents were 4% or lower. Some evidence in the litera- ture reviewed indicated that identifying an optimum moisture content could be difficult because of coarse RAP gradations and a lack of fines. Preliminary work using the Florida DOTâs Florida Method 1-T180 Proctor method indi- cated the dry specimen density ranged only from about 112 lb/ft3 to 115 lb/ft3 (1,794 kg/m3 to 1,842 kg/m3) for moisture contents ranging from 2 to 9% (Arambula-Mercado et al. 2018). Specimens mixed with 8% additional water and various percentages of emulsion were over- saturated in the mixing bowl, and the compacted specimens had free water on the surface of the specimen. Researchers arbitrarily set the moisture content for their research project at 4% based on the Cox and Howard (2015) study. Source Foamed Asphalt Content Jenkins 2000 1.5% to 4.5% Bhavsar 2015 1.2% to 3.2% Batista et al. 2014 2% to 3.5% 2.5% to 5% 3% to 4% Soohyok et al. 2018 2.0% Gu et al. 2018 2.2% Buczynski and Iwanski 2018 2.5% Bowers et al. 2020 2% to 2.5% Khosravifar 2012 2% to 3.5% Ma 2018 2% to 3% Betti et al. 2017 2% to 3% Fu et al. 2010 3.0% Arambula-Mercado et al. 2018 3.6% to 3.7% Table 13. Summary of typical foamed asphalt contents.
Literature Review 33  To prevent over-saturation of the cold recycled mix design specimens, some agencies set the additional water to be used for mix design purposes. Other agencies define a limit on the total liquid content (i.e., additional water plus emulsion). The Ontario Ministry of Transportation limits the total liquid content to 4.5% of the dry weight (Bhavsar 2015). Both Caltrans (2016) and the Minnesota DOT (Jahren et al. 2016) set the water content that is likely to be added at the cutting drum, from 1.5 to 2.5%. The Utah DOT developed a vibratory compaction method using a set gradation for fine RAP. This method uses a 100-gram RAP sample with a specified fine portion of the RAP gradation, 1% lime, and 24% water. This mixture is subjected to 15 seconds on a vibrating table as a starting point for setting the optimum moisture content. Liquefaction is defined as the amount of water needed to produce a noticeable film of water on the specimen surface and is used as an indication of the water needed to keep the emulsion from breaking too soon. The OWC for the complete RAP gradation is calculated based on the percent fine RAP in the total RAP gradation. One research project investigated using a Superpave gyratory compactor (SGC) to determine the OWC (Ma 2018). The modified Proctor method tended to indicate slightly higher OWC than the SGC by 0.8 to 2.5% OWC. Arambula-Mercado et al. (2018) evaluated the optimum moisture content for foamed asphalt cold recycled mixes. Two optimum moisture contents (0% and 4%) were arbitrarily selected. At 0%, the mixes had poor workability, and the foamed asphalt clumped together with the fines. At 4%, the mixes were workable, and no clumping was observed. Bazrafshan and Farhad (2017) evaluated the impact of varying the percentage of emulsion on indirect tensile strength while keeping the total liquid content constant (Figure 15). Three different gradations, a medium-setting emulsion, and 2% Portland cement were used. The total liquid content was held constant at 5.3% for the 19 mm gradation, 5.0% for the 25 mm grada- tion, and 4.3% for the 37.5 mm gradation. The indirect tensile strengths for the 19 mm grada- tion remained constant as long as the total liquid content was held constant. The 25 mm and 37.5 mm gradation strengths varied only slightly. The indirect tensile strengths decreased with increasing maximum particle size. It appears that different emulsion contents may not be as important as the total liquid content. Source: Based on Cox and Howard 2013. N o. o f D oc um en te d CI R Pr oj ec ts Additional Moisture Content, % Figure 14. Additional water content reported in literature.
34 Practice and Performance of Cold In-Place Recycling and Cold Central Plant Recycling Mixing, Compaction, and Curing Mixing Mixing is accomplished with a standard bucket mixer or laboratory pugmill. The dry RAP is mixed with the additional water, followed by any active fillers such as cement or lime, which is mixed into the RAP. The binder is added and the mixing continued for a short time, typically about 1 minute (Cross 2015). Compaction Specimens are typically compacted at ambient (room) temperatures, which in some cases is defined as 77°F ± 4°F (25°C ± 2°C), using either Marshall compaction with 75 blow/side or an SGC with either 30 or 35 gyrations. The Marshall compaction tended to produce densities that were closer to field densities than the SGC (Ma 2018). Some researchers varied the number of gyrations to achieve 12% air voids for specimens 6 in. (150 mm) in diameter (Buczynski and Iwanski 2018) or 13% voids (Carter et al. 2013; Ortiz 2017; Kazmi 2018). A Nevada research study compared Hveem and gyratory compacted specimens to deter- mine the optimum emulsion content. Both methods provided similar optimum asphalt contents (Carvajal 2018). Curing Procedures for curing cold recycled mix specimens vary: ⢠AASHTO PP 86 requires that specimens be extruded immediately after compaction, then cured for 16 to 48 hours at 140°F ± 2°F (60°C ± 1°C). ⢠A Nevada research project prepared emulsified asphalt cold recycled mixes with lime slur- ries and cured them for 48 hours at 140°F (60°C) (Carvajal 2018). ⢠A study for the Florida DOT (Arambula-Mercado et al. 2018) showed that compacted specimens, either emulsion or foamed asphalt, needed 24 hours in a forced draft oven at Source: Based on Bazrafshan and Farhad 2017. Figure 15. Influence on indirect tensile strength of holding total liquid content constant but varying the water-to-emulsion ratio.
Literature Review 35  140°F ± 5.5°F (60°C ± 3°C) to reach a constant mass. Curing was followed by storage on a flat surface for at least 24 hours at room temperature before testing. ⢠For a Virginia CCPR study, Kazmi (2018) oven-dried the RAP for 72 hours at 104°F (40°C), then cooled the RAP at ambient temperature for 24 hours. Batista et al. (2014) summarized European practices for curing conditions after compaction (Table 14). This summary shows there is a wide range of procedures, but in general, European agencies use cooler curing temperatures for longer periods than are used in the United States. Mix Design Testing Mix design testing includes bulk specific gravity for compacted and loose mix and some type of strength test, such as indirect tension or Marshall stability. Some agencies include performance- related testing to estimate the mixtureâs raveling potential; critical low-temperature cracking characteristics; and resistance to fatigue cracking, reflective cracking, and rutting. Density and Air Void Measurements Compacted Bulk Specific Gravities. The traditional standards for determining the bulk specific gravity of compacted specimens are AASHTO T 166 and ASTM D2726. When specimens contain open or interconnected air voids or absorb more than 2% moisture, the specimens need to be coated before testing. Test methods that can be used in these cases are AASHTO T 275 for paraffin-coated specimens, ASTM D1188 for Parafilm-coated specimens, and AASHTO T 331 and ASTM D6752 for vacuum sealing specimens. The specific gravity and density can also be Country Days 1 2 3 4 5 6 7 8 9 10 11 12 13 14 Czech Republic 68°F +/â 1°F (20°C +/â 2°C) Sealed* Unsealed** 68°F +/â 1°F (20°C +/â 2°C) Sealed* Unsealed** Great Britain and Ireland 104°F (40°C) Sealed* 104°F (40°C) Sealed* France 64°F (18°C) Unsealed** 64°F (18°C) Unsealed** Australia 104°F (40°C) 68°F +/â 1°F (20°C +/â 2°C) Unsealed** 104°F (40°C) 68°F +/â 1°F (20°C +/â 2°C) Unsealed** South African Republic 77°F (25°C) 104°F (40°C) 68°F +/â 1°F (20°C +/â 2°C) Unsealed** Sealed* Unsealed** 77°F (25°C) 104°F (40°C) 68°F +/â 1°F (20°C +/â 2°C) Unsealed** Sealed* Unsealed** *Sealed containers are assumed to represent 90% to 100% humidity conditions. **Unsealed containers are assumed to represent typical humidity conditions in the field. Source: Based on Batista et al. 2014. Table 14. European experimental curing conditions used to replicate different agenciesâ procedures.
36 Practice and Performance of Cold In-Place Recycling and Cold Central Plant Recycling volumetrically determined using the mass of the specimen and measurements of the specimen height and diameter (AASHTO T 269, Section 6.2.2, ASTM D3203). Schwartz et al. (2017) reported the average dimensionally calculated bulk specific gravity was only 2.107 for cores from 18 emulsified or foamed asphalt cold recycled projects (1 to 2 years old) from around the country. The average density for these projects was 131 lb/ft3 (2,098 kg/m3). Although the air voids were not specifically reported, the low specific gravities and low densities indicate the cores may have air voids that are higher than conventional dense- graded hot asphalt mixes. Bazrafshan and Farhad (2017) used AASHTO T 331 (vacuum sealing) to document the density and air voids of various emulsified asphalt cold recycled mixes with 2% Portland cement and three different RAP gradations (19 mm, 25 mm, 37.5 mm). This method was used because of the high air voids (14% to 17%). Saidi (2019) used the vacuum sealing method because the air voids for the range of foamed asphalt cold recycled mix variables in the study ranged from 5% to 15% voids. Gallegos (2019) noted that New Mexico requires the use of AASHTO T 331 (vacuum sealing) for testing cold recycled mixes. Illinois DOT LR1000-1 (2012) requires the use of ASTM D6852 (vacuum sealing) for emul- sified CIR. Of the nine agencies documented in Table 11 (at the beginning of the Mix Designs section), only the Illinois DOT lists AASHTO T 331 (vacuum sealing) as an option for measuring compacted specific gravity. Cox and Howard (2015) used specimens from seven projects to show there was a good linear relationship between the results from AASHTO T 331 (vacuum sealing for compacted specimens) and the dimensional specific gravities. Except for a few outliers, the dimensional method estimated lower densities (i.e., higher air voids). Maximum Specific Gravities. The traditional test methods for determining the maximum specific gravity are AASHTO T 209 and ASTM D2041. Both of these standards require the use of a dry-back procedure when the aggregates are not sealed by the asphalt binder film. Alter- natively, ASTM D6857 can be used to vacuum seal the material before testing. The RAP-only maximum specific gravity can be difficult to measure consistently because the particles are not completely coated and the RAP agglomerations have micro-cracks in the old asphalt film, which entrap air between the finer particles (Cox and Howard 2013). During the mix design phase, the best coating of the RAP particles can be obtained by testing the cold recycled mix with the highest emulsion content, then back-calculating the maximum specific gravities for lower emulsion contents. Only a limited number of research projects have compared AASHTO T 209 (ASTM D2041) and ASTM D6857 (vacuum sealed). The literature review by Cox and Howard (2015) briefly discusses two research projects (Ohio, Florida). The Ohio mixtures, with 33 replicates, showed no statistical differences in the maximum specific gravity between AASHTO T 209 and ASTM D6857. A Florida study also found no statistical difference between the two methods but did find the vacuum sealing method test results were more variable. Both studies used conventional dense-graded hot asphalt mixtures for these conclusions. When Florida mixtures with high moisture absorption limestone aggregates were evaluated with AASHTO T 209 using the dry- back procedure and with ASTM D6857, the vacuum sealing method gave significantly higher maximum specific gravities.
Literature Review 37  Air Voids. AASHTO T 269 (ASTM D3203) is used to calculate air voids from the compacted bulk specific gravity and maximum specific gravity test results (Gallegos 2019). Examples of the range of cold recycled mix air voids reported in the literature are as follows: ⢠9% to 14%, typically, possibly higher (Cross et al. 2010) ⢠12.1% for cold recycled cores (Stimilli et al. 2013) ⢠13.6%, 14.0%, and 17.3% air voids for the 19 mm, 25 mm, and 37.5 mm maximum RAP particle size gradations, respectively (Bazrafshan and Farhad 2017) ⢠9.6% to 14.1% for foamed asphalt cold recycled mixes (Graziani et al. 2018) ⢠10% to 15% for emulsified asphalt cold recycled mixes (Chen 2006) ⢠5% to 15% air voids for foamed asphalt cold recycled mixes (Saidi 2019) ⢠6% to 17% for emulsion cold recycled mixes (Saidi 2019) ⢠17.5% to 18.9% for emulsified asphalt cold recycled mixes (Graziani et al. 2018) Cox and Howard (2015) used the AASHTO T 166 and T 331 test methods for compacted bulk specific gravity and AASHTO T 209 for the theoretical maximum specific gravity to calcu- late air voids. Cold recycled mixes prepared with RAP from three different projects were used to show the air voids calculated using the vacuum-sealed bulk specific gravity were higher than those calculated using the standard uncoated method (Figure 16). The results for specimens prepared with a given RAP source were well correlated, but each RAP source produced a different correlation equation. Marshall Stabilities, Dry and Wet A number of agencies include minimum Marshall stability requirements originally set for conventional hot asphalt mixes, but they use a test temperature of 104°F (40°C) instead of 140°F (60°C). Some agencies have added a requirement for retained Marshall stability after vacuum saturation (55% to 75%): after storing the mix in a 77°F (25°C) water bath for 24 hours, they determine the wet stability at 104°F (40°C). 25 Source: Based on Cox and Howard 2015. Air Voids Using AASHTO T 331 (Vacuum Seal) Ai r V oi ds U sin g AA SH TO T 1 66 Figure 16. Comparison of air voids calculated from different compacted bulk specific gravity measurements.
38 Practice and Performance of Cold In-Place Recycling and Cold Central Plant Recycling Some Marshall stabilities, both wet and dry, and the retained Marshall strength are reported in the literature (Table 15, Figure 17). Cosenza and Robinson (2019) reported that the dry Marshall stability for field cold recycled mix was slightly lower than the fine gradation mix design specimens. The highest dry Marshall stabilities reported were for field cores taken from projects that were 4 to 7 years old. Indirect Tensile Strengths, Dry and Wet AASHTO T 283 (ASTM D4867) is used to evaluate the indirect tensile strength, dry and after moisture conditioning with a freeze/thaw cycle, at 77°F (25°C) to assess the unconditioned strength and moisture sensitivity of the mix. AASHTO MP 31 (emulsion) and MP 38 (foamed asphalt) set the cured specimen indirect tensile strength (dry) at a minimum of 45 psi (310 kPa), with a minimum tensile strength ratio of 70% for cold recycled mixes with cement, 60% for mixes with hydrated lime or with no active fillers. The ARRA CR201 and CR202 standards use the same criteria. Wet and dry indirect tensile strengths from various research studies (Figure 18) show foamed asphalt cold recycled mixes usually have lower indirect tensile strengths than emulsified asphalt cold recycled mixes (Khosravifar 2012; Du 2015; Gandi et al. 2016; Sebaaly et al. 2018). Using 2% Portland cement significantly increases both the dry and wet indirect tensile strengths. Emulsified asphalts with different modifiers (latex, polymers, and crumb rubber) and either 4.5% or 6% lime slurries show that dry and wet indirect tensile strengths depend on the type of modifier and volume of lime slurry (Carvajal 2018; Sebaaly et al. 2018) (Figure 19). The trend is for the 6% lime slurry either to have no influence or to reduce the indirect tensile strengths. This may be due to the increased moisture content from the higher slurry content. Regardless of the amount of lime slurry, all the dry indirect tensile strengths met the 45 psi (310 kPa) minimum requirement. All the wet indirect tensile strengths also met the minimum required wet strength of 35 psi (241 kPa). Mix Variables Marshall Stability, Dry, lb Marshall Stability, Wet, lb Retained Strength, % Source Over 5% emulsions with cement, 60°C 280 --- --- Cox and Howard 2015 Under 2% emulsions with cement, 60°C 1,229 --- --- Emulsions with cement or hydrated lime, 60°C 2,705 --- --- Under 3.5% emulsion, 40°C 2,000 --- --- Over 3% emulsion with cement, 40°C 2,018 --- --- 4% emulsions, 1% lime, 40°C 1,492 1,209 81% 3% engineered polymer mod., no cement 3,250 2,850 88% Campos 2019 3% engineered polymer mod., 0.3% cement 3,300 2,800 85% 3% engineered polymer mod., 0.6% cement 3,700 3,500 95% 3% engineered polymer mod., 1% cement 3,200 3,000 94% 3% emulsion (room temperature for mixing) 1,286 926 72% 1.8% emulsion (43°C for mixing) 1,970 1,615 82% Wegman and Sabouri 2019 1.5% emulsion (52°C for mixing) 2,080 1,955 94% Cores (4 to 7 years old) 5,098 --- --- VanFrank et al. 2016 Note: ---: no data available; mod. = modifier. Table 15. Examples of documented Marshall stabilities and retained stabilities.
Literature Review 39Â Â Figure 17. Examples of dry Marshall stabilities for emulsified cold recycled mixes. CMS = cationic medium set. 61 74 87 71 56 60 52 100 45 53 44 62 70 52 67 44 44 50 40 86 49 41 15 61 0 50 100 150 In di re ct T en si le S tr en gt h, p si Dry Wet Emulsions Foamed Asphalt Figure 18. Comparison of indirect tensile test strength, wet and dry, for emulsions and foamed asphalt cold recycled mixes.
40 Practice and Performance of Cold In-Place Recycling and Cold Central Plant Recycling The use of corrective aggregates can improve the dry and wet tensile strengths (Arambula- Mercado et al. 2018) (Figure 20). Cold mixes were prepared with either emulsion or foamed asphalt and one of three percentages of corrective aggregate (0%, 20%, and 40%). The mixes with no corrective aggregate had the lowest dry and wet indirect tensile strengths. Using 1% Portland cement, with no corrective aggregate, significantly increased the strengths and reduced the moisture sensitivity for the foamed asphalt mix. Source: Based on Arambula-Mercado et al. 2018. Figure 20. Comparison of emulsified asphalt and foamed asphalt cold recycled mixes with corrective aggregates. Source: Based on Sebaaly et al. 2018. Note: Mod. = modifier Figure 19. Influence of modified emulsions and different percentages of lime slurry.
Literature Review 41  A summary of the indirect tensile strengths for emulsion and foamed asphalt cold recycled mixes reported by various researchers is shown in Table 16. The average indirect tensile strength of emulsion cold recycled mixes is 69 psi; the average for foamed asphalt cold recycled mixes is 46 psi. Diefenderfer and Apeagyei (2014) measured the moisture sensitivity of cores obtained from the foamed asphalt CIR and CCPR Virginia DOT I-81 project within the first few months of construction (Table 17). Both the CCPR and CIR cores had indirect tensile strengths over 70 psi Table 16. Documented dry and wet tensile strengths for different binders, active fillers, and corrective aggregates. Materials Indirect Tensile Strength, Dry, psi Indirect Tensile Strength, Wet, psi TSR Air Voids, % Source Foamed Asphalt 0% corrective aggregate, foamed asphalt* 33 20 61% 13.9% to 14.9% Arambula-Mercado et al. 2018 20% corrective aggregate, foamed asphalt* 40 40 100% 11.6% to 19% Arambula-Mercado et al. 2018 2.3% foamed asphalt, no active filler, RAP 3 44 15 34% No Information Khosravifar 2012 Foamed asphalt, no active filler 45 49 109% 13% +/â 1% Gandi et al. 2016 40% corrective aggregate, foamed asphalt* 48 32 67% 15.6% to 19% Arambula-Mercado et al. 2018 2.2% foamed asphalt, no active filler, RAP 2 53 41 77% 13% +/â 1% Khosravifar 2012 2.3% foamed asphalt, 1% cement, RAP 3 62 61 98% No Information Khosravifar 2012 Average 46 37 78% Emulsified Asphalt 4% CMS-2s, 6% lime, nongraded RAP 52 40 77% 13% +/â 1% Sebaaly et al. 2018 Rubber-mod., 4.5% lime slurry 52 37 71% 13% +/â 1% Ortiz 2017 Rubber-mod., 6% lime slurry 55 42 76% 13% +/â 1% Ortiz 2017 3.6% CMS-2s, 4.5% lime, nongraded RAP 56 44 78% 13% +/â 1% Sebaaly et al. 2018 3% CMS-2s, 6% lime, graded RAP 60 50 84% 13% +/â 1% Sebaaly et al. 2018 Emulsion, no active filler 61 70 115% 13% +/â 1% Gandi et al. 2016 Polymer-mod., 6% lime slurry 65 41 63% 13% +/â 1% Ortiz 2017 Latex-mod., 6% lime slurry 70 63 90% 13% +/â 1% Ortiz 2017 3.4% CMS-2s, 4.5% lime, graded RAP 71 44 62% 13% +/â 1% Sebaaly et al. 2018 Emulsion, no active filler 74 52 70% 8% Du 2015 Latex-mod., 4.5% lime slurry 76 66 87% 13% +/â 1% Ortiz 2017 Polymer-mod., 4.5% lime slurry 82 53 65% 13% +/â 1% Ortiz 2017 Emulsion, 2.5% lime 87 67 77% 8.5% Du 2015 Emulsion, 1.5% cement 100 86 86% 10.7% Du 2015 Average 69 54 79% *No freeze cycle. TSR = tensile strength ratio.
42 Practice and Performance of Cold In-Place Recycling and Cold Central Plant Recycling and tensile strength ratio (TSR) percentages over 70%. The core indirect tensile strength values are all higher than those for the laboratory-mixed, laboratory-compacted foamed asphalt cold recycled mixes. The foamed asphalt cold recycled mixes appear to gain strength over time. Level of Saturation and Air Voids. Both AASHTO T 283 and ASTM D4867 standards evaluate the moisture sensitivity of asphalt mixes, but they have somewhat different require- ments for air voids, saturation levels, and specimen conditioning. AASHTO T 283 requires spec- imens to be prepared with air voids of 7.0% ± 0.5%; the water saturation levels need to be between 70% and 80%; and conditioning includes a freeze/thaw cycle. ASTM D4867 requires specimens to have air voids of 7.0% ± 1.0% and a saturation level between 55% and 80%; the freeze/thaw cycle is optional. While both test methods are used to evaluate moisture sensitivity, air voids can be significantly higher in cold recycled mixes than in conventional hot asphalt specimens. On the basis of a literature review and construction testing, Cross et al. (2010) suggest a fixed compaction effort (75 blow Marshall, SGC with 30 or 35 gyrations) and adjusting the saturation requirement to 55% to 75%. Suggestions from other research include the following: ⢠Increase the required air voids to 13% ± 1% (Carter et al. 2013; Gandi et al. 2016; Arambula- Mercado et al. 2018; Sebaaly et al. 2018). ⢠Reduce the required saturation level to 55% to 75% (Cross 2012; Cox and Howard 2015; Illinois DOT 2012) or 55% to 80% (ASTM D4867, Gandi et al. 2016). ⢠Require a minimum wet strength of 35 psi (235 kPa) with no freeze/thaw cycle (Caltrans 2016). Performance Testing Balanced mix designs optimize the mix components and quantities to minimize the agencyâs most critical pavement distress(es). Testing is also included to assess the ability of mixes to withstand initial traffic damage to the new cold recycled mix surface. Test methods that have been used to evaluate cold recycled materials during mix design include the following: ⢠Durability â Raveling â Cantabro â Cohesive strength ⢠Low-temperature cracking â Instrumented indirect tensile strength â Semi-circular bend test â Disc-shaped compact tensile test â Thermal stress restrained specimen test ⢠Fatigue cracking â Beam fatigue â Semi-circular bend test at warm temperatures â IDEAL cracking test â Instrumented indirect tensile strength at warm temperatures â Simplified viscoelastic continuum damage Moisture Sensitivity CCPR CIR Indirect tensile strength, dry (psi) 77.2 71.6 Indirect tensile strength, wet (psi) 54.2 56.6 Tensile strength ratio (%) 70.2 79.1 Source: Based on Diefenderfer and Apeagyei 2014. Table 17. Foamed asphalt CCPR and CIR tensile strengths.
Literature Review 43  ⢠Reflective cracking â Overlay tester ⢠Rutting â Hamburg loaded wheel rut tester â Asphalt pavement analyzer loaded wheel rut tester â Triaxial testing â Repeated load permanent deformation Cox and Howard (2015) identified eight agencies that require assessment of raveling potential, six that require the evaluation of low-temperature cracking potential, and only one that requires Hamburg rut testing (Table 18). It should be noted that while agencies have performance-based testing requirements, the literature includes little documented test result data. Also, there are significant differences in how researchers and agencies use existing test methods (e.g., different test temperatures, curing temperatures before specimens tested). Low-Temperature Cracking Low-temperature cracking tests include ⢠Instrumented indirect tensile test (IDT), ⢠Semi-circular bend (SCB) test, used at lower temperatures, ⢠Disc-shaped compact tension (DCT) test, and ⢠Thermal stress restrained specimen test (TSRST). Low-temperature cracking data, which can be used as MEPDG Level 1 inputs, use laboratory creep compliance data at â4°F, 14°F, and 32°F (â20°C, â10°C, and 0°C) and loading times of 1, 2, 5, 10, 20, 50, and 100 seconds (Vitillo 2012). An MEPDG Level 2 pavement design needs the laboratory creep compliance data at 14°F (â10°C) and the same seven loading times. The Level 3 pavement design automatically calculates typical low-temperature creep compliance. No specific creep compliance databases were found in the literature search. State Low-Temperature Cracking * (AASHTO T 322) Raveling (ASTM D7196) Rutting (AASHTO T 324) California --- 2% max., 20 gyrations, cured at 21°C for 4 hours --- Illinois --- 2% max. at 10°C --- Iowa Tcrit, â20C max. 2% max., 20 gyrations, cured at 10°C for 4 hours --- Kansas Tcrit, less than LTPPBind 98% reliability low temperature at the top of the CIR layer 2% max., 20 gyrations, cured at 21°C for 4 hours --- Montana Tcrit, â31C 5% max., 20 gyrations, cured at 10°C for 4 hours --- New York T 322, â20C max. 5% max., 20 gyrations, cured at 10°C for 4 hours, 50% relative humidity --- Texas Tcrit, report only 2% max., 20 gyrations, cured at 10°C for 4 hours, 50% relative humidity Tex-242-F Hamburg 5,000 < P12.5 < 15,000 Virginia Tcrit, less than LTPPBind 98% reliability low temperature at the top of the CIR layer 2% max., 20 gyrations, cured at 10°C for 4 hours, 50% relative humidity --- *Instrumented indirect tensile test. ---: no additional information provided. Source: Based on Cox and Howard 2015. Table 18. Examples of agency performance testing.
44 Practice and Performance of Cold In-Place Recycling and Cold Central Plant Recycling Instrumented Indirect Tensile Strength (AASHTO T322). Tompkins (2019) reported various properties for cold recycled mixes placed on the MnROAD low-volume loop (Table 19). The laboratory-mixed, laboratory-compacted foamed asphalt cold recycled mixes with the PG58-28 base binder have slightly lower tensile strengths than the emulsion cold recycled mixes. There is no clear pattern of results for the PGXX-34 base binder cold mixes. The field-mixed materials have higher strengths than the laboratory-mixed, laboratory-compacted specimens. Semi-Circular Bend (Low Temperatures). The AASHTO TP 105 Semi-Circular Bend (SCB) test method is used to calculate fracture energy (FE), fracture toughness, and stiffness to define the resistance of the mix to low-temperature cracking. Previous research linked decreased FE to the increased amount of transverse cracking, which successfully predicted projects with satisfactory performance and poor performance (Cox and Howard 2015; Wegman and Mohammadreza 2016). The FE decreases with decreasing temperatures. Saidi (2019) conducted a laboratory investigation to evaluate the influence of the compac- tion level and curing temperatures on the SCB low-temperature FE (Table 20). The higher IDT @ Tcrit of â35°C, psi IDT @ Tcrit of â34°C, psi IDT @ Tcrit of â36°C, psi IDT @ Tcrit of â34°C, psi 155 128 158 132 Temperature Field Mixes 40°F (â40°C) 250 230 235 280 â22°F (â30°C) 260 200 220 230 â4°F (â20°C) 280 230 280 190 MnROAD Cell Designations 133 233 135 235 Binder, % PG58-28 PG58-28 PGXX-34 PGXX-34 Emulsion Foamed Emulsion Foamed 2% 1.5% 2% 1.5% Laboratory-Mixed, Laboratory-Compacted Specimens Source: Based on Tompkins 2019. Table 19. Low-temperature IDT results for MnROAD test road CIR mixes. Level of Compaction Fracture Energy, J/m2 Emulsions Foamed Asphalt Hot curing, 140°F (60°C) for 3 days 30 gyrations 497 425 70 gyrations 622 468 Cold curing, 50°F (10°C) for 3 days 30 gyrations 264 198 70 gyrations 455 175 Source: Saidi 2019. Table 20. SCB laboratory study to evaluate impact of compaction level and curing conditions on fracture energy at 32çF (0çC).
Literature Review 45  compactive effort accentuated the difference between emulsion and foamed asphalt cold recycled mixes. The foamed asphalt mixes have lower FEs compared to emulsion mixes. Regardless of the compactive effort, increasing the curing temperature increases the fracture energy. Another parameter calculated from the load-deformation curve and the crack mouth opening displacement (CMOD) is the fracture index value for energy (FIVE) (Table 21). The FIVE value is calculated as the total energy (area under load versus CMOD curve) divided by the ligament area [product of ligament length (i.e., specimen radius minus the crack length) and the thickness of the specimen]. The test for determining the FIVE results is conducted at 18°F above the low PG temperature (10°C above the low PG temperature) with a loading rate of 0.0002 in./s (0.005 mm/s). Wegman and Mohammadreza (2016) suggested a pass/fail threshold FIVE value of 230 J/m2. Values above the threshold have acceptable low-temperature cracking resistance. The CSS-1 emulsion cold recycled mixes with the 1.5% cement had the lowest FE (more brittle behavior) and failed the threshold criterion. However, the between-laboratory variability may influence pass/fail conclusions when the results are close to the limiting value. Disc-Shaped Compact Tension. The DCT test (ASTM D7313) determines the fracture energy of mixtures at low temperatures. The low-temperature cracking potential decreases as the FE increases. Wegman and Mohammadreza (2016) compared the DCT and SCB test results for MnROAD test cell mixtures (Table 22). They found that both test methods rank the CSS-1 cold recycled mixes as having the most potential for thermal cracking. The engineered and high float emul- sions showed better resistance to low-temperature cracking with the RAP source used for this project. Binder DCT* SCB, FIVE Fracture Energy Index, J/m2* Engineered emulsion 185 350 HFMS-2S 180 405 CSS-1 + cement 140 225 *Estimated from figures. Source: Based on Wegman and Mohammadreza 2016. Table 22. Results for DCT and SCB testing of CIR mixes with different binders. Binders Average FIVE Cracking Energy, J/m2* Lab 1 Lab 2 2.8% engineered emulsion 305 230 2.3% CSS-1 + 1.5% cement 220 190 2% HFMS-2S 300 290 2.2% foamed asphalt 295 210 *Estimated from figures. Source: Based on Wegman and Mohammadreza 2016. Table 21. Results for SCB testing of CIR mixes with different recycling agents at â4çF (â20çC).
46 Practice and Performance of Cold In-Place Recycling and Cold Central Plant Recycling The researchers noted the CIR mixes tended to crumble during testing in a way that suggests the additional specimen preparation needed for the DCT testing may not be a viable option for testing cold recycled mixes. They noted the DCT test can be used on cores, but it requires special fixtures for testing and several steps for specimen preparation. Thermal Stress Restrained Specimen. The TSRST (AASHTO TP 105) measures the critical low-cracking temperature and the tensile stress at failure. Bhavsar (2015) evaluated Ontario, Canada, CIR-emulsion and foamed asphalt mixes using the TSRST method (Table 23). The frac- ture temperatures of the emulsion specimens were about 2oC lower than those of the foamed asphalt mixes. The foamed asphalt cold recycled mixes could support only about one-fourth of the tensile stress before failure compared to the emulsified asphalt cold recycled mixes. Fatigue Cracking Tests Fatigue cracking can be evaluated using ⢠Beam fatigue; ⢠Indirect tensile asphalt cracking test (IDEAL-CT); ⢠Instrumented indirect tensile strength, AASHTO T 322 at warm temperatures; ⢠Semi-circular bend (SCB) test, at intermediate (warm) temperatures; and ⢠Simplified viscoelastic continuum damage (S-VECD). Beam Fatigue. The bending beam fatigue test evaluates the potential for traditional fatigue cracking (i.e., bottom-up cracking). Hveem-compacted cold recycled mix specimens with latex or rubber-modified emulsions showed improved cracking resistance compared to either an unmodified cationic medium set (CMS-2s) or a polymer-modified emulsion (Carvajal 2018; Sebaaly et al. 2018) (Figure 21). IDEAL Cracking Test. The indirect tensile asphalt cracking test (IDEAL-CT) uses con- ventional indirect tensile strength testing equipment to apply the load at a rate of 2 in./min (50 mm/min) to standard gyratory compacted specimens at room temperature. The major advantage of this test is that no environmental chamber is needed and the as-compacted gyratory specimen is used (i.e., no cutting is needed). The cracking test (CT) parameter is calculated from the load-displacement curve. CT values, a unitless parameter, range from 1 (poor performance) to 800 (best performance). Soohyok et al. (2018) compared the flexibility indices from the IDEAL-CT and SCB tests. Cold recycled mixes were prepared and tested using one emulsion, two PG foamed asphalt binders, and three RAP sources (Table 24). Except for two outliers, there is a good correlation between the results from both test methods (Figure 22). Instrumented Indirect Tensile Testing, Warm Temperatures. Instrumented IDT at warm temperatures is conducted at 77°F (25°C). Cox and Howard (2015) used this method to eval- uate the tensile strength at fracture, St,f, the horizontal strain at fracture, εf, and the cracking Recycling Agent Fracture Temperature, °C Maximum Load, lb Maximum Tensile Stress, psi HF-150P emulsion â28.38 1,214 323 Foamed asphalt (PG58-28) â26.82 301 78 Source: Based on Bhavsar 2015. Table 23. TSRST results for CIR mixes with different binders.
Literature Review 47Â Â Source: Based on Sebaaly et al. 2018. Figure 21. Influence of emulsion modifiers on fatigue resistance. Binder RAP Source I-FIT* Flexibility Index IDEAL-CT Index Laboratory Study with Different Binders and RAP Sources CSS-1H US-60 1.5 30 I-40 2.8 105 FM-92 3.9 235 PG58-28** US-60 3.3 40 I-40 6.8 210 FM-92 5.3 120 PG64-22** US-60 1.0 20 I-40 3.0 50 FM-92 3.2 90 Cores Ochiltree County, Tex. HMA*** 4.5 93.2 CIR 0.3 9.4 Hemphill County, Tex. HMA*** 5.4 32.8 CIR 0.6 13.9 *I-FIT = Illinois flexibility index test. **Foamed asphalt. ***HMA = hot mix asphalt. Source: Based on Soohyok et al. 2018. Table 24. Comparison of SCB flexibility index to IDEAL-CT index at room temperature.
48 Practice and Performance of Cold In-Place Recycling and Cold Central Plant Recycling index. The cracking index highlights the brittle nature of the cold mixes that contain cement (Figure 23). The tensile strength showed no consistent trends for the different cold mix variables (Table 25). The mixes with cement had significantly lower indirect tensile cracking indexes than mixes with emulsion recycling agents. Semi-Circular Bend, Warm Temperatures. When SCB testing is conducted at warmer temperatures, it can be used to estimate fatigue cracking. The AASHTO TP 124 SCB test method is conducted at 77°F (25°C) and used to calculate the flexibility index and fracture energy. US-60 Ochiltree (cores) Hemphill (cores) FM-92 I-40 Source: Based on Soohyok et al. 2018. Figure 22. Comparison of SCB flexibility index and the IDEAL-CT index. Source: Based on Cox and Howard 2015. Figure 23. Influence of filler and RAP source on cracking resistance.
Literature Review 49  The flexibility index is used to rank mixes based on fracture (cracking) potential. Nemati (2019) investigated four CCPR mixes from New Hampshire: the flexibility index for the CCPR mixes ranged from 11 to 21, compared to 6 to 15 for conventional hot asphalt mixes. The fracture energy for the CCPR mixes ranged from 100 to 600 J/m2, while the fracture energy for the con- ventional hot asphalt mixes was significantly higher, from 1,250 to 1,750 J/m2. The researcher noted the CCPR cold mixes were difficult to test because they tended to be too ductile and deformed under the loading platen. Ma (2018) investigated the SCB Illinois flexibility index test (I-FIT) parameters for two grades of foamed asphalt with fine, medium, and coarse RAP gradations (Table 26, Figure 24). The tensile strength at fracture was similar for all of the foamed asphalt mixes. The medium grada- tion, regardless of asphalt grade, showed the least cracking resistance, while the coarse grada- tion showed the best cracking resistance. The stiffer asphalt produced better fatigue cracking resistance, regardless of gradation, compared to the softer grade asphalt. Materials Tensile Strength at Fracture, psi Horizontal Strain at Fracture, Cracking Index, kJ/m3 RAP 1 4.4% cement 69 190 0.06 2.3% cement, 2% emulsion 42 719 0.17 4% emulsion, 1% hydrated lime 51 4,289 1.32 RAP 2 4.4% cement 63 248 0.07 2.3% cement, 2% emulsion 32 1,005 0.18 4% emulsion, 1% hydrated lime 49 3,068 0.83 RAP 3 4.4% cement 32 1,022 0.21 2.3% cement, 2% emulsion 22 1,069 0.14 4% emulsion, 1% hydrated lime 44 4,477 1.17 Source: Based on Cox and Howard 2015. Table 25. IDT stiffness, strain, and cracking index. Table 26. Laboratory study to determine SCB I-FIT tensile strength, fracture energy, and flexibility index. Foamed Asphalt Grade and RAP Gradations Tensile Strength at Fracture, psi Fracture Energy, J/m2 Flexibility Index* PG 67-22 Fine 18 414 5.8 Medium 15 355 3.8 Coarse 18 511 8.4 PG 58-34 Fine 15 269 4.3 Medium 14 251 3.6 Coarse 15 327 5.3 *Flexibility index > 6 indicates good cracking resistance.
50 Practice and Performance of Cold In-Place Recycling and Cold Central Plant Recycling VanFrank et al. (2014) evaluated the influence of curing times at 80°F (27°C) on the SCB results (Table 27, Figure 25). Five different emulsions and three curing times were used to show that, while there is some difference in the SCB peak force and fracture energy between the various emulsions, the curing time has a more significant influence on the results. Most of the increase in SCB parameters occurs within the first 48 hours of curing. VanFrank et al. (2016) used SCB testing conducted at 80°F (27°C) to evaluate cores from six cold recycled projects built over the previous eight years and surfaced with overlays. A value above 0.5 was considered acceptable for high loads and traffic volume roadways; a value of 0.6 Source: Based on Ma 2018. Figure 24. Influence of foamed asphalt binder grade and RAP gradation on the SCB I-FIT flexibility index. Curing Times, hours* Type of Emulsion RS-EE E-EE CSS-1 PASS-R CQS-1 SCB Peak Force, lb** 24 57 73 48 65 78 48 121 123 138 121 150 72 145 139 170 143 154 SCB Displacement at Peak Force, in.** 24 0.033 0.053 0.045 0.032 0.015 48 0.061 0.063 0.035 0.031 0.038 72 0.058 0.036 0.037 0.036 0.047 SCB Area Under Load-Displacement Curve 24 0.9 2 1.1 1.1 0.6 48 3.7 3.8 2.5 1.9 2.9 72 4.3 2.5 3.3 2.6 3.6 *Curing and testing at 80°F (27°C). **Estimated from figures in original source. Source: VanFrank et al. 2014. Table 27. SCB test results at warm temperatures.
Literature Review 51  was considered the minimum for low loads and traffic volume roadways. The SCB results were compared to a weighted performance index [1 (worst) to 10 (best) scale]. SCB values over 0.5 were associated with performance index values of 6 or better (Table 28). Simplified Viscoelastic Continuum Damage. The simplified viscoelastic continuum damage (S-VECD) (AASHTO TP 107) test uses cyclic direct tension stress and strain measure- ments acquired under different loading conditions to estimate bottom-up and top-down traffic- related cracking. Dynamic modulus or frequency/temperature sweep testing is used to measure Source: Based on VanFrank et al. 2014. Figure 25. Influence of curing time on SCB peak load. Site Fracture Energy* Core Condition Projects with Performance Index Values Less than 6 Strawberry East Too friable to test Poor condition, high voids in all layers Strawberry West Peoa Bottom layer very deteriorated (CIR), just above this layer I-84 W 0.33 I-84 E 0.33 Projects with Performance Index Values of 6 or Better Marion 0.56 Very high voids Currant Creek West 0.82 No major deterioration noted; total thickness was 13 in.Currant Creek East 0.82 Monticello East 0.73 No major deterioration noted; thickness of old pavement varied from 1 to 4 in.Monticello West 0.73 *Testing at 80°F (27°C). Source: VanFrank et al. 2016. Table 28. SCB testing of Utah CIR cores.
52 Practice and Performance of Cold In-Place Recycling and Cold Central Plant Recycling the mixture stiffness followed by the application of a constant strain until failure. The data from these tests are used as input into advanced mathematical models, such as the linear viscoelastic continuum damage and viscoelastic continuum damage models, with a public domain finite element program, FEP++. Nemati (2019) used S-VECD to evaluate New Hampshire emulsion CCPR mixes and compared the results to conventional hot asphalt mixes. The researcher used finite element modeling software, FlexPave, with S-VECD laboratory data to predict fatigue performance of New Hampshire cold recycled mixes. Results showed that the cold recycled mixes that had good, predicted fatigue resistance also had higher moduli and/or phase angles. The software predicted fatigue cracking from the bottom up and no failure points in the wearing course (20-year design life). The best-performing mixes were the two cold recycled mixes with low distillate oils. Reflective Cracking Reflective cracking can be evaluated with the Texas overlay test (Texas DOT Tex-248-F). The overlay testing device can be used to estimate the potential resistance of a mixture to reflective cracking and/or traffic-related top-down cracking. Sebaaly et al. (2018) and Carvajal (2018) investigated Nevada cold recycled mixes with the overlay tester at 25°C (77°F). The resistance of emulsion cold recycled mixes with lime increased with increasing percentages of lime and was dependent on the type of emulsion recycling agent (Table 29, Figure 26). Gu et al. (2018) used the overlay test results to evaluate emulsified and foamed asphalt CIR and CCPR Alabama mixes. The number of cycles to failure was low, and there was no clear difference between the mixtures (Table 29). Type of Emulsion No. of Cycles to Failure Critical Fracture Energy Crack Propagation Rate Source 4.5% Lime Slurry* CMS-2s 282 0.29 0.47 Carvajal 2018 Latex modified emulsion 76 0.33 0.52 Sebaaly et al. 2018Polymer-modified emulsion 155 0.19 0.49 Crumb rubber modified emulsion 391 0.20 0.42 6.0% Lime Slurry CMS-2s 496 0.33 0.44 Carvajal 2018 Latex modified emulsion 132 0.36 0.51 Sebaaly et al. 2018Polymer-modified emulsion 280 0.20 0.41 Crumb rubber modified emulsion 1,254 0.24 0.35 CIR and CCPR Mixes CCPR-foamed asphalt 105 --- --- Gu et al. 2018 CCPR-emulsion 175 --- --- CIR-foamed asphalt 145 --- --- CIR-emulsion 105 --- --- *Hveem compaction, nongraded RAP. ---: no data available. Table 29. Influence of cold recycled materials on overlay test results using laboratory-mixed, laboratory-compacted specimens.
Literature Review 53  Rutting Pavement rutting resistance performance prediction models are usually based on the general power law relationship: ε = ANp B Where A and B are the intercept and slope, respectively, determined for the steady rate of deformation portion (i.e., secondary flow region) of the log-log deformation per load cycle relationship (Figure 27). This curve can be generated from several different repeated load test methods: ⢠Loaded wheel rut testers: â Hamburg wheel tracking tester (HWTT) â Asphalt pavement analyzer (APA) ⢠Triaxial testing, with and without confining pressure ⢠Repeated load permanent deformation (RLPD) Hamburg Loaded Wheel Rut Tester. The Hamburg wheel tracking tester (HWTT) (AASHTO T 324) can be used to evaluate both rutting and moisture sensitivity. When the load- ing passes are conducted underwater, a discernible change in the rut depth versus the number of passes is identified as the stripping inflection point (SIP). A higher number of passes asso- ciated with the inflection point indicates a more moisture-resistant mixture. Gu et al. (2018) found HWTT results were dependent on the type and dosage of recycling agents as well as the percentage of cement added to cold recycled mixes. At up to 1.5% cement, the cold recycled mixes tended to have better rut resistance than conventional hot mixes. Arambula-Mercado et al. (2018) evaluated the influence of different percentages of correc- tive aggregate, RAP source, and type of recycling agent on the rut resistance of cold recycled 1,500 1,000 500 0 Cy cl es to F ai lu re Source: Based on Carvajal 2018; Sebaaly et al. 2018. Figure 26. Influence of binder type and percent lime slurry on overlay tester cracking.
54 Practice and Performance of Cold In-Place Recycling and Cold Central Plant Recycling mixes. Results show the cold recycled mixes exceed the maximum allowable rut depth of 0.5 in. (12.5 mm) at less than about 3,500 loading cycles (Table 30). Foamed asphalt cold recycled mixes tend to be more prone to rutting than cold recycled mixes with emulsions. Replacing some of the RAP with corrective aggregate provides some improvement in rut resistance, but only at the higher 40% level. Cox and Howard (2015) evaluated cold recycled mixes with two types of active filler (cement, hydrated lime) and three different RAP sources (Table 31). The results show the rutting resis- tance is dependent on the RAP source as well as the type of active filler. In all but one case, the emulsified asphalt with the hydrated lime shows more resistance to rutting than either of the cold recycled mixes with cement. Soohyok et al. (2018) evaluated one emulsified asphalt and two foamed asphalts with three different RAP sources using the HWTT. The results show the rut resistance of cold recycled mixes is significantly influenced by the RAP source (Table 32). Emulsion cold recycled mixes tend to have slightly better rut resistance than the foamed asphalt mixes. Tompkinsâs (2019) evaluation of the MnROAD cold recycled mixes showed the emulsified asphalt mixes were more rut resistant than the foamed asphalt cold recycled mixes (Table 33). APA Rut Tester (AASHTO T 340). Saidi (2019) used the APA rut tester to evaluate emul- sified asphalt and foamed asphalt cold recycled mixes that were compacted at one of two SGC compaction levels and two curing temperatures for three days (Table 34). Both the increased curing temperature and higher compaction level slightly reduced the APA rut depth after 8,000 passes. All the cold recycled mixes met the typical requirement of a maximum of 12.5 mm rut depth at 8,000 passes. Triaxial Testing. Diefenderfer and Apeagyei (2014) used AASHTO TP 79 (now T 378) triaxial testing to evaluate field-mixed, laboratory-compacted foamed asphalt CIR and CCPR mixes as well as cores from the Virginia DOT I-81 project. Triaxial testing was conducted with and without confining pressure and various deviator stress levels (Table 35). The results show Figure 27. Example of how rutting models are calculated from repeated load testing.
RAP Source No. of Passes to Failure (12.5 mm)* Binder CSS-1H PG58-28** PG64-22** FM-92 600 400 150 I-40 500 160 200 US-60 1,500 1,750 1,250 *Estimated from Figure 29 in Soohyok et al. 2018. **Foamed asphalt. Source: Based on Soohyok et al. 2018. Table 32. Influence of binder type and RAP source on Hamburg rut testing results. Materials Passes to Failure (12.5 mm) Stripping Inflection PointRAP Aggregate Corrective Aggregate, % Emulsion Limestone 0% 2,369 37 --- 20% 2,202 50 1,876 40% 3,404 31 2,415 Granite 0% --- --- --- 20% 2,957 35 2,049 40% 2,115 48 1,491 Foamed Asphalt Limestone 0% No Stripping 68 1,454 20% 1,433 55 1,650 40% 1,590 64 1,838 Granite 0% --- --- --- 20% --- --- --- 40% 1,034 134 946 VP SN* ---: no data available. *Parameter is the slope of the stripping number (SN) relationship. Lower values indicate better rut resistance. Source: Based on Arambula-Mercado et al. 2018. Table 30. Influence of percentage of corrective aggregates and type of RAP aggregate on Hamburg rut testing results at 122çF (50çC). RAP Source Materials Passes at Failure Rut Depth at Failure, mm RAP 1 4.4% cement 906 14.0 2.3% cement, 2% emulsion 2,254 13.5 4% emulsion, 1% hydrated lime 5,900 14.1 RAP 2 4.4% cement 2,464 9.4 2.3% cement, 2% emulsion 20,000 9.0* 4% emulsion, 1% hydrated lime 5,018 13.5 RAP 3 4.4% cement 1,002 13.2 2.3% cement, 2% emulsion 880 12.6 4% emulsion, 1% hydrated lime 1,512 13.1 *Cycle stopped at 20,000; this sample did not fail. Source: Based on Cox and Howard 2015. Table 31. Influence of RAP source, active fillers, and binder type on Hamburg rut testing results.
56 Practice and Performance of Cold In-Place Recycling and Cold Central Plant Recycling Foamed Asphalt Average Flow Number No Confining Pressure, 10 psi Deviator Stress 10 psi Confining Pressure, 70 psi Deviator Stress No Confining Pressure, 70 psi Deviator Stress Field-Mixed, Lab-Compacted CCPR Sieved 66 1,925 --- Not sieved 49 824 --- CIR Sieved 39 772 --- Cores CCPR 2,761 9,158 309 CIR --- --- 62 ---: no data available. Source: Based on Diefenderfer and Apeagyei 2014. Table 35. Field-mixed, laboratory-compacted foamed asphalt CCPR and CIR mixes and core flow numbers. Binder Emulsion Foamed Asphalt Emulsion Foamed Asphalt MnROAD CELL 133 233 135 235 Binder or base binder PG58S-28 PG58S-28 PGXX-34 PGXX-34 Binder added (%) 2 1.5 2 1.5 Passes to failure, 12.5 mm rut depth 7,120 3,520 5,400 2,880 Creep slope ( m/pass) 0.00128 0.00297 0.00166 0.00383 Stripping inflection point No stripping point 2,935 No stripping point No stripping point Source: Based on Tompkins 2019. Table 33. Hamburg rut testing results for MnROAD cold recycled mixes. Level of Compaction APA Rut Depth after 8,000 Passes @ 147°F (64°C), mm CSS-1h Emulsion Foamed AsphaltPG 64-22 Hot Curing @ 140°F (60°C) for 3 days 30 gyrations 4.4 3.0 70 gyrations 2.1 1.9 Cold Curing @ 50°F (10°C) for 3 days 30 gyrations 4.9 5.1 70 gyrations 3.5 4.2 Source: Based on Saidi 2019. Table 34. Influence of compaction level and curing temperature on APA rutting.
Literature Review 57  that even a small confining pressure significantly increases the average flow number. The cold recycled mix cores have significantly higher flow numbers than the laboratory-mixed, laboratory- compacted specimens. Repeated Load Permanent Deformation. AASHTO T 378 describes the laboratory proce- dures for determining the flow number using asphalt mixture performance testing equipment. Testing is conducted at a specific test temperature and applies a repeated load pulse of 0.1-second duration followed by a 0.9-second rest period. Like the traditional triaxial testing, a confining pressure may, or may not, be used. The flow number is the number of cycles to the start of the tertiary flow, which is an indication of the start of shear deformation under constant volume. Schwartz et al. (2017) measured the cumulative microstrain using a 10 psi (69 kPa) confining pressure, 70 psi (483 kPa) deviator stress, and single test temperature of 113°F (45°C). The results were used to calculate the constants needed for the MEPDG rutting model: 10 1 2 3 ε ε = T Np r k k k where εp = measured permanent strain; εr = resilient strain; T = temperature, °F; N = number of load repetitions; and k1, k2, k3 = RLPD laboratory test parameters. The average laboratory test parameters determined for cores from a wide range of projects are shown in Table 36. The exponential constants k2 and k3 for temperature and cycles, respec- tively, indicate that the plastic strain increases significantly faster for the emulsified asphalt cold recycled mixes compared to the conventional hot asphalt mixtures (HMA). The plastic strain of the foamed asphalt cold recycled mixes increases at a faster rate than either of the emulsified asphalt cold recycled mixes. The preceding discussion is based on averaging the parameters reported for each project evaluated by Schwartz et al. (2017). When the parameters for each project are considered (with- out averaging), some foamed asphalt and emulsion cold mixes can have similar upper micro- strain levels, but the foamed asphalt mixes can also show lower microstrains compared to the emulsified asphalt cold mixes. The researchers documented other trends as well: ⢠CIR and CCPR mixes, with either emulsified or foamed asphalt, had similar permanent defor- mation behavior. ⢠Incorporating Portland cement into the cold mixes reduced permanent deformation. Mixtures Exponent for Constant Exponent for Temperature Exponent for Cycles k1 k2 k3 HMA 2.670 0.481 0.145 CCPR Emulsion 1.490 1.527 0.301 CIR Emulsion 0.569 1.955 0.319 CIR Foamed* 1.052 2.076 0.348 *Only three projects. Source: Based on Schwartz et al. 2017. Table 36. Average RLPD rutting constants for cold recycled mix cores.
58 Practice and Performance of Cold In-Place Recycling and Cold Central Plant Recycling ⢠Variability in measured permanent deformation was higher for cold recycled mixes than for conventional hot asphalt mixes. Arambula-Mercado et al. (2018) used RLPD testing to develop the VESYS equation param- eters (Table 37): ( )ε = µε âαn np r The parameters show that using 20% corrective aggregate can be expected to decrease the plastic strain. Using 40% corrective aggregate continues to decrease the plastic strain, but the decrease is not as large as seen when going from 0% to 20%. Gu et al. (2018) evaluated CCPR emulsified and foamed asphalt mixes at 130°F (54.5°C) using a deviator stress of 70 psi (483 kPa) and a confining pressure of 10 psi (69 kPa). The CCPR-foamed asphalt mixes showed lower microstrains than the CCPR emulsified asphalt. Soohyok et al. (2018) conducted RLPD testing with no confining pressure, a deviator stress of 20 psi (138 kPa), and a test temperature of 104°F (40°C). The testing was conducted up to 10,000 loading cycles or the start of tertiary flow and a 5% permanent strain level. This study found the emulsified asphalt (CSS-1H) cold recycled mixes had significantly better rut resistance than either of the foamed asphalts (PG58-28, PG64-22). Durability The resistance of cold recycled mixes to raveling, abrasion, and damage from trafficâand the cohesion characteristics of the mixesâcan be evaluated with the following: ⢠Raveling (ASTM D7196) ⢠Cantabro (AASHTO TP 108) test ⢠Cohesive strength (ASTM 3910) Raveling. The ability of cold recycled mixes to withstand damage from traffic when the road is initially trafficked and before the final wearing surface is placed is evaluated with ASTM D7196 for emulsified cold recycled mixes. The AASHTO MP 31 provisional specification sets the maximum mass loss at 7%. Ortiz (2017) found the mass loss was dependent on the specific combination of the percentage of lime slurry, the RAP gradation, and the type of emulsion (Table 38). Emulsified asphalts B and C had higher mass loss percentages for nongraded RAP than graded RAP for either percentage of lime slurry. The trend was reversed for emulsified asphalt D and mixed for emulsified asphalt A. There was no consistent trend for different percentages of lime slurry. Tompkins (2019) used this test method to evaluate both emulsion and foamed asphalt cold recycled mixes. Results show the MnROAD foamed asphalt cold recycled mixes had more mass loss than the emulsified asphalt cold recycled mixes (Table 39). Mixture Type Rutting Model Parameters μ α Limestone, 0% corrective aggregate 0.206 0.665 Limestone, 20% corrective aggregate 0.187 0.687 Limestone, 40% corrective aggregate 0.186 0.698 Source: Based on Arambula-Mercado et al. 2018. Table 37. RLPD rutting parameters for VESYS model.
Literature Review 59  Cantabro Test. The Cantabro test (AASHTO TP 108) is used to indirectly evaluate the cohe- sion, bonding, and effects of traffic on mixtures typically used in porous friction course mix designs. Arambula-Mercado et al. (2018) used Cantabro testing to evaluate two sources of RAP, each with a different type of aggregate (limestone, granite), various percentages of two types of corrective aggregate (limestone, granite), and different types of recycling agent (emulsified, foamed asphalt). The emulsified granite RAP cold recycled mixes, with or without corrective aggregate, and the foamed asphalt cold recycled mixes all had significantly higher mass losses than emulsified asphalt limestone RAP cold mixes (Table 40). Using 1% Portland cement in foamed asphalt cold mixes helped improve the cold recycled mix durability. Cox and Howard (2013) evaluated the Cantabro with three replicates of three cold recycled mixes, all with the same RAP material (no information on the type of aggregate in RAP). All the specimens were destroyed during testing (mass loss of 97% or more), and the test method was removed from the final testing program, as it did not differentiate between different mix variables. Cohesive Strength. ASTM 3910 can be used to estimate the time needed for a mix to cure sufficiently before the project is opened to traffic. The equipment is similar to that used for the raveling test, but a torque measurement device is used to rotate the rubber abrasion head. Ortiz (2017) prepared two specimens for a preliminary evaluation of a single emulsified asphalt cold mix. Measurements were taken to determine the torque needed to rotate the loading head every 30 minutes at three different locations until a torque of 1.5 lb-ft (20 kg-cm) was reached (Table 41). The curing time was influenced by the type of emulsion and the percentage of lime slurry. Cold recycled mixes with a higher percentage of lime slurry took longer to cure to a minimum torque level. Category Emulsion Foamed Asphalt Emulsion Foamed Asphalt MnROAD Cell 133 233 135 235 PG grade PG58S-28 PG58S-28 PGXX-34 PGXX-34 Binder (%) 2.0 1.5 2.0 1.5 Raveling (%) 1.6 3.3 1.7 2.5 Source: Based on Tompkins 2019. Table 39. Results from ASTM D7196 raveling test for MnROAD mixes. Lime Slurry, % Mass Loss, % RAP Preparation Emulsion Code A B C D 4.5 Graded 10.5 0.4 1.2 5.0 Nongraded 7.0 2.3 7.5 0.8 6.0 Graded 2.5 2.9 0.2 2.2 Nongraded 7.0 5.2 3.4 0.5 Source: Based on Ortiz 2017. Table 38. Results from ASTM D7196 raveling test for Nevada CIR mixes.
60 Practice and Performance of Cold In-Place Recycling and Cold Central Plant Recycling Mix Design and Performance Testing Summary Compaction is usually accomplished with a 75 blow Marshall, Superpave gyratory compactor (SGC) using either 30 or 35 gyrations. Multiple methods are used to determine both the com- pacted bulk specific gravity and the theoretical maximum specific gravity. Depending on the level of air voids and the porosity of any exposed aggregate surface, the density and air voids of the cold recycled mixes may be significantly under- or over-estimated by different test methods. Air voids are typically, but not always, higher for cold recycled mixes (typically 9% to 15%) compared to conventional hot asphalt mixtures. Marshall stabilityâunconditioned and soaked, and determined at a reduced temperatureâ is used during mix designs. Alternatively, the traditional indirect tensile strength moisture sensi- tivity test method can be used; but the required level and tolerance range for air voids may need to be increased, and the required saturation levels may need to be lowered. Low-temperature cracking tests generally show foamed asphalt cold recycled mixes have more potential for thermal cracking. Fatigue testing shows cold recycled mixes can provide adequate fatigue resistance, but mixes with cement can exhibit brittle behavior. Rut testing shows emulsion cold recycled mixes tend to be more rut resistant than foamed asphalt cold recycled mixes. However, cold recycled mixes can be less rut resistant than conventional hot asphalt mixes. Using confining pressure during testing significantly improves the ability of Lime Slurry, % Curing Time to Torque of 1.5 lb-ft (20 kg-cm) RAP Preparation Emulsion Code A B C D 4.5 Graded 4.5 6.0 5.5 4.5 Nongraded 4.5 6.0 5.5 4.5 6.0 Graded 5.5 5.5 6.5 5.5 Nongraded 5.0 5.5 5.5 5.0 Source: Based on Ortiz 2017. Table 41. Initial investigation into using torque measurements to determine the time needed for cold recycled mixes to cure. Materials Mass Loss, % Corrective Aggregate, % Limestone RAP Granite RAP Emulsified Asphalt 0% 42.9 75.8 20% limestone aggregate 14.7 70.4 40% limestone aggregate 3.2 54.8 Foamed Asphalt 0% 90.7 --- 0% with Portland cement 53.1 --- 20% granite aggregate 71.4 --- 40% granite aggregate 86.9 92.6 ---: no data available. Source: Based on Arambula-Mercado et al. 2018 Table 40. Influence of asphalt cold mix material variables on Cantabro mass loss.
Literature Review 61  cold recycled mixes to resist rutting. Durability testing (i.e., raveling, Cantabro tests) shows that the source of RAP and the type and amount of active filler influence the test results. Regardless of the type of performance test, compaction levels, curing times, and curing tem- peratures consistently have a significant impact on performance testing results. Cold recycled mixtures tend to be easily damaged during sample preparation and can deform at platen and specimen clamp points. Construction Processes The construction process consists of several factors that need to be monitored and controlled. A checklist can be used to ensure each part of the process is considered (Busch 2012; Cross 2014; Christianson and Mahoney 2019; FHWA 2019). Surface Preparation Before any work starts, the existing pavement surface needs to be prepared (FHWA 2019). Any grass and soil need to be removed from the surface and along the edge of the pavement. If CCPR recycled mixes are to be placed, the newly milled surface needs to be swept to remove any loose particles and dust (Paving News 2017). Specific requirements may be needed for mill- ing operations to ensure an acceptable temporary surface until the cold recycled mix is placed. Any subgrade or base support problems need to be identified and corrected. Subsurface drainage problems also need to be addressed before construction begins. Pre-milling may be needed to maintain specified height restrictions or to remove excessive surface distress preser- vation materials (e.g., crack sealing, variations in previous surface treatments). Traffic Control Traffic control is needed for the recycling process; project-specific requirements can be assessed and coordinated at the preconstruction meeting (Cross et al. 2010). Recycling trains can be long and move slowly, factors that need to be considered on roads with limited pavement and shoulder widths and/or few alternative routes. A single-unit recycling train may be preferred in urban areas with short distances between blocks. Intersections with heavy trucks can rut/shove fresh cold recycled mix when traffic is allowed on freshly placed cold mix surfaces. Weather Temperature and sunlight can influence how well the recycling agent coats the RAP; the potential breaking time of windrowed emulsion mixes; the time available for working, placing, and rolling the mix; and the time needed before allowing traffic on the new mix (Schellhammer 2019). Anticipated variations in temperature, humidity, and wind conditions and how they might influence curing times need to be considered at the start of construction. These factors can be reevaluated at the start of each dayâs paving. The FHWA technical brief (Wagner 2018) notes the preferable ambient air temperature in the shade is at least 50°F (10°C), with no weather forecasts for measurable precipitation or freezing temperatures. McCarty (2017) recommends that the pavement temperature be at least 65°F (18°C) and rising, with a maximum of 130°F (54°C). An ambient temperature above 60°F (16°C), with a maximum of 95°F (35°C) and a minimum overnight low of 35°F (2°C) is desirable. Seasonal exclusions for cold recycling projects may be needed, depending on the project elevation.
62 Practice and Performance of Cold In-Place Recycling and Cold Central Plant Recycling Lombardo (2018) notes that the RAP, rather than the air temperature, needs to be greater than 50°F (10°C). Cooler temperatures cause the foamed asphalt to cool too quickly, and asphalt stringers can form, whichâaccording to the Virginia DOTâs experienceâmakes compaction difficult. CCPR The cold recycled material can be mixed in a portable batch or drum plant, or at an existing plant. Regardless of the type of plant, the cold feed bin rates are used to control the proportions of the RAP and any corrective aggregates that are fed into the plant. Emulsified asphalts need shorter mixing times, and care is needed to avoid over-mixing, which results in scrubbing the emulsified asphalt off the coarser aggregate particles. This can lead to premature breaking of the emulsion and overly stiff mixtures. Under-mixing may leave the mix only partially coated, but the additional movement of the mix during placement and rolling helps by further mixing and coating it. Ideally, the CCPR mixes are loaded into haul trucks and delivered to the paver within 1 hour of mixing (Wielinski 2017). CCPR mix lift thicknesses need to be kept to 3 in. (75 mm) or less, but multiple lifts can be used as long as sufficient time is given to allow emulsion mixes to break before the next layer is placed (Kandhal and Mallick 1997, chap. 13). Limiting the height of CCPR RAP stockpiles at the portable central plant location minimizes the dead load. To prevent consolidation and clumping, it is important to keep construction equipment off the RAP material, particularly in hot weather. Locating a Cold Central Plant Operation CCPR mobile plants can be used to temporarily store RAP and then produce cold recycled mix from a single project, or they can be located at or near an existing surplus RAP stockpile. If the agency owns an existing RAP stockpile, which is typically located at a maintenance or storage facility, then the CCPR plant can be set up at that location. The agency asset manager can help identify possible CCPR plant locations (D. Schellhammer, personal communication, May 11, 2020). The primary factors to consider when determining the location of a CCPR operation are these: ⢠Sufficient available space ⢠The capacity of roadways going in and coming out ⢠Site conditions The location needs enough room for tankers to move in and out and to turn aroundâso a minimum of 2 acres is preferable. The tanker acts as the liquid storage tank(s) so only one tanker is moving in and out at a time. Also, the location needs to have a working platform for the equipment and be sufficiently level to prevent material loss and allow proper front end loader operation. A cement-stabilized area is an acceptable working platform. If the portable plant needs to be located somewhere within the community other than an existing agency or contractor site, then establishing communications with the local community is critical. Clear and transparent explanations about the economic and environmental benefits need to be included in any discussions as well as explanations of hours of operations, haul routes, and how the plant operates. CCPR processes are dustless and exhaustless with limited numbers of tankers and haul trucks, factors that also need to be communicated to the community. One main benefit of using CCPR mobile plants to produce cold recycled mixes is that the voids in the mix can be reduced with the use of secondary RAP stockpile processing. RAP materials coming from different projects and lift locations can be blended to provide a mix with more
Literature Review 63  consistent properties. This is particularly helpful when the RAP comes from both driving lanes and roadway shoulder, or from multiple projects. One advantage for CCPR is that RAP material properties can be assessed for better control of the recycled asphalt mix properties. Long RAP storage times can make it difficult to effectively work the stockpile as the RAP begins to clump together. RAP moisture content influences the consistency of the cold recycled mix properties. The moisture of the RAP stockpile can be measured at portable plant locations with low-tech procedures, such as drying a sample on a hot plate and using a scale to measure the before and after drying mass. The stockpile can be covered for short-term moisture control if the CCPR plant needs to keep producing during wet weather. Larger-size contaminants can cause problems with production when crack fillers and fabric clog the screens. These contaminants can be more easily removed during screening at CCPR operations at the plant location than during CIR construction on the roadway. Milling Standard milling equipment is used to remove the existing pavement to the required depth, restore the pavement surface to the correct grade and slope, minimize or eliminate pavement distresses, and improve the roadway ride quality (Cross 2015; FHWA 2019). The milling opera- tion can be an integral part of the in-place recycling equipment, or it can be a separate operation that removes and stockpiles the RAP at the CCPR location. The width of milling operations needs to overlap any previous passes by at least 4 in. (100 mm), and the milling depths and widths need to be verified during construction (Wagner 2018). The milling equipment needs to be inspected to ensure the miller meets the required width, the cutting teeth are in place and in good shape, the milling equipment has sufficient weight and horsepower to cut to the required depth and at the required tolerances, and the spray bar and nozzles are working and not clogged. Milling Machine Characteristics For CCPR, the milling operation may be separate from the paving process. In this case, the milled surface may need to be exposed to traffic for a limited time. A fine, consistent texture is desirable when the milled surface functions as a temporary driving surface. Micromillers produce a fine surface texture but only remove a few millimeters of the existing surface. Full- lane-width millers are used for the majority of milling operations, but smaller, narrower milling units can be used in tight areas and around utility features (e.g., manhole covers) (Christianson and Mahoney 2019). Factors that contribute to the surface texture, and the uniformity of the texture, include the cutting teeth configuration, miller speed, overall condition of the equipment (i.e., maintenance, track pad condition), pavement condition, and amount of water used for dust control (Chastain 2019). Worn-out track pads generate an uneven platform for the cutting drum and loss of trac- tion. A standard cutting pattern uses a triple wrap of teeth spaced at 5�8-in. (16-mm) intervals. This configuration is useful for removing old pavements up to 17 in. (38 cm) deep. A cutter drum with teeth spacing at 5�16 in. (8 mm) produces a finer texture, but this configuration can remove only a few millimeters to a few centimeters in a single pass. Finer surface textures are obtained with slower milling speeds (Figure 28). Distributors Distributors (i.e., nurse trucks) supply the emulsion to the recycling unit. The recycling train must be able to push the nurse trucks to keep them moving at the same speed as the other equipment (Christianson and Mahoney 2019). The tank interior needs to be clean, dedicated
64 Practice and Performance of Cold In-Place Recycling and Cold Central Plant Recycling to transporting a single material, and not contaminated with other materials. A flexible hose connects the nurse truck to the pugmill/recycling unit (FHWA 2019). Field Adjustments to Material Quantities The environmental conditions at the construction site influence the quantities of water, recy- cling agents, corrective aggregates, and active filler needed throughout the day. As the tempera- ture increases, the initial optimum emulsion content typically needs to be reduced (Wegman and Sabouri 2019). Limited changes in the field to quantities defined in the mix design and job mix formula may be allowed. If the changes are minor, experience has shown they can be expected to have little influence on the short-term performance as it relates to surface raveling or cohesivity. VanFrank (2015) noted that the existing pavement temperature influenced both the RAP gradation obtained during milling operations and how easily the cold recycled mix compacted. As the cold recycled mix became easier to compact, the contractor typically decreased the emul- sion content only between 0.5% and 1.0% lower than the mix design to keep from producing a tender mix that was prone to moving and rutting under traffic. On one project (VanFrank 2015), observations showed that for every 5°F (9°C) increment above 85°F (29°C), the emulsion target was reduced by 0.1%. The early cracking distresses on some of these projects were attributed to residual asphalt contents that were too low to resist traffic-related and thermal cracking. Another concern was that if the liquid quantities were decreased too far, then the emulsion might flash set before compaction could be completed. Typical field adjustments to material quantities use the mix design quantities as a starting point; agencies have different tolerances for allowing changes in quantities in the field. McCarty (2017) noted that the binder content (i.e., recycling agent) production target was set at ± 0.3% of Source: Based on Chastain 2019. Figure 28. Examples of different pavement textures that are generated with different milling speeds.
Literature Review 65  the mix design, and ± 0.2% allowances were permitted from the production target. Cross (2012) conducted a 13-agency survey that showed the following allowable recycling agent tolerances: ⢠± 0.2% (7 agencies) ⢠± 0.3% (1 agency) ⢠± 0.1% (1 agency) A visual examination of the emulsified cold recycled mix being produced can determine whether about 75% of the particles are coated. The mix needs to have adequate cohesion that can be observed by squeezing the mix by hand into a ball. If the ball crumbles after the pressure is released, then there is inadequate cohesion. If the mix is adequately coated but lacks cohesion, the water content may need to be increased. Too little water results in mix segregation, raveling under traffic, and/or poor density; excess water results in flushing and retards curing. If the palm of the hand is coated with emulsion, then the emulsion content may need to be decreased slightly. The look of the mat should be brown and cohesive. A shiny black mat indicates too much emulsion, and excessive raveling indicates too little emulsion. Successful projects routinely acknowledge the experienced individuals and emulsion manu- facturer representatives on-site who provide good communication and timely education of field staff. Fillers Portland cement or lime (or other dry materials) can be dry spread ahead of milling, added at the mill head, or added directly into the pugmill. If the dry materials are spread in front of the milling operation, then the materials need to be spread uniformly across the entire width of the lane when using single-unit trains with no pugmill. Dry materials added in slurry form can be added at the milling head or into the pugmill (Cross et al. 2010). Recycling Unit The recycling unit consists of some means of managing the maximum RAP size, adding the required materials, and mixing all the materials. The screen deck needs to have the proper size openings to meet the required maximum RAP particle size, with the ability to divert the over- sized material back through the crusher (Cross et al. 2010). The pugmill components (such as the arrangement of the pugmill paddles), the height of the pugmill end gate, and the location of the spray bar can be adjusted to control the quantities of added materials and the uniformity of the cold recycled mix. Pugmill paddles should be in good condition, and appropriate clearance should be maintained between the paddles and wall of the pugmill. The walls of the pugmill need to be inspected to ensure there are no holes or evidence of excessive wear. The quanti- ties of liquid materials added to the pugmill are influenced by the condition of the spray bar components. The supply lines for incorporating additional water and emulsions, or from the foamed asphalt portion of the equipment, should show no signs of clogging. It is important for the materials to be delivered to the pugmill in a consistent, uniform manner. Recycling agent and additive systems need to be properly calibrated and capable of accu- rately dispensing required quantities. Typically, on-board equipment control systems have meters that record the rate of flow and the total amount of each liquid being added (Wagner 2018). These systems are usually positive interlock systems that are linked to forward speed to maintain the addition of liquid recycling agent according to the speed of the equipment. Full equipment calibrations are completed at the start of paving season, and in-place volumetric calibrations are done after every lot during paving (Cross 2014).
66 Practice and Performance of Cold In-Place Recycling and Cold Central Plant Recycling Equipment calibration can be checked using material quantity volumetrics at the end of each day, certified delivery weigh tickets, or by using the canvas patch test. For foamed asphalt, the system needs to have a sampling valve so the expansion ratio and half-life of the material can be verified. Paver The cold recycled mix can be placed with conventional paving equipment as long as the screed is not heated. A heated screed can tear the mat, influence breaking rates, and result in a less workable mix (Kandhal and Mallick 1997, chap. 13). A paver with 170 hp is commonly consid- ered the minimum power level for placing cold recycled mixes (Wielinski 2017). The recycled mix is transferred directly into the paver hopper or a surge bin placed in the hopper. Surge bins can help manage larger volumes of material and prevent spillover. When windrows are used, sufficient lateral movement of the mix across the width of the screed requires a paver with enough power to pick up the full windrow. The pickup device needs to be close enough to the pugmill that emulsified asphalt cold recycled mixes do not start to break in the windrow. Also, when the paver lags behind the recycling unit, the paver operator may raise the windrow elevator an inch or two above the milled surface to keep up. This leads to lateral density differences across the lane and segregation of the mix (VanFrank 2015). The mix needs to be placed to the required grade, slope, and crown, and the longitudinal and transverse joints need to be properly constructed. The paver should be operated with the auto- matic grade and cross-slope controls (Cross et al. 2010). Ambient and pavement temperatures can influence paving operations. The Utah DOT (2017) reported that when the pavement temperature was above 90°F (32°C), the temperature in the windrow was as high as 136°F (58°C) and the production slowed significantly (VanFrank 2015). In this case, the contractor chose to move paving to cooler nighttime work. In addition, the emulsion content needed to be reduced by about 0.1% for every 5°F (3°C) increase in the windrow temperature to keep the mix workable through and behind the paver. Rolling Both steel wheel and pneumatic tire rollers are needed to compact cold recycled asphalt mixtures. But the number and sequencing of rollers vary widely. A 13-agency survey by Cross et al. (2010) noted the following requirements for vibratory double steel drum rollers: ⢠9-ton minimum (1 agency) ⢠10-ton minimum (5 agencies) ⢠12-ton minimum (2 agencies) The requirements for pneumatic tire rollers included these: ⢠Less than 20 tons (1 agency) ⢠20-ton minimum (2 agencies) ⢠25 tons or greater (9 agencies) While agencies and contractors seem to agree that both types of rollers are needed, which type is best for breakdown and intermediate rolling varies. Heavy pneumatic tire rollers can be used for breakdown rolling (Kandhal and Mallick 1997, chaps. 12 and 13; Cross et al. 2010; McCarty 2017), and vibrating steel wheel rollers (high frequency and low amplitude) can be used as the finish rollers. Zagoudis (2013), VanFrank (2015), Wielinski (2017), Wagner (2018), and Gallegos (2019) indicate steel wheel rollers can be used for breakdown, and pneumatic tire rollers can be used as the intermediate rollers. Steel wheel rollers in static mode are then used for
Literature Review 67Â Â finish rolling to remove any pneumatic tire impressions. If pneumatic rubber tire rollers tend to shove the mix when used as the breakdown rollers, then one or two passes with a double steel wheel roller can help prevent excessive shoving. The ability of any combination and sequencing of rollers is usually established for each project by constructing a test strip. McCarty (2017) documented that satisfactory compaction was achieved on a northern Arizona project using two heavy pneumatic tire rollers for breakdown (minimum 30 tons), operating in tandem, with a minimum of nine passes. Finish rolling was completed with a 12-ton steel wheel roller with a minimum of two coverages. Traffic was returned to the roadway after a 2-hour waiting period. The number of rollers available needs to be sufficient to keep up with the construction speed; they need to meet the weight and width requirements; and the water systems and spray bars for roller scrapers need to be working and in good shape (FHWA 2019). The pneumatic tire pres- sure needs to be consistent and the tires inflated to the proper pressure. Care is needed to ensure the mix is not over-rolled; the roller stops, starts, and turns are gradual; and the finish rolling is completed within the required time frame. Only a light application of water on drums or tiresâto prevent pickupâis necessary. The Nevada DOT routinely waits to compact the mix until after the emulsion breaks, which is usually between 1 and 2Â hours (Busch 2012). Once compaction is complete, the surface is fog sealed and a sand blotter is applied before opening to traffic. The traffic can be helpful for further compaction on low-volume roads. Test Strips Some agencies allow work to proceed if the test strip was successfully constructed while other agencies require material to be obtained and the mix design values verified before work starts. The difficulty with using the field-mixed, laboratory-compacted specimens to establish the field target density is that a significant amount of time is needed between sampling and obtaining test results; construction equipment and staff sit idle until results are obtained. When the milled material shows evidence of substantial changes as the construction proceeds, further delays result during the wait for new target densities. Test strips, usually at least 1,000Â ft long, can be used to establish a rolling pattern at the beginning of construction (Wagner 2018). The goal of constructing the test strip is to establish the maximum achievable in-place density using a reasonable compaction effort (Cross 2015). The test strip is also used to demonstrate the specific equipment, sequencing of equipment, materials, and recycling processes that can produce a pavement layer that conforms to specifi- cation requirements. During the construction of the test strip, optimal material quantities are established, and the accurate metering of materials is validated. Additionally, test strips can be used to obtain RAP samples before binders and other materials are added. These RAP samples are then used to prepare laboratory-mixed, laboratory-compacted cold recycled mix specimens to verify the original mix design and establish the target compacted specimen density for field quality assurance (QA) testing. The relative wet density of the test strip is measured with a nuclear density gauge (AASHTO T 355, ASTM D2950). The density is measured after every roller pass and used to develop a plot of density versus the number of passes until the break-over point is reached. That is when the wet density stops increasing and starts to decrease with continued rolling. Daily communica- tion with the roller operators is needed to review the rolling patterns needed for achieving the required density. The downside of establishing the rolling pattern, rather than setting a density requirement, is that a fixed rolling pattern cannot be easily altered to adapt to environmental conditions as they change throughout the day.
68 Practice and Performance of Cold In-Place Recycling and Cold Central Plant Recycling In-Place Density Field density can be specified as 97% to 98% of test strip density, field compacted density, or laboratory bulk specific gravity (Cox and Howard 2013). Alternatively, densities can be specified as relative compaction that is 95% to 105% of the maximum break-over curve density (Wielinski 2017). A new break-over curve needs to be established if the test results are outside of compac- tion limits. If specimens are compacted in the field, a range of methods are used to prepare the spec- imens, including a Proctor hammer, a modified Proctor hammer, and a Marshall hammer (Christianson and Mahoney 2019). Schwartz et al. (2017) used a nuclear moisture-density gauge to track foamed asphalt stabi- lized base density and moisture. Results showed these gauges are useful for monitoring the mois- ture content, but only if the actual moisture content is used for correlating the nuclear gauges. Undamaged cores can be obtained only once the cold recycled mix has cured, which can take several days to weeks. It can be difficult to correlate cured specimen laboratory density to wet densities measured with a nuclear gauge during construction. The Utah DOT developed a method for setting a target density based on field mix compacted specimens with 30 gyrations and establishing roller patterns to achieve the best compaction effort (Kergaye 2017). Specimens need to be compacted immediately after the mix is sampled. Cold recycled mixes that are sampled and compacted later have significantly different properties than those compacted immediately after sampling. If the mixes need to be sampled for compac- tion later, then the maximum time between sampling and compaction as well as storage and compaction temperatures need to be clearly defined. Time Between Mixing (Stockpiling) or Sampling and Testing The amount of time between taking field samples and then compacting and testing cold recycled mixes influences the test results. Cross (2012) evaluated the effect of the time between sampling and testing field samples on an Oroville, California, Federal Lands Highway (FLH) project. Emulsified asphalt cold recycled mix samples were obtained in the morning then compacted in the field lab (35 gyrations) that afternoon at ambient temperatures. Samples obtained in the afternoon arrived at the field lab late in the evening and were not compacted until the next morning. Both the compacted specific gravity and the air voids were significantly influenced by the time between sampling and compaction (Table 42). The dynamic modulus was also significantly affected by the time between sampling and compaction. Specimens sampled in Property Sampled Afternoon of Day Before, Compacted in Morning Sampled in Morning, Compacted in Afternoon Air voids, % 20.2 14.7 Indirect tensile strength, dry, psi 72.1 74.5 Indirect tensile strength, wet, psi 64.5 55.6 TSR, % 90 75 Dynamic modulus @ 20°C, 1 Hz, ksi 355 456 Source: Based on Cross 2012. Table 42. Impact of delaying compaction on cold recycled mix properties.
Literature Review 69  the morning and compacted in the afternoon had significantly lower voids and higher moduli values than specimens sampled in the afternoon and compacted the next morning. Khosravifar (2012) and Schwartz et al. (2017) reported on the effect of stockpiling time from 0 to 15 days for typical Virginia foamed asphalt RAP mixes. The mix comprised 2.5% foamed asphalt, 100% RAP, and 1% Portland cement. The indirect tensile strength was 58 psi (399 kPa) immediately after compaction and decreased to 44 psi (303 kPa) after 3 days of storage. The wet indirect tensile strength was about 46 psi (317 kPa) immediately after compaction and decreased to about 35 psi (241 kPa) after 3 days of storage. Kazmi (2018) provided a further evaluation for the Virginia DOT of the effect of time between mixing and compacting on CCPR mix properties. The cold central plant was used to prepare a mix of 85% RAP, 15% corrective aggregate (No. 10), 2.5% foamed binder, 1% Portland cement, and a moisture content of 4.8%. Samples were taken from the mix and placed in a 5-gal bucket lined with a plastic bag. The bucket was sealed to maintain the moisture content. Checks of moisture showed a consistent 6% moisture in the bags of specimens that were fabricated at various times after mixing. Specimens were prepared to a fixed height of 7 in. (180 mm) with an SGC. The number of gyrations needed to compact the specimens to the fixed height (i.e., density) increased linearly with storage time. Specimens compacted immediately needed only 50 gyrations to obtain the required height. However, specimens compacted after 6 days of storage needed approximately 410 gyrations. Dynamic modulus at 1 Hz decreased as the time after mixing increased up to 3 days. The increased compactive effort needed to achieve the required height was attributed to the need to break up the cement hydration bonds. The indirect tensile strength specimens were prepared using the 75 blow Marshall method. The compactive effort was kept constant, but the mass in the mold needed to be reduced to get the correct specimen height. Indirect tensile strength decreased with increasing time after mixing and leveled off after about 3 days (Figure 29). The voids increased with increasing time between sampling and compaction. Source: Based on Kazmi 2018. Figure 29. Influence of stockpiling time on foamed asphalt cold recycled mix indirect tensile strength.
70 Practice and Performance of Cold In-Place Recycling and Cold Central Plant Recycling Delays between mixing the cold recycled materials and testing result in lower densities and strengths than mixes that are compacted shortly after mixing and sampling. Specimens need to be compacted and tested on the same day they are mixed. Storage times as short as overnight will significantly influence the test results. Materials and Testing Testing requirements, other than density, include verification and monitoring of individual material quantities and verification of key construction equipment and processes (McCarty 2017; ARRA CR301). Individual material properties for foamed asphalt, emulsions, Portland cement, and lime are typically accepted based on the submittal of a certificate of analysis provided by the material supplier. Alternatively, individual material samples can be taken and returned to the laboratory for testing (Cross 2014). When foamed asphalt is used, the asphalt temperature needs to be checked before connecting the tanker to the recycling unit. The expansion ratio and half-life need to be measured at the test nozzle on the recycling unit or mixer for compliance with the specifications. The physical properties of the corrective aggregates, if used, can also be accepted based on a certificate of analysis provided by the material supplier. Alternatively, key aggregate prop- erties can be assessed using materials sampled from the stockpile according to AASHTO T 2 (ASTM D75). The recommended aggregate testing includes (ARRA CR301): ⢠AASHTO T 27 (ASTM C136) for sieve analysis ⢠AASHTO T 11 (ASTM C117) for determining the minus No. 200 (0.075-mm) sieve by washing ⢠AASHTO T 96 (ASTM C131) for durability using Los Angeles abrasion ⢠AASHTO T 176 (ASTM D2419) for sand equivalent test The QA testing evaluates the maximum RAP particle size and the dry or wet RAP gradation from the maximum top size, and usually down to the No. 30 (0.60-mm) sieve size. The RAP temperature can be measured using a stem thermometer or handheld infrared temperature âgun.â RAP moisture content can be measured using one of the following methods: ⢠AASHTO T 329 Standard Method of Test for Moisture Content of Asphalt Mixtures by Oven Method ⢠ASTM D2216 Standard Test Method for Laboratory Determination of Water (Moisture) Content of Soil and Rock by Mass ⢠ASTM D4643 Standard Test Method for Determination of Water Content of Soil and Rock by Microwave Oven Heating ⢠AASHTO T 265 Standard Method of Test for Laboratory Determination of Moisture Content of Soils The mixing equipment is calibrated by delivering known quantities of RAP, bituminous recycling agent, and water through the equipment. If the application rate varies by more than 10% (considered an acceptable equipment tolerance range) as determined by volumetric calcu- lations, then the equipment needs to be recalibrated. The milling depth is commonly measured adjacent to the longitudinal joint every 100 ft (33 m). The depth of recycled material can be measured with a depth probe, across the mat width behind the screed. The cross slope can be measured across the width of the mat using a Smart level to within ± 0.1% of the specified cross fall. The surface tolerance, as measured with a 10-ft (3-m) straight edge, is typically required not to vary by more than 3�8 in. (10 mm) over the 10-ft (3-m) length in any direction.
Literature Review 71  Opening to Traffic The cold recycled mix surface is usually fog sealed before the roadway is opened to traffic to seal the new surface. Blotter sand can be used on top of the fog seal to minimize the tracking and raveling of the cold recycled mix. Excess blotter sand should not be allowed (FHWA 2019). Any needed temporary pavement markings, as specified, should be placed before opening to traffic. Depending on how fast the cold recycled mix cures, the traffic speeds may need to be controlled at reduced speeds for an extended time to prevent raveling. The Utah DOT (2017) requires a torque reading greater than 30 lb-ft (4 kg-m) for the shear vane test before the roadway can be opened to traffic. Secondary Compaction Supplemental compaction, also referred to as secondary compaction, is done with emulsified asphalt cold mixes after the roadway has been open to traffic but before the final wearing surface is placed. It can remove minor depressions due to traffic (FHWA 2019) or provide further densification of the cold recycled layer, which can minimize rutting (Saidi 2019). Cross (2012) proposed modifications to the FLH CIR specification that includes provisions for supplemental compaction. Supplemental compaction is undertaken a minimum of two days after the initial compaction but before the final wearing surface is placed. Pneumatic and steel drum rollers are used when the pavement temperature is at least 80°F (27°C). A new rolling pattern, using the same equipment and procedures as for the initial compaction, should be established, with a minimum of four roller passes. The new density needs to be within 5% of the target density as measured with a nuclear density gauge; additional compaction can be stopped if checking or cracking in the mat is seen, or if the CIR surface temperature drops below 80°F (27°C). In 2017, McCarty of the Arizona DOT regional office in Flagstaff suggested revisions to the stateâs CIR specifications based on a forensic evaluation of a CIR project that had exhibited early poor performance. These included requiring secondary compaction when the ambient tempera- ture is at least 80°F (27°C) and monitoring density during compaction using a thin lift nuclear density gauge. The wet density can be compared to the field compacted specimens, and the dry density then compared to the theoretical maximum density. Caltrans recently updated Section 30-5 for Cold In-Place Recycling Using Emulsified Asphalt. Section 30-5.-3.H for supplemental compaction requires that the CIR surface be recompacted after curing is complete, before smoothness testing and before the overlay is placed. âCuredâ is defined as one of the following: ⢠3 days and the moisture measured at the mid-depth of the CIR layer is 2.0% or less ⢠10 days without rainfall The final wearing surface must be placed within at most 15 days after the completion of the CIR surface. A new rolling pattern and break-over density need to be established for the supplementary compaction effort. Recompaction is done only after curing is complete and when the CIR surface temperature is at least 80°F (27°F). Laboratory Study to Investigate the Impact of Time and Temperature on the Benefits of Supplemental Compaction Campos (2019) reported the results of a laboratory study designed to evaluate the effects of supplemental compaction applied at different times and temperatures. Cold recycled mixes were prepared using 2.5% additional water, 3% of an engineered polymer-modified cationic
72 Practice and Performance of Cold In-Place Recycling and Cold Central Plant Recycling emulsion, one source of RAP, and four levels of Portland cement (0%, 0.3%, 0.6%, and 1%). Specimens were mixed and compacted (30 gyrations) at room temperature [77°F ± 9°F (25°C ± 5°C)]. One set of specimens was extruded and tested immediately. Other specimens were left in the molds and subjected to additional compaction after 2 hours, or after 48 hours. Specimens were cured at one of two temperatures [77°F or 90°F (25°C or 32°C)] in between the initial and supplemental compaction effort. Specimens were extruded only after the supplemental compaction was complete. The air voids and Marshall stability (wet, dry) were determined for all mixture, compac- tion, and curing temperature variables (Table 43). Additional performance testing for mixes with zero and 0.3% cement included Hamburg rut testing, indirect tensile strengths (dry, wet), and SCB fracture energy. Results showed that supplemental compaction applied 2 hours after initial compaction reduced air voids, increased Marshall stabilities (wet and dry) and indirect tensile strengths, and decreased rutting potential. Supplemental compaction at 48 hours tended to either provide no additional benefit or to be detrimental to mix properties. When the specimens were cured at either temperature for 48 hours before the supplemental compaction was applied, the air voids remained around the same levels as those compacted and tested at 2 hours. In several cases, regardless of the curing and subsequent supplemental compaction, the Marshall stabilities (dry and wet) and indirect tensile strengths (dry and wet) Active Filler, % Supplemental Compaction Temperature and Time 77°F (25°C) 90°F (32°C) Immediate 2 hours 48 hours 2 hours 48 hours Air Voids* No cement 15.3 9.5 15.0 12.3 13.2 0.3% cement 14.0 11.5 14.5 13.5 12.2 0.6% cement 14.5 13.3 14.5 12.2 12.8 1% cement 17.0 13.7 13.5 12.5 15.8 Marshall Stability, lb, Dry* No cement 3,950 5,150 4,250 5,650 5,400 0.3% cement 3,250 4,350 3,800 5,400 4,250 0.6% cement 3,600 4,550 4,150 5,050 5,200 1% cement 3,200 4,550 4,600 4,200 4,150 Marshall Stability, lb, Wet* No cement 2,800 5,600 2,850 3,975 3,050 0.3% cement 2,800 3,850 3,450 3,800 4,450 0.6% cement 3,400 4,000 3,800 4,550 4,550 1% cement 3,000 3,950 4,050 4,800 4,100 Indirect Tensile Strength, psi, Dry* 0.3% cement 68 90 66 123 108 Indirect Tensile Strength, psi, Wet* 0.3% cement 43 68 55 88 79 Hamburg Rut Testing, mm @ 20,000 Passes 0.3% cement 4.0 2.5 5.3 3.1 3.9 *Values estimated from graphs in the presentation. Source: Based on Campos 2019. Table 43. Influence of supplemental compaction time and temperature on cold recycled mix properties.
Literature Review 73  were lower after 48 hours compared to the 2-hour results (Figure 30). The Hamburg rut depths also increased if the supplemental compaction was delayed for 48 hours. The benefits that can be gained with supplemental compaction may be more easily obtained if the additional compaction occurs within a short time after the initial compaction. The mix variables may also influence the effectiveness of supplemental compaction. These possibilities need to be evaluated in future research projects. Curing Some agencies have recently evaluated stiffness measurements or the shear resistance of the mix as an indication of curing. The Utah DOT completed a 5-year study for improving the design and construction of cold recycled mix projects (VanFrank et al. 2016; Kergaye 2017). The study developed a shear vane test method to determine when the final wear course can be placed. Most frequently, agencies specify either a minimum curing time or a maximum moisture content, while some agencies and industry recommendations include both (Bowers et al. 2020). Typical curing times range from 2 to 10 days; maximum moisture contents range from 1% to 3.5%. The optimum moisture content can also be defined as a percentage of the mix design. ARRA recommends a minimum curing time of 3 days and a maximum moisture content of 3% or less. While moisture content is routinely used to specify when the cold recycled mix can be opened to traffic, the method used to measure the in-place moisture is rarely defined. Moisture Content Measurements One researcher explored the use of dielectric constant sensors embedded in the CIR pave- ment layer to measure the in-place moisture on nine projects (Woods 2011). All of the projects experienced significant rainfall before the final overlay wearing surface was placed (Table 44). Source: Based on Campos 2019. 68 45 90 7068 55 0 20 40 60 80 100 120 140 160 IDT, Dry IDT, Wet In di re ct T en si le S tr en gt h, p si Immediate 2 hr 48 hr 25C (77F) 68 45 125 78 105 85 0 20 40 60 80 100 120 140 160 IDT, Dry IDT, Wet Immediate 2 hr 48 hr 32C (90F) Figure 30. Impact of curing temperatures and timing of supplemental compaction on indirect tensile strength (0.3% cement).
74 Practice and Performance of Cold In-Place Recycling and Cold Central Plant Recycling While the moisture content frequently increased to more than 16% after a rainfall, the CIR layer quickly drained the excess water, usually within 24 hours of the rain stopping. The initial research at the start of the project evaluated the rate of change in moisture content due to temperature changes (Figure 31) and humidity changes (Figure 32). Sensors were placed in two projects at 2 in. (50 mm) and 3.5 in. (89 mm) from the CIR surface. The rate of change in the moisture content is somewhat dependent on the depth of the sensors in the CIR layer. Year County Recycling Agent No. of Rainfall Events Days Before Wearing Surface Was Placed Initial to Peak Moisture Content, %* Time to Drain to Pre-Rain Level, hours Daily Moisture Fluctuations During No- Rain Periods 2008 Scott CSS-1 14 19 2% to over 16% 24 to 28 2% to 3% 2008 Grundy Foamed asphalt 11 22 3% to over 20% 24 1% to 2% 2009 Clinton HFMS-2S 10 36 3.5% to over 16% 24 1% 2009 Iowa Foamed asphalt 4 27 3% to over 14% 24 1% 2010 Benton Foamed asphalt 18 28 3% to over 22% 24 1% 2010 Marshall Foamed asphalt 4 28 3% to over 20% 24 1% 2010 Delaware (1) Foamed asphalt 9 41 2% to over 12% 24 < 1% 2010 Delaware (2) Foamed asphalt 7 24 4% to over 16% 24 2% 2011 Blackhawk Foamed asphalt 4 21 2% to over 20% 24 1% *Sensors located 2 in. (50 mm) below CIR surface. Source: Based on Woods 2011. Table 44. Moisture measurements for instrumented CIR projects in Iowa. Source: Based on Woods 2011. Figure 31. Influence of temperature on the rate of moisture changes in CIR layer.
Literature Review 75  Moisture content changes more rapidly as the temperature increases. Changes in the moisture content slow as the humidity increases. All instrumented projects show the moisture content was continually fluctuating, from 1% to 2%, as the environmental conditions changed through- out the day. If the wearing surface is placed before the cold mix has cured, trapped moisture can cause delamination, stripping, or rutting (Carter et al. 2013; Wagner 2018). Curing is slowed in shaded areas of the pavement. Newer solventless emulsions and engi- neered emulsions can cure in a few days, but older solvent-based emulsions can take up to 2 weeks to cure. Foamed asphalt mixes cure significantly faster than some emulsified asphalt cold recycled mixes. Carter et al. (2013) noted that the use of foamed asphalt reduces the curing period from the 14 days needed for emulsion mixes to 3 days. Layer Stiffness as an Indication of Curing Seven of the nine Iowa projects that were instrumented with moisture sensors were also evaluated with a GeoGauge to measure the CIR layer stiffness (Table 45). Betti et al. (2017) examined six foamed asphalt bituminous stabilized material (BSM) sections, comparing the results from a lightweight deflectometer (LWD), collected 4 hours after con struction, to those from an FWD, conducted 24 hours after construction. The 6.7-in. (17-cm) thick cold recycled mix layer test sections were placed in Florence, Italy, and used various per- centages of foamed asphalt, one of two active fillers (Portland cement, lime), and one inactive filler (mineral filler). The Italian Road Authority requires LWD stiffness of greater than 7 psi (45 MPa), which all six test sections met at 4 hours after construction (Figure 33). This testing showed layer moduli between 92 psi and 98 psi (634 kPa and 676 kPa) for the two sections with only lime or lime plus mineral filler. Layer moduli were between 133 psi and 163 psi (917 kPa and 1,124 kPa) for sections with cement. Additional FWD testing was conducted at 14 days, 28 days, and 9 months. The six test sections were closed to traffic for the 9 months needed for testing, and the sections had only a surface treatment for protection from the environment. All but one of the six test sections showed that most of the increase in layer stiffness occurred within the first 2 weeks after construction (Figure 34). The presence of lime in the mixtures seems to slow the strength gain over time. Source: Based on Woods 2011. Figure 32. Influence of humidity on the rate of moisture changes in CIR layer.
76 Practice and Performance of Cold In-Place Recycling and Cold Central Plant Recycling Year County Recycling Agent Peak Stiffness, MN/m Stiffness After Peak, MN/m Days Before Wearing Surface Was Placed 2009 Clinton HFMS-2S 35 at 3 days 30 36 2009 Iowa Foamed asphalt 28 to 30 at 11 days 26 but started to increase again at 23 days 27 2010 Benton Foamed asphalt 18 to 20 at 4 days 12 but started to increase again at 14 days 28 2010 Marshall Foamed asphalt 15 to 17 at 12 days 20 to 22 and continued to increase 28 2010 Delaware (1) Foamed asphalt Consistently 25 to 27 41 2010 Delaware (2) Foamed asphalt 25 to 30 at 12 days 22 to 25 24 2011 Blackhawk Foamed asphalt Fluctuated between 20 and 38 over the entire period 21 Note: MN/m = MegaNewton/meter. Source: Based on Woods 2011. Table 45. Measure of stiffness after CIR was placed and before wearing surface was placed. 24 20 24 24 24 18 133 154 163 150 92 98 0 50 100 150 200 250 300 Ba ck C al cu la te d La ye r M od ul i, ks i LWD @ 4 hr FWD @ 24 hr 3% Foamed Asphalt 2% Foamed Asphalt 3% Foamed Asphalt Source: Based on Betti et al. 2017. Note: L = lime only; MF = lime plus mineral filler. Figure 33. Comparison of cold recycled layer stiffness using LWD and FWD measurements. Schwartz et al. (2017) evaluated the time needed for the Zorn LWD and the GeoGauge in-place stiffness measurements to reach a stable value. The maximum stiffness was used as an indication that the final wearing surface could be placed. Results showed the stiffness measurements were significantly different between the devices. The Zorn LWD stiffness values were approximately half those of the GeoGauge, and neither unit provided âtrueâ values. The percent change in stiffness was 188% and 234% for the Zorn and GeoGauge, respectively, after 1 week. However, both gauges appear to be useful for indicating relative gains in stiffness. That is, they may be useful for determining the percent strength gain with time. Both gauges are also sensitive to
Literature Review 77  any loss of stiffness due to rainfall at the early stages of curing. The maximum stiffness readings limit the usefulness of the device to the early stages of strength gain. The GeoGauge user manual noted that the device had a useful range from 4 to 80 ksi, but testing showed the practical upper range was closer to about 65 ksi. Chan et al. (2009) evaluated the use of a full-size falling weight deflectometer (FWD) for determining the cold recycled layer stiffness for a roadway constructed in Ontario, British Columbia. FWD testing was conducted after the cold recycled mix layers were constructed (2003), then again each year after the final overlay wearing surface was placed (Table 46). The moduli of the cold recycled mixes were about half the stiffness of the composite layer moduli (i.e., years 2004 through 2006). Chen (2006) conducted an FWD study of 24 Iowa cold recycled projects, which showed similar moduli for both the conventional hot asphalt mix and the cold recycled mixes (Figure 35). But Chen noted that it was difficult to separate the individual layer properties because of the 0 50 100 150 200 250 300 350 Ba ck C al cu la te d La ye r M od ul i, ks i 24 hr 14 days 28 days 9 months 3% Foamed Asphalt 2% Foamed Asphalt 3% Foamed Asphalt Source: Based on Betti et al. 2017. Note: FWD Testing (Normalized to 21°C). Figure 34. Change in FWD stiffness measurements over 9 months. Year Layer Moduli, ksi (MPa)* Foamed Asphalt Emulsified Asphalt 2003** 170 (1,173) 154 (1,059) 2004 345 (2,376) 363 (2,501) 2005 308 (2,123) 342 (2,360) 2006 322 (2,219) 348 (2,399) *Normalized to 79°F (21°C). **Values for CIR only. Other years are for CIR + overlay. Source: Based on Chan et al. 2009. Table 46. Comparison of foamed asphalt and emulsified asphalt cold recycled mix FWD layer moduli.
78 Practice and Performance of Cold In-Place Recycling and Cold Central Plant Recycling similarity of the mix stiffnesses. The individual layer differences only begin to emerge when the differences between the individual layer moduli increase. Diefenderfer and Apeagyei (2014) reported the results of periodic FWD testing of the foamed asphalt CIR and CCPR test sections for the Virginia DOT I-81 project (Table 47). The CCPR test sections were 6 in. (150 mm) and 8 in. (200 mm) thick. The thickness of the CIR test section was 5 in. (125 mm). The stiffer subgrade and combined asphalt layer stiffness for the CCPR may be a function of the 12-in. (30-cm) FDR stabilized base. The thicker CCPR and overlay thick- ness compared to the CIR section variables may be contributing to the apparently lower CIR moduli values. Both the CCPR and CIR sections show a small gain in stiffness at 15 months after construction. Construction Processes Summary The weather during construction significantly influences milling operations, needed field adjustments for liquid quantities, cold recycled mix workability, curing time, and strength gain. When the milled surface needs to remain open to traffic before the cold recycled mix is placed, Months After Construction CCPR CIR Subgrade Modulus, ksi Asphalt Layer Modulus, ksi Subgrade Modulus, ksi Asphalt Layer Modulus, ksi 6 53 491 28 247 15 67 661 33 297 28 59 661 36 273 Source: Based on Diefenderfer and Apeagyei 2014. Table 47. Foamed asphalt CCPR and CIR FWD layer moduli. Figure 35. FWD results for Iowa cold recycled mixes with overlay. Source: Based on Chen 2006.
Literature Review 79  the miller speed and characteristics define the texture of the milled surface that may need to be used as the driving surface. It is important for recycling equipment to move together. A project needs a sufficient number of rollers to keep up with the paving operation without increasing the speed of the rollers. If the cold recycled mix is placed in a windrow, the paver elevator needs to have sufficient horse- power to pick up the mix and be close enough to the pugmill so that the emulsion does not break in the windrow. For cold recycled mixes with emulsions, there needs to be some evidence the emulsion is starting to break before rolling starts. Test strips are routinely used to establish the number of passes needed to achieve the max- imum density for the project-specific cold recycled mix and current environmental conditions. Nuclear gauges are used to obtain relative wet in-place densities. The nuclear density gauges can be calibrated with wet maximum specific gravity measurement or wet compacted bulk specific gravity using specimens compacted immediately after sampling. Cold recycled mix specimens need to be compacted immediately after the mix is sampled. A delay as short as 15 hours produces significantly different results compared to specimens compacted and tested within about 4 hours. Fog seals with blotter sand are commonly used to protect the surface of the fresh cold recycled mix before the roadway is opened to traffic. Adequate curing of the cold recycled mix before placement of the final wearing surface can be determined using the shear vane test or by specifying a minimum period, such as 14 days. Although the cold recycled mix gains strength over time, some evidence suggests that sig- nificant strength gains occur within the first 2 weeks. The reduction of in-place moisture is frequently specified but is difficult to confirm during rainy periods. The moisture content continually fluctuates from 1% to 2% over 24 hours because of envi- ronmental changes in temperature and humidity. Any rain on the CIR surface before the wearing surface is placed can increase the moisture content to over 16%. Using moisture content as an indicator of when the wearing surface can be placed does not appear to be a consistently reliable metric. Pavement Performance Five agencies have recycling programs at least 7 years old, with reported data: ⢠Iowa ⢠Minnesota ⢠Montana ⢠Nevada ⢠Ontario, Canada Iowa The pavement performance study of 24 CIR projects, all with overlays and constructed over 25 years, demonstrates that poor drainage can reduce the service life by 33% (Lee and Kim 2007; see also Chen 2006). The AADT traffic volumes were 2,000 or less. The study separated the projects into two groups based on drainage ratings. Pavement with poor drainage showed higher rutting, cracking (alligator, edge cracking, transverse), and lower average subgrade moduli (Figure 36). For projects with good drainage, the statistical analyses showed an average
80 Practice and Performance of Cold In-Place Recycling and Cold Central Plant Recycling predicted CIR service life of 34 years before the roadway reaches a pavement condition index (PCI) value between 40 and 55. For roadways with poor drainage, the predicted service life was only 22 years. The Iowa data show that CIR over underlying Portland cement concrete (PCC) pavements, or old cracked asphalt pavements, and topped with an overlay almost eliminated reflective cracking compared to new asphalt mix over PCC, old asphalt, and old, milled asphalt pavement (Schellhammer 2019). Minnesota The Minnesota DOT uses the pavement quality index to rate the condition of its roadways. The pavement index is calculated as the square root of the ride quality index times the surface rating. The ride index is a measure of the pavement roughness in in./mi, which is converted to a rating scale value from 0.0 to 5.0. The surface rating is based on the pavement distresses and expressed using a rating scale from 0.0 to 4.0. Jahren et al. (2016) evaluated seven Minnesota county CIR projects. The ride quality index ranged from about 2.25 to 3.70 (fair to good) for CIR with chip seals (four projects) for up to 7 years, and from 3.65 to 3.80 (good) for up to 5 years for CIR with overlays (three projects). Montana From 1995 through 2015, 23 CIR projects were constructed in Montana on low-traffic- volume roadways. The AADT levels were usually under 500. Of these, 17 have performed well for at least 11 years, 5 performed poorly, and one was constructed around 2015 so no perfor- mance information is available (Bugni 2015). Assessments were based on international rough- ness index (IRI) smoothness data, rutting measurements, reviews of construction reports, and Source: Based on Lee and Kim 2007. 30 71 64 115 48 17 13 86 10 85 45 41 0 0 20 91 0 20 40 60 80 100 120 140 Rutting Longitudinal Transverse Alligator Edge Patching Subgrade Modulus, ksi PCI D is tr es s M ea su re m en t Poor Drainage Good Drainage Figure 36. Summary of individual distresses for Iowa projects, sorted by drainage condition.
Literature Review 81  past Montana DOT documents summarizing information for each project. Table 48 summa- rizes assessments for 10 of the projects with satisfactory performance for up to 11 years as well as for 3 of the 5 poorly performing projects. Three of the 23 projects were also used to construct various CIR test sections (Table 49). These projects, ranging from 4 to 6 years old, show acceptable performance; the CIR sections with overlays show less rutting than the section with no overlays. Cracking seems to be similar for both CIR and conventional dense-graded hot asphalt mix sections. While not always related to the long-term performance of the cold recycled mixes, comments from the construction diaries listed various problems that can be organized into three categories: project selection, construction, and traffic. ⢠Project selection: â Cracking and breaking of the mat for one project was attributed to a centerline soil survey that was not conducted; lack of subgrade support was blamed for CIR increased rutting. ⢠Construction: â CIR was overlaid wet, which was considered the cause of the cracking and rutting. This project had poor performance. â Mix was placed at colder than desirable temperatures. â Emulsion content decreased too much in the field (about 1% lower than design). â Small pieces of crack sealant made it through the 1.25-in. screen but did not adhere well to the CIR mat, leaving golf ballâsized voids in the surface. The contractor switched screens and used two laborers to remove crack sealant from the mat surface. ⢠Traffic: â Parked construction equipment and traffic left shallow depressions in the new mat. The emulsion tended to adhere to the tires, which also resulted in damage to the surface. Materials Age IRI, in./mi Rut Depth, in. Before CIR After CIR Before CIR After CIR Satisfactory Performance 0.20 ft CIR, 0.20 ft PMS overlay 1 100 65 0.15 0.07 0.25 ft CIR, 0.15 ft PMS overlay 3 89 73 0.16 0.08 0.25 ft CIR, 0.15 ft PMS overlay 4 108 68 0.26 0.10 0.33 ft CIR, 0.23 ft PMS overlay 5 120 60 0.27 0.10 CIR with chip seal 5 96 100 0.20 0.09 0.25 ft CIR with chip seal 5 174 105 0.30 0.12 CIR with chip seal (Mix included 15% corrective aggregate, 1.4% quick lime, and an engineered emulsion at 1%.) 6 130 123 0.20 0.11 0.20 ft CIR with chip seal 7 128 88 0.14 0.07 0.35 ft CIR with chip seal 7 118 120 0.05 0.12 0.35 ft CIR with chip seal 11 133 72 0.07 0.09 Poor Performance 0.25 ft CIR with chip seal 3 124 121 0.11 0.11 0.20 ft and 0.30 ft CIR with chip seal 4 171 121 0.21 0.40 0.25 ft CIR with chip seal 9 158 61 0.40 0.09 Note: PMS = pavement management system. Source: Based on Bugni 2015. Table 48. Summary of CIR projects on rural Montana roadways.
82 Practice and Performance of Cold In-Place Recycling and Cold Central Plant Recycling The noted problems with tracking would have been eliminated by using blotter sand. One comment noted that CIR may have been a poor choice given the long and extreme winter climate typical in that part of the state. â Rough areas were observed where traffic stopped to wait for the pilot car on portions paved the previous days. â Truck traffic was higher than anticipated. Nevada The Nevada DOT has placed over 100 emulsified asphalt CIR projects over 30 years, with lime slurry to minimize moisture sensitivity. Over 3,421 lane-miles have been recycled on road- ways with traffic levels ranging from 4 to 3,700 equivalent single axle loads (ESAL) per day with excellent performance (Table 50). The types of emulsions that have been used are CMS-2s, Treatment Average Rutting in Both Lanes Cracks per MileOuter Wheel Paths Inner Wheel Paths 4 Years of Performance for Two Medicine Bridge, Montana (52 ESALs per Day)* 0.25 ft CIR, 0.20 ft grade D overlay 0.27 0.18 Not Available 0.20 ft CIR, 0.20 ft grade D overlay 0.23 0.15 5 Years of Performance for Red Lodge North, Montana (30 ESALs per Day)* 0.25 ft recycle 0.20 0.24 170** 0.25 ft recycle 0.18 0.24 88 0.25 ft recycle, 0.15 ft PMS 0.14 0.10 18 0.25 ft recycle, 0.30 ft PMS 0.24 0.16 0 0.30 ft cold mix, 0.34 ft PMS 0.18 0.18 0 0.25 ft mill and fill 0.22 0.16 73 6 Years of Performance for Hays North, Montana (40 ESALs per Day)* 0.10 ft HMA 0.14 0.17 375 0.20 ft 85/100 grade B 0.12 0.17 132 0.20 ft CIR, 0.15 ft 85/100 grade B 0.10 0.10 217 0.20 ft CIR 0.17 0.23 318 *ESAL = equivalent single axle load. **Abnormally high cracking in first-year evaluation. Source: Based on Bugni 2015. Table 49. Three sets of CIR test sections in Montana. Category ADT and Truck Traffic Percentage of Nevada DOT System Projected Deterioration Rate, Years 1 Controlled access 19 8 2 ESAL > 540 or ADT > 10,000 20 10 3 540 ⥠ESAL > 405 or 1,600 < ADT ⤠10,000 21 12 4 405 ⥠ESAL > 270 or 400 < ADT ⤠1,600 15 15 5 ADT ⤠400 25 20 Source: Busch 2012. Table 50. Anticipated service life of CIR projects with lime slurries for Nevada DOT projects.
Literature Review 83  PASS, and Reflex products. CIR with engineered emulsions has shown mixed performance and service life. Wearing surfaces that have been used over the years, other than overlays, include single or double chip seals, double chip over fabrics, cape seals, flush seals, and microsurfacing. The double chip over fabric did not work well because the paving conditions were too moist and water was trapped by the fabric. The trapped water vapor created bubbles under the fabric, which resulted in the chip seal aggregate debonding and raveling. PCI values were provided in the report by Sebaaly et al. (2018) for 29 CIR projects with over- lays and 25 CIR with chip seal projects. These data, with the extrapolated values removed from the database, were used to develop the performance prediction equations for each type of CIR project (Figure 37, Figure 38). A CIR with an overlay is estimated to provide about 23 years of service life until a PCI of 40 is reached. The anticipated service life of the CIR with chip seal projects is only about 16 years before the PCI reaches 40. Jahren et al. (2016) noted several reasons for variations in pavement performance, including isolated problems due to insufficient structural support that had not been identified at the begin- ning of the project, recycling agents that set too quickly, and raveling and rutting. Experience showed that the pavement performed best if at least 1.5 in. (37 mm) of the existing pavement was left to support construction equipment. One project experimented with using imported RAP from other locations, which performed well. Ontario, Canada PCI values were collected and analyzed for both emulsion and foamed asphalt cold recycled pavements constructed by the Ministry of Transportation in Ontario, Canada (Bhavsar 2015). The estimated service life is 21 years until the PCI decreases to 40. Data were also collected for ride quality over time. The IRI is estimated to increase to 269 in./mi (4.23 m/km) (Figure 39) for the foamed asphalt and emulsion cold recycled mix projects at 21 years of service life. A total of 115 emulsion CIR projects were placed in the county of Perth, Ontario, Canada. These projects had an average physical condition value of 56 when the pavements were from y = -0.0105x3 + 0.1696x2 - 1.0289x + 100 R² = 0.4346 0 10 20 30 40 50 60 70 80 90 100 0 5 10 15 20 PC I Years After Construction Source: Based on Sebaaly et al. 2018. Note: Lime slurry standard requirement. Figure 37. PCI changes with age for Nevada DOT CIR projects with overlays.
84 Practice and Performance of Cold In-Place Recycling and Cold Central Plant Recycling y = -0.0589x3 + 1.0378x2 - 5.5726x + 100 R² = 0.3453 0 10 20 30 40 50 60 70 80 90 100 0 5 10 15 20 PC I Years After Construction Source: Based on Sebaaly et al. 2018. Figure 38. PCI changes with age for Nevada DOT CIR projects with chip seals. Source: Based on Bhavsar 2015. y = 0.6742e0.0874x R² = 0.4459 0.0 0.5 1.0 1.5 2.0 2.5 0 5 10 15 20 IR I, m /k m Age, Years Emulsion IRI Foamed Asphalt IRI Figure 39. Ride quality for cold recycled mixes in Ontario, Canada.
Literature Review 85  21 to 25 years old (Figure 40), which indicates roadways in good condition at ages of up to 25 years. Traffic levels for these projects were generally under 8,000 AADT. Five foamed asphalt cold recycled mix projects included in the study showed the average physical condition value was 58 at 10 years after construction. This value is noticeably lower than the emulsified asphalt cold recycled mixes. The United Counties, a municipality in Ontario, Canada, constructed both emulsified (21 proj- ects) and foamed asphalt (12 projects) cold recycled mix projects. Among projects that were less than 10 years old, the foamed asphalt projects had a higher average physical condition value than the emulsified asphalt projects (76 and 64, respectively). Nevertheless, by the time the proj- ects were 10 to 15 years old, both types had an average value between 50 and 52. These ratings all classify the projects as being in fair condition at up to 15 years of age. The statistical analyses by Bhavsar (2015) found the pavement condition ratings were not significantly influenced by the AADT levels. However, a review of the individual inspection report distress data showed that projects with lower condition ratings also had higher levels of individual traffic-related distresses (e.g., rutting, distortion, cracking in the wheel paths). These higher distresses occurred on roadways with higher volumes of heavy truck traffic. Additional Cold Recycling Performance Information A summary of findings for CIR projects in New York State noted the service life of the reha- bilitated pavements increased by 11 years (Cross et al. 2010). The service life was similar to mill and fill or two-course overlay rehabilitation options. The Virginia DOT evaluated different options for pavement structures but with equivalent structural capacity (Diefenderfer and Apeagyei 2014; Diefenderfer 2016). The CCPR in the right lane of I-81 was used at two thicknessesâ6 in. and 8 in. (150 mm and 200 mm)âover 12 in. (300 mm) of the FDR stabilized base. Overlay thicknesses were 4 in. (100 mm) over the 8-in. (200-mm) CCPR and 6 in. (150 mm) over the 6-in. (150-mm) CCPR. After 3 years, the average rut depth was 0.05 in. (2.5 mm) and the IRI averaged 45 in./mi. The left lane was milled 2 in. 89 70 67 56 0 20 40 60 80 100 < 10 10 to 15 16 to 20 21 to 25 Av er ag e Ph ys ic al C on di tio n Va lu es Age, years Source: Based on Bhavsar 2015. Figure 40. Average Physical Condition Values for 115 CIR projects in the county of Perth, Ontario, Canada.
86 Practice and Performance of Cold In-Place Recycling and Cold Central Plant Recycling (50 mm) and the CIR was placed at 5 in. (125 mm) and used 4 in. (100 mm) of the overlay as the wearing surface. After 3 years, the average rut depth was 0.1 in. (2.5 mm) and the IRI averaged 56 in./mi. One Connecticut project, which consisted of a 3-in. (75-mm) CIR layer and a 2-in. (50-mm) overlay, was placed on a state highway with less than 5,000 vehicles per day (Henault and Kilpatrick 2009). An adjacent section used the conventional hot asphalt dense-graded mix overlay (control section). The primary distress on the existing roadway was extensive reflective cracking. The CIR layer showed a 65% reduction in reflective cracking compared to the control section. The CIR rut depths were 10% lower than the control section, as long as CIR longitu- dinal joints were not placed in the wheel paths. Also, the CIR was more prone to rutting when the uphill roadway grade was 4% or more. Pavement Performance Summary Emulsified asphalt cold recycled mix projects, with either overlays or nonstructural wearing surfaces, are well documented by agencies and researchers. Service lives of over 20 years can be typically expected for most projects (Table 51). Economic Benefits The economic benefits of using cold recycled mixes include the following: ⢠Reduced costs per lane-mile (Hoover 2014; Schellhammer 2019) ⢠Cost-effective source of materials in areas lacking local aggregate resources ⢠Lower-cost source of asphalt (Bugni 2015; Nair 2018) ⢠Reduced costs per lane-mile when compared to the conventional mill and fill option (VanFrank 2015; Wielinski 2017; Carvajal 2018; Wagner 2018; Schellhammer 2019; Stahl 2019) ⢠The economy of scale, which can be achieved when projects of at least 5 miles are cold recycled ⢠Reduced financial impact on local businesses (Hoover 2014) The experience of the Ontario Ministry of Transportation shows that cold recycling mix, without subgrade improvement, improves ride quality slightly to moderately, but it provides the best price/advantage ratio (i.e., initial ride + user cost/ride quality improvement) (Carter et al. 2013). Data that compare the cost of a traditional rehabilitation project to the costs associated with various cold recycled mix projects were collected from five reports (Table 52). While all of the Estimated Average Service Life Traffic Levels Binder Wearing Surface Location 22 years (poor drainage) 34 years (good drainage) < 10,000 Emulsions Nonoverlay (not identified) Ontario, Canada21 to 25 years (mixed experience) < 6,000 Foamed Asphalt 20 years < 6,000 Emulsions Overlay Iowa 23 years < 6,000 Emulsions, lime slurry Overlay Nevada 16 years < 6,000 Emulsions, lime slurry Chip seal, flush seal At least 11 years < 2,000 Emulsions Nonoverlay Montana At least 7 years (early data only) <2,000 Emulsions Overlays Minnesota Chip seals Table 51. Summary of expected service life for CIR mix projects.
Literature Review 87  projects and comparisons are different for each state, when the percent savings is calculated, cold recycled mixes show cost savings from a low of around 20% to more than 60%, depending on the type of wearing surface used on top of the cold recycled mixes. Environmental Benefits Some agencies are beginning to consider both economic and environmental costs and benefits during the design and bidding stages of construction projects. These advantages can help make cold recycled mixes more competitive. The environmental benefits include the following: ⢠Reuse of high-quality construction materials (Hoover 2014; Martin Asphalt 2016; Stahl 2019) ⢠Reduced greenhouse gases (GHG) (Cross et al. 2010; Busch 2012; Black 2013, Bugni 2015; Schwartz et al. 2017; Wielinski 2017; Carvajal 2018; Nair 2018; Wagner 2018; Harvey 2019; Schellhammer 2019; Younes 2019) ⢠Conservation of natural resources (Sauceda 2008; Cross et al. 2010; Wagner 2018; Schellhammer 2019; Stahl 2019) ⢠Reduced material added to landfills (Carvajal 2018; Wielinski 2017) Agencies, such as Caltrans, are starting to legislate the reduction of GHG. Life cycle assess- ments (LCA) are needed to quantify the current GHG emissions for traditional maintenance and rehabilitation choices so any benefits that can be gained from the use of alternative strategies can be back-calculated. Cold recycling mixes eliminate emissions from quarry operations that would have been needed to produce virgin aggregates, as well as the energy needed to heat the virgin aggregates during mix production. Using the existing in-place asphalt materials reduces Treatment Cost Percent Savings New York Mill and fill, 3 in.* $183,744 --- CIR, 3 in. $134,042 27% CIR, 3 in. with 20% corrective aggregate $149,107 19% Illinois 2-in. mill and overlay* $231,796 --- 3-in. CIR with chip seal (0.5 in.) $160,474 31% Montana 0.30-ft mill and fill* $92.09/ton --- 0.30-ft CIR with double chip seal $40.75/ton 56% 0.30-ft CIR with single chip seal $35.27/ton 62% 0.20-ft CIR with 0.10-ft overlay $48.64/ton 47% Mississippi Traditional construction* $323,000 --- Emulsion CIR (6 in.) $191,000 41% Minnesota Conventional asphalt pavement* $255,500 --- CIR with overlay $173,600 32% CIR with chip seal $81,100 68% *Considered the traditional rehabilitation option for a cost comparison. ---: no data available. Table 52. Cost savings gained by replacing traditional rehabilitation options with cold recycling mixtures.
88 Practice and Performance of Cold In-Place Recycling and Cold Central Plant Recycling the number of haul trucks needed, thereby reducing the use of, and emissions from, diesel fuel (Schwartz et al. 2017). Fang et al. (2016) noted that the production of conventional asphalt mix consumes about 680 MJ of energy while CCPR and CIR mix only consumes about two-thirds to one-fifth of that level of energy. More recent research indicates cold recycled processes use up to 80% less energy and produce 50% less GHG compared to the typical mill and fill option (Christianson and Mahoney 2019). Nair (2018) confirmed that up to 50% reduction in GHG emissions can be achieved by replacing conventional hot asphalt mixtures with cold recycled mixtures. Harvey (2019) provided basic LCA calculations for GHG emissions for CIR with a chip seal, CIR with an overlay, and the mill and fill option (Figure 41). The environmental benefits associated with cold recycled mixes are seen from the LCA calculations of GHG emissions. 6,600 14,000 46,000 480 2,800 11,000 3,500 4,500 2,100 0 10,000 20,000 30,000 40,000 50,000 60,000 CIR + Chip Seal CIR + Overlay Mill and Fill kg o f C O 2e fo r 1 ln -k m p er L ife C yc le S ta ge Material Transport Construction Source: Based on Harvey 2019. Note: CO2e = carbon dioxide equivalent. Figure 41. Example of greenhouse gas savings when using cold recycled mixes as a replacement for mill and fill.
