
APPENDIX D
SENSOR TECHNOLOGY FOR MONITORING POLYMER CURING
In the past, the progress of cure for thermosetting polymers has been estimated from the measurement of a single, easily monitored parameter, such as resin temperature. As discussed in Chapter 3, such an approach has deficiencies that limit the extent to which intelligent processing can be accomplished. A new sensor technology is needed that can measure several different microscopic properties and thus provide a direct, accurate measure of the extent of cure.
This appendix points out the limitations of using temperature sensing alone to estimate the degree of cure and provides background information on a new approach that exploits fiber optics to provide multiproperty sensing.
SINGLE PROPERTY SENSING
As noted in Chapter 3, intelligent processing of structural polymer materials has benefited from the use of thermocouples to sense material (resin) temperature during the cure process. Although the thermocouples can be used noninvasively by inserting them into excess material areas (i.e., areas that will be later removed when fitting the cured part to an aircraft structure), they still require insertion by an autoclave operator, which is an impediment to high-volume manufacturing applications. An alternative method is to insert a thermocouple into the tooling used to hold the material to obtain a specific geometry, but the thermocouple still requires frequent replacement due to corrosion and thermal cycle fatigue of the autoclave environment.
Thermocouples have a slower than desired response time. Also, since they are made of metal alloys, thermocouples are affected by electromagnetic radiation, such as interference arising from heating elements within an autoclave. This reduces the signal-to-noise ratio and hence the sensing resolution, repeatability, and sensitivity.
A more detailed characterization of thermocouples as a sensor technology is captured in Tables D-1 and D-2 below. These tables provide the basis for evaluating thermocouples as a sensor for the specific need and further help identify particular limitations that may be overcome by alternative sensing technologies. The discussion that follows addresses one such alternative technology and its inherent opportunities, some of which will require further research and development to realize.
MULTIPROPERTY SENSING
Optical fibers are an attractive alternative for sensing applications because of their high sensitivity, ability to resist adverse environments, and their immunity to noise from electrical or magnetic disturbances and ground loops. Fiberoptic sensors are classified in several different ways. One categorization differentiates between those that are intensity versus phase modulated. The intensity of the received light through the fiber is a function of the phenomenon being measured with intensity modulated
TABLE D-1 Key Descriptors for Temperature Sensing during Polymer Composite Curing
|
Descriptor |
Sensing Need: Resin Temperature |
Sensor Technology: Thermocouple |
|
Transduction |
Self-generating. Not adversely affected by electrical noise during cure. |
Self-generating. Affected by electrical and process noise. |
|
Transduction mode |
Direct. |
Direct. |
|
Measurement scale |
Macro (bulk). |
Macro (bulk). |
|
Implementation scale |
Single point / aggregation over area. |
Single point. |
|
Format |
Processing over time for velocity and acceleration. |
Single point over time, differentiated for velocity and acceleration. Multichannel or multiplexing not required. |
|
Mode |
Contact or noncontact. Remote. Driver is low cost. In situ. Driver is low cost. Noninvasive. Key constraint is product shape. Nondestructive. Must not compromise product integrity. |
Contact. Remote. In situ. Invasive. Nondestructive if suitably positioned in part or in material |
|
Reliability |
Multiple use, long lifetime: 100 to 1000 parts. |
Typically not reusable if used invasively. Standard grade can last for hundreds of process cycles. If structurally strengthened (at increased cost), could last for years. Calibratiblea. |
|
Acquisition |
No special requirements. |
Provide continuous information; no threshold, peak, or integration for data acquisition. |
|
Characteristics response time sensitivity |
1–5 s. 1ºF (at ambient) to 5ºF (at 900ºF). [0.6ºC (at ambient) to 2.8ºC (at 482ºC)]. |
5–25 s based on diameter of wire.b Typically 1ºF (ambient) to 5ºF (at 1500ºF to 2300ºF) [(Typically .6ºC (ambient) to 2.8ºC (at 815ºC to 1260ºC)] |
|
resolution |
1ºF (0.6ºC). |
Limited to approx. 1ºF (0.6ºC). |
|
range |
Ambient to 900ºF (482ºC). |
See Table D-2. |
|
linearity |
95% over above range. |
Nonlinearc |
|
limit of detection |
±5ºF (±2.8ºC). |
±1ºF (±0.6ºC) |
|
selectivity |
Constant, ambient to 900ºF (482ºC). |
N/A |
|
accuracy |
Within 5ºF, ambient to 900ºF (within 2.8ºC, ambient to 482ºC). |
Standard grade: 10% over 500ºF (278ºC) ranged |
|
Precision Constraints |
High repeatability desirable; not critical. |
95–100% repeatability over specified use range. |
|
packaging size |
Ideally approx. equal to diameter of reinforcing fiber. |
0.04–0.25 inch diameter. |
|
weight |
Not applicable. |
Not applicable. |
|
hermeticity isolation |
Not applicable. |
Not applicable. |
|
thermal |
Up to 900ºF (482ºC). |
Not applicable. |
|
electromagnetic |
Isolated for use in autoclave. |
Very important: affects accuracy and overall performance. |
|
mechanical |
Robust-daily handling. |
Possible problems in harsh conditions or production environment (e.g., excessive handling). |
|
Chemical |
Must withstand exposure to polymer resins. |
Shrouded for protection from environmental conditions. |
|
Optical |
Not applicable. |
Not applicable. |
|
Economic factors |
Acquisition cost < $1 amortized over lifetime of 100 to 1000 parts. Maintenance cost = $0.10 over sensor life. |
Little or no development required. Acquisition cost < $5, can be amortized over lifetime. Maintenance cost for resin temperature sensing = $0.10 over sensor life. |
sensors; for example, microbend sensors rely on this type of modulation.
Phase modulated sensors compare the phase of light in a sensing fiber to a reference fiber in an interferometer. This technique requires the use of monomode fibers. Phase modulation is much more accurate than intensity modulation and can be used over a wider dynamic range. However, phase modulated sensors are almost always more expensive since the electronic processing equipment must be very sophisticated.
Another classification that is used is interferometric or non-interferometric. This distinction depends on whether principles of interferometry are used in the sensing.1 The operating principle of interferometric sensors is straightforward. A single light wave is split into two parts that travel down different arms, one of the arms is subjected to the external parameter (e.g., strain or pressure) which needs to be measured, and the other arm is isolated from it. The two parts are then combined, causing interference fringes because of the phase difference between the two arms. Photodetectors convert the resulting light signal to an electrical signal for further processing.
There are three classical fiberoptic interferometers: Mach-Zehnder, Michelson, and Fabry-Perot.
-
The Mach-Zehnder interferometer relies on a change in the length of the sensing arm to cause a relative phase change between the two light waves at the point they are recombined.
-
The Michelson interferometer operates on the same principle except that the two arms are not combined at the end but have mirrored ends that reflect the light back. This eliminates the need for a second coupler (a fiber optic coupler is analogous to a beam splitter in traditional optics).
TABLE D-2 Temperature Ranges of Thermocouple Materials
|
Thermocouple Wire Alloy |
ANSI Type |
Temperature Rangea |
|
Copper-constantan |
T |
330 ºF to 660 ºF (116 ºC to 345 ºC) |
|
Iron-constantan |
J |
32 ºF to 1400 ºF (0 ºC to 760 ºC) |
|
Chromel-constantan |
E |
32 ºF to 1600 ºF (0 ºC to 870 ºC) |
|
Chromel-alumel |
K |
32 ºF to 2300 ºF (0 ºC to 1260 ºC) |
|
Nicrosil-nisil |
N |
32 ºF to 2300 ºF (0 ºC to 1260 ºC) |
|
a From Marlin Manufacturing, 1989; the upper temperature limit is not continuous duty. |
||
-
In the Fabry-Perot interferometer, two partial reflectors are placed in one optical path, and the difference between the two reflected signals is an indication of the strain between the two reflectors. The Fabry-Perot interferometer allows the tailoring of the gauge length (the length of the sensor across which the measurement is taken), and obtaining discrete strain information.
Fiberoptic sensors are often classified into two major classes: intrinsic and extrinsic. Extrinsic sensors depend on some effect that is external to the fiber. For example, it is possible to design sensor systems that monitor chemical changes using extrinsic approaches. For example, the common red-blue litmus test for acidity can be monitored photometrically using fiber optics, and this has given rise to a reliable class of low-cost pH meters. More
generally, specific chemical reactivity can be engineered into a supporting substrate which is then supported at the tip of a fiber device and illuminated by a fiberoptic transmitter and monitored photometrically by a fiberoptic receiver. In this way, a whole class of highly sensitive low-cost sensors can be constructed. While such approaches are interesting from an academic point of view and hold promise in the industrial and environmental field, they have certain drawbacks. Their use depends on being able to locate the appropriate chemical reactivity on the tip of the fiber. A key limitation derives from the fact that this type of extrinsic sensor is usually quite bulky and somewhat fragile.
An intrinsic optical sensor depends on some physical phenomenon that is inherent to the propagation of electromagnetic waves through a dense medium. Intrinsic optical sensors are of two types: physical and spectroscopic. The physical type involves the sensing of phenomena by measuring variations in the refractive index, fluorescence (Bur and Wang, 1991; and Bur et al., 1994) or equivalently the optical path length. As a case in point, it is well known that the application of pressure or stress to a material (such as residual stresses created during the processing of polymer composites) causes a small but measurable change in the refractive index; for example, the piezo-optic coefficient of glass fibers is ˜50×1011 Pa-1. If an optical fiber is imbedded in another medium, the optical inhomogeneity associated with a stress applied to the medium will cause increased scattering in the vicinity of the stress. This effect is used in a class of sensor where a light pulse from a laser is transmitted into the optical fiber and the backscatter from the optical inhomogeneity is measured as a function of the delay time relative to the incident pulse.
While there are many variations in the details for implementing this sort of device, it typically involves the construction of a miniaturized Fabry-Perot interferometer on the fiber end and the construction of a simple fringe counting system to monitor changes in the optical path length. If a reactive resin is allowed to fill the cavity, then the sensor effectively monitors the changes in refractive index as the material cures. Similarly, if the cavity is filled with a standard medium, the temperature (but not the viscosity) can be inferred from the fringe count as the sensor is heated. These types of sensors are commercially available and represent a useful addition to sensor technology. It should be noted that a measurement of the refractive index or flourescence of polymer material during processing essentially provides a phenomenological description of the curing process, and the actual chemical and physical states of the resin must be inferred from the measurement.
The other type of intrinsic fiberoptic sensor is the spectroscopic variety. This class of sensor is by far the more powerful but is the least well developed. In this case, the optical fiber is used only as a conduit to transport laser photons to the material being processed and the scattered light from the material to the analytical equipment. The sensor relies on the photon scattering phenomena to monitor materials behavior at the molecular level. Since this area is at an early stage of development, it is perhaps worthwhile reviewing briefly the underlying principles of operation based upon a system developed at Southwest Research Institute (Maguire and Talley, 1995). The material may be solid, liquid, or gas, and the fiber may be embedded within the body of the material or merely make optical contact with the surface. In either case, the material under investigation is bombarded with a flux of monochromatic coherent photons. These photons excite the various translational, rotational, and vibrational eigenstates of the material and undergo quasielastic and inelastic scattering over a range of momentum transfers.
It is worth pointing out distinctions between Fourier transform (FT) mid-infrared absorption, FT near-infrared absorption, and FT near-infrared Raman. As a practical matter, the mid-infrared absorption technique is not amenable to remote implementation because at present there are no optical fibers that have good transmission characteristics in this spectral region. The near-infrared absorption technique can be remotely implemented and commercial instrumentation is available.
A recent paper (George et al., 1991) reported a careful study of the curing of an epoxy resin using FT near-infrared absorption. The paper concluded that this was a useful technique but did have several drawbacks. The major limitation arises from
the fact that absorption arises from overtones and combinations of the fundamental stretching and bending frequencies of functional groups containing hydrogen atoms. This has the unfortunate consequence that the bands are somewhat weak, broad, and sometimes overlapping. From a spectroscopic point of view, this certainly complicates the analysis and is undesirable. A useful rule of thumb in applied spectroscopy is that the most information is obtainable from strong, sharp, well-resolved, nonoverlapping lines. As was illustrated in Chapter 3, this is precisely what is afforded by the Raman technique, where the experimentally observed full width at half height is typically on the order of 1 cm-1 as opposed to near infrared absorption values of order 200 cm-1.
The information content of the scattered photon flux is represented by a power spectrum, as detected by an intrinsic fiberoptic sensor. An incident photon with a particular wave vector, frequency, and polarization is incident upon a piece of material. The scattered photon also has a characteristic wave vector, frequency, and polarization and is detected at some angle to the incident radiation, as shown in Figure D-1. The modulus of the scattering vector is variable and is defined by the wavelength of the laser, the refractive index of the medium, and the scattering angle. It is an easy matter to change the scattering angle in a fiberoptic sensor so as to probe a range (spectrum) of wave numbers.
A few points are noteworthy about the scattered intensity. First, it is inversely proportional to the fourth power of the wavelength. Therefore, doubling the frequency from the visible region (˜500 nm) to the near infrared (˜1000 nm) will decrease the scattered intensity by a factor of about 16. Also, the scattered intensity falls off inversely as the square of the distance (R) between the scattering center and the detector. Because of the small diameter of the optical fiber, R can be kept small for typical fibers; this results in an order-of-magnitude increase of the solid angle. This enhancement of the optical efficiency for the fiberoptic approach more than offsets the losses associated with optical transmissions through the fiber.
All of the useful physiochemical sensor information is contained in the Fourier transform of the optical dielectric correlation function. For large frequency shifts (500 cm-1 to 4,000 cm-1) the fiberoptic spectra have been recorded for a number of materials including an epoxy and bismaleimide-isocyanate resin for structural aircraft applications. Here
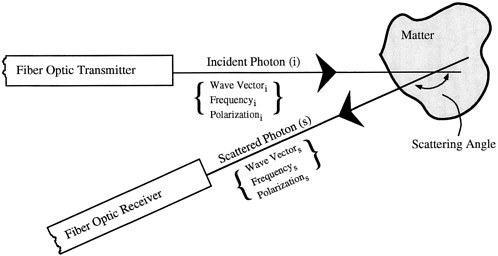
FIGURE D-1 Fiberoptic photon scattering detection.
TABLE D-3 Key Descriptors for Multi-Property Sensing during Polymer Composite Curing
|
Descriptor |
Sensing Need: Multi-Property Sensing |
Sensor Technology: Laser/Fiberoptic Technology |
|
Transduction |
Self-generating: -high information content -remote multiplex analysis -not affected by electrical noise -multiproperty sensing capability. |
Self-generating: -near-term research required -near-term research required -not applicable -near-term research required. |
|
Transduction mode |
Direct. |
Direct (visible & infrared analysis). |
|
Measurement scale |
Macro (bulk) through nano. |
Macro (bulk) through nano |
|
Implementation scale |
Single point/sphere of ~100 µm to full aggregation over area of part. |
Single point, sphere of ~100 µm. Near term research required for area information. |
|
Format |
Processing over time for velocity and acceleration. |
Single point over time, differentiated for velocity and acceleration. Autocorrelation near term research required. |
|
Mode |
Contact or noncontact. Remote. In situ. Noninvasive. Nondestructive. Must not compromise product integrity. |
Contact or noncontact. Remote. In situ. Noninvasive. Nondestructive. |
|
Reliability |
Multiple use, long lifetime; i.e., 100 to 1,000 parts. |
Typically reusable, Comparable to thermocouple reliability. See Table 3-1. |
|
Acquisition |
No special requirements. |
Provide continuous information. Near-term research required for pulsed information. No threshold, peak, or integration for data acquisition. Mode dependent. Total intensity determined using: -photodiode Brillouin -Fabry-Perot Raman -monochromator -Michelson interferometer. |
|
|
Temperature |
Temperature |
|
Response time |
1–5 s. |
1–500 s. |
|
Sensitivity |
0.6ºC (1ºF) (at ambient)-2.8ºC (5ºF) (at 900ºF). |
0.06ºC [over -273ºC (-459ºF) to 2500ºC (4532ºF)]. |
|
Resolution range |
100. 16ºC–482ºC (60ºF–900ºF) |
10-1. -273ºC to 2500ºC. |
|
Linearity |
Not applicable. |
Not applicable. |
|
Limit of detection |
Not applicable. |
~1% of actual temperature. |
|
Selectivity |
Constant, (over -273ºC to 2500ºC). |
Constant, from -273ºC to 2500ºC. |
|
Accuracy |
Within 2.8ºC (over range from ambient to 482ºC). |
~1% of actual temperature. |
|
Precision |
High repeatability desirable but not critical. |
~95% repeatability over specified range of use. |
|
|
Chemical Analysis |
Chemical Analysis Key research need: Measure molar concentrations of oligomers using depolarized Raman scattering. |
|
Descriptor |
Sensing Need: Multi-Property Sensing |
Sensor Technology: Laser/Fiberoptic Technology |
|
|
Viscosity |
Viscosity Key research need: Determine reorientation/relaxation using depolarized Raman scattering. |
|
|
Longitudinal Kinematic Viscosity |
Longitudinal Kinematic Viscosity Key research need: Measure Rayleigh/Brillouin scattering using Krypton laser. |
|
|
Heat Capacity Ratio |
Heat Capacity Ratio Key research need: Determine with Nd: YAG laser using Rayleigh/Brillouin scattering. |
|
|
Sound Attenuation Factor |
Sound Attenuation Factor Key research need: Measure using Brillouin scattering via Fabry Perot interferometer/spectrum analyzer. |
|
|
Adiabatic Sound Speed |
Adiabatic Sound Speed Key research need: Determine using Brillouin scattering via Fabry Perot interferometer/spectrum analyzer. |
|
|
Thermal Diffusion |
Thermal Diffusion Key research need: Determine using Rayleigh scattering via optical homodyne/optical heterodyne. |
|
|
Isothermal Compressibility |
Isothermal Compressibility Key research need: Determine using Rayleigh scattering. |
|
CONSTRAINTS |
|
|
|
Packaging size |
Ideally approx. equal to diameter of reinforcing fiber. |
0.10–0.25 mm diameter. |
|
Weight |
Preferably no heavier than one reinforcing fiber. |
No heavier than one reinforcing fiber. |
|
Hermeticity |
Varies. |
Near term research need: Improve sensor packaging. |
|
Isolation |
Up to 482ºC (900ºF). |
Up to 2500ºC (4532ºF). |
|
Thermal |
Isolated for use in autoclave. |
No need for shielding. |
|
Electromagnetic Mechanical |
Robust: daily handling. |
Possible problems in harsh conditions or production environment (excessive handling). |
|
|
Must withstand exposure to polymer resins. |
Near term research need: Improve sensor packaging. |
|
Chemical |
|
|
|
Optical |
|
Requires quality optics/micro-optics. |
|
ECONOMIC |
Acquisition cost < $1, to be amortized over 100 to 1,000 parts. |
Acquisition cost is unknown. |
|
|
Maintenance cost = $0.10 over sensor life. |
Maintenance cost is unknown. Substantial research and development required. |
the various absorption frequencies are clearly evident and allow a fairly complete analysis of the material.
Far more information is contained in these signals than has been extracted to date. For example, deconvolution of the Raman spectra will yield line widths from which the viscosity of the curing resin may be deduced. Similarly, the Rayleigh-Brillouin spectrum contains information on the adiabatic sound speed, acoustic attenuation coefficient, thermal diffusion, and a number of other parameters; but here again, no work has been done to extract this information for composite materials. It should be noted that our ability to detect spectra of this type is of relatively recent origin. Typically, observation of the Rayleigh-Brillouin and Raman scattering from materials was restricted to transparent materials of fairly high optical purity. This restricted the methodology to research studies in the laboratory. Despite the wide recognition that the application of such powerful approaches would provide a breakthrough in "sensor" technology, the promise was not realized for two reasons. First, real materials have fluorescent impurities that can completely mask the Raman signal. The standard way to overcome fluorescence is to go to longer excitation wavelength. However, in the red and near infrared, detector efficiency falls off markedly. It was not until the development of the indium-gallium-arsenide-strained superlattice detectors that the sensitivity in this spectral region increased to the point where inelastically scattered (Raman) near-infrared photons could be detected.
The near-term research opportunity is to use photon scattering sensor technology to increase the range of properties which laser-fiberoptics can accommodate for multiproperty sensing, such as resin temperature, viscosity, and degree of cure. Given the potential of laser-fiberoptic sensing, the framework tool developed in Chapter 2 has been used to develop an evaluation of future research opportunities. The results are summarized in Table D-3.
REFERENCES
Bur, A.J., and F.W. Wang. 1991. Fluorescence and optical monitoring of polymer processing. Pp. 38–41 in Intelligent Processing of Materials. Yolken, H. T., J.P. Gudas. ed. NISTIR 4693. Gaithersburg, Maryland: U.S. Department of Commerce, National Institute of Standards and Technology.
Bur, A.J., F.W. Wang, C.L. Thomas, and J.L. Rose. 1994. In-line optical monitoring of polymer injection molding. Polymer Engineering and Science 34(Apr):135–142.
George, G.A., P. Cole-Clarke, N. St. John, and G. Friend. 1991. Real-time monitoring of the cure reaction of TGDDM/DDS epoxy resin using fiber optic FT-IR . Journal of Applied Polymer Science 42(3):643–657.
Maguire, J.F., and P.L. Talley. 1995. Remote Raman spectroscopy as a sensor technology in composite materials processing. Journal of Advanced Materials 26(2):1–14.
Marlin Manufacturing. 1989. Temperature instrumentation for research and industry. Marlin Catalog Number 109. Marlin Texas: Marlin Manufacturing.


