
4
RESEARCH AT LAND GRANT COLLEGES OF AGRICULTURE: The State Arm of the U.S. Public Agricultural Research System
This chapter introduces the second of the land grant colleges' functions, that of agricultural research. The colleges are the state-based component of the public agricultural research system; the federal component includes the intramural science agencies of the U.S. Department of Agriculture (USDA). The chapter compares USDA funding for intramural and extramural research and compares USDA funding for university-based agricultural research to funding for university research by other federal agencies. The research is described generally, in terms of level of expenditures and area of emphasis. The description of research expenditures is drawn from the USDA's Current Research Information System (CRIS), an inventory of agricultural research based on reports filed by research scientists and administrators.
-
The public agricultural research system may be unique among U.S. science institutions. Responsibility for publicly funded agricultural research is divided between scientists employed by USDA and those employed by the state agricultural experiment stations and other units of universities. Agencies of USDA both conduct research—in fact they receive the lion's share of public agricultural research funds—and administer research and extension grants.
-
USDA's Agricultural Research Service (ARS), the National Agricultural Library (NAL), the research units of the Forest Service (FS), and the Economic Research Service (ERS) compose the intramural research agencies. The Cooperative State Research, Education, and Extension Service (CSREES) administers the partnership grant programs that fund extramural research, cooperative extension, instructional support, and training.1
-
As Tables 4-1 and 4-2 indicate, in 1993 30 percent of USDA's research appropriations supported extramural research—that is, research supported by but not conducted by USDA, most of which occurs at the state agricultural experiment stations (SAESs) associated with the 1862 land grant colleges of agriculture or at forestry and veterinary medicine schools. This compares with 27 percent in 1980 and 29 percent in 1990. It would seem that the importance of extramural research, in terms of all federally funded agricultural research, is increasing, if only slightly. As noted in Chapter 6, an expanding source of federal funds for extramural agricultural research has been the competitive grants program known as the National Research Initiative (NRI). The NRI, however, is open to scientists both inside and outside the SAES system; thus the full amount of this increase has not gone to USDA's traditional extramural partners at the land grant colleges of agriculture.
-
A comparison of ARS and CSRS appropriations shows that between 1980 and 1995 the budget for intramural research grew at a slightly slower pace than that for extramural research. CSRS appropriations grew 108 percent, an annual average rate of 7.2 percent in nominal dollars. ARS appropriations grew 98 percent, or 6.5 percent per year (Table 4-1). However, in both cases, real budget increases—that is, accounting for the effects of inflation—were much smaller. The real value of total USDA research agency appropriations increased less than 1 percent annually (average) between 1980 and 1990 and only 2 percent annually (average) between 1990 and 1993 (Table 4-2).
TABLE 4-1
Federal Appropriations (current dollars in millions) for USDA Research Agencies, 1980–1995
|
|
Intramural |
|
|
|
|
|
|
Year |
ARS |
FS |
ERS |
NAL |
CSRSa |
Total |
|
1980 |
358.0 |
95.9 |
35.2 |
7.3 |
185.9 |
682.3 |
|
1981 |
404.1 |
108.4 |
39.5 |
8.2 |
200.7 |
760.9 |
|
1982 |
423.2 |
112.1 |
39.4 |
8.2 |
220.6 |
803.5 |
|
1983 |
451.9 |
107.7 |
38.8 |
9.1 |
232.3 |
839.8 |
|
1984 |
471.1 |
109.4 |
44.3 |
10.4 |
237.7 |
872.9 |
|
1985 |
491.4 |
113.8 |
46.6 |
11.5 |
284.4 |
947.7 |
|
1986 |
483.2 |
113.6 |
44.1 |
10.8 |
269.6 |
921.3 |
|
1987 |
511.4 |
126.7 |
44.9 |
11.1 |
293.7 |
987.8 |
|
1988 |
544.1 |
132.5 |
48.3 |
12.2 |
303.1 |
1,040.2 |
|
1989 |
569.4 |
138.3 |
49.6 |
14.3 |
290.8 |
1,062.4 |
|
1990 |
593.3 |
150.9 |
51.0 |
14.7 |
326.6 |
1,136.5 |
|
1991 |
631.0 |
167.6 |
54.4 |
16.8 |
373.3 |
1,243.1 |
|
1992 |
668.4 |
180.5 |
58.7 |
17.8 |
415.5 |
1,340.9 |
|
1993 |
668.0 |
182.1 |
58.9 |
17.7 |
401.7 |
1,328.5 |
|
1994 |
691.6 |
192.5 |
55.3 |
18.3 |
423.1 |
1,380.7 |
|
1995b |
708.6 |
204.0 |
53.7 |
19.7 |
386.9 |
1,372.9 |
|
Abbreviations: ARS, Agricultural Research Service; FS, Forest Service; ERS, Economic Research Service; NAL, National Agricultural Library; CSRS, Cooperative State Research Service. a CSRS appropriations are for extramural research. b President's budget request. SOURCE: Adapted from National Research Council. 1994. Investing in the National Research Initiative. Washington, D.C.: National Academy Press. |
||||||
TABLE 4-2
Federal Appropriations (real dollars in millions) for USDA Research Agencies, 1980–1993 (1987 = 100)
|
|
Intramural |
|||||
|
Year |
ARS |
FS |
ERS |
NAL |
CSRSa |
Total |
|
1980 |
497.2 |
133.2 |
48.9 |
10.1 |
258.2 |
947.6 |
|
1981 |
513.5 |
137.7 |
50.2 |
10.4 |
255.0 |
966.8 |
|
1982 |
503.8 |
133.5 |
46.9 |
9.8 |
262.6 |
956.5 |
|
1983 |
515.3 |
122.8 |
44.2 |
10.4 |
264.9 |
957.6 |
|
1984 |
515.4 |
119.7 |
48.5 |
11.4 |
260.1 |
955.0 |
|
1985 |
517.3 |
119.8 |
49.1 |
12.1 |
299.4 |
997.6 |
|
1986 |
496.1 |
116.6 |
45.3 |
11.1 |
276.8 |
945.9 |
|
1987 |
511.4 |
126.7 |
44.9 |
11.1 |
293.7 |
987.8 |
|
1988 |
525.2 |
127.9 |
46.6 |
11.8 |
292.6 |
1,004.1 |
|
1989 |
528.2 |
128.3 |
46.0 |
13.3 |
269.8 |
985.5 |
|
1990 |
528.3 |
134.4 |
45.4 |
13.1 |
290.8 |
1,012.0 |
|
1991 |
543.0 |
144.2 |
46.8 |
14.5 |
321.3 |
1,069.8 |
|
1992 |
558.4 |
150.8 |
49.0 |
14.9 |
347.1 |
1,120.2 |
|
1993 |
541.8 |
147.7 |
47.8 |
14.4 |
325.8 |
1,077.5 |
|
NOTE: The deflating index used is the implicit price deflator for total government purchases of goods and services. Abbreviations: ARS, Agricultural Research Service; FS, Forest Service; ERS, Economic Research Service; NAL, National Agricultural Library; CSRS, Cooperative State Research Service. a CSRS appropriations are for extramural research. |
||||||
Colleges of agriculture are the state-based component of a federal-state partnership in agricultural research.
-
The SAESs at land grant colleges of agriculture have traditionally been the state-based partners in the public agricultural research system in the United States. As such, they have been the principal recipients of USDA appropriations for extramural research. Table 4-3 shows that in 1981 USDA appropriations earmarked for research at universities and colleges were 5.5 percent of all such federal agency obligations. By 1991 these USDA obligations had fallen to 4.7 percent.
-
Agricultural research at universities accounts for only a small percentage of all federally funded university research; however, that share is still larger relative to the percent of all students enrolled at colleges of agriculture. This may be an indication that colleges of agriculture are relatively research intensive in relation to other university colleges and departments.
-
To expand or even maintain their research programs, agriculture colleges have had to seek out other funding sources. That some have done so, reducing over time USDA's traditional role as the federal partner in agricultural research, is the subject of Chapter 6.
TABLE 4-3
Federal Agency Appropriations (millions of dollars) for Research and Development at Universities and Colleges, 1966–1991
|
Agency |
1966 |
1971 |
1976 |
1981 |
1986 |
1991 |
|
Agency for International Development |
0 |
17 |
11 |
31 |
44 |
32 |
|
Department of Agriculture |
63 |
75 |
124 |
241 |
290 |
409 |
|
Department of Commerce |
2 |
7 |
29 |
51 |
68 |
62 |
|
Department of Defense |
278 |
249 |
212 |
700 |
1,055 |
0 |
|
Department of Education |
0 |
0 |
0 |
56 |
72 |
92 |
|
Department of Energy |
83 |
96 |
138 |
282 |
347 |
605 |
|
Department of Health and Human Services |
507 |
696 |
1,296 |
2,113 |
3,212 |
5,301 |
|
Department of Housing and Urban Development |
0 |
1 |
1 |
3 |
0 |
0 |
|
Department of the Interior |
19 |
21 |
26 |
30 |
41 |
68 |
|
Department of Labor |
0 |
3 |
3 |
13 |
4 |
6 |
|
Department of Transportation |
0 |
8 |
15 |
28 |
13 |
35 |
|
Environmental Protection Agency |
0 |
17 |
29 |
64 |
68 |
104 |
|
National Aeronautics and Space Administration |
107 |
129 |
107 |
174 |
254 |
534 |
|
National Science Foundation |
192 |
217 |
437 |
617 |
984 |
1,439 |
|
Nuclear Regulatory Commission |
0 |
0 |
3 |
7 |
4 |
5 |
|
Office of Economic Opportunity |
0 |
16 |
0 |
0 |
0 |
0 |
|
Total |
1,252 |
1,552 |
2,431 |
4,411 |
6,456 |
8,691 |
|
SOURCE: Data provided by the National Science Foundation. |
||||||
COLLEGE EXPENDITURES FOR RESEARCH
-
Each year SAESs and other institutions receiving funds from grant programs administered by USDA must report their total research expenditures, including those based on non-USDA sources of support, to USDA. The reports, which are based on research project descriptions filed by individual research scientists, are entered into a computerized data base known as the Current Research Information System (CRIS). CRIS is maintained and updated by CSREES (formerly CSRS) and can be used to analyze trends in agricultural research expenditures, including the size of expenditures over time and the distribution of expenditures among areas of research investigation, academic discipline, and individual colleges (or experiment stations). CRIS can also be used to analyze sources of support for agricultural research, which is the topic of Chapter 6.
-
CRIS is most thorough for SAESs at 1862 and 1890 colleges of agriculture because institutions in these classifications must report research activities as expenditures to USDA. However, CRIS also includes data on research expenditures by a significant number of the forestry schools and veterinary colleges. Forestry schools that receive funds through the McIntire-Stennis Forestry Research Act of 1962, for example, must report their total research expenditures to USDA, which incorporates the data in CRIS.
-
CRIS data cover approximately 20 years, beginning with the early 1970s. Table 4-4 shows that reported research expenditures have increased (without adjusting for inflation) fivefold for 1862s, approximately threefold for 1890s, and more than tenfold for forestry schools since the early 1970s. Total expenditures did not quite double between 1982 and 1992; thus research activities increased more rapidly (at least in nominal terms) prior to the 1980s. The numbers in Table 4-4 indicate clearly that 1862 colleges account for the vast majority of research in agriculture, forestry, and animal health.
TABLE 4-4
Total Research Expenditures (millions of dollars), by Institution Classification, 1972–1992
What types of research do scientists at colleges of agriculture do?
- The Experiment Station Committee on Organization and Policy (ESCOP), the system-wide research planning committee, designates six main areas of agricultural research:
-
environment and natural resources;
-
nutrition, food safety, and health;
-
processes and products;
-
economic and social issues;
-
animal systems; and
-
plant systems.
One way that research projects reported to CRIS are categorized is according to these six ESCOP program areas (see box copy, p. 63).
-
Approximately 62 percent of the system's research expenditures are allocated to the plant (35 percent) and animal (27 percent) systems research program areas (Table 4-5). The broad goals of the majority of the research in these program areas are to better protect crops and livestock from insects, disease, and other hazards and to maintain adequate food production at decreasing real production costs (U.S. Department of Agriculture, 1993a). Thus a majority of the colleges' research is aimed at improving the output and productivity of crop and animal production on farms.
-
Another 18 percent of the system's research expenditures are allocated to research projects in the environment and natural resources category. A significant portion of this research is aimed at improving management of forest resources and protecting forests from insects, disease, and other hazards. Thus much of this research has a strong parallel to that conducted in the animal and plant systems areas (U.S. Department of Agriculture, 1993a).
-
The benefits of animal and plant systems research can accrue to consumers through lower food prices and healthier food; for example, animal health research can result in lower risks to humans from animal-transmitted disease. However, CRIS data indicate that only 3 percent of the system's research directly addresses consumer health and safety through the study of nutrition or food safety and quality. A closer examination of specific research efforts is needed to assess how plant and animal systems research affects the nutritional quality or safety of food.
|
ESCOP Research Program Areas The strategic planning process for the state agricultural experiment stations (SAESs) is conducted by the Experiment Station Committee on Organization and Policy (ESCOP)—the executive body of the Experiment Station Section of the National Association of State Universities and Land Grant Colleges. The ESCOP Strategic Planning Subcommittee is responsible for preparing the strategic agenda for the SAES system, with annual updates and a major revision every 4 years. The subcommittee solicits input from producers, consumer groups, and the science community through conferences and individual surveys. The process also brings the state and federal agencies into a "coordinated frame of reference" in terms of communicating the research priorities for U.S. agricultural science to key policy and decision makers. The research initiatives for 1994 are listed here, grouped into six categories:
SOURCE: Experiment Station Committee on Organization and Policy. 1994. Opportunities to Meet Changing Needs: Research on Food, Agriculture, and Natural Resources. Washington, D.C.: U.S. Department of Agriculture. |
TABLE 4-5
Research Expenditures (thousands of dollars) by Institution Classification and ESCOP Program Area, 1992
-
Similarly, only 10 percent of the system's research directly addresses social science concerns such as farm and rural income and community development. Plant, animal, and forestry research can, of course, affect rural economies and communities through its effects on farm and forest productivity and farm sector structure, but ESCOP classifications do not make these linkages explicit.
-
Figure 4-1 shows that there has been little shift in the allocation of research expenditures since 1972. A more precise assessment of specific research programs and projects would be required, however, to determine whether research is in fact shifting toward areas that currently concern consumer, environmental, sustainable agriculture, and rural development groups. Decreasing the use of chemicals in agricultural production, enhancing sustainable agriculture systems, reconciling diet and human health, and enhancing small-farm and rural community viability typify some concerns.
-
At the 1890 colleges a larger percentage of research is devoted to food, nutrition, and social science issues—29 percent at 1890s versus 14 percent at 1862s. It may be that because of their history and location—often in primarily rural, poor African American communities—1890s view their service mission as one that is more specifically aimed at the concerns of rural households, limited-resource farmers, and economically disadvantaged populations (Table 4-5).
TABLE 4-6
Scientist Years (full-time equivalents) by Institution Classification and ESCOP Program Area, 1992
|
|
ESCOP Program Area |
|||
|
Institution Classification |
Processing for Added Value |
Social Sciences Issues |
Unassigned |
Total Research Expenditures |
|
1862 SAESs |
$93,822 (5.29) |
$177,633 (10.02) |
$30,421 (1.72) |
$1,772,467 |
|
1890 Colleges and Universities |
968 (3.23) |
5,562 (18.56) |
203 (0.68) |
29,966 |
|
Forestry Schools |
11,221 (17.44) |
5,120 (7.96) |
1,454 (2.26) |
64,338 |
|
Schools of Veterinary Medicine |
34 (0.03) |
2,123 (1.70) |
420 (0.34) |
124,961 |
|
Total |
$106,046 (5.32) |
$190,439 (9.56) |
$32,498 (1.63) |
$1,991,733 |
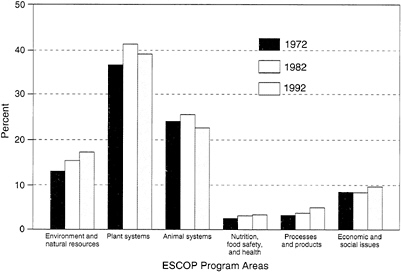
FIGURE 4-1 Since 1972 there has been little change in the relative distribution (percent) of research expenditures to ESCOP program areas at 1862 institutions. Between 1982 and 1992 there were small shifts away from animal and plant sciences and toward research in natural resources, social sciences, processing and value added, and food and nutrition areas.
|
|
ESCOP Program Area |
|||
|
Institution Classification |
Processing for Added Value |
Social Sciences Issues |
Unassigned |
Total Scientist Years |
|
1862 SAESs |
332 (5.16) |
826 (12.84) |
112 (1.74) |
6,432 |
|
1890 Colleges and Universities |
8 (4.17) |
33 (19.41) |
1 (0.59) |
170 |
|
Forestry Schools |
48 (17.39) |
26 (9.42) |
4 (1.45) |
276 |
|
Schools of Veterinary Medicine |
0 |
9 (1.94) |
1 (0.22) |
465 |
|
Total |
388 (5.28) |
893 (12.16) |
118 (1.61) |
7,342 |
-
Like research monies, the time of research scientists at colleges of agriculture is allocated predominately toward research initiatives in plant, animal, and natural resource systems. In 1992, 229 of the 6,432 ''scientist years''2 reported by SAESs at 1862 colleges were devoted to studying nutrition, health, or food safety (Table 4-6).
-
Not surprising is the fact that distribution of research scientists' time corresponds to the distribution of doctorate students in the various specializations noted in Chapter 3. In 1992, 1,002 of 1,860 doctorate students (54 percent) obtained degrees in animal and plant sciences and "related" sciences (see Table 3-6). In that same year, 59 percent of research scientist years were devoted to investigation of plant and animal systems (Table 4-6). Note also that in 1992 only 6,145 of 19,426 bachelor's degrees (32 percent) were awarded in fields of plant, animal, and related sciences (see Table 3-6).
ISSUES FOR DISCUSSION
-
The colleges of agriculture compose one component of the U.S. public agricultural research system, which also includes agencies of USDA. How does the colleges' role differ from or complement that of the federal agencies? Should extramural (university-based) research be a larger component of the system than it now is?
-
USDA appropriations for agricultural research now represent a small (and declining) fraction of total federal appropriations for research and development at U.S. colleges and universities (though economic studies show very high rates of return to public investments in agricultural research). What criteria could be used to determine whether this share is commensurate with the importance of the agricultural complex to the U.S. economy and social welfare?
-
Since 1975 research information data show relatively little change in the allocation of college research dollars to research program areas. Should more change have occurred, and does the agricultural research inventory system that is currently used mask real change in research emphases or goals that may have occurred?
SUGGESTED READINGS
Alston, J. M., G. W. Norton, and P. G. Pardey. Science Under Scarcity: Principles and Practice for Agricultural Research Evaluation and Priority Setting. Ithaca, NY: Cornell University Press, 1995.
Congress of the United States, Office of Technology Assessment. A New Technological Era for American Agriculture. Washington, D.C.: U.S. Government Printing Office, 1992.
Congress of the United States, Office of Technology Assessment. An Assessment of the United States Food and Agricultural Research System . Washington, D.C.: U.S. Government Printing Office, 1981.
Congress of the United States, Office of Technology Assessment. Federally Funded Research: Decisions for a Decade. Washington, D.C.: U.S. Government Printing Office, May 1991.
Huffman, Wallace E., and Robert E. Evenson. Science for Agriculture: A Long-Term Perspective. Ames: Iowa State University Press, 1993.
Miller, Raymond J., and Clare I. Harris. Trends in Agricultural Research: Thoughts for Discussion, Cooperative State Research Service. Washington, D.C.: U.S. Department of Agriculture, 1994.
U.S. Department of Agriculture, Economic Research Service. Chronological Landmarks in American Agriculture, AIB No. 425. Washington, D.C.: U.S. Department of Agriculture, 1990.


