
This paper was presented at a colloquium entitled “Earthquake Prediction: The Scientific Challenge,” organized by Leon Knopoff (Chair), Keiiti Aki, Clarence R.Allen, James R.Rice, and Lynn R.Sykes, held February 10 and 11, 1995, at the National Academy of Sciences in Irvine, CA.
What electrical measurements can say about changes in fault systems
THEODORE R.MADDENAND RANDALL L.MACKIE
Department of Earth, Atmospheric, and Planetary Sciences, Massachusetts Institute of Technology, Cambridge, MA 02139
ABSTRACT Earthquake zones in the upper crust are usually more conductive than the surrounding rocks, and electrical geophysical measurements can be used to map these zones. Magnetotelluric (MT) measurements across fault zones that are parallel to the coast and not too far away can also give some important information about the lower crustal zone. This is because the long-period electric currents coming from the ocean gradually leak into the mantle, but the lower crust is usually very resistive and very little leakage takes place. If a lower crustal zone is less resistive it will be a leakage zone, and this can be seen because the MT phase will change as the ocean currents leave the upper crust. The San Andreas Fault is parallel to the ocean boundary and close enough to have a lot of extra ocean currents crossing the zone. The Loma Prieta zone, after the earthquake, showed a lot of ocean electric current leakage, suggesting that the lower crust under the fault zone was much more conductive than normal. It is hard to believe that water, which is responsible for the conductivity, had time to get into the lower crustal zone, so it was probably always there, but not well connected. If this is true, then the poorly connected water would be at a pressure close to the rock pressure, and it may play a role in modifying the fluid pressure in the upper crust fault zone. We also have telluric measurements across the San Andreas Fault near Palmdale from 1979 to 1990, and beginning in 1985 we saw changes in the telluric signals on the fault zone and east of the fault zone compared with the signals west of the fault zone. These measurements were probably seeing a better connection of the lower crust fluids taking place, and this may result in a fluid flow from the lower crust to the upper crust. This could be a factor in changing the strength of the upper crust fault zone.
The San Andreas Fault (SAF) is weak in an absolute sense, as evidenced by the lack of a pronounced heat flow peak near the fault. This may imply that the SAF moves under shear stresses much smaller than laboratory friction values would seem to indicate (1). The SAF is also weak in a relative sense. That is, the adjacent crust is mechanically stronger than the fault zone, as evidenced by the large angles the principal stress directions make relative to the trace of the SAF (2). This means that the adjacent crust supports much more shear stress than does the SAF (the maximum shear stress in the adjacent crust is not oriented parallel to the fault).
One possible explanation for the observed fault weakness is that the fault zone is made up of inherently weak materials. Another possible explanation (3, 4) is the existence of elevated pore pressures in a permeable slip zone having the usual laboratory frictional values (Byerlee’s law with frictional co-efficient 0.6−0.9). Here, we define the slip zone to be the very narrow region that actually moves during an earthquake, whereas the fault zone is wider and is due to the slip zone changing position over geologic time. Rice (4) showed that pore pressure distributions that are high within the slip zone and low within the rest of the fault zone and the adjacent crust would be consistent with both the relative and absolute weakness of the SAF. His argument was based on the fact that the stress state within the slip zone would not have to be the same as that within the rest of the fault zone and the adjacent crust, although the stresses on surfaces parallel to the fault must be continuous. In the Rice (4) model, high pore pressures are maintained by continuous injection of fluids into the fault zone from deeper in the lower crust or the mantle. Such a scenario would give the lower crust a special role in the earthquake cycle, since pore pressures there are probably already close to the overburden pressure. In the Byerlee (3) model, it was assumed that water comes from the surrounding country rock and is maintained at high fluid pressures due to compaction within the fault.
There is considerable evidence from petrologic and geochemical studies that fault zones typically see large infiltrations of fluids (5, 6). The existence of high fluid pressures within the SAF has been suggested as the cause for creep and frequent seismicity (7, 8). Whether the fluids that infiltrate the SAF fault zone come from deeper within the crust is not definitively known, although the carbon isotopes present in spring out-flows along the SAF in the coastal ranges are compatible with mantle origin (8). Indeed, there is considerable debate concerning the existence of free water within the lower crust (9, 10). The presence of free water in the lower crust would explain many of the seismic (11) and electrical (12) anomalies associated with the lower crust, but there are attendant rheologic and petrologic problems with maintaining water in the lower crust (13, 14). However, it is possible that a small amount of water may be present in the lower crust in equilibrium with a hydrated mineralogy that is not present at the earth’s surface (15). Even in the ductile lower crust, water may exist in connected pathways if the wetting angles are low enough (16) or if fluid pressures can be maintained at close to the lithostatic pressure (17).
Magnetotelluric (MT) and telluric measurements on the SAF have given us some interesting information about the lower crustal section of this fault zone. The active slip zones are usually very thin, and their electrical conductivity is hard to measure from the surface unless the surface rocks are very resistive. Unfortunately, fault zones are usually conductive and much wider than the active slip zone, so it is hard to measure the electrical conductivity of the active slip zone. However, the lower crust is usually very resistive, and there is a possibility of
The publication costs of this article were defrayed in part by page charge payment. This article must therefore be hereby marked “advertisement” in accordance with 18 U.S.C. §1734 solely to indicate this fact.
Abbreviations: SAF, San Andreas Fault; MT, magnetotelluric; TM, transverse magnetic.
detecting thin conductive zones in the lower crust. Normally, it is difficult to see such zones in the lower crust because of the higher conductivity of the upper crust. However, near the coast there is a lot of extra electric current coming from the ocean. These currents gradually leak into the mantle, and they will use conductive zones in the lower crust to do so. One can detect this leakage because the ocean current has a different phase than the normal continental currents, and the leakage of the ocean current will change the phase of the currents left in the upper crust. Fig. 1 shows an array of MT stations across California from Parkfield to the Basin and Range. Fig. 2 shows the MT phase as a function of period for the transverse magnetic (TM) mode (electrical field perpendicular to the coast line) across this array. One can see a big change of phase between Parkfield and the Great Valley and between the Great Valley and the Sierra Nevada, which identified two lower crustal leakage zones (18). The Parkfield measurements were on the northeast side of the SAF, so the leakage was not involved with the fault zone.
Loma Prieta
After the Loma Prieta earthquake we made MT measurements (19) across the fault zone in this area as shown in Fig. 1. In Fig. 3 we show the TM phase for two stations (2 and 1) which have the earthquake zone between them. To model the phase difference at the longest periods, we had to put a lower crustal leakage zone underneath the fault zone. We cannot tell
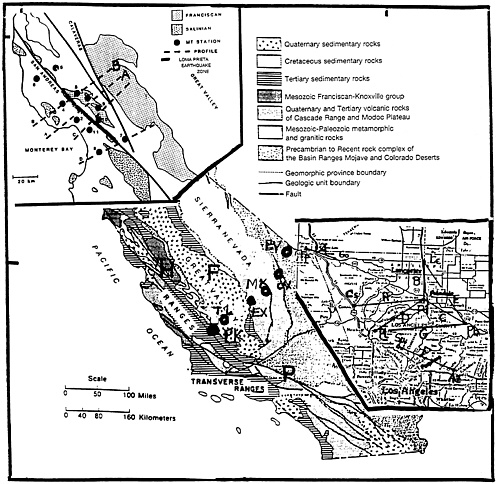
FIG. 1. Map showing the major tectonic provinces of California and the locations of several MT stations. H, Hollister; F, Fresno; P, Palmdale; PK, Parkfield; TL, Tulace Lake; EX, Exeter; MK, Mineral King; OV, Owens Valley; EV, Eureka Valley. (Upper Inset) Data profiles collected around the Loma Prieta Fault zone. (Lower Inset) Palmdale telluric array. Source: ref. 21.
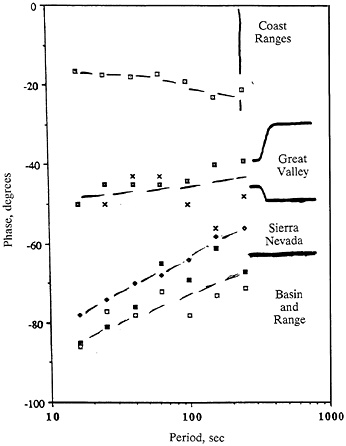
FIG. 2. The TM mode impedance phase, going west to east across central California. The locations of these stations are shown in Fig. 1. ⊡, Parkfield; ×, Tulace Lake; ◘, Exeter; ◆, Mineral King; ■, Owens Valley; □, Eureka Valley.
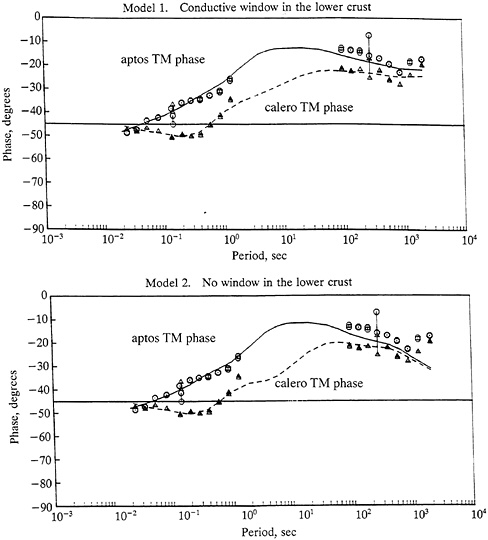
FIG. 3. The TM mode impedance phase from our data (symbols) and from the model (solid and broken lines). This is profile A in Fig. 1 Upper Inset. (Upper) The fit for our preferred model, which has a conductive lower crustal fault zone. The data from 1 to 100 sec were excluded because of noise. (Lower) The fit for a model that has no conductive lower crustal faultzone.
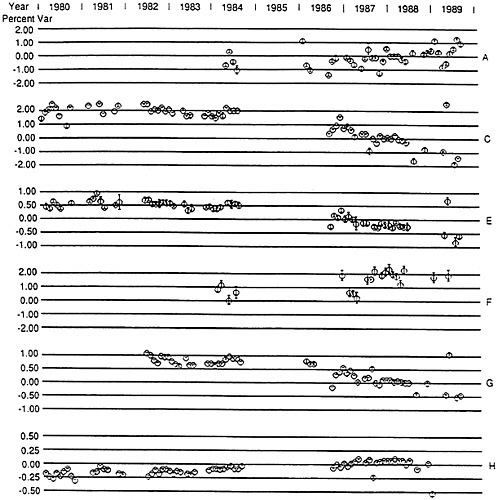
FIG. 4. The Palmdale array telluric variations in the major eigenvector directions shown as a function of time. Dipoles B and D were used as references. Note the systematic changes starting around 1985.
how wide the zone was, but if it were 5 km wide its conductivity would be about 300 times greater than the average lower crust conductivity. The MT data from stations 4 and 3 also showed leakage, but the other stations, which were further to the southeast, had less leakage. Our old telluric data from Hollister did not show leakage across the SAF. On this basis we think the leakage was created by the Loma Prieta earthquake. (A lot of fluid flow was seen at the surface at Loma Prieta after the earthquake.) It is hard to believe that fluids could have gone down into the lower crust on a short time scale, so probably the fluids were there before the earthquake, but not well connected. In that case the fluid pressure would be close to the rock pressure, and if these fluids can get better connected they may play a role in modifying the fluid pressure in the fault zone in the upper crust, which is a factor in the strength of the fault zone.
Palmdale
At Loma Prieta we did not have MT measurements on a long time scale, but at Palmdale (Fig. 1) we had telluric measurements (20) for 11 years (1979–1990). Starting at about 1985, changes in the telluric relationships took place across the array (Fig. 4). Since two dipoles have to be used as references, the relative changes across the array are not unique, but, using the smallest changes that fit the data, we see a lowering of the telluric signals on the dipoles on the fault (A and C), and northeast of the fault (B), compared with the dipoles southwest of the fault (on the ocean side). The variations relative to dipole D from 1984 to 1989 were −0.6%, −1.3%, and −1.9% for dipoles A, B, and C and −0.1% and 0.2% for dipoles F and H. A doubling of the lower crustal conductivity in a 5-km-wide zone would create these changes. The increase of the conductivity is probably due to a better connectivity of the lower crustal fluids. If this keeps up, there is the possibility that the lower crust will influence the upper crust fault zone fluid pressure, but at this stage we cannot say too much.
1. Lachenbruch, A.H. & Sass, J.H. (1980) J. Geophys. Res. 85, 6185–6222.
2. Zoback, M.D., Zoback, M.L., Mount, V.S., Suppe, J., Eaton, J.P., Healy, J.H., Oppenheimer, D., Reasenberg, P., Jones, L., Raleigh, C.B., Wong, I.G., Scotti, O. & Wentworth, C. (1987) Science 238, 1105–1111.
3. Byerlee, J.D. (1990) Geophys. Res. Lett. 17, 2109–2112.
4. Rice, J.R. (1992) in Fault Mechanics and Transport Properties in Rocks, eds. Evans, B. & Wong, T. (Academic, New York), pp. 475–503.
5. Etheridge, M.A., Wall, V.J., Cox, S.F. & Vernon, R.H. (1984) J. Geophys. Res. 89, 4344–4358.
6. Kerrich, R., LaTour, T.E. & Willmore, L. (1984) J. Geophys. Res. 89, 4331–4343.
7. Berry, F.A.F. (1973) Am. Assoc. Pet. Geoi. Bull. 57, 1219–1249.
8. Irwin, W.P. & Barnes, I. (1975) Geology 3, 713–716.
9. Hyndman, R.D. & Shearer, P.M. (1989) Geophys. J. Int. 98, 343–365.
10. Bailey, R.C. (1990) Geophys. Res. Lett. 17, 1129–1132.
11. Jones, T.D. & Nur, A. (1982) Geology 10, 260–263.
12. Shankland, T.J. & Ander, M.E. (1983) J. Geophys. Res. 88, 9475–9484.
13. Yardley, B.W.D. (1986) Nature (London) 323, 111.
14. Newton, R.C. (1990) Tectonophysics 182, 2137.
15. Gough, D.I. (1986) Nature (London) 323, 143–144.
16. Watson, E.B. & Brenan, J.M. (1987) Earth Planet. Sci. Lett. 85, 497–515.
17 Walder, J. & Nur, A. (1984) J. Geophys. Res. 89, 11539–11548.
18. Park, S.K., Biasi, G.P., Mackie, R.L. & Madden, T.R. (1991) J. Geophys. Res. 96, 353–376.
19. Mackie, R.L., Madden, T.R. & Nichols, E.A. (1996) U.S. Geological Survey Professional Paper, Special Issue, Loma Prieta, in press.
20. Madden, T.R., LaTorraca, G.A. & Park, S.K. (1993) J. Geophys. Res. 98, 795–808.
21. Norris, R.M. & Webb, R.W. (1976) Geology of California (Wiley, New York).


