
This paper was presented at a colloquium entitled “Earthquake Prediction: The Scientific Challenge,” organized by Leon Knopoff (Chair), Keiiti Aki, Clarence R.Allen, James R.Rice, and Lynn R.Sykes, held February 10 and 11, 1995, at the National Academy of Sciences in Irvine, CA.
The repetition of large-earthquake ruptures
KERRY SIEH
Seismological Laboratory, Division of Geological and Planetary Sciences, California Institute of Technology, Pasadena, CA 91125
ABSTRACT This survey of well-documented repeated fault rupture confirms that some faults have exhibited a “characteristic” behavior during repeated large earthquakes—that is, the magnitude, distribution, and style of slip on the fault has repeated during two or more consecutive events. In two cases faults exhibit slip functions that vary little from earthquake to earthquake. In one other well-documented case, however, fault lengths contrast markedly for two consecutive ruptures, but the amount of offset at individual sites was similar. Adjacent individual patches, 10 km or more in length, failed singly during one event and in tandem during the other. More complex cases of repetition may also represent the failure of several distinct patches. The faults of the 1992 Landers earthquake provide an instructive example of such complexity. Together, these examples suggest that large earthquakes commonly result from the failure of one or more patches, each characterized by a slip function that is roughly invariant through consecutive earthquake cycles. The persistence of these slip-patches through two or more large earthquakes indicates that some quasi-invariant physical property controls the pattern and magnitude of slip. These data seem incompatible with theoretical models that produce slip distributions that are highly variable in consecutive large events.
Few faults have ruptured more than once during the instrumental or historical period. And only in a few of these rare cases have the ruptures been documented well enough to enable unambiguous comparisons of sequential ruptures. Clearly then, attempts to understand the nature of recurrent faulting have not relied heavily upon on observation. Nonetheless, knowledge of the spatial and temporal complexity of earthquake recurrence is essential to an eventual understanding of the behavior of active faults and to reliable earthquake hazard evaluations and forecasts.
Long intervals between ruptures of the same fault usually preclude the exclusive use of seismographic data to investigate recurrent behavior—the instrumental record is usually too short to have captured two or more ruptures of the same fault plane. One noteworthy exception is the discovery (1) of nearly identical repetitions of magnitude M4 to M5 earthquakes on each of 10 small patches of the San Andreas fault along its creeping reach in central California.
The fact that most seismically active regions exhibit populations of small-to-moderate earthquakes that obey the Gutenberg-Richter (G-R) relationship, where
log n=a−bM
suggests that individual faults also obey a G-R relationship (n =number of earthquakes of a given M, a and b are constants). But, if this were true, failure of a fault would occur as a series of events ranging over several magnitudes of average slip and failure area.
This is not the case along several major faults in southern California. Wesnousky found that the b value of the G-R relationship for small earthquakes in 40-km-wide fault-straddling belts grossly underpredicts the moment release in the largest events on most of these faults (2). This discrepancy would be even greater were these belts narrowed to just a few km surrounding the principal fault zone. Thus, the G-R relationship reflects the regional population of fault sizes rather than the population of rupture sizes on a given seismogenic structure. Wesnousky, therefore, finds “characteristic” fault behavior is more attractive than a G-R model. By this he means that a given fault plane is devoid of events other than ones of a characteristic size.
Theoretical models of recurring fault slip suggest a wide variety of long-term behaviors for faults, ranging from production of earthquake populations that obey the G-R relationship to production of similar, “characteristic” events through many cycles. Rice and Ben-Zion (3) argue that models of smooth faults produce highly regular (“characteristic”) slip events in both space and time, if the cell size is smaller than the nucleation size of the earthquake. Like Wesnousky (2), they conclude that geometrical irregularities along faults and the spectrum of fault sizes in a region are what produce G-R distributions, but that simple, individual faults ought to produce highly regular repetition of similar events.
The concept of a “characteristic earthquake,” in which the failure of one fault or one portion of a fault occurs repeatedly in events with nearly identical rupture lengths, locations, and slip magnitudes, arose more than a decade ago, from paleoseismic studies along the San Andreas and Wasatch faults (4, 5). The hypothesis was inspired by the observation that at many paleoseismic sites, displacements and sense of slip were similar over two or more consecutive slip events. Furthermore, geometric irregularities and patterns of historical behavior along these faults suggested the existence of quasi-permanent boundaries between segments characterized by independent seismic histories.
Data that enable direct assessment of the variability of source parameters on the same fault are surprisingly sparse. What I offer in this short paper is an examination of a few well-documented fault ruptures. I review evidence only from historical earthquakes with well documented surficial ruptures, because surficial rupture is directly observable. From among these I have further limited my survey to faults that have relatively well-documented evidence of previous ruptures. I proceed from the most simple cases to complex ones.
Examples of Characteristic Slip
Superstition Hills Fault. Among the most complete data sets pertinent to earthquake repetition are two that provide
The publication costs of this article were defrayed in part by page charge payment. This article must therefore be hereby marked “advertisement” in accordance with 18 U.S.C. §1734 solely to indicate this fact.
Abbreviations: G-R, Gutenberg-Richter; MX, magnitude X.
compelling evidence for characteristic earthquakes. One of these is from the Superstition Hills fault, a strike-slip fault in southern California. The other is from the Lost River Range fault, a normal fault in Idaho.
Along the Superstition Hills fault, Lindvall and others (6) documented many small offset landforms (predominantly rivulets), including offsets that accrued during and immediately following the Mw6.6 Superstition Hills earthquake of 1987. One of their topographic maps shows a small sand dune offset of ≈70 cm, the amount associated with the 1987 earthquake and afterslip (Fig. 1). An older dune exhibits an offset of ≈140 cm, twice the 1987 earthquake offset. Half of this offset accrued during the 1987 earthquake and aftercreep; and half probably occurred during an earlier earthquake, the age of which has been constrained to the period between about AD 1700 and AD 1915 (7).
Fig. 2 displays all of the measurements of small offsets and a graph of slip along the fault in 1987. For reference, the fainter lines represent multiples of the local 1987 values. Seventeen of the offsets fit the double multiple of the 1987 curve, eight fit the triple multiple, two fit the quadruple multiple, and two fit the quintuple multiple, within the errors of the measurements. About 20% of the measurements cannot be explained as a multiple of the local 1987 offset, and most of these are only marginally misfit.
A reasonable conclusion from these data is that the 1987 event nearly duplicated at least two previous slip events, with respect to rupture length, slip magnitude, and distribution. The Superstition Hills fault thus exemplifies characteristic behavior.
Lost River Range Fault. Investigations of the Lost River Range fault, a normal fault, which produced a MS 7.3 earthquake in 1983, also revealed evidence for characteristic slip (8). The earthquake resulted principally from dip slip of up to ≈2.6 m and minor left-lateral slip along the 22-km-long Thousand Springs segment of the fault (Fig. 3). Degraded scarps along most of this rupture present clear evidence for previous rupture.
Salyards (9) was able to reconstruct the slip associated with these ancient scarps by analysis of many scarp profiles measured after the earthquake. Fig. 4 displays his comparison of the pattern of offset in 1983 and earlier events, the youngest of which occurred ≈7000 yr ago (10). Vertical offsets of 1983 appear as solid dots at each of 33 sites. Vertical offsets of the previous event appear as open circles. These were calculated from surveyed scarp profiles, using the height of the first bevel above the 1983 scarp. The graph shows that slip during the penultimate event roughly mimicks the 1983 rupture. At only 9 of the 33 sites do the 1983 and older offsets differ by more than a factor of two. Where previous offsets were a half meter or less, the 1983 values were also low. Where prior offsets were more than a meter, the 1983 values usually were also more than a meter. These data show that
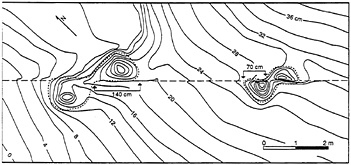
FIG. 1. Evidence for characteristic slip along the Superstition Hills fault. One sand dune exhibits an offset of ≈70 cm, which accrued during the 1987 Mw 6.6 earthquake and afterslip. The older sand dune displays an offset that is twice as large. This is the cumulative product of the 1987 event and a previous event that occurred within the past 300 years. This map was redrafted from Lindvall et al. (6).
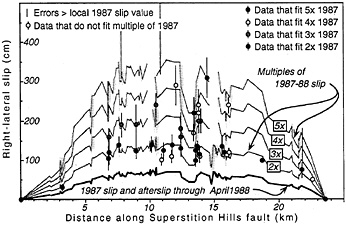
FIG. 2. Small offsets along the Superstition Hills fault show that repeated small offsets characterize ruptures of the fault. For simplicity, the slip function of the 1987 earthquake appears without the hundreds of data points from which it was constructed. Multiples of the 1987 slip function provide a reference for interpreting the older offsets. The fact that most of the older offsets fall on one of the 1987 multiples supports a characteristic-slip model for the Superstition Hills fault. Graph was redrafted from Lindvall et al. (6).
the fault exhibits nearly characteristic slip for the past two and perhaps three events.
Along both the Lost River Range fault and Superstition Hills fault, the basic slip functions have been repeating. Interevent deviations at any one site are almost always less than an order of magnitude and most commonly less than a factor of two. Actual variation from event to event may be even smaller, because some of the differences in the data may be due to uncertainties in reconstruction of penultimate scarp height from the profiles.
From this high degree of similarity in surficial patterns and fault geometry, it is reasonable to conclude that the Superstition Hills fault and the Thousand Springs segment produce characteristic earthquakes. In the case of the Superstition Hills fault, the 1987 and previous rupture appear to span the entire length of the fault. The small offsets of individual earthquakes taper to zero at the end of the fault, as does the cumulative geological offset. In the case of the Lost River Range fault, the northern and southern terminations of the principal 1983 earthquake rupture are at major geometrical and geological breaks in the fault zone. Total geological offset across the northern segment boundary is much less than along the Thousand Springs segment. Furthermore, scarp morphology along segments to the north and south indicate that their previous events occurred well after the previous event on the 1983 segment (8, 11, 12). And so, for at least the past two events, the Thousand Springs segment has been a characteristic, repeated source. Late Pleistocene fault scarps within the gap in Holocene faulting between the Warm Springs and Thousand Springs segments, however, suggest that a still-earlier event involved rupture through the segment boundary. Complexities of this sort are the topic of the next section.
Interaction of Slip Patches
Imperial Fault. The Imperial Valley earthquakes of 1979 and 1940 provide a uniquely well-documented case of repeated historical rupture of the same fault. Unlike the two examples discussed above, though, this case does not support a characteristic-slip model. It does suggest that individual parts of a fault have slip functions that do not vary greatly through several earthquake cycles.
In the case of these Imperial Valley earthquakes, adjacent patches have ruptured historically in two different modes: singly and in tandem. The M7.1 1940 earthquake resulted from faulting along the entire 60-km length of the Imperial fault, the
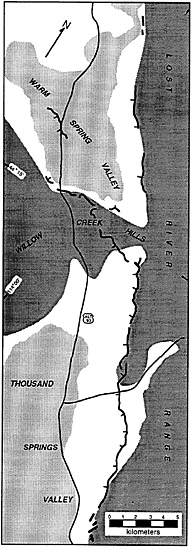
FIG. 3. Simplified map of the 1983 Borah Peak fault rupture. This locality provides evidence both for characteristic slip and for leaky patch boundaries. Principal source of the 1983 earthquake was the Thousand Springs segment of the Lost River Range fault, but minor, discontinuous rupture also occurred on parts of the Warm Spring segment. The magnitude of slip along the Thousand Springs segment and in the Willow Creek Hills is approximately the same as that of the previous event. Rupture along the Warm Springs segment was far smaller in 1983 than in the previous, prehistoric event. This map was redrafted from Crone et al. (8).
northernmost transform fault of the East Pacific Rise. Both its northwesternmost and southeasternmost portions (in the United States and Mexico, respectively) bound dilatational right-steps to other transform fault zones. Surficial dextral slip in 1940 was much greater along the southern and central thirds of the fault than along the northern third. Surficial offsets were
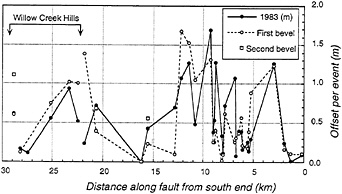
FIG. 4. The pattern and magnitude of vertical offsets for the 1983 Borah Peak earthquake are similar to those of the previous event, several thousand years ago. This similarity supports a characteristic-slip model for this segment of the Lost River Range fault. This graph was adapted from Salyards (9).
as high as 6 m near the International Border and commonly high as 3 m south of the border (13). Along the northern third of the fault, however, dextral offsets were <1 m (Fig. 5) (14).
The M6.6 earthquake of 1979 was associated with surficial rupture along only the northern 30 km of the fault. Dextral offsets in 1979 were no more than a few tens of centimeters and were nearly identical to 1940 offsets along the northern 20 km of the rupture (Fig. 5). Seismographic and geodetic inversions indicate that the majority of the seismic moment of the 1979 earthquake came from an elongate fault patch beneath the surficial rupture (Fig. 6) (15, 16).
Basic similarities and fundamental differences of the two surficial-slip distributions north of the border are intriguing. From ≈10 km north of the border, both exhibit a slip function characterized by submeter values that decrease gradually northward. This similarity suggests that the subsurface patch depicted in Fig. 6 slipped a similar amount during the 1979 and 1940 earthquakes. Unfortunately, detailed inversions do not exist for the 1940 slip distribution; that event does, however, appear to consist of four principal subevents: one that initiated ≈10 km northwest of the Border, two near the Border, and the largest well south of the Border (13). Perhaps the source of the first event, northwest of the Border, is the 1979 patch.
Near the Border, the 1979 and 1940 slip functions are radically different. Both curves display steep slopes a few km north of the border, but the slopes are antisymmetric: The 1979 curve slopes steeply southeastward at ≈1 m/km, whereas the
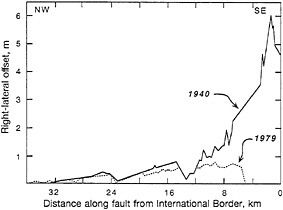
FIG. 5. Comparison of Imperial fault slip of 1940 and 1979 shows important similarities and differences. This example supports the concept of characteristic slip within individual patches, but not characteristic earthquakes. The abrupt decreases in slip in both 1940 and 1979 a few kilometers north of the International Border suggest the presence of a fixed patch boundary. Redrafted from Sharp (14).
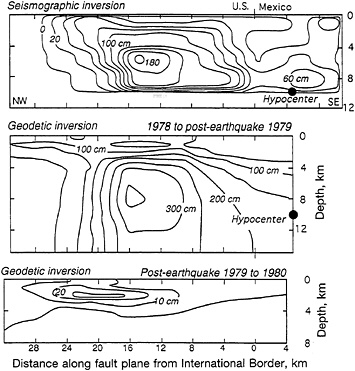
FIG. 6. Seismographic and geodetic inversions show that dextral slip on the Imperial fault in 1979 was concentrated in an elongate patch beneath the surficial rupture. Decrease in slip along its northwestern margin probably reflects the long-term transfer of slip across a dilatational stepover to an adacent fault. Decrease in slip along its southeastern margin cannot be explained as a permanent tectonic feature. Redrafted from Crook (15) and Hartzell and Heaton (16).
1940 curve slopes steeply northwestward at ≈1 m/km and attains values that are 10 times higher.
So, even if a northern patch failed similarly during both the 1979 and the 1940 earthquakes, the great differences between the 1940 and 1979 surficial slip functions near the Border are clear evidence that the characteristic-slip model is not an adequate representation of the Imperial fault’s recent seismic behavior. Instead, I will hypothesize a characteristic behavior for a northern patch, which acted alone during the later earthquake but in tandem with another patch to the south during the earlier earthquake. In addition to the “characteristic” northern source of 1940 and 1979, a much larger source, principally south of the Border, failed in 1940 and produced most of that earthquake moment.
It is probably an important coincidence that the steep southeastward-climbing ramp in 1940 surficial slip between ≈10 km and 2 km north of the border is directly above the steep southeastward decline in slip of the 1979 patch (Figs. 5 and 6). This coincidence suggests a quasipermanent, stationary feature of the fault. Perhaps this transition zone represents a barrier (17, 18). If so, it would have been the northern edge of a strength barrier during the 1979 earthquake and the southern edge of a relaxation barrier during the 1940 earthquake.
If the patch southeast of the transition zone has a higher yield stress than the patch that lies to the northwest, then it would fail less frequently than its northern neighbor. This could explain its stability during the 1979 earthquake. Note, in fact, the pronounced upper-crustal hole in 1979 slip above the hypocenter and south of the transition zone in the inversions of Fig. 6. Slip above the hypocenter was meager. Instead, slip ran from the hypocenter northwestward in a narrow slot, perhaps along the base of the stronger 1940 slip patch, until it reached the weaker 1979 patch north of the Border.
If the 1979 patch has a lower yield stress than the patch south of the Border, then it might have failed several times in the centuries prior to the 1940 earthquake. M6 earthquakes in 1915 and 1906 are, in fact, candidates for prior failures of this part of the Imperial fault. Such events would have relaxed the crust flanking this northern portion of the fault. Hence, during the 1940 earthquake, it slipped only an amount roughly equal to the strains accumulated in the previous three decades, even though the patch south of the Border experienced several meters of slip.
The similarities between the two slip functions along the northern 20 km of the fault suggest that the physical parameters that control the characteristic slip along that section do not vary appreciably over the time scale of many earthquake cycles. This hypothesis is geologically plausible. The gradual, nearly identical, northward decline in dextral slip during both earthquakes is probably a long-term characteristic of the fault, because the northern 15 km of the fault forms the southwestern boundary of a large dilatational stepover. Thus, the northward diminutions of dextral slip in 1940 and 1979 are probable manifestations of a gradational tectonic transfer of slip across the dilatational stepover.
It appears, however, that the great difference in slip between the southern and northern parts of the fault cannot be dissipated by a similar tectonic mechanism. No large geometrical complexity or additional active structure exists in the middle of the Imperial fault to enable a long-term difference in displacements. Instead, a “slip-patch” model seems most plausible. The fundamental characteristic of this model is the repetition of slip in each of one or more patches. The shape and magnitude of the slip function varies little from event to event within each patch, and, in fact, each site within the patch has its own characteristic repeating slip value. For the Imperial fault, three patches would be separated by narrow transition zones in which slip is not strictly repeated because of the interaction of the adjacent patches. Frequently occurring 1979-type events and very infrequent 1940-type events would alternate as depicted in Fig. 7. In this hypothetical slip history, a proper combination of slip on three patches produces uniform long-term slip rates along the Imperial fault.
Paleoseismic data support the general aspects of such a model. If offsets as small as the 1940 and 1979 values are typical along the northern 20 km of the fault, then the average time between such events must be very short, because the long-term slip rate of the fault must be close to the sum of the slip rates of the San Jacinto and San Andreas fault zones, which feed, at least in part, into the Imperial fault from the north. In fact, two and perhaps more major ruptures of this segment have occurred in the 20th century (1906?, 1915?, 1940, and 1979)—i.e., one or more complete cycles in 39–73 yr. This short average interval contrasts markedly with the 260-yr interval between the 1940 earthquake and its predecessor at the Border, which has been determined paleoseismically (19). This large difference in recurrence intervals is consistent with the large discrepancy in slip north and south of the Border in 1940 and 1979. The discovery of three events in the past 260 yr at a site still farther south suggests the existence of a third patch, as well, representing the southern 20 km of the fault (19).
Hence, the Imperial fault’s behavior supports the existence of at least two and perhaps three discrete patches, separated by a boundary that is stationary through several earthquake cycles. North of this boundary, surficial slip occurs frequently in small increments, as in both 1940 and 1979. South of the boundary, infrequent large slip events are probably typical.
Edge Effects, Patch Interaction and Leaky Patch Boundaries
Imperial Fault. One other aspect of the Imperial fault’s slip functions is worth considering. The high-slip portion of the 1940 slip function has a tail that extends northward 7 km into the 1979 rupture zone (Fig. 5). Slip in 1940 was significantly higher here than it was in 1979. The larger value of slip in 1940 here may result from the static stresses imposed by several
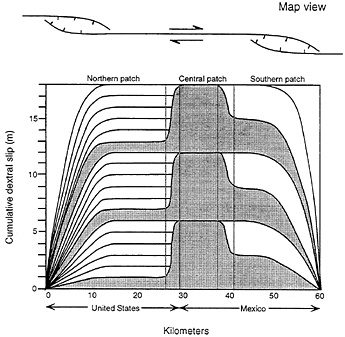
FIG. 7. Paleoseismic and historical data suggest this model of the Imperial fault’s behavior over the past millennium. Accumulated over scores of earthquake cycles, slip along the fault between stepovers is uniform. In both stepover regions, slip tapers to zero. Each of the three patches along the fault has its own characteristic slip function. Narrow transition zones separate these regions of characteristic slip.
meters of slip along the central patch of the fault. This tail may be evidence, then, of the forcing of at least a shallow slip on the northern segment by the adjacent central segment. Such nonuniform slip in the transition zones between patches could be a common consequence of patch interaction because slip of a patch imposes shear stresses on neighboring faults. So most patch boundaries might be expected to be “leaky”—that is, slip on one fault patch may force minor slip on the nearby portion of an adjacent fault. In the three cases discussed here, the leaks extend on the order of ≈10 km beyond the patch boundaries.
Lost River Range Fault. More evidence for leakage across patch boundaries comes from two other historical and prehistorical ruptures: The Lost River Range fault and the faults of the Landers earthquake.
One part of the 1983 rupture of the Lost River Range fault, not mentioned above, exhibits noncharacteristic behavior that may be evidence of a leaky patch boundary. Several km north of the terminus of the principal rupture was a minor, discontinuous mountain front rupture along the Warm Spring segment of the fault (Fig. 3) (8). Vertical throws on this rupture were commonly no greater than ≈10 cm and diminished northward. Near the southern end of this rupture, slip was locally as great as 80 cm. The paucity of aftershocks near this piece of the fault and the lack of a geodetic signal of this slip on the road parallel to and only ≈5 km west of this rupture shows that slip on this segment was very shallow (20).
The shallowness and discontinuous nature of the faulting and its small magnitude relative to the principal faulting of 1983 and to the previous event suggest that this slip was induced by static stresses imposed on the crust by the principal coseismic rupture. This would, thus, be another example of a static-stress-induced leaky patch boundary.
Faults of the Landers Earthquake. The Landers, California, earthquake of 1992 provides an exceptional opportunity to observe a complex earthquake rupture in great detail and by diverse methods. Geologic, geodetic, and seismographic observations provide important constraints on relationships between ancient and modern ruptures, and between surface and subsurface faulting. These are relevant to the discussion of repeated fault rupture.
Generally speaking, the principal ruptures are arranged in a right-stepping en echelon pattern (Fig. 8). The four faults whose names are in boldface type are those that produced most of the earthquake. Each sustained dextral offsets commonly >2 m (21, 22). Offsets on other faults were commonly far less than a meter. The mainshock rupture propagated unilaterally north and northwestward, from the southern end of the Johnson Valley fault (22, 23).
The termini of more than half of the major 1992 ruptures correspond to geological fault terminations. These correspondences are dark circles on Fig. 8. These fault termini are obvious candidates for patch boundaries. The southern terminus of the Johnson Valley rupture, for example, appears to be the end of the fault, as well: the active left-lateral Pinto Mountain fault, a couple kilometers farther south, is neither offset nor deflected by the Johnson Valley fault. The first rupture of the Eureka Peak fault occurred ≈30 sec after the initiation of the mainshock and at least 20 sec after slip on the Johnson Valley fault had ceased (22, 24). Thus, this fault termination and the associated structural complexity appear to have retarded southward propagation of the rupture. The northern tip of the Landers fault and southern tip of the northern Homestead Valley fault are at the northern end of a major stepover in the 1992 rupture zone and may be associated with a delay of several seconds in the northward propagation of the rupture (22, 25). The northern termini of both the Homestead Valley and Emerson ruptures are also the geological terminations of those faults. Paleoseismic studies at two sites along the northern Homestead Valley and the Emerson faults show that vertical slips in the previous rupture were similar in magnitude to those of 1992 (26, 27). This supports a characteristic-slip behavior for these faults.
The four rupture termini that are denoted in Fig. 8 by an open circle occur along a mapped fault, rather than at a fault termination. Paleoseismic studies have provided important clues concerning the reasons for three of these midfault
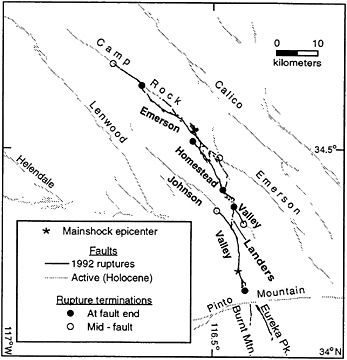
FIG. 8. Complex rupture pattern of the 1992 Landers earthquake included the complete rupture of some faults and the partial rupture of others. Two of the midfault ruptures may reflect “leaky” patch boundaries and the pattern of faulting in prior events. Another midfault termination may be a clue that another rupture is (geologically) imminent.
terminations. First, studies by several groups have shown that the most recent previous event (or events) along the 1992 Landers, Homestead Valley, and Emerson ruptures occurred between 6000 and 9000 yr ago (26–28). Other paleoseismic investigations have shown that ruptures have occurred much more recently both on the Camp Rock and on the southern portion of the Emerson fault, which did not break in 1992 (D. Schwartz, personal communication, 1994; C.Rubin and S. Lindvall, personal communication, 1995). These observations suggest that the blocks bounding both the Camp Rock and the southern Emerson had been relaxed so recently that these faults were not induced to fail as part of the Landers sequence. Both structures would, therefore, have been relaxation barriers (17, 18) to propagation of the 1992 rupture.
The pattern of slip on the southern part of the Camp Rock in 1992 supports this hypothesis and the concept of a “leaky” patch boundary. First, consider the pattern of surficial slip: The Emerson experienced a precipitous 2-m drop in slip near its northern end (Fig. 9A). The Camp Rock fault displayed offsets of ≈1 m or less along an 8-km-long segment north of the Emerson fault. These low-slip segments of the Emerson and the Camp Rock faults are nearly devoid of aftershocks, and inversions of both geodetic and seismographic data indicate that the slip did not extend more than a kilometer or so below the surface traces (21, 22, 29–31).
A reasonable explanation for the shallowness of slip and paucity of aftershocks is that this portion of the rupture was driven by static stresses induced by that portion of the Emerson fault farther south that experienced 3 m or more of dextral slip. This hypothesis is supported by the asymmetry of the right-lateral slip pattern along the Camp Rock fault (Fig. 9B). One would expect that the shear stresses—and hence the slip— induced by failure of the Emerson fault would be greater nearer the Emerson fault. One would also expect that the shallower portions of the Camp Rock would be more susceptible to induced failure because they have a lower yield stress than deeper portions of the fault (18).
Why did the Camp Rock fault not become a major part of the 1992 Landers earthquake? Perhaps the fault had already failed in a recent, prehistoric earthquake, so that only at shallow depths near the Emerson fault was its yield stress exceeded during the 1992 event. This notion is supported by paleoseismic evidence from the graben at the south end of the rupture (near km 7 on Fig. 9B). There Rubin and Lindvall (personal communication)
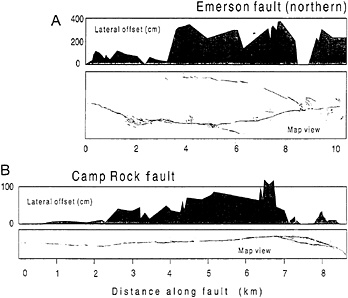
FIG. 9. Surficial slip pattern along the northernmost faults of the 1992 Landers earthquake. Portions with slip of a meter or less in 1992 may have slipped in a relatively recent prehistoric event. See Fig. 8 for locations.
have found evidence for a prior event that occurred no more than 2000 or 3000 yr ago. That event produced a scarp much higher than the scarp that was produced in 1992.
A similar explanation may apply to the southern half of the Emerson fault, which did not fail during the Landers earthquake (Fig. 8). Excavations reveal that it experienced rupture within the past millennium (D.Schwartz, personal communication, 1994). In the case of both the Camp Rock and the southern Emerson faults, tectonic loading of the faults since their last prehistoric events may not have raised the regional stresses to the point that they could fail in the 1992 event.
Recent pre-1992 failure, however, is an inappropriate explanation for the lack of failure of the northern Johnson Valley fault in 1992. That fault has not failed for ≈9000 yr (32). Of all the faults for which paleoseismic data are available, only this one appears to have been inactive during the late Holocene (Fig. 10). It is surprising, therefore, that it did not become part of the 1992 rupture. Is it unreasonable to speculate that it will be the next fault in the region to fail?
History of the Southern San Andreas Fault
Among strike-slip faults, only the southern half of the San Andreas fault has enough paleoseismic sites to warrant attempts to construct space-time diagrams of large earthquakes. Fig. 11 is one attempt to correlate events up and down this 600-km-long reach of the fault. This and all other such attempts, to date, make the assumption that if the radiocarbon date of an ancient earthquake allows correlation with an event at an adjacent site, the correlation is made. This approach, of course, could well produce paleoseismic histories with longer rupture lengths than actually occurred. For example, the great 1906 and 1857 earthquakes would correlate, within the uncertainty of radiocarbon dating. In Fig. 11, I have assigned dextral offsets to some of these earthquakes, based upon offset geomorphic or stratigraphic markers or other paleoseismic indicators at particular sites.
The best-constrained ruptures in Fig. 11 are those of the Parkfield earthquakes (thin bars in the upper left) and the great
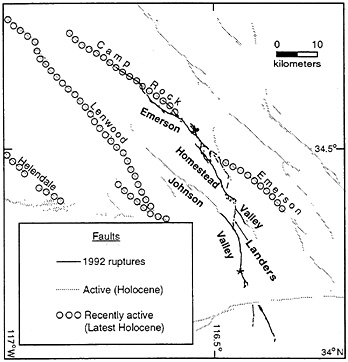
FIG. 10. All of the named faults, except the northern Johnson Valley, sustained major slip either in 1992 or in the past couple millennia. Prior major events for all these faults occurred 6000–9000 yr ago. Thus this part of the Eastern California shear zone is near the end of a temporal cluster of large earthquakes.
1857 earthquake. Streams were offset 7 to 10 m in 1857 in the Carrizo Plain (near km 100) (34, 35). There the repetition of large offsets that was first proposed on geomorphic grounds (36–38) has been confirmed for at least the latest two earthquakes. Three-dimensional excavation of offsets and geomorphic data suggested that offsets of ≈7 m in 1857 might have been preceded by an event with only 3 m or so of dextral slip (33). Comparison of the length of a fault-crossing section line surveyed in 1855 with a GPS (Global Positioning System) measurement of the same line disproved this interpretation (39). The 7-m offset attributed to the 1857 earthquake must now be explained as the near-fault portion of an 11±2-m offset that included a few meters of off-fault warping.
Elsewhere in the Carrizo Plain, geomorphic offsets of 8, 16, and 26 m are best explained as the results of the three most recent earthquakes (36, 37). Only the lesser two of these three, however, have been shown to be associated with individual earthquakes—one in 1857 and a previous one in the 15th century. The largest of the three offsets could be the cumulative product of the 1857 event, the 15th century event, and any or all of the three earlier events, clustered tightly in time between the 13th and 15th centuries (ref. 33 and Fig. 11).
Farther southeast, at Pallett Creek, three-dimensional excavations reveal the amounts of right-lateral offset in successive events (Fig. 11) (40). All but two of the latest 10 events along the fault display slip of 1 to 2 m. The two events in the 11th century, however, are associated with far less slip. One explanation of this noncharacteristic pattern is that the site was near the northern or southern terminus of a large rupture during those events. Alternatively, these small offsets could represent truly small earthquakes.
Paleomagnetic work at Pallett Creek shows that additional slip has occurred as warping within a few tens of meters of the fault zone (41). The total dextral slip associated with both warping and discrete offsets across fault planes appears in parentheses in Fig. 11. Although the error bars are large, all three events appear to have been associated with ≈6 m of dextral slip. If the ratio of warping to discrete fault slip has been roughly constant during the past 10 earthquakes recorded at the site, then all but the two consecutive 11th-century events have been associated with several meters of dextral slip there.
The portion of the San Andreas fault depicted in Fig. 11 clearly does not exhibit a characteristic behavior. The 1812 and 1857 ruptures, though similar in slip magnitude, do not have the same
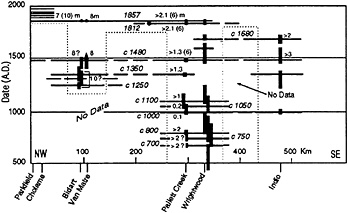
FIG. 11. History of large ruptures of the San Andreas fault, based upon paleoseismic data. Thick horizontal lines represent rupture lengths, based upon proposed correlations. Dextral offsets are indicated (in meters) where available. Offsets in parentheses represent broad-aperture values. Values are queried where more speculative. Though woefully incomplete, the currently available record demonstrates the clustered nature of earthquake occurrence along the fault and the inappropriateness of the characteristic- or uniform-earthquake model for the San Andreas fault. Data from a variety of sources are modified from Grant and Sieh (33).
rupture length. Furthermore, only one of the three events at the Bidart site in the 13th, 14th, and 15th centuries can correlate with the one event that occurred during the same period at Pallett Creek. These data are, however, consistent with a slip-patch model. At all sites, most slip amounts are roughly similar during consecutive events; the two that are not (at Pallett Creek) fit a slip-patch model if they represent the tail ends of large ruptures.
Large Variation in Amount of Characteristic Slip
One outstanding feature of the data I have presented above is the great variation in the magnitude of characteristic slip between fault patches. The Superstition Hills fault and the northern patch of the Imperial fault are characterized by repeated surficial slip values <1 m. The Thousand Springs segment of the Lost River Range fault experiences dip-slip offsets of up to a couple of meters. If slip on the central patch of the Imperial fault is similar from event to event, then the 1940 values of 5–6 m would be characteristic, as they are along the San Andreas fault. Berryman and his colleagues (42) have measured 6- and 12-m offsets along stream channels at one location along the Alpine fault, New Zealand. These offsets appear to represent two successive 6-m events. Raub and others (43) discuss geomorphic evidence for repeated dextral slip of 3.5–4.0 m on the Mohaka fault, North Island, New Zealand, during its most recent two, prehistoric earthquakes. At one site along the Wellington fault, each of the most recent five events appears, from offset river terraces, to have been associated with 3.4–4.7 m of slip (44).
These examples of repeated slip, show that the magnitude of characteristic slip ranges from tens of centimeters to many meters. Why would the range in values be so great? Clearly, slip must not scale with rupture length or width, except in the grossest sense. The Superstition Hills fault and the Homestead Valley faults, for example, are about the same length—25 km. And yet the characteristic slip on one is less than a meter, whereas on the other it is several meters. Along the trace of the 30-km-long northern patch of the Imperial fault, slip of a few tens of cm occurs every few decades; along the remainder of the fault, which has a similar length, slip of several meters appears to recur every few hundred years.
This lack of correlation of characteristic slip with rupture length is consistent with the rupture histories for several recent earthquakes that have been determined from seismographic inversions. These inversions show that although rupture may proceed for several tens of seconds during a large earthquake, any one site along a rupture may only be slipping for the few seconds after the passage of the rupture front (45). For example, slippage of the southern Johnson Valley fault was completed in the hypocentral region within the first few seconds of the earthquake, even though slip was still occurring along the northern end of the southern Johnson Valley fault between 6 and 9 sec and along other faults up to 24 sec after initiation of the event (22). This result demonstrates that the amount of slip on any one patch must be an intrinsic property of that patch, not a function of the length of the fault.
So the magnitude of characteristic slip must be a function of some quasi-invariant property of the fault zone. What are the candidate properties? It is unlikely that the roughness of the fault plane could play an important role, given the apparent similarity of fault geometry along the contrasting patches of the Imperial fault or of the San Andreas fault. For the same reason, horizontal width of the fault zone is also an unlikely cause.
Discussion and Conclusions
Theoretical models of earthquake recurrence have proliferated during the past decade. These models suggest a wide variety of recurrent fault behaviors. Rundle (46) and Stuart (47) varied frictional properties along the San Andreas fault, as suggested by
variable offsets during the 1857 earthquake and along-strike variations in recurrence intervals, to create synthetic histories many earthquake cycles long. Some of their histories mimick the actual historical and paleoseismic record of the fault, in that certain portions of the fault experience infrequent repeated offsets of several meters, whereas others experience frequent small offsets. Ward (48) has developed synthetic histories of large earthquakes along the Middle American subduction zone, using static dislocation theory and fault segments based upon the fault’s historical behavior. His models produce a variety of behaviors, including fault patches that are highly “characteristic” and patches that produce a variety of event sizes and rupture lengths. In all three of these attempts to model fault histories, the locations of rupture terminations and transitions from high- to low-slip patches are roughly stationary.
Rice and his colleagues (3, 49) have argued that theoretical models of smooth faults produce slip events that are highly regular in both space and time, if the numerical cell size one uses is small compared to the dimensions of the earthquake’s nucleation patch. An individual fault can be made to deviate from highly regular repetition of events only if it is allowed to change state between earthquakes, while it is not slipping (49). In these “aging” models, slip at a site varies by more than an order of magnitude, and slip-patch boundaries vary wildly with time. Even in this version of their smooth-fault models, however, power-law frequency-size earthquake populations of the G-R type fail to occur. From this, they conclude that observed G-R earthquake populations reflect geometrical irregularities along faults and the spectrum of fault sizes in a region. Wesnousky’s study (2) of paleoseismic and instrumental data for major faults in southern California supports this view that structures fail in large earthquakes that are grossly underpredicted by the G-R statistics of smaller earthquakes in the surrounding region.
Well-documented examples of repeated fault rupture are rare. But sparse available data support the view that smooth, individual fault patches fail during characteristic slip events. At sites where recent slip was small, previous events usually exhibit slip of the same magnitude. Likewise, where recent slip was meters, previous events usually exhibit slip of the same magnitude. Synthetic earthquake histories characterized by highly irregular slip during consecutive events do not appear to reflect reality.
Contrary to the “characteristic earthquake” model, patches commonly fail either singly or in tandem with one or more adjacent patches. Only along transition zones between slip patches does slip at a site appear to deviate much from event to event. Large seismic rupture in a transition region during one event may alternate with aseismic slip induced there by static stresses from coseismic slip on a neighboring patch.
The small differences in a patch’s slip function over two or more earthquake cycles indicate that slip is controlled principally by a physical property of the patch, not the length of the rupture or dynamic properties of the rupture, such as directivity.
Carrie Sieh assisted in drafting the figures. I deeply appreciate support during the past two decades by the National Earthquake Hazards Reduction Program, through the U.S. Geological Survey’s external grants program. My studies of the Landers earthquake were supported by California Institute of Technology’s Earthquake Research Affiliates and by the National Science Foundation/U.S. Geological Survey Southern California Earthquake Center. This paper is California Institute of Technology Division of Geological and Planetary Sciences contribution number 5588 and Southern California Earthquake Center contribution number 218.
1. Ellsworth, W.L. (1991) Clocks in the Earth: Repeatability and Variability in Earthquake Recurrence (Natl. Acad. Sci., Washington, DC).
2. Wesnousky, S. (1995) Bull. Seismol Soc. Am. 84, 1940–1959.
3. Rice, J. & Ben-Zion, Y. (1996) Proc. Natl. Acad. Sci. USA 92, 3811–3818.
4. Schwartz, D. & Coppersmith, K. (1984) J. Geophys. Res. 89, 581–598.
5. Sieh, K. (1984) J. Geophys. Res. 83, 3907–3939.
6. Lindvall, S., Rockwell, T. & Hudnut, K. (1989) Bull. Seismol. Soc. Am. 79, 342–361.
7. Hudnut, K. & Sieh, K. (1989) Bull Seismol. Soc. Am. 79, 304–329.
8. Crone, A.J., et al. (1987) Bull Seismol. Soc. Am. 77, 739–770.
9. Salyards, S. (1985) Proceedings of Workship Twenty Eight on the Borah Peak, Idaho, Earthquake (U.S. Geological Survey), Vol. A, pp. 59–75.
10. Hanks, T.C. & Schwartz, D.P. (1987) Bull Seismol. Soc. Am. 77, 837–846.
11. Wallace, R.E. (1987) Bull. Seismol. Soc. Am. 77, 868–877.
12. Crone, A.J. & Haller, K.M. (1991) J. Struct. Geol. 13, 151–164.
13. Trifunac, M.D. & Brune, J.N. (1970) Bull Seismol. Soc. Am. 60, 137–160.
14. Sharp, R.V. (1982) U.S. Geol. Surv. Prof. Pap. 1254, 213–221.
15. Crook, C. (1984) Thesis (Univ. of London, London).
16. Hartzell, S. & Heaton, T. (1984) Bull Seismol. Soc. Am. 72, 1553– 1583.
17. Aki, K. (1979) J. Geophys. Res. 84, 6140–6148.
18. Scholz, C.H. (1990) The Mechanics of Earthquake Faulting (Cambridge Univ. Press, New York).
19. Thomas, A. & Rockwell, T. (1995) J. Geophys. Res., in press.
20. Barrientos, S., Stein, R.S. & Ward, S.N. (1987) Bull. Seismol. Soc. Am. 77, 784–808.
21. Sieh, K., et al. (1993) Science 260, 171–176.
22. Wald, D.J. & Heaton, T.H. (1994) Bull. Seismol. Soc. Am. 84, 668–691.
23. Hough, S. (1994) Bull Seismol. Soc. Am. 84, 817–825.
24. Cohee, B. & Beroza, G. (1994) Bull Seismol. Soc. Am. (Special issue on 1992 Landers Earthquake Sequence).
25. Spotila, J. & Sieh, K. (1995) J. Geophys. Res. 100, 543–559.
26. Rubin, C. & Sieh, K. (1993) Eos Trans. Am. Geophys. Union. 74, 612.
27. Rockwell, T.K., Schwartz, D., Sieh, K., Rubin, C., Lindvall, S., Herzberg, M., Padgett, D. & Fumal, T. (1993) Eos Trans. Am. Geophys. Union. 74, 67.
28. Hecker, S., Fumal, T., Powers, T., Hamilton, J., Garvin, C., Schwartz, D. & Cints, F. (1993) Eos Trans. Am. Geophys. Union 74, 612.
29. Bock, Y., Agnew, D., Fang, P., Genrich, J., Hager, B., Herring, T., Hudnut, K., King, R., Larsen, S., Minster, J., Stark, K., Udowindski, S. & Wyatt, F. (1993) Nature (London) 361, 337–340.
30. Hudnut, K. W., Bock, Y., Cline, M., Fang, P., Feng, Y., Freymueller, J., Ge, X., Gross, W., Jackson, D., Kim, M., King, N., Langbein, J., Larsen, S., Lisowski, M., Shen, Z., Svarc, J. & Zhang, J. (1994) Bull. Seismol Soc. Am. 84, 625–645.
31. Hauksson, E., Jones, L.M., Hutton, K. & Phillips, D.E. (1993) J. Geophys. Res. 98, 19835–19858.
32. Herzberg, M. & Rockwell, T. (1993) Eos Trans. Am. Geophys. Union 74, 612.
33. Grant, L. & Sieh, K. (1994) J. Geophys. Res. 99, 6819–6841.
34. Sieh, K. (1978) Bull. Seismol. Soc. Am. 68, 1421–1448.
35. Grant, L. & Sieh, K. (1993) Bull Seismol. Soc. Am. 83, 619–635.
36. Sieh, K. (1981) in International Research Conference on Intraplate Earthquakes, September 17–19, 1979, ed. Petrovski, J. (Ohrid, Yugoslavia), pp. 209–218.
37. Sieh, K. (1980) Proceedings of the Earthquake Prediction Research Symposium (Seismol. Soc. Japan), pp. 175–185.
38. Sieh, K.E. & Jahns, R.H. (1984) Geol. Soc. Am. Bull. 95, 883–896.
39. Grant, L. & Donnellan, A. (1993) Bull Seismol. Soc. Am. 84, 241–246.
40. Sieh, K. (1984) J. Geophys. Res. 89, 7641–7670.
41. Salyards, S., Sieh, K. & Kirschvink, J. (1992) J. Geophys. Res. 97, 12457–12470.
42. Berryman, K., Beanland, S., Copper, A., Cutten, H., Norris R. & Wood, P. (1992) Ann. Tecton. 6, 126–163.
43. Raub, M.L., Cutten, H.N.C. & Hull, A.G. (1987) Seismotectonic Hazard Analysis of the Mohaka Fault North Island, New Zealand, Proceedings of the Pacific Conference on Earthquake Engineering (New Zealand Natl. Soc. for Earthquake Eng., Wellington, New Zealand), Vol. 3, pp. 219–230.
44. Berryman, K. & Beanland, S. (1991) J. Struct. Geol. 13, 177–189.
45. Heaton, T.H. (1990) Phys. Earth Planetary Interiors 64, 1–20.
46. Rundle, J. (1988) J. Geophys. Res. 93, 6255–6274.
47. Stuart, W.D. (1986) J. Geophys. Res. 91, 13771–13786.
48. Ward, S.N. (1991) J. Geophys. Res. 96, 21433–21442.
49. Rice, J.R. (1988) J. Geophys. Res. 98, 9885–9907.


