
11
Nuclear Magnetic Resonance Studies of Liver and Muscle Glycogen Metabolism in Humans
Gerald I. Shulman1
INTRODUCTION
This paper describes some of this laboratory's recent studies in which nuclear magnetic resonance (NMR) spectroscopy has been used to gain new insights into the regulation of liver and muscle glycogen synthesis in normal humans as well as into the pathogenesis of noninsulin-dependent diabetes mellitus (NIDDM) or Type II diabetes mellitus. This chapter will focus on the application of the technique to examine the regulation of peripheral glucose uptake and hepatic glucose output—the two major processes affected by insulin resistance. It provides an overview of the principles of NMR spectroscopy and introduces some of the different nuclei that can be studied using the technique. The use of carbon-13 (13C) NMR spectroscopy on muscle to assess the rate of muscle glycogen synthesis in normal and diabetic humans is described, as is the use of phosphorus-31 (31P) NMR spectroscopy to investigate the rate-limiting steps in
muscle glycogen synthesis. Finally, this paper will discuss the utilization of 13C NMR spectroscopy in the noninvasive measurement of hepatic glycogen content for direct quantification of hepatic glycogenolysis and indirect quantification of gluconeogenesis in normal subjects and subjects with Type II diabetes mellitus.
BRIEF OVERVIEW OF THE BASIC PRINCIPLES OF NMR SPECTROSCOPY
This paper will provide only a brief overview of the basic principles of NMR spectroscopy, which are reviewed in detail elsewhere (Gadian, 1982; Jardetzky and Roberts, 1981). The technique of NMR spectroscopy relies on the spin properties of certain atomic nuclei, which make them behave like tiny bar magnets. Within molecules, these nuclei are usually oriented randomly in space. One might expect then that, when placed in a magnetic field, these nuclei will behave like a compass needle and line up with the field. However, as a result of the laws of quantum mechanics, these nuclei do not behave like conventional bar magnets but instead they tend to line up either with or against the field with the two different orientations having slightly different energies (Gadian, 1982; Jardetzky and Roberts, 1981). When subjected to an oscillating magnetic field, the nuclei can be made to move between these transition states. Under the applied magnetic field, the nuclei will precess (resonate) at a particular frequency. The higher the magnetic field, the faster the frequency of precession and the greater the difference between the two energy states. The electromagnetic frequency at which precession occurs depends on the particular nucleus being analyzed and its molecular environment (Gadian, 1982; Jardetzky and Roberts, 1981). Table 11-1 shows some of the nuclei that can be studied using NMR spectroscopy. Hydrogen nuclei, in the form of protons (1H), when placed in a magnetic field of 2.1 Tesla (T) (the unit of magnetic field intensity) will precess at 89.5 megahertz (MHz). Overall, 1H NMR spectroscopy is the most sensitive
nucleus to examine using NMR spectroscopy. It is the signals from protons in the body that are analyzed when whole-body magnetic resonance imaging (MRI) is performed. Since most of the protons in the body are associated with water and fat, it is the 1H signals from these substances that are detected and constructed into a three-dimensional image by a computer.
In contrast to getting NMR signals from protons in the body to obtain images, this paper will focus on the application of phosphorus (31 P) and carbon (13C) NMR spectroscopy in humans to measure intracellular metabolite concentrations for the study of metabolism. 31P NMR spectroscopy takes advantage of the fact that 31P is the only naturally occurring form of phosphorus, and it therefore represents approximately 100 percent of the phosphorus in all phosphate-containing compounds (Table 11-1). As will be shown, 31P NMR spectroscopy can be used to quantify high-energy phosphate intermediates, such as adenosine triphosphate (ATP) and phosphocreatine in muscle. It also can be used to measure glucose-6-phosphate (G-6-P) concentrations in muscle, thus allowing the rate-limiting step of muscle glycogen synthesis to be analyzed. In contrast with 1H and 31P nuclei, only 1.1 percent of carbon nuclei occur naturally as the 13C form; the rest occur as 12C, which is NMR-invisible. Consequently, 13C NMR spectroscopy of naturally occurring substances in the body is a relatively insensitive technique, having an overall relative sensitivity that is approximately 10,000 times less than that of 1H NMR spectroscopy. However, as will be shown, it is possible to use 13C NMR spectroscopy to measure natural abundance 13C glucose in liver and muscle glycogen, which typically occurs in concentrations of greater than 50 mmol/liter. Furthermore, the sensitivity of this technique can be improved by up to almost 100-fold by using 13C-enriched isotopes.2
NMR Spectrometer
In simple terms, an NMR spectrometer consists of a magnet, a probe, a radio-frequency generator, and a computer. In the studies described in this paper, the probe is placed under the gastrocnemius muscle or over the liver and acts like an antenna, both transmitting and receiving electromagnetic energy from the adjacent tissue. The radio-frequency generator sends electromagnetic pulses to the probe at the frequency at which the nuclei being investigated are oscillating. The nuclei in the tissue absorb some of the energy and in turn move to a higher energy state. When they return to their lower energy states, they give off energy that is then picked up by the probe, and a receiver picks up the signal bounced off the tissue. This signal is then passed to a computer, where it is transformed into a spectrum that yields chemical information. This ability to
measure tissue metabolite concentration noninvasively makes NMR spectroscopy a very powerful technique for clinical investigation.
Applications of NMR Spectroscopy
NMR spectroscopy is a useful tool that has contributed to the better understanding of some of the basic pathophysiologic events that occur in Type II diabetes. It has provided a more accessible method of measuring muscle glycogen than the previously employed biopsy method. It also has been used to examine the extent to which the defect in insulin action in subjects with Type II diabetes can be attributed to impairment of muscle glycogen synthesis (Shulman et al., 1990).
In one study, five Type II diabetic subjects and six age-and weight-matched control subjects were subjected to a hyperglycemic-hyperinsulinemic clamp,3 using somatostatin to inhibit endogenous insulin release in order to measure rates of muscle glycogen synthesis under similar concentrations of plasma glucose and insulin (Shulman et al., 1990). The target plasma glucose and insulin concentrations were approximately 190 mg/dl and approximately 70 µU/ml, respectively, simulating postprandial conditions. The infusate in the clamp was 20 percent enriched with 1-13C glucose, to produce a 20-fold increase in the sensitivity of the 13C NMR technique. The rate of incorporation of intravenously-infused 1-13C glucose into muscle glycogen was measured directly in the gastrocnemius muscle using a 2.1T NMR spectrometer, allowing rates of muscle glycogen synthesis to be quantified.
When the incremental change in muscle glycogen concentration was measured over time in the diabetic subjects, the rate of muscle glycogen synthesis (as reflected by the slope of the plot) was approximately half that of the control subjects (p < 0.05) (Figure 11-1). Therefore, under similar concentrations of plasma glucose and insulin, there was a profound defect in muscle glycogen synthesis in the Type II diabetic subjects. When extrapolated to whole-body glucose metabolism, it was found that virtually all of the nonoxidative glucose disposal in the normal control subjects could be accounted for by muscle glycogen synthesis. Rates of whole-body glucose disposal were approximately 50 percent lower in the diabetic subjects than the control subjects under similar conditions of glucose and insulin, reflecting a profound impairment in insulin-stimulated glucose disposal (Figure 11-2). This decreased rate of glucose disposal could be attributed largely to decreased rates of nonoxidative glucose disposal. Similar to the normal control subjects, muscle glycogen synthesis accounted for virtually all of the nonoxidative glucose disposal in the diabetic subjects. This implies that a defect in the insulin-stimulated muscle glycogen
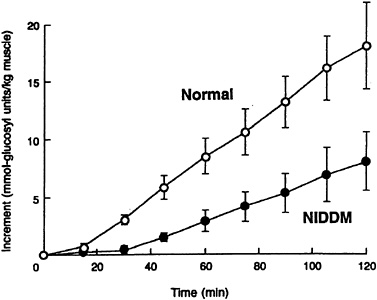
FIGURE 11-1 Incremental change in muscle glycogen concentration in both Type II diabetic subjects (NIDDM) and age-and weight-matched control subjects during a hyperglycemic-hyperinsulinemic clamp. (Error bars represent SEM.) SOURCE: Shulman et al., ''Quantitation of muscle glycogen synthesis in normal subjects and subjects with non-insulin-dependent diabetes by 13C nuclear magnetic resonance spectroscopy," New England Journal of Medicine 322:223–228. Copyright 1990 Massachusetts Medical Society. All rights reserved.
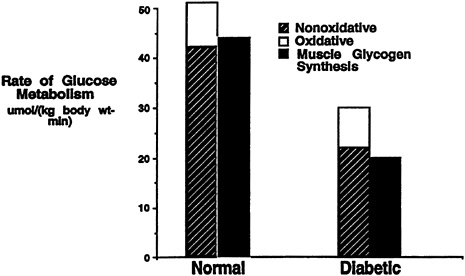
FIGURE 11-2 Rates of oxidative, nonoxidative glucose metabolism, and muscle glycogen synthesis in both Type II diabetic subjects and age-and weight-matched control subjects during a hyperglycemic-hyperinsulinemic clamp.
synthetic pathway is largely responsible for the slower rates of glucose disposal in patients with Type II diabetes mellitus.
GLUCOSE TRANSPORT-PHOSPHORYLATION: THE RATE-LIMITING STEP IN MUSCLE GLYCOGEN SYNTHESIS
In order to identify and understand the defect in the conversion of glucose to muscle glycogen in Type II diabetes, it is necessary to consider the two well-recognized steps in muscle glycogen synthesis that are insulin regulated and might be affected in patients with Type II diabetes mellitus. The first step involves the glucose transporter GLUT 4 (which is the primary protein involved in insulin-stimulated transport), whose response to insulin is known to cause its translocation from the intracellular membrane pools to the plasma membrane, allowing glucose to be transported into the cell in a facilitated manner (Denton and Tavaré, 1992). The other well-known, insulin-regulated step involves glycogen synthase, the enzyme that performs the final step of converting G-6-P to glycogen in muscle glycogen synthesis (Denton and Tavaré, 1992).
If glycogen synthase is defective in Type II diabetes, then it should be possible to see an increase in the concentration of G-6-P, as conversion of G-6-P into glycogen would be impaired in patients with Type II diabetes. However, if glucose transport or phosphorylation (hexokinase) is defective, then there should be no change or possibly a decrease in intracellular G-6-P concentration under insulin-stimulated conditions. 31P NMR spectroscopy was therefore used to measure the concentration of G-6-P in the muscle in order to distinguish between these two possibilities (Rothman et al., 1992). Six Type II diabetic subjects and six age-and weight-matched controls were studied using a hyperglycemic-hyperinsulinemic clamp, with similar steady state plasma concentrations of insulin (approximately 70 µU/ml) and glucose (approximately 180 mg/dl) achieved in both groups. The concentration of G-6-P in the gastrocnemius muscle was measured using 31P NMR spectroscopy. In the control subjects, there was an increase of approximately 0.1 mmol in G-6-P concentration in the muscle of normal subjects 30 minutes into the clamp study, compared with that measured at the start of the clamp (Figure 11-3). This increase was sustained throughout the study. In contrast, the diabetic subjects had approximately the same starting level of G-6-P but experienced virtually no change in the concentration of G-6-P in the muscle over the time span of the study (Figure 11-3). On average, the concentration of G-6-P measured in normal subjects was 0.24 ± 0.02 mmol/kg (± SEM) muscle compared with 0.17 ± 0.02 mmol/kg (± SEM) muscle in Type II diabetic subjects ( p < 0.01). These data suggest that glucose transport or phosphorylation is defective in patients with Type II diabetes mellitus and that it is responsible for reduced rates of insulin-stimulated muscle glycogen synthesis. However, it is possible that, as the diabetic subjects have been hyperglycemic for some years and as chronic hyperglycemia itself is known to cause insulin resistance, the lack of effect observed on concentrations
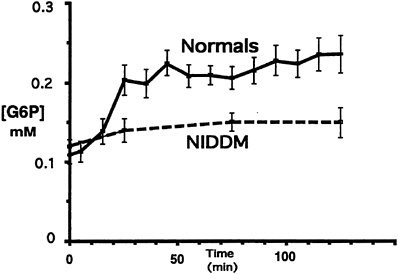
FIGURE 11-3 Glucose-6-phosphate (G-6-P) concentration during the hyperglycemic-hyperinsulinemic clamp study in both Type II diabetic subjects (NIDDM) and age-and weight-matched control subjects during a hyperglycemic-hyperinsulinemic clamp. (Error bars represent SEM.) SOURCE: Rothman et al. (1992). Reproduced from The Journal of Clinical Investigation (89:1069–1075) by copyright permission of The American Society for Clinical Investigation.
of G-6-P could be the result of glucose toxicity. In order to examine whether this observed defect in glucose transport-phosphorylation is a primary or an acquired defect in the pathogenesis of NIDDM, this laboratory recently measured muscle glycogen synthesis rate and muscle G-6-P concentration using 13C and 31P NMR spectroscopy as well as oxidative and nonoxidative glucose metabolism in six lean, normoglycemic offspring of parents with NIDDM and seven age-and weight-matched control subjects. These subjects were studied under hyperglycemic (~11 mM)-hyperinsulinemic (~480 pM) clamp conditions (Rothman et al., 1995). Offspring of NIDDM parents had a 50-percent reduction in total glucose metabolism, primarily due to a decrease in the nonoxidative component. The rate of muscle glycogen synthesis was reduced by 70 percent (p < 0.005), and the accumulation of muscle G-6-P was reduced by 40 percent (p < 0.003) in the offspring of NIDDM parents, which suggests impaired muscle glucose transport-hexokinase activity. These changes were similar to those previously observed in subjects with fully developed NIDDM as well as in control subjects under euglycemic-hyperinsulinemic conditions with matched rates of muscle glycogen synthesis. These data demonstrate that insulin resistant offspring of NIDDM parents have reduced rates of nonoxidative glucose metabolism and muscle glycogen synthesis, secondary to a defect in muscle glucose transport-hexokinase activity prior to the onset of overt hyperglycemia. The presence of this defect in these subjects suggests that it may be a primary factor in the pathogenesis of NIDDM.
NMR SPECTROSCOPIC STUDIES OF LIVER GLYCOGEN METABOLISM
The application of NMR spectroscopy to the measurement of liver glycogen also has resulted in many significant new observations, as liver tissue is even more inaccessible than muscle tissue for biopsy. In one study that made use of the naturally occurring 13C in liver glycogen, 13C NMR spectroscopy was used to measure the net rate of hepatic glycogenolysis during a 68-h fast in seven young healthy subjects (Rothman et al., 1991). As the fast progressed, the decrease in hepatic glycogen content was measured every 3 to 6 hours. A relatively linear decrease in hepatic glycogen content was observed up to 40 hours after the start of the fast, after which there was no further significant decrease (Figure 11-4). By combining these measurements with liver volume measurements obtained from MRI, it was possible to calculate the net rate of hepatic glycogenolysis. Furthermore, by subtracting the net rate of hepatic glycogenolysis from the rate of glucose production in the whole body (determined by deuterated or tritiated glucose turnover techniques), the rate of gluconeogenesis was calculated. When this calculation was performed in young healthy subjects, gluconeogenesis accounted for 64 ± 5 percent (mean ± SEM) of the total glucose production during the first 22 hours (Figure 11-5). From 22 to 46 hours, gluconeogenesis comprised 82 ± 5 percent of glucose production, and during the
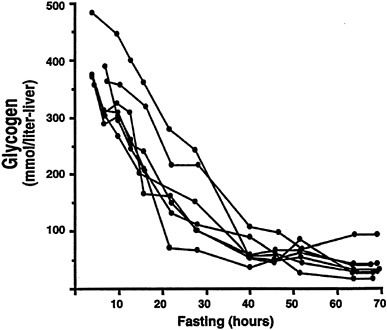
FIGURE 11-4 Hepatic glycogen concentration time course during a 68-h fast in seven normal subjects. SOURCE: Reprinted with permission from Rothman et al., "Quantitation of hepatic glycogenolysis and gluconeogenesis in fasting humans with 13C NMR," Science 254:573–576. Copyright 1991 American Association for the Advancement of Science.
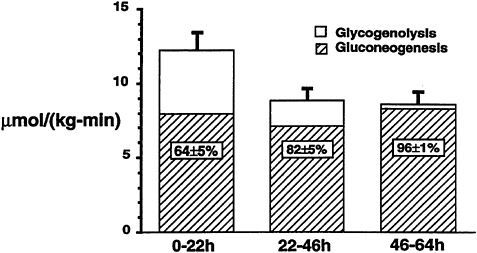
FIGURE 11-5 Mean rates of whole-body glucose production, net hepatic glycogenolysis, and gluconeogenesis in young normal subjects for three intervals (0 to 22 hours, 22 to 46 hours, and 46 to 64 hours) during a 68-h fast.
last 20 hours of the fast, virtually 100 percent of glucose production was due to gluconeogenesis. Therefore, even early on in a fast, gluconeogenesis appears to account for a larger proportion of total glucose production than previously was thought.
Subsequently, a study was performed to investigate whether the higher rates of hepatic glucose production that are known to occur in patients with poorly controlled Type II diabetes mellitus (DeFronzo et al., 1992) are due to increased rates of hepatic glycogenolysis, increase rates of gluconeogenesis, or a combination of both processes (Magnusson et al., 1992). In order to examine this question, seven Type II diabetic subjects were fed a diet identical to that of five age-and weight-matched control subjects for 3 days and then subjected to an overnight fast. Liver glycogen concentration, measured after 4 hours of fasting in Type II diabetic subjects, was approximately half that found in normal subjects (p < 0.05). The rate of hepatic glycogenolysis, as reflected by the slope of the plot, was also significantly less than in the normal control subjects (p < 0.05) (Figure 11-6). After performing the same kind of calculations as previously described, it was found that net hepatic glycogenolysis contributed approximately one-third and gluconeogenesis contributed two-thirds to rates of whole-body glucose production in the age-and weight-matched control subjects (Figure 11-7). In contrast, diabetic subjects had a rate of hepatic glucose production that was approximately 20 percent greater than that of the control subjects (p < 0.01). Since net rates of hepatic glycogenolysis in Type II diabetics
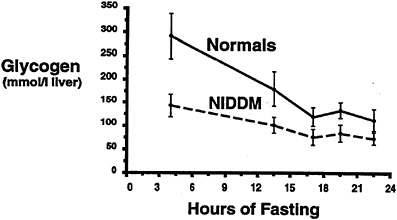
FIGURE 11-6 Hepatic glycogen concentration time course in both Type II diabetic subjects (NIDDM) and age-and weight-matched control subjects following an overnight fast. SOURCE: Magnusson et al. (1992). Reproduced from The Journal of Clinical Investigation (90:1323–1327) by copyright permission of The American Society for Clinical Investigation.
were lower than in the control subjects, virtually all of the increase in hepatic glucose production observed in the diabetic subjects could be attributed to increased rates of gluconeogenesis.
RELATIVE ADVANTAGES AND DISADVANTAGES OF NMR SPECTROSCOPY COMPARED TO OTHER TECHNIQUES
There are several unique aspects of the NMR technique that make it superior to other existing methods. First of all, in contrast to the biopsy method, which has been the traditional method to measure the concentration of intracellular metabolites, the NMR method is noninvasive, which allows the performance of multiple repeated measurements of a given metabolite in any organ in the body. This is especially useful when rates of a metabolic process need to be assessed, such as liver or muscle glycogen synthesis. Furthermore the interpretation of the results of enzyme activities or metabolite concentrations obtained from biopsy material is obscured by several limitations: (1) because of the invasiveness of the technique, muscle biopsies are typically limited to a few time points, (2) enzyme activities do not necessarily reflect in vivo substrate flux, and (3) the concentrations of certain metabolites in the biopsy sample change greatly following excision (for example, G-6-P concentrations in human muscle biopsies are typically artifactually high due to glycogen breakdown between sample excision and freezing).
Safety is another important advantage that NMR has over comparable techniques. No ionizing radiation is involved either in acquiring the spectra-image or in the isotopes utilized as compared to positron emission tomography
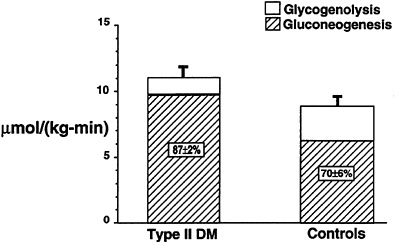
FIGURE 11-7 Mean rates of whole-body glucose production, net hepatic glycogenolysis and gluconeogenesis in both Type II diabetic subjects and age-and weight-matched control subjects following an overnight fast.
(PET) scanning, where radioactive isotopes are required for all studies, or computed axial tomography scanning, where ionizing radiation is used to obtain images. Since all 13C and 31P NMR studies involve stable nuclei, an additional advantage of this technique over PET is that these studies can be performed over relatively long periods of time without having to worry about the restrictions imposed by using radioactive isotopes, which typically have very short half-lives. Finally, the NMR technique yields chemical information. As discussed, 31P NMR spectroscopy can be used to measure intracellular concentrations of high energy phosphate intermediates (e.g., ATP and phosphocreatine), inorganic phosphate, and intracellular pH, as well as some glycolytic intermediates. Furthermore, when 13C-labeled isotopes are used in conjunction with 13C NMR spectroscopy, an investigator can actually trace the metabolic fate of the 13C label. For example, an investigator can measure the rate of label transfer from the C1 position of glucose to the C3 position of lactate into the C4 position of glutamate. Such information is very useful for estimating rates of metabolic fluxes in vivo (e.g., rates of glycolysis and glucose oxidation). In contrast, the PET method cannot directly assess the metabolic fate of an administered radiolabeled compound (e.g., distinguishing 11C-labeled lactate from 11C-labeled glutamate or which carbon in either metabolite is labeled).
The main disadvantage of the NMR technique is its relative insensitivity. At conventional magnetic field strengths (1–2T) an investigator typically is limited to measuring metabolites that exist in millimolar concentrations with either 13C or 31P NMR spectroscopy. However, with the advent of new editing techniques for 1H NMR, which, as discussed, is the most sensitive nucleus for NMR studies
as well as the development of magnets with higher field strengths, it likely will be possible to improve considerably on the overall sensitivity of this technique in the near future.
AUTHOR'S SUMMARY
In summary, NMR spectroscopy has become a useful tool for investigating the physiologic regulation of liver and muscle glycogen metabolism in normal humans as well as defining the metabolic defects that occur in patients with Type II diabetes mellitus. By applying NMR spectroscopy to the muscle, it was possible to demonstrate that muscle glycogen synthesis is the principal pathway of glucose disposal in both normal and Type II diabetic subjects. Furthermore, defects in muscle glycogen synthesis play a predominant role in insulin resistance that occurs in patients with Type II diabetes mellitus. From the 31P NMR studies it was possible to show that this defect in muscle glycogen synthesis is secondary to a defect in glucose transport or phosphorylation. Furthermore, this same defect was observed in young, healthy, lean, normoglycemic, insulin-resistant offspring of Type II diabetic parents, suggesting that this defect in glucose transport or phosphorylation may have a primary role in the pathogenesis of Type II diabetes mellitus.
When applied to the liver, 13C NMR spectroscopy can be used to assess the rate of net hepatic glycogenolysis and to quantify rates of gluconeogenesis noninvasively. Contrary to prevailing thought, gluconeogenesis was found to account for over half of the glucose production during the first 22 hours of a fast in young healthy subjects. In Type II diabetic subjects, rates of net hepatic glycogenolysis were decreased and rates of gluconeogenesis were increased following an overnight fast. Furthermore, this accelerated rate of gluconeogenesis can account for the higher rate of hepatic glucose production observed in these subjects, which is known to be an important contributing factor to fasting hyperglycemia.
Given the great potential of the NMR technique to measure metabolite concentrations and metabolic fluxes in any organ of the body noninvasively, it is likely that this technique will continue to provide new insights into the regulation of substrate metabolism in normal humans as well as into the pathogenesis of various metabolic diseases such as diabetes mellitus.
REFERENCES
Defronzo, R.a., R.C. Bonadonna, and E. Ferrannini 1992 Pathogenesis of NIDDM: A precarious balance between insulin action and insulin secretion. Pp. 569–663 in International Textbook of Diabetes Mellitus, vol. 1, K.G.M.M. Alberti, R.A. DeFronzo, H. Keen, and P. Zimmet, eds. Chichester: John Wiley and Sons.
Denton, R.M., and J.M. Tavaré 1992 Action of insulin on intracellular processes. Pp. 385–408 in International Textbook of Diabetes Mellitus, vol. 1, K.G.M.M. Alberti, R.A. DeFronzo, H. Keen, and P. Zimmet, eds. Chichester: John Wiley and Sons.
Gadian, D.G. 1982 Nuclear Magnetic Resonance and Its Application to Living Systems. New York: Oxford University Press.
Jardetzky, O., and G.C.K. Roberts 1981 NMR in Molecular Biology. New York: Academic Press.
Magnusson I., D.L. Rothman, L.D. Katz, R.G. Shulman, and G.I. Shulman 1992 Increased rate of gluconeogenesis in Type II diabetes mellitus. A 13C nuclear magnetic resonance study. J. Clin. Invest. 90:1323–1327.
Rothman, D.L., I. Magnusson, L.D. Katz, R.G. Shulman, and G.I. Shulman 1991 Quantitation of hepatic glycogenolysis and gluconeogenesis in fasting humans with 13C NMR. Science 254:573–576.
Rothman, D.L., R.G. Shulman, and G.I. Shulman 1992 31P nuclear magnetic resonance measurements of muscle glucose-6-phosphate. Evidence for reduced insulin-dependent muscle glucose transport or phosphorylation activity in non-insulin-dependent diabetes mellitus. J. Clin. Invest. 89:1069–1075.
Rothman, D.L., I. Magnusson, G. Cline, D. Gerard, C.R. Kahn, R.G. Shulman, and G.I. Shulman 1995 Decreased muscle glucose transport/phosphorylation is an early defect in the pathogenesis of non-insulin-dependent diabetes mellitus. Proc. Natl. Acad. Sci. (USA) 92:983–987.
Shulman, G.I., B.L. Rothman, T. Jue, P. Stein, R.A. DeFronzo, and R.G. Shulman 1990 Quantitation of muscle glycogen synthesis in normal subjects and subjects with non-insulin-dependent diabetes by 13C nuclear magnetic resonance spectroscopy. N. Engl. J. Med. 322:223–228.
DISCUSSION
WENDY KOHRT: Do you envision this method being used to assess visceral lipolytic activity?
GERALD SHULMAN: We are very interested in that specific question in that increased visceral lipolytic activity has been proposed to be an important factor in the pathogenesis of insulin resistance in noninsulin-dependent diabetes mellitus. I think it may be possible in the future.
WM. CAMERON CHUMLEA: Can you do spectroscopy on a region of interest or is the coil just draped over?
GERALD SHULMAN: Yes, it is possible to do localized spectroscopy and obtain spectra from a specific voxel inside a tissue bed.
ROBERT NESHEIM: Thank you very much, that was very interesting. I cannot help but be struck by the fact that 50 years ago when I was in the Army, I do not recall that we were talking about any of these subjects.
(Laughter)
Forty-five years ago, when I was in graduate school, I do not remember the vocabulary that we are talking about here, even any reference to it. My, times have changed.


