3
Principal Job
Employment Sector
In 1995, four-fifths of humanities doctorates were working in educational institutions, primarily 4-year colleges and universities. Another 11 percent were employed in business/industry, which included private for-profit companies and those self-employed. The self-employed comprised approximately one-half of this group. Not-for-profit organizations accounted for 5 percent of the doctorates, and local, state, or federal governments accounted for 4 percent (see Table 9).
- English and modern languages had the highest proportions employed in educational institutions (between 82 and 83 percent), whereas art history had the lowest (72 percent).
- Art history and English had the highest proportions of Ph.D.s employed in business/industry (both about 13 percent), whereas history had the lowest (7 percent).
- Art history and music doctorates were most likely to work in not-for-profit organizations (between 9 and 10 percent). Modern languages doctorates were least likely, at about 2 percent.
- History had the highest proportion of doctorates employed in government, nearly 8 percent.
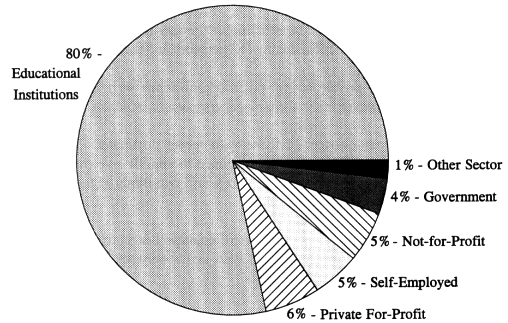
Figure 5.
Employed humanities Ph.D.s, by sector of employment, 1995.
Occupation
In 1995 nearly two-thirds of humanities doctorates were employed as teachers—primarily at the postsecondary level. The second most frequent occupation was manager/executive/ administrator (13 percent). Writer/artist/media jobs were held by 5 percent of humanities doctorates. The remainder was spread over many disparate occupational categories (see Table 10).
- Modern languages and philosophy had the highest proportion of postsecondary teachers (between 64 and 65 percent). Art history doctorates had the lowest proportion (56 percent).
- Historians had the highest proportion of managers/executives/administrators (16 percent), whereas classics had the smallest proportion (7 percent).
- Music doctorates had over twice the average proportion of writer/artist/media jobs (11 percent). Fifteen percent of art history doctorates were curators.
Major occupations varied by employment sector and by number of years since receiving the Ph.D. (see Tables 11 and 12).
- Predictably, most of those working in educational institutions were teachers (80 percent), but 11 percent were managers, including deans, administrators, and department chairs.
- The occupations most frequently listed by those in private for-profit companies were artists/ writers/media specialists (20 percent); managers/executives/administrators (19 percent); and computer occupations (17 percent).
- The occupation most frequently listed by those who were self-employed was writer/artist/ media specialist (36 percent). The next highest proportions were in management-related occupations (14 percent), sales/marketing (12 percent), and management (9 percent).
- One-fourth of those in private not-for-profit organizations were clergy/religious workers; one-fourth of those in government were managers/executives/administrators.
- Slightly less than three-quarters of those with recent doctorates (5 years or less) were postsecondary teachers. This proportion declined to slightly over half of those who held doctorates for 16 to 25 years and then rose to nearly two-thirds of those with more than 25 years since they received their doctorates.
- About 4 percent of new doctorates were managers/executives/administrators. This proportion increased to 11 percent after 15 years and to between 16 and 17 percent for those who held doctorates for more than 16 years.
Focus on Academe
The following is a more detailed look at the 76 percent of employed humanities Ph.D.s who were working in academe in 1995. (Academe includes two-year and four-year colleges, universities, medical schools, and university-affiliated research institutes.) This section examines the rank and tenure status of humanists, how quickly they moved through the ranks, and whether this path differed by field or gender.
Academic Rank
In 1995 about 38 percent of humanists employed in academe were full professors. One-quarter (26 percent) were associate professors. Over 18 percent were assistant professors, and 9 percent were instructors, lecturers, or adjunct faculty members (see Table 13).
- History (47 percent) and classics (43 percent) had the highest proportions of full professors. These fields also had the oldest doctorates. Art history, with a younger-than-average age distribution, had the smallest proportion of full professors (28 percent). Modern languages, which falls just on the mean in age distribution, had the next lowest proportion of full professors (31 percent).
- These proportions were nearly reversed with regard to associate and assistant professors. History and classics had the lowest proportions of associate professors (22 and 18 percent, respectively) and low proportions of assistant professors (between 15 and 16 percent each). Modern languages had the highest proportions, with 31 percent ranked as associate professors and 24 percent as assistant professors. Art history was also above the norm in these proportions.
- One can trace, in cross-section, the career path of those academically employed after receiving the doctorate. Of those with 5 years or less since the Ph.D., only 3 percent were full professors and 61 percent were assistant professors. Between 6 and 15 years since the doctorate, 16 percent were full professors and 47 percent were associate professors. After 16 to 25 years 57 percent were full professors, and after 25 years 75 percent were full professors (see Table 14).
- Women, however, did not achieve the rank of full professor in the same proportions as men. At 5 years or less since the Ph.D., the rank profiles for men and women were very similar: the proportions of men at full professor, associate professor, and assistant professor levels were only about 1 percent greater than those of women. However, the rank profiles diverged with age. After 6 to 15 years, 21 percent of men and 10 percent of women were full professors; after 16 to 25 years, the comparable figures were 62 and 47 percent. After 25 years, 77 percent of men and 63 percent of women were full professors.
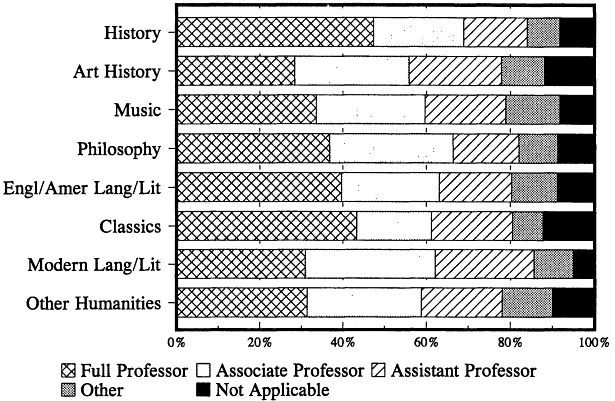
Figure 6.
Faculty status of academically employed humanities Ph.D.s, by field, 1995.
Tenure
In 1995, 61 percent of humanities doctorates employed in academe were tenured, 16 percent were on a tenure track, and 7 percent were not on a tenure track. Of the rest, 5 percent were at institutions without a tenure system, and 11 percent were in positions to which tenure did not apply (see Table 15).
- History and philosophy had the highest proportions with tenure (both at approximately two-thirds). Art history and "other humanities" had the lowest proportions (about 55 percent).
- The proportions not tenured but on a tenure track ranged from 11 percent of philosophers to 21 percent of modern language doctorates.
- Again, one can trace in cross-section how tenure is gained over the career. At 5 years or less since the Ph.D., only 12 percent of academically employed humanists had tenure. At 6 to 15 years since the doctorate, 59 percent had tenure. By the time 16 to 25 years had passed, 77 percent had tenure. This proportion increased substantially, to 89 percent, for those with more than 25 years since the doctorate (see Table 16).
- After 5 years since the Ph.D., women fell behind men in achieving tenure. Until that time, about 12 percent of both men and women had tenure. At 6 to 15 years, however, 65 percent of men and only 51 percent of women had tenure. At 16 to 25 years, 81 percent of men and 69 percent of women had tenure. After 25 years the disparity had continued to increase: 92 percent of men and 75 percent of women had tenure. It should be noted that these comparisons are made by years since doctorate, rather than years in the work force. Women are likely to have more career interruptions than men, which could account for some of the observed disparities.
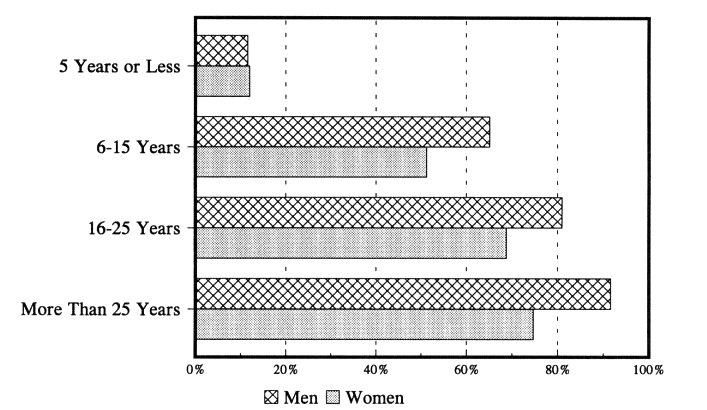
Figure 7.
Proportion of academically employed humanities Ph.D.s with tenure, by time since Ph.D. and gender, 1995.
Primary Work Activity
In 1995, 56 percent of humanists listed teaching as their primary work activity or the activity on which they spent the most hours during a typical week on the job. This corresponds with the high proportion who were academically employed. The next most frequently mentioned primary work activity was management/administration (15 percent). Research and writing/editing each were named by between 7 and 8 percent (see Table 17).
- Music, modern languages, English, and classics had the highest proportions of those with teaching as their primary work activity (all at 59 percent).
- History and art history had the lowest proportions of doctorates who indicated that their primary work activity was teaching (52 percent).
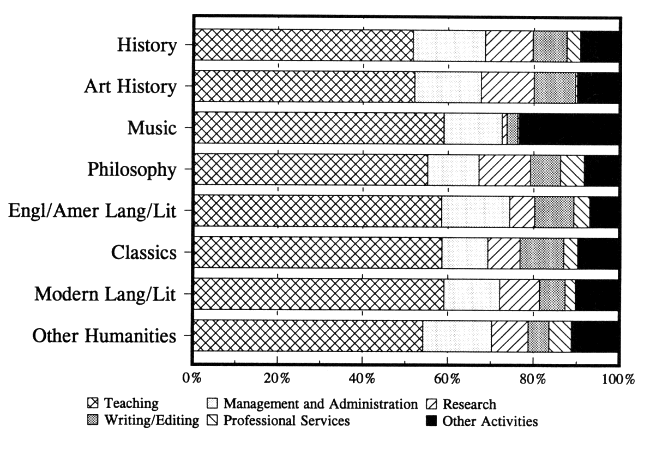
Figure 8.
Employed humanities Ph.D.s, by primary work activity and field, 1995.
-
- Historians (17 percent) were most likely to be in management and administration, while classicists (11 percent) were least likely. Art historians were most likely to be engaged in research (12 percent, along with philosophers) and writing/editing (10 percent, along with classicists), while musicians were least likely to be engaged in either of these primary activities (under 3 percent).
- Recent Ph.D.s (those with 5 years or less since the doctorate) were more likely than other doctorates to name teaching as their primary work activity—69 percent, which declined to 52 percent after 16 to 25 years. While only 6 percent of new Ph.D.s reported management/ administration as their primary activity, this increased to 19 percent after 15 years. Writing/ editing grew slightly, from 5 to 7 percent, throughout the career (see Table 18).
Salary
In 1995 the median salary for humanities Ph.D.s was $45,000. (Median annual salaries were based on full-time employed individuals, excluding those self-employed.)
- For those with 5 years or less since the doctorate, the median salary was $34,000. This progressed to $60,400 for those with the doctorate over 25 years. For men the progression was from $33,600 to $61,800; for women, $34,000 to $55,000. Thus, in terms of career age, younger women earned about the same as younger men, but older women earned less than older men (see Table 19).
- By field, history doctorates had the highest median salaries, at $50,000. Both male and female history doctorates had higher median salaries than other doctorates, $51,000 and $43,000, respectively (although female classicists were at about the same level as female historians). Overall, music doctorates earned the lowest salaries—$40,000. Salaries for different fields tended to diverge slightly over the years, with larger field differentials as years since the doctorate increased.
- Those working in the private for-profit sector and in government earned more than those working in academe, about $56,000 compared with $45,000. The lowest median salary was in the private not-for-profit sector, $40,000. Salary differences between men and women ranged from $1,000 in the private for-profit sector ($57,000 for men and $56,000 for women) to an $8,000 difference at educational institutions—$48,000 versus $40,000 (see Table 20).
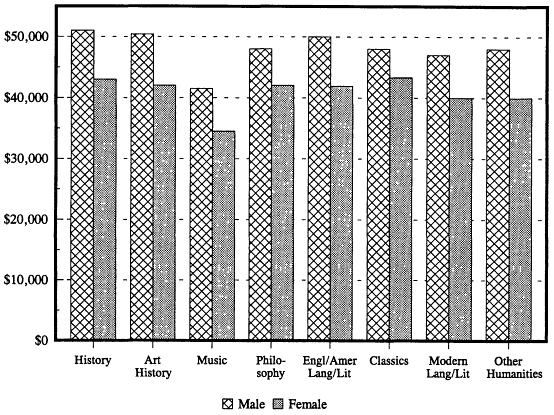
Figure 9.
Median annual salaries of humanities Ph.D.s, by field and gender, 1995.
Government Support Status
In 1995, 6 percent of humanities doctorates received support from the federal government in the form of contracts or grants. What fields were most likely to receive grants and what agencies were most likely to award them?
- Twelve percent of those in art history received grants or contracts, whereas only 4 percent of those in music and English received federal support (see Table 21).
- Those working in the private not-for-profit sector were more likely than those in other sectors to receive grants or contracts: 20 percent received support compared with only 4 percent in academe (see Table 22).
- One-quarter of those receiving grants or contracts received them from the National Endowment for the Humanities, whereas one-fifth received support from the U.S. Department of Education.
Relationship of Principal Job to Doctoral Degree
The questionnaire asked humanities doctorates about the relationship between their principal job and their doctoral field as one measure of the link between education and careers. Overall, 67 percent of humanities doctorates indicated that their jobs were closely related to their doctoral degrees, 19 percent said their jobs were somewhat related, and 14 percent said their jobs were not related to their degrees (see Table 23).
- Art historians were ahead of other fields in this respect: 79 percent indicated that their job was closely related to their doctoral field (music was second at 71 percent). Classics and English doctorates had the lowest score for closely related jobs, 65 percent, and almost one-quarter of classicists had jobs that were not related to their degree (compared to under 10 percent of art historians).
- When ''closely related'' and "related" are combined, "other humanities" joined art history and music with the highest scores, all around 90 percent. Just over three-quarters of classicists had "closely related" or "related" jobs.
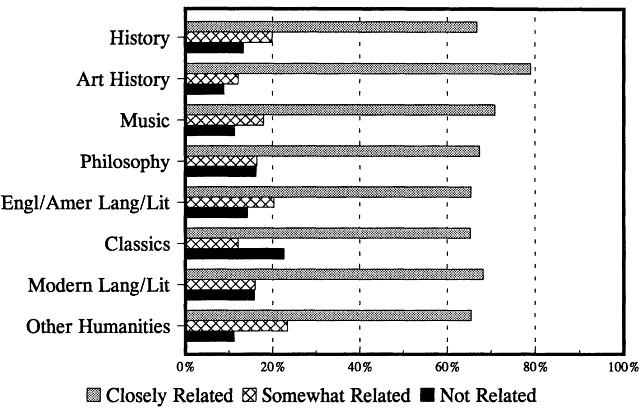
Figure 10.
Humanities Ph.D.s, by relationship of job to doctoral field, 1995.
- Of those humanists whose jobs were not related to their doctoral degrees, over two-fifths (44 percent) said the most important reason was a lack of jobs in their doctoral field. Another fifth (22 percent) said they were working outside their degree field because of a change in career or professional interests, and 17 percent said the pay and promotion opportunities were better in another field (see Table 24).


