2
Employment and Unemployment
Employment Status
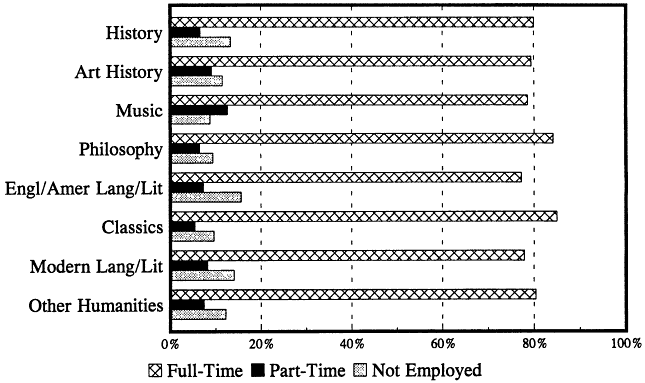
This chapter presents the employment status of humanities doctorates in 1995, describing the proportions who were employed full-time, employed part-tune, or not employed (including those seeking employment, those retired, and all others not working).
- In 1995, 79 percent of all humanities doctorates were employed full-time. Field rates ranged from a high of 85 percent in classics to a low of 77 percent in English (see Table 4).
- Almost 8 percent of humanities doctorates were working part-time. By field, this ranged from 13 percent in music to 5 percent in classics.
- Another 13 percent were not employed, the majority of whom (9 percent of the total population) were retired. English, modern languages/literature, and history had the highest retirement rates (10 to 11 percent); music and art history had the lowest rates (both about 6 percent).

Figure 3.
Humanities Ph.D.s, by field and employment status, 1995.
Reasons for Not Working
- Of those not working (13 percent of the total population), the large majority (70 percent) named retirement as their reason. History doctorates were most likely to cite this reason for not working (74 percent) (see Table 5).
- Next to retirement, the reason most frequently given for not working was ''suitable job not available'' (12 percent). "Other humanities" doctorates were most likely to cite this reason (14 percent), whereas history doctorates were least likely to cite it (9 percent).
- The third most frequently cited reason was "did not need or want to work" (11 percent).
Reasons for Part-Time Employment
- Overall, more than two-fifths (43 percent) of humanities doctorates who were working part-time indicated that this was because a suitable full-time job was not available. Nearly one-half of modern language and "other humanities" doctorates cited this reason for being employed part-time (see Table 6).
- The second most frequent reason, "did not need or want to work full-time," was cited by 29 percent of the humanists who held part-time employment.
- Retirement was the third most frequent reason (24 percent) given for working part-time. One-third of English doctorates working part-time gave this reason compared with 18 percent of music doctorates so employed.
Unemployment Rates
When those who were retired and those who were not employed and not seeking work are removed from the data set, the residual is the labor force. In 1995 the size of the humanities labor force was 100,800 (compared with 113,700 in the total humanities population). The labor force is used as the base in unemployment rate calculations because it excludes those who are voluntarily not employed.
This section examines the unemployment picture of all humanities doctorates and recent graduates. Recent graduates are defined as doctorates who earned their degrees between 1990 and 1994. A 5-year period was chosen to allow sufficient numbers for analysis.
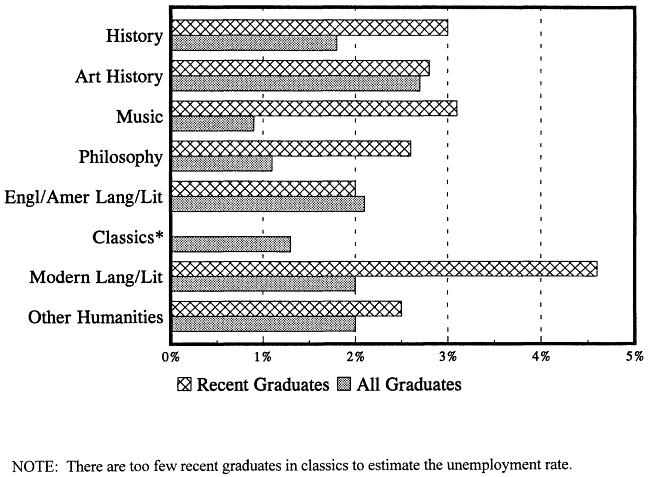
- In 1995, 1.8 percent of all humanities doctorates in the labor force were unemployed and looking for work. Art history, at 2.7 percent, had the highest rate, whereas philosophers and classicists had the lowest rates, 1.1 and 1.3 percent, respectively (see Table 7).
- By gender, the 1995 unemployment rate was 1.3 percent for men and 2.8 percent for women. Among recent graduates, the male/female disparity was similar, but overall rates were higher: 4.4 percent of recent female graduates were unemployed compared with 1.7 percent of recent male graduates.
- Those who graduated between 1990 and 1994 had higher unemployment rates: 3.0 percent were unemployed. Among the recent graduates, modern languages doctorates had the highest unemployment rate, 4.6 percent, while English doctorates had the lowest, 2.0 percent (see Table 8).

Figure 4.
Unemployment rates for all humanities Ph.D.s and recent graduates, by field, 1995.


