
This paper was presented at a colloquium entitled “Genetics and the Origin of Species,” organized by Francisco J.Ayala (Co-chair) and Walter M.Fitch (Co-chair), held January 30–February 1, 1997, at the National Academy of Sciences Beckman Center in Irvine, CA.
Long term trends in the evolution of H(3) HA1 human influenza type A
WALTER M.FITCH*†, ROBIN M.BUSH*, CATHERINE A.BENDER‡, AND NANCY J.COX‡
*Department of Ecology and Evolutionary Biology, University of California, Irvine, CA 92692; and ‡Influenza Branch, Center for Disease Control and Prevention, Atlanta, GA 30333
ABSTRACT We have studied the HA1 domain of 254 human influenza A(H3N2) virus genes for clues that might help identify characteristics of hemagglutinins (HAs) of circulating strains that are predictive of that strain’s epidemic potential. Our preliminary findings include the following. (i) The most parsimonious tree found requires 1,260 substitutions of which 712 are silent and 548 are replacement substitutions. (ii) The HA1 portion of the HA gene is evolving at a rate of 5.7 nucleotide substitutions/year or 5.7×10⁻³substitutions/site per year. (iii) The replacement substitutions are distributed randomly across the three positions of the codon when allowance is made for the number of ways each codon can change the encoded amino acid. (iv) The replacement substitutions are not distributed randomly over the branches of the tree, there being 2.2 times more changes per tip branch than for non-tip branches. This result is independent of how the virus was amplified (egg grown or kidney cell grown) prior to sequencing or if sequencing was carried out directly on the original clinical specimen by PCR. (v) These excess changes on the tip branches are probably the result of a bias in the choice of strains to sequence and the detection of deleterious mutations that had not yet been removed by negative selection. (vi) There are six hypervariable codons accumulating replacement substitutions at an average rate that is 7.2 times that of the other varied codons. (vii) The number of variable codons in the trunk branches (the winners of the competitive race against the immune system) is 47±5, significantly fewer than in the twigs (90±7), which in turn is significantly fewer variable codons than in tip branches (175±8). (viii) A minimum of one of every 12 branches has nodes at opposite ends representing viruses that reside on different continents. This is, however, no more than would be expected if one were to randomly reassign the continent of origin of the isolates. (ix) Of 99 codons with at least four mutations, 31 have ratios of non-silent to silent changes with probabilities less than 0.05 of occurring by chance, and 14 of those have probabilities <0.005. These observations strongly support positive Darwinian selection. We suggest that the small number of variable positions along the successful trunk lineage, together with knowledge of the codons that have shown positive selection, may provide clues that permit an improved prediction of which strains will cause epidemics and therefore should be used for vaccine production.
Human influenza is an annual cause of morbidity and mortality world-wide which has a cumulative impact that is greater than the effects of the pandemics that occur every 20–30 years (1). The principle way to reduce this health problem is by vaccination. However, human influenza genes rapidly incorporate new mutations, mutations that cause changes in the hemagglutinin (HA) molecule, the major molecule to which the immune system makes its humoral response. The effect of these mutations is to change the HA molecule so that, at least temporarily, it is no longer recognized by these antibodies, thereby permitting the virus to multiply. For this reason, old vaccines lose their efficacy and new ones must be made with viruses having the altered HAs. That in turn raises the question of which of today’s strains should be used to make that vaccine; that is, which of today’s strains is most likely to be the progenitor of the of next year’s epidemic strains. Vaccines are now selected on the basis of knowing which of the current strains are least reactive to current antibodies (on the assumption that these strains have the best opportunity to spread) and which strains seem currently to be spreading the most effectively. Nevertheless, it would be useful to develop better predictive methods of deciding that question. It is the purpose of this paper to begin exploring how a knowledge of the evolutionary history of the HA gene might contribute to improved prediction of epidemic strains and of the strain of choice for the next vaccine. We shall explore the issues of (i) the rate of evolution, (ii) mutations occurring during virus propagation in the laboratory, (iii) the intercontinental spread of the influenza virus, (iv) the mutabilities of the different coding sites along the gene, and (v) sites subjected to strong selection.
DATA, DEFINITIONS AND METHODS
Data. This study utilizes 254 nucleotide sequences for the HA1 gene of HA obtained from human influenza A(H3N2) viruses isolated from 1984 to 1996. This time period was chosen because the previous period from 1968 to 1983 was sparsely sampled. Isolates A/Oita/83 and A/Caen1/84 were chosen to root the tree. Isolates A/Texas/12835/83 and A/Texas/12764/83 were included because their HAs were located on the tree among the 1984 and later isolates and it was felt that one should use as dense a tree as possible. We know the geographical location from which all the viruses were obtained and the month of isolation of 206 of these isolates. Of the 254 isolates, 160 were from the four years, 1993–1996, the other 94 were from the preceding 9 years. These sequences were all 329 codons (987 nucleotides) long with no gaps required for homologous alignment.
Viruses were isolated from the original clinical sample either in embryonated hens eggs or in Madin-Darby canine kidney. Spafas, chicken kidney, or monkey kidney cell culture. The substrate for virus propagation was eggs for 126 strains, kidney cells for 95 strains, and, at least partly, unknown for 30 strains.
© 1997 by The National Academy of Sciences 0027–8424/97/947712–7$2.00/0 PNAS is available online at http://www.pnas.org.
For three clincal isolates, the sequence was obtained directly without isolation in eggs or cell culture. Viruses with passages in both hens’ eggs and kidney cells were assigned to the egg category.
Definitions. There are various ways of using sequences for making trees and it will be necessary to keep in mind the alternatives. Where we use the unambiguous nucleotide sequences, we shall call the inferred changes (nucleotide) substitutions. Where we use the amino acids, we shall call the inferred changes (amino acid) replacements. If we back translate the amino acid sequences into ambiguous codons, we get substitutions, but only those required to change the amino acid. These changes are called replacement substitutions—i.e., those nucleotide substitutions that cause amino acid replacements. The difference between the substitution set and replacement-substitution set is the set of silent (or synonymous) substitutions. We will distinguish substitutions, replacements, replacement substitutions, and silent substitutions as defined here. Where more than one category might be relevant to the statement or the meaning is clear, changes or mutations may be used.
The computer program numbers all the nodes of the tree, the first 254 numbers being given to the tip nodes that represent the original sequences and the next 252 numbers going to interior nodes of degree 3, nodes with three branches attached. Every branch is also labeled, and that label is the same as the label on the node to which it descends. Thus we can unambiguously speak of tip branches as well as tip nodes using the same number. We define sister nodes restrictively to be those pairs of tip sequences that, topologically, are each other’s most closely related sequence.
The trunk of the tree is defined as the set of interior nodes leading from the root down to that tip that is farthest removed from the root. In the present case, that tip is A/Wuzhou/1/96. The trunk tip is treated as a tip rather than as a trunk branch. All other branches between the trunk and tip branches are called twigs.
The mutations are assigned not only to the branches, but to the positions of the sequence as well. This enables one to count the number of codons that have changed zero, one, two,… times. These numbers can be used to determine if the mutations are being distributed randomly among the positions of the sequence. This implies a (or perhaps more than one) Poisson distribution. It is often found (and it is here) that there are a minimum of three categories of variability. One may observe a set of unvaried positions that in fact turns out to be the sum of two types of positions. The first type is the set of invariable positions, those positions that are so vital to the necessary functioning of a protein that any change in that position causes the organism (virus) to die out. The other type is the group of positions that are variable but (by chance) unvaried nevertheless. Thus the unvaried are the invariable plus the unvaried-variable. The second category are the variable positions, positions that might but need not have varied in the sample. The third category are the hypervariable positions, positions that are changing significantly faster than the variable positions. There are other ways of fitting variability to the observations, such as the γ distribution, but these three categories will serve our purposes here.
Methods. HA sequences used in this analysis were generated at the Centers for Disease Control and Prevention over a 10-year period as part of ongoing routine genetic analyses of HA genes of variant and typical influenza field strains. Influenza A(H3N2) viruses chosen for this analysis were from the collection of the Centers for Disease Control and Prevention. The abbreviation, country of origin, date of collection, and passage history of these viruses are available from the authors. Viruses were propagated at a low multiplicity of infection in embryonated eggs or kidney tissue culture. Sequence analysis for three viruses was obtained directly from the original clinical isolate by PCR. Viruses sequenced before 1993 were purified by centrifugation on a discontinuous sucrose gradient or pelleted by centrifugation for 1 hr at 35,000 rpm in a SW 50.1 rotor (Beckman Instruments) at 4°C. The methods for virus purification and subsequent isolation of RNA have been described (2). Virus, isolated or obtained after 1993, required no purification before isolation of RNA for sequence analysis.
Genomic RNA was extracted by phenol/chloroform from purified or pelleted virus (3) or from 100 µl of allantoic fluid or tissue culture media with the Qiagen RNAeasy Total RNA Purification Kit (Qiagen, Chatsworth, CA). A number of the isolates were sequenced directly from the RNA as described (4). Four internal primers complementary to the viral mRNA sense strand were used to sequence the HA1 domain of the HA genes. Primer sequences are as follows: R1073 (5′ d-CCTGCGATTGCGCCGATT), R792 (5′ D-CAGTATGTCTCCCGGTTT), R570 (5′D-TGGCATAGTCACGTTCAG) and R362 (5′ d-TAAGGGTAACAGTTGCTG). The majority of the isolates were sequenced from reverse transcription-PCR amplified single-stranded or double-stranded DNA (5, 6). Complementary DNA synthesis and PCR amplification of the HA1 domain of the HA genes were carried out using forward primer 7 (5′-CTATCATTGCTTTGAGC-3′) and reverse primer 1184 (5′-ATGGCTGCTTGAGTGCTT-3′). The PCR-derived single-stranded DNA was used as a template for the Sequenase (United States Biochemical) sequencing kit and the double-stranded DNA by dye terminator cycle sequencing chemistry using a model 373A DNA Sequencing System (Perkin-Elmer). Primers used for the latter two sequencing methods are the same as described for direct RNA sequencing.
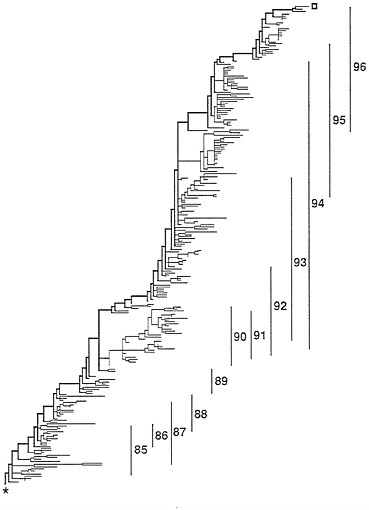
FIG. 1. Overall structure of the most parsimonious trees. The thick line running from the lower left (*=root) to the upper right (open square) is called the trunk and represents the successful H3N2 lineage. The vertical lines indicate the range of isolates from the flu years (October 1 to September 30).

FIG. 2. Rate of evolution of human influenza HA1. The y axis shows the number of replacement substitutions between the root and a tip sequence. The x axis shows the time of isolation of the virus to the month where known (206 sequences), or to the month of June if the month was not known (48 sequences). Each of the 254 sequences is represented in the graph but, if there were more than one isolate for the same month and year, their distances were averaged. A least squares fit to the data gives a slope of 3.20 replacement substitutions/year. The two tubes show an apparent increase in the rate of replacement substitutions about 1992. However, we cannot rule out the possibility that this is a consequence of a more intensive sampling of the population in the last four years.
Sequences have been deposited in GenBank under the accession numbers AF008656 to AF008909.
Most parsimonious trees were obtained from the 254 nucleotide sequences using test version 4.0d52 of the program PAUP provided by D.L. Swofford (7) using the tree bisection-reconncetion option while holding 200 trees. Where there was more than one way of assigning substitutions to the branches, we used the ACCTRAN option which accepts changes as soon as possible. When amino acid sequences were used, we assumed that the nucleotide tree was the correct topology. When we wished to determine replacement substitutions, we back-translated the amino acids into ambiguous codons using the ANCESTOR program (8). Poisson fits to the substitution frequencies were by the method of Fitch and Markowitz (9).
RESULTS
The Tree. The most parsimonious tree found, 1,260 substitutions in length, is shown in Fig. 1. Of the 1,260 substitutions, 548 were replacement substitutions while 712 were silent substitutions. There are 116 branches with no substitutions on them. In Fig. 1, all the branches that were of zero length in all examined most-parsimonious trees have been collapsed to
Table 1. The distribution of replacement substitutions over the codon positions
produce ancestral nodes that give rise, not to 2 immediate descendants, but 3–10 immediate descendants. If one were to resolve these nodes to produce all possible, strictly bifurcating, most parsimonious trees, there would be in excess of 1050 different trees. The tree presented, through its multichotomous nodes, is an accurate rendering of that information common to all of those many trees. The root is the lower leftmost node of the tree while the trunk tip is the upper rightmost tip of the tree. The trunk comprises the upper, thick branches of the tree. Thirty sequences are ancestral to other sequences.
To the right of the tree are vertical bars that indicate the range of the isolates by year. A peculiarity of those ranges is that there is essentially no overlap between isolates of 1988 and 1989, as if the 1989 form was so fit that all of the 1988 lineages were eliminated. By contrast, 1990 off-trunk strains were surviving to give rise to descendants isolated in every year from 1990 through 1994.
Rate of Evolution. The distance of the tips from the root may be plotted against the month of their isolation where known, at June otherwise, and the result is shown in Fig. 2. The slope is 5.67 substitutions/year or 5.7×10⁻³ substitutions/ nucleotide per year. This is consistent with previous estimates
Table 2. The distribution of replacement substitutions over the branch types
Table 3. The distribution of tip replacement substitutions according to method of DNA amplification
of 5.7×10⁻³ (10) and 6.7×10⁻³ (11). The overall rate for replacement substitutions is 9.7×10⁻³ codons/year. But if the faster rate in the recent time period reflects discovering more of the substitutions that occur, then a better estimate of the rate of HA1 evolution is 16×10−3 replacement substitutions/ codon per year.
By estimating the average age of the tip isolates measured from the time when they branched off the trunk, we can get an estimate of how long the losers survive. The average number of substitutions from trunk to tip is only 8.07. Given the rate of evolution as 5.67 substitutions/year, the average age of the tips is only 1.42 years. The longest lived branch is 4.8 years old.
Replacement Substitutions by Codon Position. Table 1 shows the distribution of replacement substitutions by codon position. The number of each of the 61 nonterminating codons for all 254 sequences was determined. Because we know how many ways each codon can change in the first, second, and third positions so as to change the encoded amino acids, we can immediately estimate the expected number of times a replacement substitution would occur in each of the three codon positions if the 548 replacement substitutions were distributed randomly over the codons (12). One can readily see that they are distributed randomly. While one expects more changes in the second position than in the first position, as we get here, the more common result with other genes is that more replacement substitutions occur in the first than in the second position. This is usually attributed to substitutions being more conservative if they occur in the first position. Thus more radical changes may be permitted in HA.
Replacement Substitutions by Branch Type. The number of replacement substitutions for each of the three types of branches, trunk, twig, and tip, are shown in Table 2. Also shown are the expected values if the 547 changes were distributed randomly over the branches. The table shows that the distribution is radically different from that expected for a random distribution. The tips have a greater than expected number of replacement substitutions, while the trunk and twigs have too few. Indeed the tips have more than 2.2 times as many changes per branch as do the other branches. This amounts to about 0.8 extra changes on each tip.
Table 4. Distribution of replacement substitutions over the codons
Table 5. Poisson fit of trunk replacement substitutions
We asked whether these additional changes are specific to the host substrate used for culture. Accordingly, Table 3 shows the distribution of those changes according to the host in which the virus was propagated and the expected distribution if there were no differences among the amplification methods with respect to their adding extra changes into the tip branches. It can be seen that there is no difference in the number of changes among the tip branches as a function of the host.
Replacement Substitutions by Codon. One may ask whether the replacement substitutions have a random (Poisson) distribution over the codons of the HA gene. Table 4 shows how the changes are actually distributed. The first row shows the number of changes per codon. Values below show the number of codons in which that many changes occurred.
There are six hypervariable codons (138, 145, 156, 186, 193, and 226), all of which have been observed to have changed during growth in eggs (5, 13–15), and which have evolved more than seven times faster than the other varied codons. Their removal does not allow one to get a good fit to the remaining data, even if we introduce an invariable class. We therefore divided the changes according to whether they occurred on the trunk, twig, or tip branches. Table 5 shows the fit to the trunk data. It is a good fit and implies that there are only 46.7±5.4 variable codons. This is a very small number given that there are 329 codons altogether.
A fit to the twig data is even better but only if the hypervariable positions are removed from the data. The result is that, for the twigs, there are 90.0±7.2 variable codons. A similar calculation for the tip branches does not produce a good fit although with pooling of categories one can get the fit increased to 0.05 probability. Nevertheless, since the difficulty of fitting is in the right end of the distribution, the estimate of the number of invariable positions is not greatly affected. The result is that we estimate that the tip branches have 175.6±8.4 variable positions. The overall result is that the number of variable positions in the three classes of branches are all significantly different from each other.
One can also estimate the number of positions that are variable in the tip branches by noting that 87 positions have changed on them for strains grown in eggs and 96 for strains grown in kidney cells. Of these positions, 51 have changed in both egg- and cell-grown strains. If we assume that both growth conditions have the same variable set of codons and every
Table 6. The intercontinental movement of human influenza virus
|
Weight for Asia |
Outward |
0.999 |
1.000 |
1.001 |
|
Inward |
1.001 |
1.000 |
0.999 |
|
|
From Asia |
||||
|
Observed |
|
60 |
41.5 |
26 |
|
Expected |
63.8 |
47.3 |
32.4 |
|
|
To Asia |
||||
|
Observed |
|
8 |
18.5 |
28 |
|
Expected |
12.3 |
20.1 |
28.3 |
|
|
P |
0.18 |
0.36 |
0.25 |
|
position is equally likely to have changed regardless of the growth conditions, then the estimate of the number of variable positions required to see those observations is 87×96/51= 163.8. This is not significantly different from the 175.6±8.4 observed above.
Intercontinental Spread. By analyzing a sequence of a single letter for each isolate, where that letter represents the continent from which the isolate was obtained, and running PAUP on it, we can obtain the fewest possible intercontinental movements. That number, 41.5 changes of continent, implies that 1 of every 12 branches connects strains on two different continents. To obtain the expected number of changes, we scrambled the letters with respect to their assignment to the tips of the tree 1,000 times and found the average change for intercontinental movement given this particular tree and this particular number of representatives from each continent. The result (Table 6) was that there was no difference from random.
We also tried a weight matrix for the intercontinental changes, such that the weight from Asia was 0.999 while that to Asia was 1.001, which biases the result toward movement from Asia. The reverse weighting biases the result toward Asia. The results, also given in Table 6, show that, regardless of the weighting scheme, the intercontinental spread of human influenza is what would be expected by random movements. It also shows that the possible range of equally parsimonious movements out of Asia could range from 26 to 60. That there should be so many alternative ways of assigning change is a result of the failure of the maximum parsimony assumption that change should be rare. These results do not contradict the prevailing view that novel pandemic and epidemic strains often emerge in Asia (see Discussion).
Positive Selection. In examining the nature of the changes in the six hypervariable positions, we were struck by a preponderance of replacement substitutions over silent changes and decided to look for all cases where there was more than might be expected. Table 7 presents a list of the 31 positions that had probabilities for their distribution of non-silent/silent changes of less than 0.05. Note that the probability that a change is non-silent is p=548/1260=0.435 and that it is silent is q= 712/1260=0.565. Thus the probability of seeing codon 226 with 22 non-silent changes and 3 silent changes is 25!p22q3/ 22!3!=5×10⁻⁶. Because one cannot get a probability of less than 0.05 with a sample size of three changes, we examined only codons with at least four changes, of which there were 99. Thus 31 occurrences with a probability of less than 0.05 in a sample of only 99 is greatly unexpected (P < 10-33). Moreover, the probability that the 31 changes are divided 25 and 6 into the two halves of the distribution is only 7×10⁻⁴. Thus there is a preponderance of the excess number of improbable changes in the category of more non-silent than silent changes. This significant excess of non-silent changes means that there is positive Darwinian evolution occurring and probably at the positions listed in Table 7. The six codons with the most significant excess are the six hypervariable positions.
DISCUSSION
Rate of Evolution. The data in the plot in Fig. 2 show a clear break at 1992 with a rate of evolution that is 2.3 times greater
Table 7. Probabilities of changes for different silent and non-silent distributions
after 1992 than it was before. We think this is statistically significant but probably largely artifactual. It has been known for some time that there is a bias in parsimony reconstructions that arises from the fact that any given nucleotide position can be observed to change at most once along any given branch (16). The result is that the more densely the branches of a tree are sampled, the more of these hidden changes that are uncovered. The break in the curve occurs at 1992, precisely the year that separates the region of the tree where less than 10 isolates per year were sampled from the time where 40 isolates per year were sampled. To see if this sampling could be the reason for this apparent increase in rate, we repeated the tree several times using only 11 randomly selected isolates from each of the years 1993–1996. The result was that the break largely disappeared although the appearance of an increase was attenuated more or less according to the number of isolates sampled from the group on the far upper right of Fig. 1. We conclude that there is little evidence to support an increase in the rate of HA evolution after 1992. But if the intensity of sampling accounts for the apparent change in rate, then the rate in that portion of the tree, 16×10-3 replacement substitutions/codon per year, is the better estimate of the real rate.
Extra Replacement Substitutions on the Tip Branches. There are several possible explanations for their being extra replacement substitutions on the tips. The first explanation is as an artifact of the parsimony procedure. It may be, for a given tree, that there is more than one equally parsimonious way of placing the mutations upon the tree and these alternatives may cause more or less of the changes to occur on the tips. PAUP has a choice of two procedures, ACCTRAN and DELTRAN that bias the placement away from or toward the tips, respectively. We used only the ACCTRAN procedure, so that the bias is against
the accumulation in tips. Thus the parsimony procedure cannot be the source of extra changes. The bias is not large because using DELTRAN produced only 10 more mutations in the tips.
The second explanation arises from the observation that mutations appear to arise during passage of the virus in embryonated eggs as seen by changes in egg-grown sequences not seen in cell grown sequences (5, 13–15). There are two different mechanisms that would account for this based upon the plausible assumption that there are some changes that are selected for by growth in eggs.
One mechanism is that mutations occur in the RNA in the embryonated egg that the egg then selects. The other mechanism is that the egg selects pre-existing variants that were there in the patient but in too small amounts to be detected in the absence of the selective ability of the egg. We have no direct test that would distinguish between these two mechanisms. We can, however, ask if we see more replacement substitutions in the egg-grown isolates than in those from other methods of amplification. For the null hypothesis we use the expectation that there is no difference among the amplification methods and we get the result in Table 3. There is no significant difference among the methods of amplification. Although none of these groups are significantly different from expectation, the egg-grown isolates are the only group that has fewer than the expected numbers of changes on them, and the group with the greatest proportional excess is, of all groups, the PCR-amplified isolates. If, as has been suggested, the egg-grown sequences should have an extra change by reason of growth in eggs, we should surely have seen it. The tips are getting 0.8 extra mutations above the baseline of only 0.66 changes/non-tip branch. Thus the 212 excess mutations, if largely from the 126 egg-grown isolates, would have shown up readily. It cannot be that some special process in egg growth is responsible for the extra changes in the tip branches. In the one case where there are two sequences from the same isolate, the sequence grown in cells has two changes, the sequence grown in eggs has only one relative to their common ancestral sequence. In any event, no explanation that requires one to distinguish among the methods of growth will account for the tip excess.
We are aware that these results apparently contradict considerable evidence demonstrating that when specimens from the same patient are grown both in eggs and in cells, the HA genes of egg-grown isolates commonly have additional changes when compared with the HA genes of the corresponding cell-grown isolates (5, 13–15). Those data show an approximate average of one replacement in the egg-grown material that is not present in the cell-grown material, suggesting that tip branches to egg-grown isolates should, on average, be farther removed from their closest ancestor than are cell-grown isolates. Our isolates are, on average, 1.5 replacement substitutions different from their closest ancestor. This value does not differ between egg-grown isolates and cell-grown isolates. Perhaps there are experimental conditions that differ between these two sets of data. We do not know the source of these differences but the question appears important enough to warrant further study to resolve this conflict.
A third explanation is bias in the choice of strains to sequence. All viruses that appear to be new variants as determined by the standard serological analyses performed at Centers for Disease Control and Prevention are chosen for HA sequence analysis. A few representative strains are also chosen, but the emphasis is on sequencing variants. This should make these sequences, on average, have a greater number of differences than sequences chosen at random. This bias should apply specifically to the tip branches and hence differentiate them alone. We do not know the extent to which this bias accounts for the observation but we know of no reason why it could not be the complete reason.
A fourth explanation is the presence of deleterious mutations in the population. If most changes are deleterious, most changes will eventually be removed by selection but they may well be present in our samples. They, like those that might occur during egg passage, will not end up in the trunks and twigs determined, years later (17). The result of that process would be longer tips. Like the third explanation, we do not know how much of the effect seen is due to this mechanism, but it too might account for the whole effect. Nor can we partition the excess between the two explanations.
Replacement Substitutions by Codon. The analysis showed that the trunk has only a small number of variable codons (47, of which 17 have not changed). This is only 18% of the codons available. If the trunk represents the victorious lineage in the race to outrun the immune system, then one area in which to focus future study would be the 30 sites that have changed in the trunk, for it is among these that successful changes in HA must have occurred. The tip branches have 175 variable codons. Variable codons, for data from widely divergent species, mean sites that have successfully replaced amino acids since some common ancestor. These sites would only rarely have unselected deleterious changes among their differences. But at the population level, that is not true. The tip branches do have extra mutations on them and, whether they were induced by growth in eggs or kidney cells, or chosen by the investigators, or are simply the sampling of population variants, those extra mutations may all be deleterious. While one normally thinks of variable codons being those that have at least one alternative amino acid that is not deleterious, in this case that is not necessarily so because we could be seeing alternatives before selection has filtered them out. Thus there is nothing wrong with there being extra changes on the tip branches nor that there are many more variable codons for them. It is reasonable to expect more variable codons if we can include deleterious mutations that selection will remove.
Intercontinental Spread. It has been shown that the viruses causing pandemics, and even the year-to-year epidemics, emerge from Asia (18, 19). The fact that we observed that the intercontinental spread is random should not be thought of as arguing against that belief. There is no necessity that the relatively rare new successful variants come from a source that sends out an abnormally fewer or greater number of strains than a chance distribution would predict.
Positive Selection. We have observed 25 codons that have significantly more non-silent changes than silent changes. Because silent changes might be expected to reflect the neutral rate of evolution, an excess can be construed as indicating positive Darwinian evolution. This is usually done by counting a pool of codons to get a statistically large enough sample to get significance. In this case were are looking at single codons but getting the large enough sample size by using those codons with at least four changes. By focusing on those codons one at a time, we are thus able to define individual positions as each having positive selection occurring in them. In this case, 14 positions have less than 0.005 probability of having the excess of non-silent changes as shown in Table 7. These 14 positions have accumulated 194 mutations or 35.4% of all the replacement substitutions observed, suggesting that positive Darwinian selection accounts for a large portion of all the changes observed. In addition, the rate of change is 10% faster on the trunk than on the twigs (see Table 2). All but three of these positions (137, 138, and 196) have changed along the trunk and thus we have another reason to regard these positions as important in the changes made by the virus to evade the immune system. Position 138 is interesting because it has had 22 non-silent changes, none of which occurred on the trunk. This is perhaps because favorable mutations may still be selected for in any lineage that has not yet died out.
Future Studies. It is possible, with the identification of only a few positions that have changed on the trunk, and with the
identification of positions that are under positive Darwinian selection, that we now have most of the residues on which the virus depends for immune avoidance. The next step might be-to see which of these position changes cause differences in the HA inhibition assays and to quantify them. This might then lead to knowing, simply from sequence changes, which isolates are most likely to cause future epidemics.
We gratefully acknowledge the technical expertise contributed by Huang Jing and Donna Sasso and sequences contributed by Dr. Setsuto Nakajima.
1. Cox, N.J. & Bender, C.A. (1995) Semin. Virol. 6, 359–370.
2. Cox, N.J., Bai, Z.S. & Kendal, A.P. (1983) Bull. WHO 61, 143–152.
3. Cox, N.J., Kitame, F., Kendal, A.P., Maassab, H.F. & Naeve, C. (1986) Virology 167, 554–567.
4. Rocha, E., Cox, N.J., Black, R.A., Harmon, M.W., Harrison, C.J. & Kendal, A.P. (1991) J. Virol. 65, 2340–2350.
5. Rocha, E.P., Xu, X., Hall, H.E., Allen, J.R., Regnery, H.L. & Cox, N. (1993) J. Gen. Virol. 74, 2513–2518.
6. Xu, X., Rocha, E.P., Regnery, H.L., Kendal A.P. & Cox, N.J. (1993) Virus Res. 28, 37–55.
7. Nakajima, J., Nakajima, K. & Kendal, A.P. (1983) Virology 131, 116–127.
8. Fitch, W.M. (1971) Syst. Zool. 20, 406–416.
9. Fitch, W.M. & Markowitz, E. (1970) Biochem. Genet. 4, 579– 593.
10. Hayashida, H., Toh, H., Kikuno, R. & Miyata, T. (1985) Mol. Biol. Evol. 2, 289–303.
11. Fitch, W.M., Leiter, J.M.E., Li, X. & Palese, P. (1991) Proc. Natl. Acad. Sci. USA 88, 4270–4274.
12. Fitch, W.M. (1973) J. Mol. Evol. 2, 123–136.
13. Hardy, C.T., Young, S.A., Webster, R.G., Naeve, C.J. & Owens, R.J. (1995) Virology 211, 302–326.
14 Gubareva, L.V., Wood, J.M., Meyer, W.J., Katz, J.M., Robertson, J.J., Major, D. & Webster, R.G. (1994) Virology 199, 89–97.
15. Meyer, W.J., Wood, J.M., Major, D., Robertson, J.S., Webster, R.G. & Katz, J., M. (1993) Virology 196, 130–137.
16. Fitch, W.M. & Bruschi, M. (1987) Mol. Biol. Evol. 4, 381–394.
17. Golding, G.B., Aquadro, C.F. & Langley, C.H. (1986) Proc. Natl. Acad. Sci. USA 83, 427–431.
18. Webster, R.G., Bean, W.H., Gorman, O.T., Chambers, T. & Kawaoka, Y. (1992) Microbiol. Rev. 56, 152–179.
19. Cox, N.J., Brammer, T.L. & Regnery, H.L. (1994) Eur. J. Epidemiol. 10, 467–470.


