
This paper was presented at a colloquium entitled “Genetics and the Origin of Species,” organized by Francisco J.Ayala (Co-chair) and Walter M.Fitch (Co-chair), held January 30–February 1, 1997, at the National Academy of Sciences Beckman Center in Irvine, CA.
Vagaries of the molecular clock
(molecular evolution/rates of evolution/glycerol-3-phosphate dehydrogenase/superoxide dismutase)
FRANCISCO J.AYALA
Department of Ecology and Evolutionary Biology. University of California, Irvine, CA 92697–2525
ABSTRACT The hypothesis of the molecular evolutionary clock asserts that informational macromolecules (ie., proteins and nucleic acids) evolve at rates that are constant through time and for different lineages. The clock hypothesis has been extremely powerful for determining evolutionary events of the remote past for which the fossil and other evidence is lacking or insufficient. I review the evolution of two genes, Gpdh and Sod. In fruit flies, the encoded glycerol-3-phosphate dehydrogenase (GPDH) protein evolves at a rate of 1.1×10⁻¹⁰amino acid replacements per site per year when Drosophila species are compared that diverged within the last 55 million years (My), but a much faster rate of ˜4.5×10⁻¹⁰replacements per site per year when comparisons are made between mammals (˜70 My) or Dipteran families (˜100 My), animal phyla (˜650 My), or multicellular kingdoms (˜1100 My). The rate of superoxide dismutase (SOD) evolution is very fast between Drosophila species (16.2×10⁻¹⁰replacements per site per year) and remains the same between mammals (17.2) or Dipteran families (15.9), but it becomes much slower between animal phyla (5.3) and still slower between the three kingdoms (3.3). If we assume a molecular clock and use the Drosophila rate for estimating the divergence of remote organisms, GPDH yields estimates of 2,500 My for the divergence between the animal phyla (occurred ˜650 My) and 3,990 My for the divergence of the kingdoms (occurred ˜1,100 My). At the other extreme, SOD yields divergence times of 211 My and 224 My for the animal phyla and the kingdoms, respectively. It remains unsettled how often proteins evolve in such erratic fashion as GPDH and SOD.
The hypothesis of the molecular clock of evolution was put forward in the 1960s (1–3) and has prompted much research and yielded important results ever since. The neutrality theory of molecular evolution (4–7) provided a mathematical formulation of brilliant simplicity, which made the clock hypothesis amenable to precise empirical testing. Tests have shown that molecular clocks are more erratic than allowed by the neutrality theory, but the issue of how dependable the clocks are is for from, settled. In this paper, I review the evolution of two genes that exhibit peculiar patterns. Gpdh behaves erratically in fruit flies over the last 100 million years (My). It evolves extremely slowly in Drosophila, faster in the related genus Chymomyza, and faster still in the medfly Ceratitis; the rates differ by a factor of 4 or more. The second gene, Sod, evolves fairly regularly in fruit flies, although much faster than Gpdh. When comparisons are made between organisms that diverged over very broad time ranges, extending to 1,000 My ago, the behavior of the two genes becomes reversed: Gpdh evolves fairly regularly, whereas the rate of Sod evolution becomes increasingly slower as comparisons are made between mammal orders, between animal phyla, and between multicellular kingdoms.
Evolution of Glycerol-3-Phosphate Dehydrogenase (GPDH) in Diptera
The nicotinamide-adenine dinucleotide (NAD)-dependent cytoplasmic GPDH (EC 1.1.1.8) plays a crucial role in insect flight metabolism because of its keystone position in the glycerophosphate cycle, which provides energy for flight in the thoracic muscles of Drosophila (8). In Drosophila melanogaster the Gpdh gene is located on chromosome 2 (9) and consists of eight coding exons (10, 11). It produces three isozymes by differential splicing of the last three exons (12). The enzyme is known to be evolutionarily conserved (10), displaying very low heterozygosity within or variation among Drosophila species (13).
The GPDH polypeptide can be divided into two main domains, the NAD-binding domain and the catalytic domain. The NAD-binding domain (which in the rabbit is encompassed by the first 118 amino acids) is more highly conserved than the catalytic domain (10). Here I will, analyze in 9 fruit fly species a Gpdh gene region comprising most of the coding sequence of exons 3–6 (768 bp of 831 bp), corresponding to 45 codons of the NAD-binding domain plus the whole catalytic domain. The methods of DNA preparation, amplification, cloning, sequencing, and sequence analysis are described in refs. 14 and 15, where the sources of the fruit fly stocks also are given. The present analysis focuses on 9 species, although a total of 27 fruit fly species have been analyzed (14, 15).
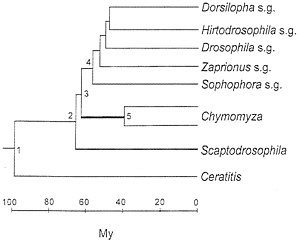
The taxonomy of the nine species is displayed in Table 1. The medfly, Ceratitis capitata, belongs to the family Tephritidae. The family Drosophilidae is represented by three genera; and the Drosophila genus is, in turn, represented by five subgenera. The phylogeny of the species (represented by their subgenus or genus names) is shown in Fig. 1. This phylogeny is statistically superior to any alternative configuration (14). In any case, the only issues that arise concern (i) whether Chymomyza is the sister group to Drosophila, with Scaptodrosophila being their outgroup (as in Fig. 1) or whether Scaptodrosophila is the sister group to Drosophila, with Chymomyza being their outgroup; and (ii) the branching order of the Drosophila subgenera (14). Neither of these two issues is of substantial import for the present purposes.
The amino acid distances between the fruit fly species are given in Table 2 (above the diagonal). Table 3 gives averages (x¯) of these distances, as well as the rate, expressed in units of 10-10 amino acid replacements per site per year. It is apparent in Tables 2 and 3 that the rate of GPDH evolution is not constant. The apparent rate of amino acid replacement is 1.1 when species of different subgenera are compared (and also when these species are compared with Scaptodrosophila), but
© 1997 by The National Academy of Sciences 0027–8424/97/947776–8$2.00/0 PNAS is available online at http://www.pnas.org.
Table 1. Taxonomy of nine fruit fly species
|
Family |
Genus |
Subgenus |
Species |
|
Tephritidae |
Ceratitis |
|
capitata |
|
Drosophilidae |
Scaptodrosophila * |
lebanonensis |
|
|
|
Chymomyza |
amoena |
|
|
|
procnemis |
||
|
Drosophila |
Sophophora |
melanogaster |
|
|
|
Zaprionus† |
tuberculatus |
|
|
Drosophila |
virilis |
||
|
Hirtodrosophila |
pictiventris |
||
|
Dorsilopha |
busckii |
||
|
*Classified as a subgenus of Drosophila in Wheeler (16); raised to genus category in the revision of Grimaldi (17). †Classified as a separate genus in Wheeler (16), but more closely related to other Drosophila subgenera than the subgenus Sophophora (see Fig. 1). |
|||
2.7 when the Drosophila (or Scaptodrosophila) species are compared with Chymomyza, and 4.7 when the medfly Ceratitis is compared with any other species. These rate differences are displayed in Fig. 2 (Left).
The different rates of evolution displayed in Table 3 (and Fig. 2 Left) conceal even more disparate actual rates, which become manifest when we take into account that the rates in Table 3 apply to largely overlapping lineages. Consider in Fig. 1 the evolution from node 3 to a Chymomyza species and a Drosophila species (say, D. melanogaster, subgenus Sophophora). The average rate of amino acid evolution is 2.7×10⁻¹⁰ replacements per site per year (Table 3, line 2) over the 120 My of evolution separating these two species (60 My from node 3 to the Chymomyza species and 60 My from node 3 to the Drosophila species). But during 100 of the 120 My (55 My from node 4 to the Drosophila species and 45 My from node 5 to the Chymomyza species), the rate of evolution is 1.1× 10⁻¹⁰ (Table 3, line 1). Thus, the increase in rate of evolution could have occurred only over the 5 My between nodes 3 and 4 plus the 15 My between nodes 3 and 5. But the rate of evolution between Scaptodrosophila and Drosophila is 1.1, the same as between Drosophila species; the 5 My between nodes 3 and 4 are included in this comparison. It follows that the increased rate of evolution noted between Chymomyza and Drosophila could have occurred only during the 15 My elapsed between nodes 3 and 5 (thick line) in Fig. 1. To account for the rate of 2.7 observed between Chymomyza and Drosophila, the rate of evolution of the Chymomyza, lineage during those 15 My must have been 14.2× 10⁻¹⁰ per site per year, or 13 times greater than the 1.1 rate prevailing in the evolution of all other Drosophilid lineages. (The maximum parsimony estimate is that 5.3 amino acid replacements occurred between nodes 3 and 5; at the Drosophila rate, only 0.38 replacement is expected.)
Similarly, the rate of GPDH divergence between the medfly Ceratitis and Drosophila is about 4.3 times greater (Table 3, line 3, and Fig. 2 Left) than between Drosophila species. But the rate of evolution could have been accelerated for only a fraction of the 200 My elapsed, namely, between nodes 1 and 2 and between node 1 and Ceratitis; the average rate of GPDH evolution during those intervals most have been more than 6 times faster than between Drosophila species. The evolution of GPDH in dipterans is not clocklike at all.
Fig. 3 Left displays the nucleotide distances between the Gpdh sequences for the same set of species as in Fig. 2 Left. It appears that, at the nucleotide level Gpdh is evolving with the regularity expected from a molecular clock. The three rates shown in Fig. 3 Left are 14.2, 16.9, and 13.8×10⁻¹⁰ nucleotide substitutions per site per year, fairly similar to one another and surely within the sampling variation that one would expect from a stochastic molecular clock. (This observation, by the way, indicates that the discrepancies detected at the amino acid level are not caused by errors in the branching sequence of the taxa or in the assumed times of divergence.)
The apparent regularity of nucleotide evolution seen in Fig. 3 is, however, made up of two components, only one of which is clocklike. Fig. 4 Left shows a plot of Ka, the rate of nonsynonymous substitutions (i.e., those that result in amino acid replacements) against Ks, the rate of synonymous substitutions. The two rates are closely correlated for the Drosophila species (open circles), but not for the comparisons between Drosophila and Chymomyza (gray circles) or between Drosophila and Ceratitis (black circles). The synonymous rate, Ks, is about 10 times faster than the nonsynonymous rate, Ka, in Drosophila, but only about 5 times faster for the comparisons with Chymomyza and only 3.2 times faster for the comparisons with Ceratitis. Given that the rate of evolution is several times faster for synonymous than for nonsynonymous sites, most of the nucleotide substitutions occur in synonymous sites, which thus overwhelmingly dominate the overall rates of nucleotide evolution, so that these seem fairly constant (K2, Fig. 3), even though the nonsynonymous rates are not homogeneous.
Evolution of SOD in Diptera
The superoxide dismutases (EC 1.15.1.1) are abundant enzymes in aerobic organisms, with highly specific superoxide dismutation activity that protects the cell against the harmfulness of free oxygen radicals (24). These enzymes have active centers that contain either iron or manganese, or both copper and zinc (24). The Cu, Zn superoxide dismutase (SOD) is a well studied protein, found in eukaryotes but also in some bacteria (25). The amino acid sequence is known in many organisms— plants, animals, fungi, and bacteria (19, 20, 26, 27).
The Cu, Zn SOD of D. melanogaster is a dimer molecule consisting of two identical polypeptide subunits associated with two Cu2+ and two Zn2+ per molecule. Each subunit has a molecular weight of 15,750 and consists of 151 amino acids, the same as in other fruit fly species. The Drosophila Sod gene consists of two exons, separated by an intron 300–700 bp in length, located between codons 22 and 23. In the three other fruit fly genera studied in this paper—namely, Chymomyza, Scaptodrosophila, and Ceratitis—there is an additional short intron (<100 bp) between codons 95 and 96 (18, 28, 29). We have sequenced the Sod gene in 27 fruit fly species, the same set (with two inconsequential differences) sequenced for Gpdh (15, 18, 28, 29). In the present paper, I will analyze the results for the 9 species listed in Table 1 (the data for 18 additional Drosophila species will also be used in some cases).
Table 2 (below the diagonal) gives the PAM distance (amino acid replacements) between the SODs of the 9 fruit fly species. Table 4 gives averages (x¯) of these differences, as well as the rate of amino acid evolution, expressed in units of 10-10 replacements per site per year. In contrast to the discrepancies
Table 2. Amino acid replacements between nine fruit fly species for GPDH (above diagonal) and superoxide dismutase (SOD) (below diagonal)
|
Species |
1 |
2 |
3 |
4 |
5 |
6 |
7 |
8 |
9 |
|
1. Drosophila melanogaster |
– |
1.2 |
0.8 |
0.0 |
1.2 |
3.8 |
3.4 |
1.7 |
9.2 |
|
2. Drosophila virilis |
16.6 |
– |
2.1 |
1.2 |
1.7 |
3.4 |
2.9 |
1.7 |
9.2 |
|
3. Drosophila busckii |
15.8 |
10.0 |
– |
0.8 |
1.2 |
3.4 |
2.9 |
2.1 |
8.7 |
|
4. Drosophila pictiventris |
21.3 |
17.2 |
14.2 |
– |
1.2 |
3.8 |
3.4 |
1.7 |
9.2 |
|
5. Zapronius tuberculatus |
21.2 |
13.0 |
11.1 |
17.8 |
– |
2.5 |
2.1 |
2.1 |
8.7 |
|
6. Chymomyza amoena |
21.7 |
20.8 |
21.8 |
24.3 |
23.1 |
– |
0.8 |
3.8 |
8.7 |
|
7. Chymomyza procnemis |
21.4 |
20.8 |
21.9 |
26.8 |
21.0 |
6.2 |
– |
2.9 |
8.3 |
|
8. Scaptodrosophila lebanonensis |
20.3 |
20.5 |
20.6 |
23.3 |
25.7 |
23.0 |
22.9 |
– |
9.2 |
|
9. Ceratitis capitata |
30.0 |
30.9 |
28.3 |
29.7 |
26.5 |
28.1 |
31.9 |
26.5 |
– |
|
The numbers given are accepted point mutations (PAM) values (21) per hundred sites. The number of sites compared is 256 for GPDH and 151 for SOD. |
|||||||||
obtaining in GPDH evolution, it is apparent that SOD in fruit flies evolves fairly uniformly, at a rate of ˜16-18×10-10 replacements per site per year. The three rates of amino acid replacement (obtained as for GPDH by comparisons, respectively, between Drosophila subgenera, between these and Chymomyza, and between Ceratitis and all others) are 16.2, 17.8, and 15.9, similar enough to be acceptable as sample variations from the same stochastic clock. The contrast between the erratic behavior of GPDH and the regularity of SOD is apparent in Fig. 2. The species compared are the same in Left and Right (which, again, excludes the hypothesis that the discrepancies in GPDH rates of evolution are due to erroneous estimates of divergence times).
The Sod rate of nucleotide evolution (K2) in the fruit flies is displayed in Fig. 3 Right. The average rates for the three sets of comparisons are given in Table 4 and are also displayed in the figure. The Sod K2 rate is about 40% greater between the Drosophilid species than between them and Ceratitis. This difference is statistically significant if we use the standard errors of the mean differences, but it is difficult to say whether this may be attributed to stochastic variation or represents rather an acceleration in the Drosophilid lineages. Fig. 4 Right shows the correlation between synonymous and nonsynonymous nucleotide substitutions in Sod. Although there is considerable dispersion, we do not see the discontinuity manifest for Gpdh (Fig. 4 Left).
Global Rates of GPDH and SOD Evolution: Reversed Patterns
Table 5 displays the taxonomy of nine species encompassing three mammalian orders (human, mouse, and rabbit), three metazoan phyla (arthropods, chordates, and nematodes), and three multicellular kingdoms (animals, plants, and fungi). Table 6 gives the amino acid differences between species for GPDH (above the diagonal) and SOD (below the diagonal). Table 7 gives the average number of amino acid replacements (x¯) and the rate of amino acid evolution between three levels of evolutionary divergence. For GPDH, the evolutionary rates for the three levels are 5.3, 4.2, and 4.0×10⁻¹⁰ amino acid replacements per site per year. These rates are not grossly different from one another, nor from the rate of 4.7 observed above when comparing the two fruit fly families Drosophilidae and Tephritidae. These are rates comparable to those of some intracellular enzymes such as triosephosphate isomerase or lactate dehydrogenase H (5.3 ×10⁻¹⁰) and somewhat slower than the extensively studied cytochrome c (6.7 ×10⁻¹⁰; ref. 30). Over the time scale of 70 to 1,100 My covered by these comparisons, the evolution of GPDH behaves in a clocklike fashion. Yet, as noted above, the rate of GPDH evolution observed in Drosophila is less than one fourth as fast, lower even than the rate of histones H2A and H2B (1.7 ×10⁻¹⁰; ref. 30). These observations are graphically displayed in Fig. 5, where the slow Drosophila rate is set against the much faster long-term rates observed between the animal phyla and between the three kingdoms.
The SOD rates of amino acid evolution for the three levels of evolutionary divergence are given in Table 7, where they can readily be compared with the GPDH rates. The discrepancy between the two enzymes is baffling: the three rates are fairly homogeneous for GPDH, but quite heterogeneous for SOD. Between kingdoms the SOD rate (3.3 ×10⁻¹⁰) is smaller than for GPDH, whereas between mammals the SOD rate is much higher (17.2 ×10⁻¹⁰ the same rate as myglobin or the digestive enzyme trypsinogen; ref. 30) (see also Fig. 6).
The contrasting patterns of SOD and GPDH evolution cannot be attributed to distinctive characteristics of particular taxa, since the same set of species are compared for each enzyme (with the inconsequential exception that the plant species is Cuphea lanceolata for GPDH, but a different angiosperm, Ipomea batatas, for SOD). For the same reason, the rate fluctuations cannot be attributed to telescoping consequences of the different time intervals. The SOD rate is much faster for recently diverged taxa than for those that diverged long ago (16.2 ×10⁻¹⁰ for Drosophila versus 3.3 ×10⁻¹⁰ between kingdoms), but for GPDH it is exactly the other way around (1.1 ×10⁻¹⁰ for Drosophila versus 4.0 ×10⁻¹⁰ between kingdoms). Moreover, the mammalian rate is similar to the Drosophila rate in SOD, but similar to the long-term rate in
Table 3. Gpdh evolution in fruit flies
|
|
Amino acid replacements |
Nucleotide substitutions |
|||
|
Comparison |
My |
x¯ |
Rate |
x¯ |
Rate |
|
1. Drosophila subgenera |
55±10 |
1.2±0.0 |
1.1 |
15.8±0.2 |
14.2 |
|
2. Drosophila-Chymomyza |
60±10 |
3.0±0.1 |
2.7 |
20.3±0.2 |
16.9 |
|
3. Drosophilidae-Ceratitis |
100±20 |
9.4±0.1 |
4.7 |
27.7±0.2 |
13.8 |
|
The Drosophila species compared include the 5 listed in Table 1 plus 18 additional species (see refs. 14 and 15). The genus Scaptodrosophila is included in the comparisons made in row 1. Replacements are corrected according to ref. 21; nucleotide substitutions are estimated according to ref. 22. The ± values are crude estimates of error for My, but are standard deviations for replacements and substitutions, x¯ values are per 100 residues for differences between species; the rates are lineage values and are expressed in units of 10-10 per site per year. |
|||||
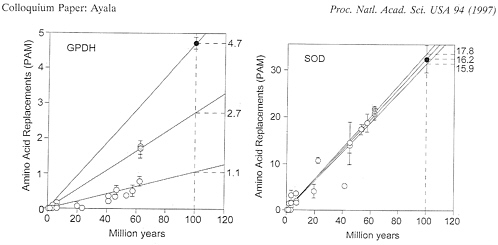
FIG. 2. Rate of amino acid replacement in fruit flies for the enzymes GPDH (Left) and SOD (Right). Open circles represent comparisons between species of Drosophila with each other (or with Scaptodrosophila): gray circles, between species of Chymomyza and Drosophila; solid circles, between Ceratitis and all other species; bars represent standard errors. It is apparent that a single straight line cannot provide a reasonable fit for all GPDH points; the rates shown on the right are amino acid replacements in units of 10-10 per site per year. The SOD rates are 16.2 for the Drosophila subgenera, 17.8 for the comparisons with Chymomyza, and 15.9 for the comparisons with Ceratitis; the two Chymomyza points are slightly displaced right and upwards for clarity. The species of Drosophila include 18 in addition to those listed in Table 1.
GPDH. Finally, the generation-time hypothesis (31–33) cannot account for the erratic patterns of GPDH and SOD. This hypothesis assumes that rates of evolution will be increased in organisms with shorter generation times. But the set of species analyzed is, as noted, the same for GPDH and for SOD.
Fixing the Clocks
The analyses of Gpdh and Sod evolution have been made after correcting the observed differences between species for multiple hits. We have used other algorithms, in addition to those mentioned above (PAM, K2, Ka, Ks) for correcting for overlapping and back-substitutions. These various algorithms yield the same results, except for trivial numerical differences (14, 15, 18, 28, 29). One possible way to account for the apparent erratic behavior of the enzymes might be the covarion (concomitantly variable codons) hypothesis (34), which asserts that there is a limited number of amino acid sites that can be replaced at any time in any given lineage. This number of invariable sites remains constant through time and lineages, but the composition of the set of invariable sites changes through, time and between lineages. The application of this assumption to a particular protein requires that one determines (i) the size of the covarion set—i.e., the number of sites at which replacements can occur at any given time in a given lineage; (ii) the total number of sites that are invariable—i.e., the number of sites, if any, at which amino acid replacements can never occur in any lineage; (iii) the number of different amino acids that can occur at each variable site, which may range from all 20 amino acids to only two (for example, at a site that most have a negative charge, only aspartate and glutamate can occur); (iv) the persistence of the covarion set—i.e., the rate at which one site in the set becomes replaced by another site; and (v) the rate of amino acid replacement.
Fitch and Ayala (19) have analyzed 67 SOD sequences of very diverse organisms from all three multicellular kingdoms to estimate the parameter values corresponding to the five variables just mentioned. The parameter values that maximize the fit between the observed and expected number of amino acid replacements are as follows: (i) the number of covarions is 28; (ii) the number of codons that are permanently invariable across animals, plants, and fungi is 44; (iii) the average number of amino acids that can occur at a variable site is 2.5; (iv) the
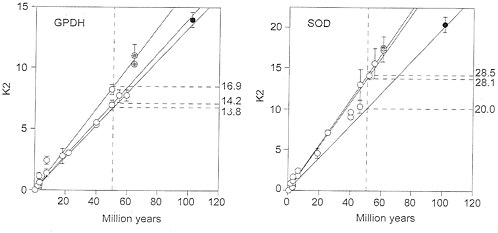
FIG. 3. Rate of nucleotide substitution (K2) in fruit flies for the genes Gpdh (Left) and Sod (Right), Symbols and other conventions are as in Fig. 2. The K2 units are nucleotide substitutions×10-10 per site per year, estimated by Klmura’s (22) two-parameter method; the rates on the right are in the same units, although their intercepts have been drawn at 50 My for clarity. The three rates are fairly similar, so that all points could have been subsumed within the same regression line, except perhaps for the Sod Ceratitis comparisons.
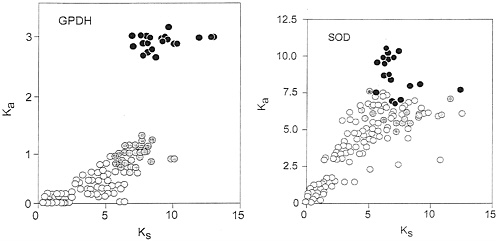
FIG. 4. Rate of nonsynonymous (Ka) versus synonymous (Ks) substitutions in Gpdh (Left) and Sod (Right), estimated according to Li (23). Symbols and other conventions are as in Figs. 2 and 3, except that the Ka scale is in units of substitutions ×10−9 per site per year. In the case of Gpdh the correlation between nonsynonymous (replacement) and synonymous substitutions for comparisons with either Chymomyza or Ceratitis is not homogeneous with the correlation for the comparisons between Drosophila species; for Sod the correlation is more nearly homogeneous, although the dispersion is high.
persistence of the covarion set is 0.01 (that is, there is a 0.01 probability that one site of the covarion set will change whenever one amino acid replacement has occurred); and (v) the rate of amino acid replacement for the whole polypeptide is 4×10⁻¹⁰ per site per year. In addition, it is determined that the total number of codons is 162 (151 codons are found in most organisms, but 162 sites are necessary to account for the occurrence of insertions and deletions in various species).
Table 8 gives the number of amino acid differences observed between increasingly remote taxa and the expected values obtained by means of computer simulations using the parameter values just given. The fit is reasonably good, although systematic deviations occur. For example, the observed values are consistently higher than the expected values for comparisons 2–4 (divergences 60–100 My ago), whereas they are consistently lower for comparisons 5–8 (divergences 125–400 My ago), which means that the covarion model is not sufficient to fully account for the decrease in rate of evolution observed as divergence time increases. The largest discrepancy occurs for the comparison angiosperm-gymnosperm, with an observed value of 29±7 versus an expected value of 42±5. That the SOD clock is far from perfect, no matter what assumptions are made, is also detected in Table 8 by noting, for example, that the average number of replacements between amphibians and mammals is 49, larger than between fish and tetrapods, which certainly diverged earlier. But these variations could be expected from sampling errors and because of the well founded observation that the rate variation of the clock is greater than expected from a Poisson distribution (32, 35–37). One may, nevertheless, endorse the conclusion reached by Fitch and Ayala (19) that, even though the evolution of SOD appears at first quite erratic, when the constraints under which the clock operates have not been taken into account, it may actually be evolving at a fairly constant rate as postulated by the molecular clock hypothesis.
The assumption that there are covarions that constrain the rate of evolution is not helpful to account for the erratic evolution of GPDH. The covarion model can account for the apparent slowdown of evolutionary rates as time increases, but not for the rate acceleration witnessed in the case of GPDH. We can, nevertheless, gain some insight into the processes that account for the scarcity of replacements observed between Drosophila (including Scaptodrosophila) species by examining in detail the actual amino acid replacements and locating them along the branches of the phylogeny. There is evidence of homoplasy; i.e., it is apparent that parallel as well as reversed replacements have occurred in the polymorphic sites (14, 38). Among the 256 amino acid sites assayed in a set of 15 Drosophila species, we have observed that 2 or more replacements have occurred in only 5 of the sites (14). Parallel and reversed replacements are detectable in 4 of these 5 polymorphic sites. For example, at site 193, the replacement glutamic acid → aspartic acid occurred at the root of the Drosophila genus (after its divergence from Chymomyza), followed by two parallel reversals aspartic acid → glutamic acid at the root of the Drosophila subgenus and at the root of the willistoni group (within the Sophophora subgenus). Wells (38) has exposed three additional homoplasic sites in a GPDH segment not included in our study. Parallel and reversed replacements result in “observed” numbers of replacements between species much smaller than the numbers that have actually taken place. The biological inference drawn from these empirical observations is that there are strict functional constraints in the GPDH of these species so that (i) very few sites accept replacement, and (ii) only two, or very few different amino acids are accepted at those few sites that can change at all. That such constraints exist is not surprising, given the keystone role of GPDH in providing the energy needed for flying in the thoracic muscles (9). The disproportionately large number of differences observed in the comparisons with Chymomyza or
Table 4. Sod evolution in fruit flies
|
|
Amino acid replacements |
Nucleotide substitutions |
|||
|
Comparison |
My |
x̄ |
Rate |
x̄ |
Rate |
|
1. Drosophila subgenera |
55±10 |
17.8±0.3 |
16.2 |
31.0±0.4 |
28.1 |
|
2. Drosophila-Chymomyza |
60±10 |
21.4±0.2 |
17.8 |
34.2±0.4 |
28.5 |
|
3. Drosophilidae-Ceratitis |
100±20 |
31.8±0.6 |
15.9 |
40.0±0.4 |
20.0 |
|
Species compared and other conventions are the same as in Table 3. |
|||||
Table 5. Taxonomy of the species studied for long-term evolutionary rates
|
Kingdom |
Phylum* |
Order |
Species |
|
Plants |
Angiosperms |
|
Cuphea lanceolata† |
|
|
Ipomoea batatas† |
||
|
Fungi |
Yeasts |
Schizosaccharomyces pombe |
|
|
|
Saccharomyces cerevisiae |
||
|
Animals |
Nematodes |
Caenorhabditis elegans |
|
|
|
Arthropods |
Dipterans |
Several (Table 1) |
|
Chordates |
Lagomorphs |
Rabbit |
|
|
|
Rodents |
Mouse |
|
|
Primates |
Human |
||
|
*The taxonomy of plants and fungi uses the category “division” rather than phylum. Flowering plants belong to the division Anthophyta; the yeasts, to the division Ascomycota. †Cuphea lanceolata is the species sequenced for Gpdh; for Sod, the species sequenced is Ipomoea batatas. |
|||
Ceratitis might reflect that constraints are more strict in the Drosophila and Scaptodrosophila lineages than in Chymomyza or in Ceratitis, so that many more replacements occur in the latter two lineages. It may also be the case that the constraints are equally intense in all lineages, but the optimal amino acid states changed early in the evolution of the Chymomyza and Ceratitis lineages, so that natural selection caused the rapid replacement of several amino acids. Be that as it may—either relaxation of the austerity of the constraints or selection-driven replacements—the outcomes are changes in net rates of evolution and erratic fluctuations of the clock.
Discussion
The hypothesis of the molecular clock of evolution emerged from the early observation that the number of amino acid differences in a given protein appeared to be proportional to the time elapsed since the divergence of the organisms compared (1–3). This proportionality was accounted for with the hypothesis that many amino acid (and nucleotide) substitutions may be of little or no functional consequence, and that most substitutions that occur in evolution will be of this kind rather than involve amino acid replacements strongly constrained by natural selection (2). This insightful hypothesis was encased with other conjectures that would become dominant themes in molecular evolution studies in the ensuing decades: (i) the rate of amino acid replacement of a particular protein may be directly proportional to the number of sites that can change without radical alteration of function; (ii) morphological evolution may be largely due to changes in gene regulation and not be reflected in the rate of evolution of polypeptide chains, and (iii) given that functionally significant amino acid replacements are rare relative to the number of inconsequential replacements, the rates of amino acid replacement during periods of rapid morphological evolution may not substantially differ from the rates that obtain during periods of slow evolution (2).
Kimura’s neutrality theory of molecular evolution (4–7, 39) provided a mathematical formulation for the hypothesis of the molecular clock. New alleles arise in a species by mutation. If alternative alleles are neutral with respect to natural selection (i.e., do not modify the Darwinian fitness of their carriers), their frequencies will change only by accidental sampling errors from generation to generation, that is, by genetic drift. Rates of allelic substitution will thus be stochastically constant—they will occur with a constant probability for a given protein. That probability can be shown to be the mutation rate for neutral alleles (6).
The neutrality theory of molecular evolution accepts that, for any gene, a large proportion of all possible mutants are harmful to their carriers; these mutants are eliminated or kept at very low frequency by natural selection. The theory assumes, however, that many functional mutants can occur at each locus that are adaptively equivalent to one another. These mutants are not subject to selection relative to one another because they do not affect the fitness of their carriers (nor do they modify their morphological, physiological or behavioral properties). According to the neutrality theory, evolution at the molecular level consists for the most part of the gradual, random replacement of one allele by another that is functionally equivalent to the first. The theory assumes that favorable mutations occur, but are sufficiently rare that they have little effect on the overall evolutionary rate of nucleotide and amino acid substitutions.
According to the neutrality theory, it is reasonable to assume that the neutral mutation rate of a protein will remain constant over evolutionary time. This persistence of the neutral mutation rate would be the case whenever the protein function and, hence, its structural constraints would not be altered through time, even as the organisms in which the protein functions evolve and diverge. Any such protein would function as a molecular clock: the number of amino acid replacements would be expected to be directly proportional to the time since their divergence from a common ancestor. A propitious state of affairs is that there are many proteins that differ in their functional constraints. Thus, there are many molecular clocks that tick at different rates but are all timing the same evolutionary events. Some molecular clocks, such as fibrinopeptides, tick at a very rapid rate and are useful to investigate recently diverged organisms; other proteins, such as in the extreme some histories, evolve much more slowly and are appropriate for investigating ancient evolutionary events. One advantage of molecular clocks over the radioactive clocks used to time the age of rocks is this, namely that there are tens of thousands of proteins in any organism, all of which can potentially be used for ascertaining any particular event of interest. The number of radioactive isotopes is very small by comparison.
The molecular clock postulated by the neutrality theory is not a metronomic clock, like timepieces in ordinary life that measure time exactly. The neutrality theory predicts, instead.
Table 6. Amino acid replacements between nine species of animals, plants, and yeasts for GPDH (above diagonal) and SOD (below diagonal)
|
Species |
1 |
2 |
3 |
4 |
5 |
6 |
7 |
8 |
9 |
|
1. D. melanogaster |
– |
9.2 |
56.2 |
51.3 |
58.8 |
52.6 |
78.2 |
89.2 |
92.3 |
|
2. Ceratitis |
30.0 |
– |
52.9 |
49.7 |
55.4 |
51.8 |
71.9 |
84.4 |
92.3 |
|
3. Human |
61.0 |
64.8 |
– |
4.3 |
8.8 |
55.4 |
80.4 |
84.4 |
89.1 |
|
4. Mouse |
64.8 |
64.8 |
24.3 |
– |
9.2 |
56.2 |
79.3 |
84.4 |
90.4 |
|
5. Rabbit |
72.0 |
69.8 |
23.3 |
24.5 |
– |
62.3 |
82.7 |
90.5 |
95.5 |
|
6. Nematode |
79.9 |
75.3 |
72.1 |
64.0 |
71.0 |
– |
81.0 |
93.6 |
103.7 |
|
7. Plant |
56.2 |
61.8 |
78.7 |
76.4 |
74.2 |
77.5 |
– |
83.8 |
91.6 |
|
8. Sch. pombe |
79.9 |
68.9 |
79.9 |
84.6 |
83.4 |
93.6 |
99.2 |
– |
91.5 |
|
9. Sac. cerevisiae |
82.2 |
84.7 |
77.6 |
77.6 |
81.0 |
74.2 |
85.8 |
62.3 |
– |
|
The numbers given are PAM values (21) per hundred sites. The taxonomy of the nine species is given in Tables 1 and 5. The plant species is Cuphea lanceolata for GPDH but Ipomoea batatas for SOD. The amino acid alignments are given in ref. 20. |
|||||||||
Table 7. Long-term evolutionary rates of amino acid replacements in GPDH and SOD
|
|
GPDH |
SOD |
|||
|
Comparison |
My |
x¯ |
Rate |
x¯ |
Rate |
|
1. Mammalian orders |
70±10 |
7.4±1.6 |
5.3 |
24.0±0.4 |
17.2 |
|
2. Animal phyla |
650±100 |
54.7±0.3 |
4.2 |
68.3±0.9 |
5.3 |
|
3. Multicellular kingdoms |
1100±200 |
87.0±0.8 |
4.0 |
72.5±1.2 |
3.3 |
|
The species compared are listed in Tables 1 and 5. Other conventions are the same as in Table 3. |
|||||
that molecular evolution is a “stochastic clock,” like radioactive decay. The probability of change is constant, although some variation occurs. Over fairly long periods, a stochastic clock is nevertheless quite accurate, and the joint results of several protein, or DNA sequences could, in any case, provide fairly accurate time estimates.
The clock predicted by the neutrality theory behaves as a Poisson process, so that the ratio, R, of the variance to the mean (s2/m) is expected to be 1, which can readily be empirically tested. The results of many such tests have shown that (i) R is almost universally greater than 1; and (ii) this increase is statistically significant in nearly half of the proteins tested (37). Consequently, several modifications of the neutral theory have been proposed seeking to account for the excess variance of the molecular clock. It has been proposed, for example, that most protein evolution involves slightly deleterious replacements rather than strictly neutral ones; or that the effectiveness of the error-correcting polymerases varies among organisms, so that mutation rates change (6, 22, 37, 39, 40). Either one of these hypotheses could account for the difference between the levels of protein polymorphism observed within species and those predicted by the neutrality theory. Another supplementary hypothesis invokes a generation-time effect. Protein evolution has been extensively investigated in primates and rodents with the common observation that the number of replacements is greater in the rodents (33, 41). In plants, the overall rate at the rbcL locus is more than 5 times greater in annual grasses than in palms, which have much longer generations (32). These rate differences could be accounted for, according to the generation-effect hypothesis, by assuming that the time-rate of evolution depends on the number of germ-line replications per year, which is several times greater for the short-generation rodents and grasses than for the long-generation primates and palms. The rationale of the assumption
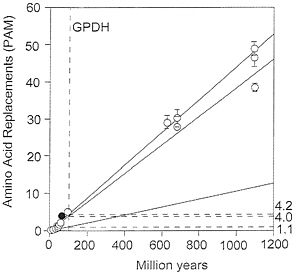
FIG. 5. Global rates of amino acid replacement for GPDH. The points at the lower left are for comparisons between fruit flies (open circles) or between mammals (filled circle). The rates on the right are for replacements ×10-10 per site per year and correspond to the comparisons between Drosophila species (1.1), between species from different animal phyla (4.0), and between species from different kingdoms (4.2). All three rates have been calculated as linear regressions over time.
is that the larger the number of replication cycles, the greater the number of mutational errors that will occur.
From a theoretical, as well as operational, perspective, these and other supplementary hypotheses have the discomforting consequence that they involve additional empirical parameters, often not easy to estimate. It is of great epistemological significance that the original proposal of the neutrality theory is (i) highly predictive and, therefore, (ii) eminently testable. These two properties, really two sides of the same coin, become diluted in the modified versions of the theory. Nevertheless, it is commonly assumed that molecular evolution is sufficiently regular over time and across lineages, so that a molecular clock can be assumed for testing phylogenetic hypotheses, or estimating the time of remote evolutionary events.
The combined consideration of GPDH and SOD evolution in the same set of species is, however, disquieting. The covarion hypothesis becomes helpful to account for the reduction in rate of evolution that obtains in some proteins when the species compared become increasingly remote, as in the case of SOD. But the covarion model cannot be extended to GPDH, whose rate of evolution increases as the organisms compared become more remote. Similarly, the hypothesis of the generation-time effect cannot account for the divergent patterns of evolution of both GPDH and SOD, since the same set of species is compared in both cases, and thus identical generation times have been involved at all times in the evolution of these species. Similarly, the postulate of slightly deleterious mutations or other subsidiary hypotheses may be adjusted to account for the evolution of one or the other protein, GPDH and SOD, but not for both, without stretching ad hoc their elasticity to make the molecular clock hypothesis universally applicable to any possible empirical state of affairs and, therefore, without any predictive power and untestable (42, 43).
I have noted above the constraints that occur in the evolution of GPDH in Drosophila, which considerably restrict the number
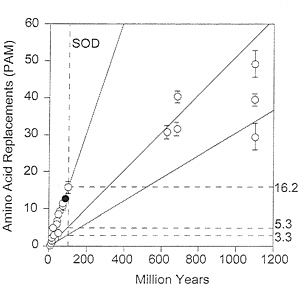
FIG. 6. Global rates of amino acid replacement for SOD. Symbols and other conventions as for Fig. 5. In contrast with GPDH, the fastest rate of evolution (16.2) is for comparisons between Drosophila species, and the lowest rate (3.3) is for comparisons between kingdoms. The intermediate rate (5.3) is for comparisons between animal phyla.
Table 8. Observed amino acid replacements in SOD and expected values, assuming a covarion model
|
|
Amino acid differences |
||
|
Comparison |
My |
Observed |
Expected |
|
1. Drosophila subgenera |
55±10 |
18±3 |
19±3 |
|
2. Drosophila-Chymomyza |
60±10 |
23±2 |
20±4 |
|
3. Mammalian orders |
70±10 |
27±2 |
22±4 |
|
4. Drosophila-Ceratitis |
100±20 |
31±2 |
28±3 |
|
5. Monocot-dicot |
125±20 |
28±3 |
31±5 |
|
6. Angiosperm-gymnosperm |
220±30 |
29±7 |
42±5 |
|
7. Mammal-amphibian |
350±50 |
49±2 |
53±6 |
|
8. Tetrapod-fish |
400±50 |
44±4 |
56±7 |
|
9. Vertebrate-insect |
600±100 |
59±3 |
60±6 |
|
10. Animal-yeast |
1100±200 |
67±4 |
66±7 |
|
The expected values are obtained usin the covarion model with the parameter values given in the text; they are averages of 40 computer simulations for each entry. The data are modified from Fitch and Ayala (19). |
|||
of sites that can accept amino acid replacements and the particular replacements that can occur at each site. It remains obscure why greater constraints would occur in Drosophila than in the Chymomyza or Ceratitis lineages (or, indeed, in other animals, plants, and fungi). But, in any case, the issue is not whether biologically ascertainable processes are at work, which of course they are, in GPDH, SOD, or any other enzymes. The issue rather is whether the processes are of such regularity that some sort of molecular clock may be assumed to be at work. The stark contrast between the pattern of evolution of GPDH and SOD may be an aberration rather than representative of prevailing modes of protein evolution, since protein evolution seems so often to behave in a clocklike manner. But the congruence between observations and the clock predictions are often obtained due to the fact that the data collected do not have sufficient resolution to exhibit likely discrepancies.
The operational risks of assuming that protein clocks are fairly reliable are made evident in Table 9. The rate of GPDH evolution is nearly 4 times faster between animals and plants than between Drosophila species, whereas the rate of SOD evolution is 1/5 as fast. If we were to use the observed rate of Drosophila evolution to estimate the time of divergence between plants and animals, GPDH would yield an estimate of 3,990 My, SOD an estimate of 224 My, both grossly erroneous. The practical conclusions to be drawn are that (i) protein clocks should be used cautiously and weighed against any other available evidence, rather than considered decisive; (ii) several protein clocks should be used whenever feasible, particularly
Table 9. Rates of evolution of GPDH and SOD and estimates of divergence time derived from the Drosophila rate
when important evolutionary events need to be determined (44); (iii) whenever possible, synonymous rather than nonsynonymous nucleotide substitutions should be used, given that substitutions that yield amino acid replacements are more constrained by natural selection. The rapid rate of synonymous nucleotide substitutions becomes, however, a problem whenever long evolutionary spans are at stake, because many superimposed substitutions will have occurred so that the differences observed have little statistical reliability for estimating the multiple hits concealed behind the observed differences. The strategy of using as many separate molecular clocks as feasible is grounded on the convergence expected from the “law of large numbers;” statistical and other biases will tend to cancel as the number of observations increases.
I am grateful to Walter M.Fitch and Richard R.Hudson for valuable comments and to the members of my laboratory who participated in the research herein reported, particularly Kevin Bailey, Eladio Barrio, Michal Jaworski, Michal Krawczyk, Jan Kwiatowski, and Douglas Skarecky. Stephen Rich’s help with computer graphics is much appreciated. This research is supported by National Institutes of Health Grant GM42397.
1. Zuckerkandl, E. & Pauling, L. (1962) in Horizons in Biochemistry, eds. Kasha, M. & Pullman, B. (Academic, New York), pp. 97–166.
2. Zuckerkandl, E. & Pauling, L. (1965) in Evolving Genes and Proteins, eds. Bryson, V. & Vogel, H.J. (Academic, New York), pp. 97–166.
3. Margoliash, E. (1963) Proc. Natl. Acad. Sci. USA 50, 672–679.
4. Kimura, M. (1968) Nature (London) 217, 624–626.
5. Kimura, M. (1969) Proc. Natl. Acad. Sci. USA 63, 1181–1188.
6. Kimura, M. (1983) The Neutral Theory of Molecular Evolution (Cambridge Univ. Press , Cambridge, U.K.).
7. Kimura, M. & Ohta, T. (1971) Nature (London) 229, 467–469.
8. O’Brien, S.J. & MacIntyre, R.J. (1978) in The Genetics and Biology of Drosophila, eds. Ashburner, M. & Wright, T.R.F. (Academic, New York), Vol. 2a, pp. 395–551.
9. O’Brien, S.J. & MacIntyre, R.J. (1972) Genetics 71, 127–138.
10. Bewley, G.C., Cook, J.L., Kusakabe, S., Mukai, T., Rigby, D.L. & Chambers, G.K. (1989) Nucleic Acids Res. 17, 8553–8567.
11. von Kalm, L., Weaver, J., DeMarco, J., MacIntyre, R.J. & Sullivan, D.T. (1989) Proc. Natl. Acad. Sci. USA 86, 5020–5024.
12. Cook, J.L., Bewley, G.C. & Shaffer, J.B. (1988) J. Biol. Chem. 263, 10858–10864.
13. Lakovaara, S., Saura, A. & Lankinen, P. (1977) Evolution 31, 319–330.
14. Kwiatowski, J., Krawezyk, M., Jaworski, M., Skarecky, D. & Ayala, F.J. (1997) J. Mol. Evol. 44, 9–22.
15. Barrio, E. & Ayala, F.J. (1997) Mol. Phylogenet. Evol. 7, 79–93.
16. Wheeler, M.R. (1981) in The Genetics and Biology of Drosophila, eds. Ashburner, M., Carson, H.L. & Thompson, J.N.J. (Academic, New York), Vol. 3a, pp. 1–97.
17. Grimaldi, D. (1990) Bull. Am. Mus. Nat. Hist. 197, 1–139.
18. Kwiatowski, J., Skarecky, D., Bailey, K. & Ayala, F.J. (1994) J. Mol. Evol. 38, 443–454.
19. Fitch, W.M. & Ayala, F.J. (1994) Proc. Natl. Acad. Sci. USA 91, 6802–6807.
20. Ayala, F.J., Barrio, E. & Kwiatowski, J. (1996) Proc. Natl. Acad. Sci. USA 93, 11729–11734.
21. Dayhoff, M.D. (1978) Atlas of Protein Sequences and Structure (Natl. Biomed. Res. Found., Washington, DC).
22. Kimura, M. (1980) J. Mol. Evol. 16, 111–120.
23. Li, W.-H. (1993) J. Mol. Evol. 36, 96–99.
24. Fridovich, I. (1986) Adv. Enzymol. 58, 61–97.
25. Steinman, H.M. (1988) Basic Life Sci. 49, 641–646.
26. Kwiatowski, J., Hudson, R.R. & Ayala, F.J. (1991) Free Radical Res. Commun. 12–13, 363–370.
27. Smith, M.W. & Doolittle, R.F. (1992) J. Mol. Evol. 34, 175–184.
28. Kwiatowski, J., Skarecky, D., Burgos, M. & Ayala, F.J. (1992) Insect Mol. Biol. 1, 3–13.
29. Kwiatowski, J., Skarecky, D. & Ayala, F.J. (1992) Mol. Phylogenet. Evol. 1, 72–82.
30. Wilson, A.C., Carlson, S.S. & White, T. (1971) Annu. Rev. Biochem. 46, 573–639.
31. Wu, C.-I. & Li, W.-H. (1985) Proc. Natl. Acad. Sci. USA 82, 1741–1745.
32. Gaut, B.S., Muse, S.V., Clark, W.D. & Clegg, M.T. (1992) J. Mol. Evol. 35, 292–303.
33. Li, W.-H., Ellsworth, D.L., Kruchkal, J.K., Chang, B.H.-J. & Hewett-Emmett, D. (1996) Mol. Phylogenet. Evol. 5, 182–187.
34. Fitch, W.M. & Markowitz, E. (1970) Biochem. Genet. 4, 579–593.
35. Fitch, W.M. & Langley, C.H. (1976) Fed. Proc. 35, 2092–2097.
36. Bousque, J., Strauss, S.H., Doerksen, A.H. & Price, R.A. (1992) Proc. Natl. Acad. Sci. USA 89, 7844–7848.
37. Gillespie, J.H. (1991) The Causes of Molecular Evolution (Oxford Univ. Press, New York).
38. Wells, R.S. (1996) Proc. R. Soc. London Ser. B 263, 393–400.
39. Kimura, M. & Ohta, T. (1972) J. Mol. Evol. 2, 87–90.
40. Li, W.-H. & Graur, D. (1991) Fundamentals of Molecular Evolution (Sinauer, Sunderland, MA).
41. Kohne, D.E. (1970) Quart. Rev. Biophys. 33, 327–375.
42. Popper, K.R. (1959) The Logic of Scientific Discovery (Hutchinson, London).
43. Ayala, F.J. (1994) Hist. Phil. Life Sci. 16, 205–240.
44. Wry, G.A., Levinton, J.L. & Shapiro, L.H. (1996) Science 274, 568–573.


