
Appendix G Individual Fishing Quota Case Studies
This appendix presents data and information on the currently implemented federal individual fishing quota (IFQ) and transferable trap certificate programs in the United States and on selected systems from other nations. Its intent is not to evaluate these systems with respect to their desirability or lack thereof but to present empirical data on their genesis, characteristics, and effects. Although the committee gathered information on several other systems that are in various stages of development, the focus here is on those systems that actually have been implemented and from which some documented results are available.
The appendix is organized in two sections: (1) the U.S. federal experience and (2) selected foreign experiences. The common characteristics of these fisheries and their IFQ systems and the lessons learned from their experiences can be found in Chapter 3. The U.S. federal experiences that form the core of the analysis are summarized according to eight topics that are described for each case:
- Prior regulatory conditions in the fishery;
- Prior biological and ecological conditions in the fishery;
- Prior economic and social conditions in the fishery;
- Problems and issues that led to the consideration of an IFQ program;
- Objectives of the IFQ program;
- IFQ program development process and the transition to IFQs;
- The IFQ program; and
- Outcomes of the IFQ program.
The foreign experiences follow the same general format, although any comparison among the cases must be made carefully because of the different policy and management frameworks and political, social, and economic conditions under which these systems were developed.
Summary of U.S. Experience
Fishery managers in the United States have gained substantial experience with individual fishing quotas and related systems in the past eight years. In this section, three of the four existing IFQ programs (surf clam/ocean quahog, halibut, and sablefish), plus the spiny lobster transferable trap certificate program, are discussed in the order of their implementation. The wreckfish program is summarized in Chapter 3.
Each section describes the conditions that existed in the fishery prior to IFQs, including the factors that most directly led to IFQs (if implemented), and characteristics and outcomes of the program.
Surf Clam and Ocean Quahog (SCOQ) ITQ Case Study
Surf clams (SC: Spisula solidissima) and ocean quahogs (OQ: Arctica islandica) are bivalve mollusks that occur along the U.S. East Coast, primarily from Maine to Virginia. Commercial concentrations of surf clams are found primarily off the Mid-Atlantic coast. In this region, they are found from the beach zone to a depth of about 60 m. Ocean quahogs have a similar distribution, overlapping considerably, but they are also found in deeper waters, from 8 to 256 m.
These two closely related fisheries are largely (but not entirely) conducted by the same vessels, in the range of 40-110 gross register tons (GRT), which employ hydraulic clam dredges. Most of the catch is shucked and processed into a variety of clam products (minced clams, clam strips, juice, sauce, chowder). Apart from a small bait fishery, the recreational fishery is insignificant. Surf clam fishing began in the 1940s; ocean quahog fishing began in the 1970s. In addition, a small fishery for ocean quahogs found in shallow waters in the Gulf of Maine began in the 1980s; its market is for fresh in-shell product.
The SCOQ fishery was the first to be managed under the Magnuson-Stevens Act in 1977; the first limited access fishery in the exclusive economic zone (EEZ), through the moratorium created in 1977; and the first IFQ fishery in the EEZ, in 1990. Like the New Zealand IFQ program, but even more so, it is designed according to the prescriptions of free-market liberalism: there are few constraints on ownership eligibility, transfer, and other features, as described below.
Several features of the SCOQ fishery make it a relatively simple case for IFQ management. There is little competition for its product, although this is changing with the advent of clams from Iceland and elsewhere. The geographic range is relatively small; the number of vessels has never exceeded 140, and is now less
than 50, and the number of vessel owners is much smaller; because of the tight linkages between harvesting and processing, the number of landing sites is also small. Moreover, the fishery is highly specialized: the vessels are not easily used for other purposes when outfitted with hydraulic clam dredges; to date bycatches have not been discussed as a problem. Finally, the commodity orientation of IFQs is appropriate because there have been no recreational or environmentalist claims for other values.
Prior Regulatory Conditions in the Fishery
In 1990, prior to IFQs, different regulations were applied to surf clams and ocean quahogs, to restrict the harvest of surf clams and encourage development of the ocean quahog fishery.
1. Quota setting and catch limits—Quota setting for both species became an annual process of the Mid-Atlantic Fishery Management Council (MAFMC), within a framework plan that establishes the optimum yield (OY) within a range of bushels.
With the beginning of EEZ surf clam management in 1977, a total allowable catch (TAC) was estimated for the Mid-Atlantic surf clam fishery and divided into quarterly quotas. Fishing time limits per fishing vessel were set to help spread catch over time, so as to stabilize product input to processors. Conservative TACs were set. The policy was to set the TAC to allow a 10-year supply horizon, or at least 10 years of harvest on the present standing stock. There was a separate TAC for the smaller fishery in the New England region. At the same time, the state of New Jersey also began to regulate surf clam harvests within 3 nautical miles of its shores.
A TAC for ocean quahogs was also set in 1977 but there were no time restrictions. The TAC was set high to spur development of this fishery and take pressure off the surf clam stock. The TAC was never met. Concern about the longevity and lack of recruitment of ocean quahogs, however, led to the adoption of a 30-year supply horizon.
2. Reporting requirements—In the Mid-Atlantic and New England regions, all SCOQ-harvesting vessels were required to report their catches in detailed logs. Processors also had to report how much product they accepted and from whom. This created a record of individual vessel performance.
3. Access restrictions—Access in the ocean quahog and New England surf clam fisheries was essentially unrestricted. The ability to restrict entry was allowed in the SCOQ fishery management plan (FMP) but was among the many provisions directed toward ocean quahogs that were never put in place (Brandt, 1994-1995). A permit and logbook reporting were all that was required. In the
State of Maine a small-scale ocean quahog ("mahogany clam") fishery developed in the late 1980s. It was open access, although regulated by the state because of concerns about the toxin that causes paralytic shellfish poisoning (PSP). This state fishery overlapped with the federal fishery in the EEZ but was not considered part of the larger management regime until the advent of IFQs.
The Mid-Atlantic surf clam fishery was the first EEZ fishery in the nation to be managed with limited access. The commercial fishery for surf clams began after World War II. It was an open-access, boom-and-bust fishery until 1977. The State-Federal Surf Clam Project depended on states to enact regulations, but most of the fishery took place beyond 3 nautical miles from shore.
In 1978, a vessel moratorium was established, grandfathering all vessels in or being built for the surf clam fishery in 1977 and/or fishing in 1978 (184 vessels were included at first, but some were dropped because of inactivity, leaving 142 (MAFMC, 1990). Thereafter, access was contingent on owning one of the original boats or its replacement. There were no restrictions on sale or purchase of these vessels, and capitalized values of moratorium permits were very high (estimated at $50,000-$150,000) (MAFMC, 1990). The moratorium lasted until 1990.
Prior Biological and Ecological Conditions in the Fishery
The population ecology of surf clams and ocean quahogs is distinctive, leading to "mining" rather than "sustainable resource" management strategies (cf. Murawski and Idoine, 1989). Their biomass is dominated by a few large year classes. Year-to-year recruitment variability is very high. They have erratic sets and few year classes that make it to "recruitment" size. For surf clams, recruitment to harvestable size is achieved in 6 to 7 years; ocean quahog recruitment is more difficult to determine, the majority of individuals found in the Mid-Atlantic region being very old, far beyond 20 years. Adult clams grow very slowly and may live a long time, particularly ocean quahogs, one of which is believed to have lived for 225 years (Brownlow and Ropes, 1985). Accordingly, the major management decision has been how long the present standing stock should last.
The major goal of the surf clam FMP was to restore depleted populations. Surf clams were subject to heavy fishing pressure from the late 1960s to the mid-1970s; localized stocks were depleted and the fishing fleet moved to new grounds. In 1976, a period of low dissolved oxygen in waters near the seafloor off the coast of New Jersey killed a large portion of the surf clam stock. This event prompted action, first from New Jersey and subsequently from the new MAFMC to try to prevent an unregulated industry from reducing the remaining clams to economic extinction.
Ocean quahogs are found over a much broader range of the North Atlantic region and in deeper waters than surf clams. Their life-cycle characteristics are similar to those of surf clams (erratic sets, few successful year classes), but recruitment, growth, and maturity take longer. As one scientist said, "Ocean
quahogs are like a 'living rock'” (Jeff Weinberg, meeting of the Surf Clam and Science and Statistical Committees, September 4, 1996).
There was a high level of scientific uncertainty about the population dynamics of both species. However, harvesters knew where to find these clams because they are sedentary creatures. With hydraulic dredging gear, they are easy to harvest.
For both clam species, there is no discernible relationship between the size of the spawning stock and the number of clams recruited, and harvesters rely substantially on a few large year classes to buffer interannual variability, leading to analogies to mining when talking about management strategies. This is why the TAC was set conservatively, using the figure of 10 years' sustainability or "supply years" for surf clams and 30 years for ocean quahogs in setting annual TACs. An important effect of the reliance on occasionally large year classes during the moratorium period (1978-1989) was the creation of excess harvesting capacity. As the 1976 year class in the New Jersey area and the 1977 year class in the Delmarva area grew large enough to harvest, this created a bonanza that was easy to harvest but, within the context of a TAC, fixed for the long term. The result was further restrictions on fishing time, so that by 1987, surf clam boats were allowed to fish for only eight hours every month (see Marvin, 1992), even though the annual quota had increased greatly.
Prior Economic and Social Conditions in the Fishery
From 1977 to 1989, the moratorium on new entries created a situation in which the harvesting sector of the industry retained virtually the same number of vessels (about 144 vessels with surf clam permits in the Mid-Atlantic region), although the participation of these vessels varied from year to year and with the prices of clams.
Although the number of vessels in the surf clam fishery remained virtually unchanged during the moratorium period, liberal interpretations of the replacement policy on the part of the Northeast Region of the National Marine Fisheries Service (NMFS) allowed changes in total fleet capacity. The number of small vessels (class 1) decreased from 14 to 8 between 1980 and 1987, while the number of large vessels (class 3) increased from 59 to 75 in that period. The number of class 2 vessels decreased from 54 to 50 (MAFMC, 1990). This increase in capacity contributed to rising catch per unit effort (CPUE), as did the growth of the 1977 and 1978 year classes of surf clams and industry changes in harvesting gear. The MAFMC staff computed estimates of revenues versus costs for different classes of the fleet, and estimated that a loss of more than $3 million must have occurred during the moratorium, given the costs of catching clams (MAFMC, 1990).
Detailed data on the processing sector are not available. Clams are processed for canned chowder, canned whole and minced clams, and breaded strips.
Ocean quahogs are partly substitutable for surf clams, but the latter are definitely preferred for technological and quality reasons (ocean quahogs are tougher and high in iodine). As early as 1980, concentrated market power was evident in the processing sector (Strand et al., 1981); this remained true throughout the decade. During this period the industry structure that had existed before the moratorium remained: a few large, vertically integrated firms dominated the industry in their dealings with numerous smaller processors and "independent" vessel owners (including a few who amassed large fleets during the moratorium).
The year in which much of the politicking about ITQs occurred (1987) was also the year of the lowest recorded average prices for surf clams and ocean quahogs (see MAFMC, 1990).
Crew employment declined during the moratorium period, as vessel owners adapted to time restrictions by using the same crew members on more than one vessel (McCay and Creed, 1987, 1990; McCay et al., 1989).
Many of the clam vessels were unionized prior to 1979; after that time, when one of the processing firms was relocated and its boats were sold, mostly to their captains, unionization ended, and no associations arose to represent the interests of captains and crew in the fishery management process. However, vessel owners and processors were very active in this process, and several organizations appeared from time to time to help galvanize industry efforts to cooperate with the MAFMC in managing this fishery. There was a strong spirit of "co-management" from the outset (Turgeon, 1985). A job satisfaction study done in New Jersey (Gatewood and McCay, 1988) showed that in comparison with other types of commercial fishermen, crew members who worked on clam vessels received higher incomes and were less likely to see fishing as a challenge and adventure; there was a somewhat lower degree of commitment to and dependence on clam fishing than other types of fishing (i.e., dragging or longlining). This did not hold true for captains on clam vessels, most of whom had little experience in other occupations.
Fishing ports and processor locations for clams are spread throughout the Mid-Atlantic region and into New England. Most of the processors are found at seaport communities, but a few large ones have facilities inland as well, where fruits and vegetables are processed. The labor force in clam processing tends to be much the same as in poultry, and fruit and vegetable processing; it is dominated by ethnic and racial minorities, and in places dependent on immigrants, in some cases bused from the inner cities. No research has been done on the relationships between changes in the clam fisheries and the fortunes of either the processing firms or their employees (but see Griffith, 1997), much less on how such changes affect the communities in which the firms are located or the employees live.
Similarly, no research has focused on the community aspects of the harvesting sector of the clam fisheries. The fishing fleets move around quite a bit over time, following clams or clam buyers; hence many crew members are long-
distance commuters (e.g., between New Bedford, Massachusetts, and Cape May, New Jersey). Crew members often come from the hinterlands of port communities; thus, the Atlantic City fleet has little directly to do with Atlantic City; the owners and crew members live primarily in old "baymen" towns like Absecon and Tuckerton, New Jersey. In ports such as Cape May and Wildwood, the New Jersey clam fleet is part of a much larger fishing fleet, all embedded in a seasonal tourist economy, where fishing is one of the very few year-round occupations.
Occupational health and safety issues loomed large in this fishery; vessels frequently sank and men's lives were often lost each year in New Jersey and Delmarva waters by the late 1980s. A study of mortality rates in New Jersey showed that fishing was one of the most dangerous occupations in the state, and these rates resulted almost entirely from the surf clam and ocean quahog fisheries (P. Guarnaccia, personal communication, September 14, 1998). For example, five clam vessels capsized in New Jersey waters in 1989. A study of fishermen's perspective on marine safety showed that sea clamming was widely seen as one of the most dangerous fisheries, partly because of its technology and partly because of the regulatory system, which created pressures to harvest and bring in as much as possible in a very short period of time, often in bad weather (McCay, 1992). Disasters affect the larger community, and in the Cape May region the resident fishing community responds by hosting parties to raise funds for the families of fishermen lost at sea. The larger community has responded by raising funds for a memorial to the region's fishermen lost at sea.
Problems and Issues That Led to Consideration of an Individual Transferable Quota (ITQ) Program
The moratorium on new clam vessels (through the MAFMC) was widely considered a success in preventing overharvest of surf clams and fostering development of the ocean quahog fishery, but it was a cumbersome regulatory system that was costly to monitor and enforce. It was characterized by numerous regulatory changes (seven amendments to the FMP between 1978 and 1987). It was complicated by the fact that after 1980, the New England Fishery Management Council took responsibility for managing the smaller fishery in the New England area (Nantucket Shoals; for a short while also Georges Bank).
Many provisions of the FMP and its implementation were seen by industry and NMFS alike as burdensome, inflexible, and in need of change. A prime example is the use of restricted fishing time to ensure relatively even distribution of the harvest over the year, to benefit the processors. Until 1987, the NMFS Northeast regional director specified the number and length of allowable trips per week or other period (up to two weeks). The vessel owner chose the day or days he or she wished to fish, notified the regional director, and then had to "use or lose" the days. In the winter, one could obtain a makeup day, but if this day also was missed, the opportunity was lost. When combined with the inability to
consolidate allowable fishing time from one boat onto another, the system was obviously problematic. Moreover, the way this system was managed led to a large "ghost fleet" of mostly unused fishing capacity. Participation requirements were minimal, and owners of old and marginal vessels had incentives to retain their permits because such permits added to the value of the vessels.
Cheating (by fishing in closed areas, fishing a longer time than allowed, and taking undersized clams) was alleged to have been rampant. Much of the impetus for major changes in the management system came from concern about such administrative and enforcement difficulties.
Excess harvesting capacity was another major problem—indeed, in economic theory, the major problem. It was generated first in the open-access period, because the competition for dwindling stocks of clams provided an incentive for harvesters to use larger boats and more gear. Later, the moratorium and its grandfathering provisions allowed more boats than ever before into the restricted access fishery. Overcapitalization was intensified by (1) growth in size of the very abundant 1976 (New Jersey) and 1977 (Delmarva) year classes of surf clams, (2) technological changes such as more and larger dredges and hydraulic hoses, (3) the classic race to harvest the largest share of the TAC, and (4) increased skill and experience. These factors led to drastic increases in CPUE and equally drastic declines in allowable fishing time. Consequently, vessels were moored for much of the time unless their owners also participated in the ocean quahog fishery (which demands larger vessels with greater capacity) or the New Jersey or New York inshore fisheries (both of which are managed with limited access programs and have trip limits and other restrictions). Health and safety issues were also used to justify the development of ITQs.
Another issue identified in attempts to garner support for ITQs was that of obtaining financing from banks and other institutions, which are notoriously reluctant to support fishing ventures. The argument was that obtaining capital would be much easier if one had secure rights to a share of the total allowable catch.
Objectives of the ITQ Program
The SCOQ FMP was "preadapted" for ITQs in the sense that its objectives, from 1981, included economic efficiency and deregulation. These objectives were appropriate for the federal administration of its time and were endorsed by the Office of Management and Budget. The strong emphasis on economic efficiency was due to the participation of a neoclassical economist in the management process. Features of the 1977 SCOQ FMP, as amended in 1987 included the following:
- ". . . [C]onserve and rebuild Atlantic surf clam and ocean quahog resources
- by stabilizing annual harvest rates throughout the management unit in a way that minimizes short-term economic dislocations";
- "Simplify. . .the regulatory requirement of clam and quahog management to minimize the government and private cost of administering and complying";
- ". . . [P]rovide the opportunity for the industry to operate efficiently, consistent with the conservation of clam and quahog resources, which will bring harvesting capacity in balance with processing and biological capacity and allow industry participants to achieve economic efficiency including efficient utilization of capital resources by the industry"; and
- "A management regime and regulatory framework which is flexible and adaptive to unanticipated short-term events or circumstances and consistent with overall plan objectives and long-term industry planning and investment needs" (MAFMC, 1988, p. 1; 1996, p. 3).
ITQ Program Development Process and the Transition to ITQs
The 1977 moratorium was intended to be a stopgap, emergency measure to "be replaced by something else in a relatively short time. It lasted 12 years. However, among the alternatives being considered from the beginning was some system that would allocate quota to individual vessels: ". . . introduction of a per vessel allocation and some restriction on entry of new vessels (this might be a stock certificate program or an annual allocation per vessel)" (MAFMC Scientific and Statistical Committee, 1980; cited in Strand et al., 1981, p. 116). This theme appeared and reappeared throughout debates in the 1980s about how to reform management of the surf clam fishery (the ocean quahog fishery was not seen as problematic). As overcapitalization became more evident and, to some extent, costly for the participants, pressure mounted to change the system. It was intensified by frequent admonitions from NMFS to replace the moratorium with a more rational system.
By the mid-1980s, the major issue was whether and how to allow "consolidation" of fishing time among the vessels of the fleet. This incremental approach to the problem was advocated by the larger fleet owners but resisted by owner-operators and small fleet owners, concerned about the competitive advantage of the larger owners. It was also resisted by some of the big firms, concerned about rising competition from consolidation of rights to fish from the so-called ghost fleet (Marvin, 1992). Entrepreneurs accumulated the marginal, non-fishing, and sometimes sunk vessels with the hopes that they might be able consolidate their permits.
Around the same time the theme of "vessel allocation" reappeared: the notion of giving part of the quota to each vessel to minimize the costly and dangerous race for the quarterly quotas and the incentive to overload boats during the few hours they were allowed to fish. Vessel allocation was stymied by conflicts over how to make the allocations, given large differences in interest and power in the industry. An abiding concern among industry participants was that
either consolidation or vessel allocation might further the monopsony (or oligopsony)1 power of vertically integrated processors, which could lead to price collusion, forcing smaller processors and independent harvesters out of business (see Strand et al., 1981; McCay and Creed, 1990).
By 1988, the council, led by a Plan Development Team and the advice of the council's Surf Clam and Ocean Quahog Committee, was prepared to proceed beyond individual vessel allocations to ITQs, which were separable from the vessels and fully marketable. However, as of July 1988, there were still provisions in the draft FMP amendments reflecting concerns about the effects of rapid consolidation on the industry, including a "phase-in period" of three years, during which permits and allocations could be combined at no more than the rate of two for one, for each of the three years (MAFMC, 1988). However, these provisions completely disappeared in the amendment that was finally adopted by the council in October 1989 and approved by the National Oceanic and Atmospheric Administration (NOAA) in March 1990 (MAFMC, 1990).
The ITQ Program2
Management Units. The management unit included all surf clams and ocean quahogs in the Atlantic EEZ. This fit original Magnuson-Stevens Act policy and reversed the situation that had emerged after 1980, when management was divided between the Mid-Atlantic Fishery Management Council, concerned about overharvesting, and the New England Fishery Management Council, attempting to foster development. It also came to pose a major problem, because it included ocean quahogs being fished in federal waters by a small-scale fishery in Maine, for which there had been no logbooks and hence no historical records to use for allocation.
Initial Allocation. The initial allocation of quota share was divided among owners of all permitted vessels that harvested surf clams or ocean quahogs between January 1, 1979, and December 31, 1988. Replacement vessels were credited with the catch of vessels they replaced. These were all commercial fishing vessels, mostly working the waters of the Mid-Atlantic region.
Different formulas were used for allocations of surf clams in the Mid-Atlantic region versus ocean quahogs in both regions and surf clams in New England. For Mid-Atlantic surf clams, allocation was based on a vessel's average historical catch between 1979 and 1988. The last four years were counted twice, and the worst two years were excluded. The resulting figures were summed and divided
|
1 |
A market situation in which each of a few buyers exerts a disproportionate influence on the market. (Merriam-Webster, Inc, 1998. The WWWebster Dictionary [Online] [Available: http://www.m-w.com/cgi-bin/dictionary] September 1, 1998). |
|
2 |
This program was first approved by the MAFMC in July 1988 and by NOAA in March 1990; it was implemented in October 1990 (MAFMC, 1990). |
by the total catch of all harvesters for the period. Eighty percent of a vessel's allocation came from this ratio. A second ratio was computed on the basis of vessel capacity (length x width x depth), called a "cost factor," and this accounted for 20% of the vessel's initial allocation.
For ocean quahogs and New England surf clams, allocation was determined from the average historical catch for the years actually fished between 1979 and 1988, excluding the lowest-catch year. The average New England surf clam catch was then included in the total surf clam catch to calculate individual vessel ratios in the newly defined larger region, which incorporated both the Mid-Atlantic and New England stocks.
Nature of the ITQ. The ITQ has two components: (1) the "quota share," expressed in percentages of the TAC, which can be transferred permanently, and (2) the "allocation permit," which are in the form of tags to be attached to the large steel cages used to hold the clams after they are harvested. They can be transferred only within a calendar year. Annual individual quotas are calculated by multiplying the individual quota share by the TAC or allowable harvest in bushels. Bushel allocations are then divided by 32 to yield the number of cages allotted, for which cage tags are issued. Cage tags may be sold to other individuals but are valid for only one calendar year.
Accumulation and Transfer of Quota Shares. The minimum holding of SCOQ ITQs is five cages (160 bushels); there is no maximum holding and no limit to accumulation, except as might be determined by application of U.S. antitrust law. Anyone qualified to own a fishing vessel under U.S. law is entitled to purchase ITQs, except entities with majority foreign ownership. There are no limits on transfer of quota share. Cage tags are transferred only within a given year and cannot be transferred between October 15 and December 31 of each year. All transfers must be approved by the NMFS northeast regional director.
Monitoring and Enforcement. Monitoring the harvest of clams under the ITQ program is facilitated by the cage-tagging requirement and by mandatory reporting to NMFS by vessel owners and dealers of clams landed and purchased. Allocation permit numbers must be reported on both vessel logbook reports and dealer-processor reports. Dealers and processors must have annual permits. The cage tags are monitored closely. However, no reporting is required from truckers and other carriers.
Enforcement relies heavily on shoreside surveillance, the cage tag system, and cross-checking logbooks between vessels and processors. During seasons when state fisheries are open, at-sea and air surveillance is also required to reduce the possibility that vessels with state permits or cage tags may stray into federal waters. Allocation permits and dealer/processor permits may be suspended, revoked, or modified for violations of the FMP.
Setting of Quotas and Other Biological Parameters. The FMP is a "framework" plan that establishes the allowable range of harvest, but each year the MAFMC must recommend specific quotas, with input through various fishery management council venues, such as hearings, a public comment period, and an Industry Advisory Panel.
Unique in this fishery is the fact that the annual quotas, within constraints set for biological and long-term industry reasons, can be set "at a level that would meet the estimated annual demand" (MAFMC, 1997, p. EA-1). This policy would, in theory, meld the economic interests and incentives of ITQs with more general conservationist objectives. The policy, adopted in 1992, reflects a longer history of arguments by some segments of the industry for reducing the quota below the level warranted by stock assessments, especially for ocean quahogs. Some might see the arguments as expressions of the effects of ITQ incentives for conservation, but they existed prior to ITQs.
Administration and Compensation. No resource rents are collected from SCOQ ITQ fisheries; allocation permit fees are collected to help cover administrative costs, including the production and distribution of cage tags.
Evaluation and Adaptation. Evaluation and adaptation take place through the amendment process of the MAFMC, as well as reviews from within NOAA and studies done by outsiders. Major changes since 1990 have focused on meeting the overfishing requirements of the Magnuson-Stevens Act and dealing with the problem of the Maine mahogany clam fishery (Amendment 10). After the defeat of several lawsuits filed by industry groups challenging features of the plan, the general approach of industry appears to be acceptance and desire for consistency and predictability, as opposed to frequent change. Most industry attention is now devoted to the quota-setting process and outcomes.
Outcomes of the ITQ Program
Biological and Ecological Outcomes for the Fishery. TACs have not been exceeded during the ITQ period. MAFMC policy is to set the quota within the OY range ". . . at a level that will allow fishing to continue at that level for at least 10 years. Within the above constraints, the quota is set at a level that will meet estimated annual demand" (DOC, 1996, p. 12). For surf clams, the OY range equals 1,850,000 to 3,400,000 bushels; for ocean quahogs, the OY range equals 4,000,000 to 6,000,000 bushels (DOC, 1996).
The minimum size limit of 4.75 inches has been suspended, because the large size of most populations and incentives to search for and concentrate on aggregations of large clams mean that small clams will be avoided. These incentives come from buyers, who want large-size, high-yield clams and are strengthened by the end of competitive racing for clams due to ITQs.
One recent development is the discovery that SCOQ resources may be much more abundant and resilient than previously thought. The seemingly anomalous results of a 1994 NMFS survey of surf clams drew critical attention to NMFS survey methods and stock assessment process. In 1997, in cooperation with the industry, NMFS carried out experiments on dredge efficiency, the results of which were combined with new surveys to revise estimated total biomass. For surf clams, the results show that the stock is at "medium" level of biomass and "probably underexploited overall," although the most heavily fished area, northern New Jersey, is unlikely to result in increased catches. In addition, it is now recognized that recruitment is occurring at least annually, rather than decadally. The view on ocean quahogs, which had previously been determined to meet the "overfishing" definition, also changed; it too is now seen as at a medium to high level of biomass and to be underexploited, at the scale of the management unit, although local aggregations may be close to overexploitation (NEFSC, 1995).
Little is known about bycatch in these clam fisheries. The effects of dredging on benthic communities and habitat for other creatures are also unknown. The ITQ program is alleged to encourage targeting and selection of clam populations that meet industry demand—that is, high-yield, relatively large clams, in fairly pure aggregations. To some extent, pricing favors this strategy. Effects of such strategies on the ecology and biology of clams are unknown. Targeting of larger clams discourages harvesting densely populated beds of slow-growing clams, such as beds off Chincoteague, Virginia.
There was a shift northward in landing of surf clams and ocean quahogs during 1988-1996, partly in response to declining CPUE in waters off southern states (e.g., Virginia) as well as in heavily fished areas off southern New Jersey. The processing sector also has begun to move to southern New England ports, giving further impetus to a harvesting move north.
There has been a decline in discards under the IFQ program, typically of small clams (NEFSC, 1995). Between 1981 and 1989 there were minimum sizes, as well as area closures, to protect small clams that had not yet reached recruitment size, and both discarding and illegal harvests were substantial. Incentives for discarding were decreased when the council lifted minimum size limits because of data showing relatively low proportions of undersized clams (NEFSC, 1995), although processors continued to ask for large clams of high meat yield. ITQs may have provided some of the incentives for giving more effort to searching the locations with large clams and high meat yield, although this has not been documented.
Economic and Social Outcomes for the Industry. Appraisals of the SCOQ fishery have shown that since the introduction of ITQs in late 1990, economic efficiency in clam harvesting has increased and excess harvesting capacity has declined (McCay and Creed, 1994; Wang, 1995; Adelaja et al., 1998). Illustrative data are provided in Table G. 1.
TABLE G.1 Changes in Fishing Effort, Ownership, and Catches for EEZ Surf Clams and Ocean Quahogs, 1988 and 1994
|
|
Year |
|
|
|
1988 |
1994 |
|
Vessels fishing for SC |
133 |
48 |
|
Vessels fishing for OQ |
62 |
35 |
|
Owners of SC vesselsª |
56 |
28 |
|
Owners of OQ vesselsª |
25 |
17 |
|
Hours fished/vessel, SC |
404 |
1,400 |
|
Hours fished/vessel, OQ |
537 |
1,249 |
|
Average bushels/trip, SC |
992 |
1,149 |
|
Average bushels/trip, OQ |
1,458 |
1,491 |
|
Average trips/vessel, SC |
23 |
52 |
|
Average trips/vessel, OQ |
49 |
88 |
|
ª Ownership is based on interviews to determine "true ownership," recognized in the industry as such, as distinct from official ownership in NMFS files, which is often in the name of vessel-specific corporations, leading to possible errors in reporting and judgment. Note that these data pertain to vessels actually fishing according to logbook information; owners may continue to own inactive vessels and/or quota shares. Also note that some owners (ca. 30%) have both surf clam and ocean quahog vessels and that some of the vessels are used in both fisheries. SOURCE: Adelaja et al. (1998). |
||
The smallest firms, in terms of either the number of vessels owned or the amount of initial ITQ allocation, were most likely to sell out in the period from 1990 to 1992. However, small firms were also resilient; two-thirds of the smallest holders kept their ITQs and about 18% actively participated in the market for ITQs by buying and selling quota, as did the majority of large firms. The medium-sized firms (i.e., holding 1-6% of the initial quota) in the surf clam fishery were most likely to purchase more ITQs; only 2 of 17 sold out. None of the largest firms (>6% initial quota) had sold out by 1992 (McCay and Creed, 1994), although some did later.
A substantial number of firms stopped fishing but held onto and leased out their quota shares. As of 1992, roughly one-third (32%) of those who held surf clam ITQs did not fish for surf clams, presumably leasing out their quota; the figure was even higher for ocean quahogs (46%). To some extent the high level of leasing or temporary transfers of cage tags was due to uncertainty about the future and about the market for ITQs on the part of people who were planning to leave the fishery. However, from interviews it was learned that many had come to recognize the nature of this new asset and its ability to generate income through leasing (McCay and Creed, 1994).
The chance that a firm would leave the clam fishery (not necessarily the ITQ program) was greatest at the beginning, decreased during the first two years, and increased again, to reach an equilibrium in the fourth year (Weisman, 1997). Being an “independent" or non-vertically integrated firm that owned only one or a few vessels had no significant effect on the chances of surviving in the fishery by the end of 1993 (Weisman, 1997).
The size of the initial allocation for ocean quahogs was directly proportional to the chance of remaining in the fishery until the end of 1993; there was no such effect for surf clams. However, for firms with both surf clam and ocean quahog initial allocations, smaller firms were more likely to leave the fishery than larger firms (Weisman, 1997).
ITQs worked in the surf clam fishery to accentuate the effects of other variables on how many clams were caught; the rapid reduction in the number of vessels used encouraged organizational changes that allowed more efficient use of production inputs (Adelaja et al., 1998). The effects were less noticeable in the ocean quahog fishery, which did not have the degree of overcapitalization present in the surf clam fishery. The major effect of ITQs in the ocean quahog fishery was the initial shake-out; those remaining after an initial round of ITQ allocation transfers had greater catch and market share than initially.
Between 1990 and 1994, clam prices were not statistically significant determinants of total catch (Menzo et al., 1997). However, the catches of firms of different sizes, as measured by average monthly landings, did respond differently to changes in price, suggesting industrial reorganization. These results fit the theory that large firms are relatively buffered against price changes, whereas small- and medium-size firms are either more vulnerable to changes in price or more flexible in responding to them.
Between 1988 and 1994, market share, an indication of firm size, had no relationship to price received for catch, suggesting the lack of monopoly in the seller's market (Adelaja et al., 1998). However, owners who leased ITQs from others for a large portion of their landings and who had large shares of the landings seemed to have some advantage in terms of the price they received for their clams (Menzo, 1996).
For surf clams, the dominance of the top four harvesting firms in terms of landed clams never exceeded 56% and hence did not meet technical definitions of "oliopoly" (>60%); their dominance varied substantially but was changed little by the onset of ITQs. However, companies with the highest market shares remain constant over the period, and the average prices received were among the lowest. The situation for ocean quahogs was similar, but with a slight decline in dominance by the top four firms in the ITQ period. Three of the operators are consistently at the top, the same companies as those at the top of surf clam landings; again, the average prices they received were among the lowest (Menzo, 1996). One explanation of this effect is that these firms are vertically integrated,
making the price received at the dock less consequential for the firm's owner than for the captain and crew on the boat.
In terms of ITQ holdings, concentration of ownership increased for ocean quahogs; the largest firm in 1992 held 35.3% of the ocean quahog quota share. For surf clams, concentration of ownership did not change significantly; in 1992, the largest firm held 22.6% of the surf clam quota share. The surf clam fishery tends to have a more bimodal distribution of large versus small operators, whereas the structure of the ocean quahog fishery tends to be more evenly distributed, with a middle class of shareholders as well as large operators (McCay and Creed, 1994).
After ITQs were implemented, a few buyers-processors gained dominance (Wang, 1995; Weisman, 1997). Empirical modeling shows the general importance of buyer-seller relationships in relation to survivability in the fishery (Weisman, 1997). Reliance on a single buyer in 1990 increased the likelihood of exiting the fishery by the end of 1993; on the other hand, selling most of one's catch to the top six buyers decreased the likelihood of exiting the fishery. Distortions may also exist in the market for ITQs themselves; empirical research has not been done on this question.
Lorenz curves were constructed for 1988, 1990, and 1994 surf clam landings, by owner, showing a high degree of skewedness, expressing inequality in the distribution of wealth in terms of landings (Gini Concentration Ratio > .55), but this actually decreased with ITQs as many of the smaller firms stopped fishing (Menzo, 1996). For those who remain active in the SCOQ fisheries, the distribution of landings has become more equal, not less. Of course, there are other sources of inequality, including ownership of ITQs, which was not covered in the Menzo study, which looked solely at landings.
Economic and Social Outcomes for Fishery-Dependent Communities. Employment in the clam industry has declined, leading to downward shifts in the bargaining power of crew members and captains, symbolized and to some degree exacerbated by changes in the share system of returns to owners and crew members (McCay et al., 1990; McCay and Creed, 1994). Some owners tried to mitigate these impacts by keeping boats fishing even when not really needed, but as Table G.1 shows, the reduction of boats, and hence crew, was very rapid and very radical, even though crew reductions had already taken place during the latter years of the moratorium era (McCay and Creed, 1994).
A common practice, from the outset of this system, was for the owners of vessels to deduct the cost of leasing quota, as an operating expense, from the amount that would be shared among captain and crew members. The exvessel price paid to the crew by the vessel owner also might be reduced by leasing. For example, an owner might receive $8.00 per bushel for surf clams from a processor, but only pay "the boat" $4.00 per bushel because the cost of leasing allocation from the processor is deducted. This might be done even if the boat owner
actually owns the allocation, or the owner might transfer the allocation to the processor to create a legitimate paper trail for tax purposes (Ross, 1992).
Improved safety was a major selling point for the SCOQ ITQ system. In the early IFQ period, 1990-1992, many people in the industry voiced the opinion that this was a sellout, largely because of the sinking of two clam vessels, the John Marvin and the Valerie E, in a fast-building storm in the late winter of 1991, following the loss of another boat the year before. In interviews, people said that ITQs did not help because the processors still demanded that vessels fish when the product was needed, regardless of weather conditions (Beal, 1992; McCay and Creed, 1994). Despite sharp reduction in the number of vessels in the fleet, particularly the older boats, the incidence of loss of vessels and lives at sea in the 1990s is comparable to what it was in the 1980s, when an average of one boat a year was lost. In January 1999 five clam boats and eleven lives were lost in separate events; another vessel was lost in 1997. Accordingly between 1990, when ITQs went into effect, and February 1999 nine clam boats and at least fourteen lives have been lost in this fishery. Clearly, sea clamming remains a dangerous occupation. The role of ITQs in either mitigating or enhancing its dangers is not known.
Little research has been done on the effects of ITQs—or other changes in the SCOQ industry—on local communities. However, it is clear that the appearance and disappearance of fishing vessels, and particularly processors, can have a major impact on some communities. The major source of impacts on communities is likely to be the processing sector, which has become dominated by a few large firms since ITQs began. The effect of ITQs on processor organization and concentration has not been shown in empirical economic studies; however, the vertically integrated processors had an advantage in the competition for clams over processors that did not own boats prior to ITQs. The vertically integrated processors obtained "free" quota shares during the initial allocation, whereas the others had to either purchase shares or bargain with vessel owners to supply them with clams, increasing the costs of their operations.
Administrative Outcome. Data Management. According to a 1992 NMFS evaluation, agency officials charged with administering the ITQ program found it impossible, given the nature of reporting, to determine the identity of the owning "persons" (Goodale and Raizin, 1992); many allocations were reported as owned by corporations or vessels, and the device of using addresses to identify true owners was deemed inadequate to the needs of the law. As noted below, enforcement officials were also concerned that they could not obtain real-time data on who owned how much ITQ for their purposes.
Enforcement. According to an internal NMFS review, enforcement was very problematic at the beginning of this ITQ program (McCarthy, 1992). The Mid-Atlantic region had the fewest NMFS enforcement personnel in the Northeast, and the ITQ Amendment to the FMP was allegedly designed without adequate
input from enforcement officers, such that standard provisions were left out (i.e., the illegality of giving false statements to authorized officers).
Moreover, implementation was rocky; enforcement officers were not given real-time information regarding who had which cage tags or ITQs. These and other problems were mitigated somewhat by the heavy reliance on cage tags for monitoring, as well as the ability to cross-check logbooks of harvesters and processors (but not truckers, who were not required to keep records).
It has also proved difficult, if not impossible, to enforce a provision in the preamble to the final rule that the government would periodically monitor the number of quota shares owned by each person and advise the Department of Justice if any one had an "excessive share" (MacDonald, 1992). This provision was intended to justify having no limits on accumulation in the plan. As of early 1992, attorneys were unsure about how, if at all, this could be applied to the SCOQ fishery, raising questions such as whether or not the SCOQ market was a "market" within the meaning of the Sherman Anti-Trust Act (MacDonald, 1992). The excessive share provision has no definition, and courts have thus far not been concerned unless concentrations approach monopoly levels, which appears not to be the case in the SCOQ fishery (Milliken, 1994; Sea Watch International v. Mosbacher).3
Current Perceived Issues. The major issues related to the existing IFQ program include the following:
- Security of the program, given the attempts in Congress to forbid the creation of new ITQ programs and to impose sunset provisions on existing ones (Creed and McCay, 1996);
- Lack of adequate (1) stock assessments and population biology studies and (2) economic studies of supply and demand to be used with confidence in the annual quota-setting process;
- Enforcement in fisheries that include both state and federal waters;
- Concentration of shares and market power resulting from a lack of definition in the Magnuson-Stevens Act of excessive shares and small likelihood that the Sherman Act would be used to prosecute holders of excessive share (MacDonald, 1992; Milliken, 1994); and
- Need for a lien registry and other ways to strengthen the ability of IFQs to function as collateral, without transforming them into property rights.
Alaskan Halibut and Sablefish IFQ Case Study
Prior Regulatory Conditions in the Fishery
Commercial fisheries for Pacific halibut (Hippoglossus stenolepis) and sablefish (Anoplopoma fimbria) have occurred off the Pacific Northwest, British Columbia, and Alaska for more than a hundred years. Carrothers (1941) estimates that British Columbia natives consumed more than 272 metric tons of halibut per year in the late 1880s. Development of large-scale commercial fisheries for halibut was stimulated by the completion of transcontinental railroads in the late 1880s. Carrothers (1941) reports that coastwide commercial landings of halibut exceeded 808 metric tons in 1889, 3,126 metric tons in 1899, and 9,866 metric tons in 1909. With the depletion of nearshore fishing grounds, Canada and the United States negotiated the Halibut Treaty of 1923 and established the International Fisheries Commission (later renamed the International Pacific Halibut Commission, IPHC) to investigate the halibut resource and recommend conservation measures. With the passage of the Fishery Conservation and Management Act (FCMA) of 1976 and similar legislation in Canada to establish 200-mile fishery conservation zones, and renewal of the halibut convention in 1979, the North Pacific Halibut Act of 1982 delegated limited entry and allocation decisions to the Pacific Fishery Management Council (PFMC) and North Pacific Fisheries Management Council (NPFMC). Canadian halibut fishermen were excluded from U.S. waters (and vice versa) in 1978. Recent catches of halibut and sablefish are depicted in Figure G.1.
From its inception in the 1950s through the early 1980s, the sablefish fishery off Alaska was dominated by foreign fishing operations (Figure G.2).
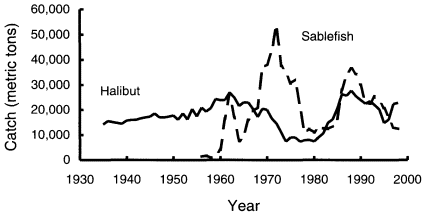
Figure G.1
Commercial catches of halibut and sablefish.
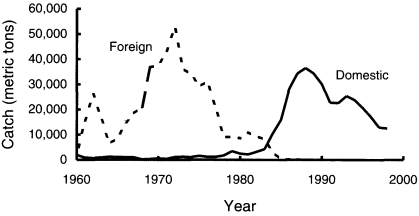
Figure G.2
Foreign and domestic commercial catches of sablefish.
Access. In U.S. waters, access to the halibut and sablefish fisheries was unrestricted prior to the passage of the FCMA. Following the act's implementation, various moratoriums were proposed but none were approved, so access remained open until the implementation of IFQs in 1995.
Limits on Catches. Annual limits on commercial catches of halibut are set for each IPHC regulatory subarea. Although the area boundaries have changed slightly over time, particularly in the Bering Sea and Aleutian Islands (Area 4), the 1996 regulatory areas are relatively representative (Figure G.3).
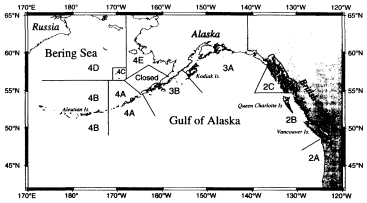
Figure G.3
IPHC regulatory areas (1996).
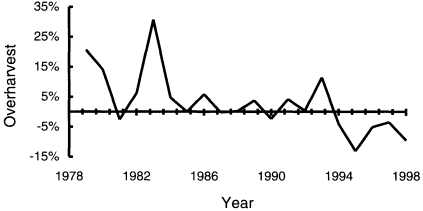
Figure G.4
Percentage overharvest of Pacific halibut in the directed commercial fisheries in the U.S. EEZ (IPHC regulatory areas 2C, 3A, 3B, and 4).
Individual vessel trip limits were imposed in various areas between 1988 and 1994. Trip limits have typically been applied late in the season when the remaining allowable catch was less than the unfettered fishery was expected to harvest in a single fishing period. Trip limits have been graduated by vessel class. Even with trip limits, the commercial fishery exceeded the coastwide catch limit by an average of 812 metric tons (4.9%) between 1977 and 1994 (Figure G.4).
Annual limits on catches of sablefish are set for four areas in the Gulf of Alaska (East Yakutat and Southeast Outside, West Yakutat, Central Gulf of Alaska, Western Gulf of Alaska), the Aleutian Islands, and the Bering Sea (Figure G.5). Limits on halibut and sablefish bycatch are established for combinations of target fishery and management area.
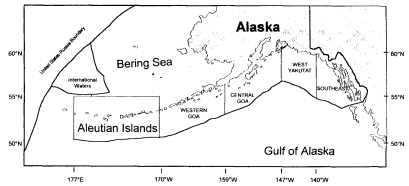
Figure G.5
Sablefish management areas.
Limits on Gear and Seasons. Catches of halibut and sablefish have historically been controlled through a combination of area, season, and gear restrictions. Most vessels that are engaged in these fisheries are catcher vessels that do little processing of the catch at sea. However, there are a few catcher-processor vessels (freezer-longliners) in the halibut fishery and a larger number in the sablefish fishery. The directed fishery for halibut uses longline gear. The directed fishery for sablefish uses longline, pot, and trawl gear. In the eastern Gulf of Alaska, 95% of the sablefish TAC is reserved for longline operations. Elsewhere in the Gulf of Alaska, longline fishermen are allocated 80% of the TAC. The use of pot gear for sablefish is prohibited in the Gulf of Alaska, but permitted in the Aleutian Islands and the Bering Sea. The Bering Sea TAC is split 50:50 between fixed gear (longline and pots) and trawls. Seventy-five percent of the Aleutian Islands TAC is reserved for fixed gear.
Reporting Requirements. Halibut buyers in Alaska are required to record landings on fish tickets (official landing receipts) from the Alaska Department of Fish and Game (ADF&G), which are either mailed directly to the IPHC or delivered to ADF&G offices and forwarded to the IPHC. Washington and Oregon fishery departments and the Canadian Department of Fisheries and Oceans also forward halibut landings data to the IPHC. The IPHC has also collected logbook data on an occasional basis to supplement information on the CPUE, productive fishing locations, gear configuration, and the mortality of undersized fish that are discarded.
Prior to 1986, ADF&G fish tickets were the sole source of landings data for the sablefish fishery off Alaska. Because at-sea processors were not subject to ADF&G reporting requirements, beginning in 1986, they were required to file "hail weight" reports with NMFS. These reports eventually evolved into the current Weekly Processor Reports. With expansion of the observer program in 1990, observer estimates of landings became available for some larger vessels (30% of vessels greater than 60 feet in overall length). In addition, logbook reporting requirements were strengthened to facilitate on-site verification of catches.
Prior Biological and Ecological Conditions in the Fishery
Pacific halibut and sablefish are both long-lived bottom-dwelling species. Halibut are the largest commercial species of the North Pacific, averaging 18 kg each, but occasionally exceeding 180 kg. Halibut are primarily found at 15-200 m depths on sand, gravel, or cobble substrates. Sablefish are considerably smaller (<5 kg) and occur at somewhat greater depths (100-1,500 m). Halibut are distributed from California to the Sea of Japan and into the Bering Sea (IPHC, 1987; Trumble et al., 1993). Sablefish extend this range to include waters off Baja California. Each species is considered a single stock throughout its range. Note, however, that whereas halibut are jointly managed by the United States and
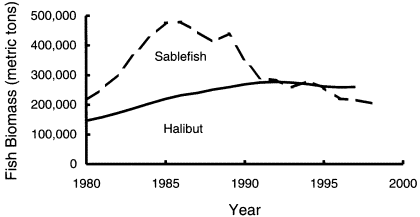
Figure G.6
Recent trends in coastwide estimates of halibut and sablefish biomass.
Canada, sablefish are not, and neither species is co-managed with Russia, Korea, Japan, or other principal harvesters.
Although the estimated 1997 coastwide biomass of Pacific halibut (260,423 metric tons) is 26% above the most recent 25-year average, it has declined somewhat in recent years, and based on moderate recruitment and reduced growth rates, is expected to continue to decline in the near future (IPHC, 1997). In addition, the average weight-at-age has declined 50% over the past decade.
The sablefish exploitable biomass was estimated to be 265,000 metric tons in 1996 (NPFMC, 1997a). The stock has been declining since 1986 and is 30% below the recent average. The biomass of sablefish is expected to continue to decline due to poor recruitment since 1982. The overfishing limit (OFL) for 1998 is expected to be less than 35,950 metric tons. It is anticipated that the allowable biological catch (ABC) for 1998 will be less than 17,200 metric tons. The TAC must be less than the ABC, to provide a buffer. The size of this buffer is based on the stock status and the quality of information available. See Figure G.6 for halibut and sablefish biomass trends.
Prior Economic and Social Conditions in the Fishery
Analyses of the markets before IFQ implementation are limited for halibut and nonexistent for sablefish. Crutchfield and Zellner (1962), Lin et al. (1988), Homans (1993), and Criddle (1994) describe the bioeconomics of pre-IFQ halibut fisheries using rudimentary models of the exvessel market structure. Although Herrmann (1996) provides a more realistic model of market structure, he deals exclusively with the Canadian fishery following the 1991 adoption of IVQs (individual vessel quotas), but prior to the 1995 adoption of IFQs in Alaska.
None of these models accounts for demand for halibut while simultaneously accounting for Canadian, U.S., and Russian supplies, and export markets. Figure G.7 presents a time series of real (1992) exvessel prices for catches of halibut and sablefish and Figure G.8 shows exvessel revenues.
In addition to being the focus of a directed commercial fishery, Pacific halibut is caught as bycatch in a variety of other commercial fisheries, treaty Indian fisheries, personal-use fisheries, and sport fisheries (Figure G.9). Halibut bycatch mortality has averaged 18% (6,405 metric tons) of the total halibut catch in recent years (1984-1996). Sport fishing has grown from 3% (857 metric tons) of the 1984 total catch to 11% (3,514 metric tons) of the 1996 total halibut catch. The treaty and personal-use halibut fisheries are small by comparison. The treaty Indian fisheries of the Pacific Northwest were allocated about 80 metric tons and the Metlakatla Indian Community was allocated 23.6 metric tons in the Annette Island Reserve Fishery in 1995.
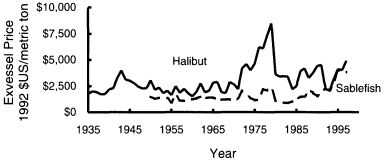
Figure G.7
Real gross exvessel price of halibut and sablefish in 1992 dollars.
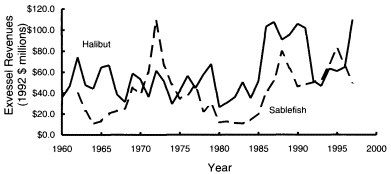
Figure G.8
Real gross exvessel revenues from halibut and sablefish in 1992 dollars.
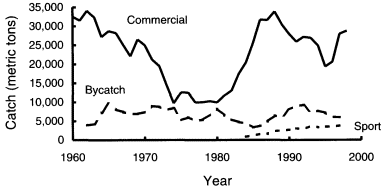
Figure G.9
Commercial longline catches, bycatches, and sportfishing catches of halibut in the U.S. EEZ off Alaska.
Bycatches of halibut must be discarded if taken with other than hook-and-line gear or if taken when the directed fishery is closed. Similar restrictions apply to sablefish, although pots are a permitted gear in the Bering Sea.
Participants in the halibut fishery were heterogeneous. Although many vessels were specifically rigged for efficient longline operation, other vessels were jury-rigged for halibut fishing during the short open seasons. For example, salmon gillnetters could spool-off their nets and load longline gear on their gillnet drums for the short halibut open seasons. Many halibut fishermen were engaged in other (non-fishing) primary occupations and took leave to participate in the short seasons. Figure G.10 represents the percent average (1982-1995) real exvessel value of commercial catches off Alaska. Halibut and sablefish have accounted for 5% and 4%, respectively, of the $1.3 billion average exvessel value of Alaskan commercial catches.
Although halibut and sablefish together accounted for less than 10% of the average exvessel value of Alaskan fisheries, they are regionally significant. The 1991 distribution of halibut catches by the residency of the permit holder is represented in Figure G.11 (NPFMC, 1994a,b).
Problems and Issues That Led to Consideration of an IFQ Program
The problems and issues that led to consideration of an ITQ program for halibut and sablefish were allocation conflicts; gear conflicts; ghost fishing due to lost gear; bycatch loss in other fisheries; discard mortality for halibut, sablefish, and other retainable species in the halibut and sablefish fishery; excess harvesting capacity; product wholesomeness as reflected in real prices; safety; economic stability in the fishery and communities; and rural coastal community develop-
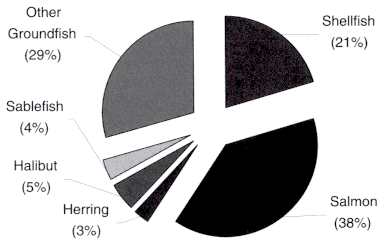
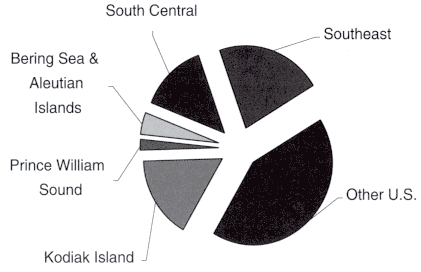
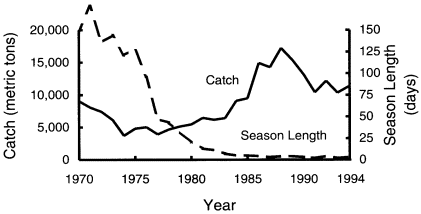
Figure G.12
Changes in catch and season length in the Area 3A (central Gulf of Alaska) halibut fishery from 1977 to 1994, before the introduction of IFQs.
ment of a small-boat fishery (NPFMC, 1991a,b,c). Evidence of some of these problems can been seen in time series of the number of participants, season length, fishing effort, and CPUE. The number of participants in the halibut and sablefish fisheries reached a maximum of 3,883 in 1990 for halibut and 706 in 1988 for sablefish (Pautzke and Oliver, 1997).
The central Gulf of Alaska (IPHC Area 3A) has accounted for 37-51 % of the U.S.-Canadian commercial halibut catches since 1977. During this time, and despite a tripling of catch, the season length collapsed from 47 days to 2-3 days (Figure G.12). Using season length to manage fisheries becomes harder as effort increases and season length shrinks. If vessels had not been placed on trip limits after the first one-day halibut season opening in recent years, season length would have had to collapse even further to avoid overharvesting. A similar contraction of season length in response to increased fishing effort can be seen in the West Yakutat sablefish fishery (Figure G.13).
Gear conflicts can arise within or between gear types. Under the short derby seasons, conflicts between halibut and sablefish longline operations and other gear types were, by default, infrequent. Because trawling is very restricted in the Gulf of Alaska, conflict between gear types may be minor even under longer seasons. Conflict between users of similar gear can develop when some areas and times are more advantageous than others. The regulated open-access fisheries were characterized by a high incidence of lost and unrecovered fishing gear. The IPHC estimated that 1,860 “skates" (roughly 1% of the gear fished) was lost in 1990 and that the lost gear accounted for about 900 metric tons of halibut mortality (3% of the commercial catch).
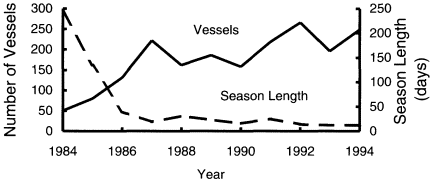
Figure G.13
Participation and season length in the West Yakutat sablefish fishery from 1984 to 1994, before the introduction of IFQs.
Short seasons have been cited as a contributing factor to the accident rate in the pre-IFQ halibut and sablefish fisheries. In the pre-IFQ fishery, the decision to sit out bad weather often amounted to a decision to sit out the fishing season. Another concern that led to the consideration of IFQs was the perception that exvessel prices for halibut were below what they could be if product deliveries were more distributed throughout the year.
The Environmental Assessment/Regulatory Impact Review identifies ten problems that the ITQ program was intended to address (NPFMC, 1991 a):
- Allocation conflicts;
- Gear conflicts;
- Deadloss due to lost gear;
- Bycatch loss of halibut and sablefish in other fisheries;
- Discard mortality of halibut, sablefish, and other retainable species in the halibut and sablefish fisheries;
- Excess harvesting capacity;
- Product wholesomeness as reflected in prices;
- Safety;
- Economic stability in the fishery and communities; and
- Rural coastal community development of a small-boat fishery.
IFQ Program Development Process and the Transition to IFQs
Following implementation of the FCMA, the NPFMC appointed a Plan Team to develop recommendations for management of the halibut fishery. The team's draft FMP proposed a limited entry program with a moratorium on new entry set at December 31, 1977. The council approved the draft FMP with the moratorium date revised to December 31, 1978. The draft FMP was shelved in late 1978 when the U.S.-Canada halibut convention was renewed. The NPFMC next approved a one-year moratorium on entry for 1982 with a cutoff date of December 31, 1981, but because the action was conditional on passage of an amended North Pacific Halibut Act and because the amended act was not passed until after the start of the 1982 fishing season, no action was taken. In early 1983, the NPFMC approved a three-year moratorium to begin on June 15, 1983. However, the NOAA administrator disapproved the NPFMC action and suggested instead that the NPFMC investigate a permanent limited entry system. The NPFMC began evaluating license limitation for the sablefish fishery in 1985 and IFQs in 1988. The NPFMC also revisited halibut license limitation and began consideration of individual fishing quotas in 1988. In January 1990, the NPFMC selected IFQs as the preferred management option for sablefish. In December 1990, the NPFMC linked further consideration of halibut license limitation and IFQs to ongoing analysis of similar measures in the sablefish fishery. In December 1991, the NPFMC approved IFQ programs for halibut and sablefish. The final rule creating halibut and sablefish IFQs was published in the Federal Register on November 9, 1993, for implementation in 1995.
The IFQ Programs
Management Units. The halibut IFQ program applies to all commercial hook-and-line harvests of halibut in state and federal waters off Alaska. The program does not apply to subsistence, treaty, or sport fisheries or to bycatch with trawl or pot gear. The sablefish IFQ program is limited to longline and pot gear fisheries in federal waters off Alaska and does not apply to sablefish harvested in state waters or in the trawl fisheries. Although most of the sablefish harvests are from federal waters, fishing for sablefish also takes place in state waters along the Aleutian Islands, in Prince William Sound, and in the vicinity of Chatham Strait in Southeast Alaska.
Nature of the IFQ. In the terminology adopted by the NPFMC, an individual's initial quota share (QS) allocation was set to equal the sum of his or her catches during selected qualifying years, less an adjustment for shares allocated to the community development quota (CDQ) program. The IFQ is the individual's annual allocation and is determined by dividing each individual's QS by the sum of all the QS in a region, the "QS pool," and multiplying the result by the annual
fixed-gear portion of the total allowable catch. The allocation of QS was specific to area, operation mode, and vessel size category, with restrictions on transfer between vessel size classes, operation mode, and area. In addition, shares less than 20,000 pounds were "blocked" such that they could not be subdivided on transfer.
In general, owners are required to be on board when their IFQ is being fished. Exceptions are that initial QS recipients are allowed to hire "masters" to fish halibut QS in Areas 3 and 4, and that corporations and partnerships may hire masters in Southeast Alaska. Similar provisions apply to sablefish QS. With some short-term exceptions, for quota shares acquired through inheritance or divorce settlements, second-generation IFQ owners must be on board during fishing operations.
Initial Allocation. Halibut quota shares were allocated to the 5,484 vessel owners and leaseholders who had verifiable commercial landings of halibut during the eligibility years: 1988, 1989, or 1990. Allocations were based on the best five years' landings during qualifying years (1984-1990). Area-specific shares were allocated based on the geographic distribution of landings during the years used to determine quota share.
Sablefish quota shares were allocated to the 1,094 vessel owners and leaseholders who had verifiable commercial landings of sablefish during same eligibility years (1988-1990) but considered the best five-of-six qualifying years between 1985 and 1990. In determining the allocation rule, the NPFMC weighed the equity merits of a broad initial distribution based on liberal eligibility criteria against a narrower initial distribution that would provide recipients with larger initial allocations. The council's decision to allocate QS to 5,484 halibut fishermen and 1,094 sablefish fishermen represented 141% and 155% increases, respectively, over the maximum numbers of participants in any single qualifying year (3,883 for halibut and 706 for sablefish).
In December 1993, the NMFS Restricted Access Management (RAM) Division mailed Requests for Applications to all persons who, based on fish ticket and landings data, appeared to be eligible to receive QS in the initial issuance. A six-month application period (January 17, 1994, through July 15, 1994) was published in the Federal Register. A second mailing of requests was sent to all persons who had not completed and returned their Requests for Applications by mid-June. In addition, the RAM Division ran print and broadcast public service announcements and held 27 workshops to advertise and answer questions about the application process. Each person who submitted a Request for Application by July 15, 1994, was sent an application that detailed the official record of his or her qualifying catches, vessel size, and other relevant information. Applicants were requested to review the information and submit evidence to support corrections. The evidence was reviewed through an appeals process that could maintain or
amend the official record. The issuance of QS began in November 1994 and was largely completed by January 1995.
A portion of the Bering Sea halibut and sablefish TACs was set aside for a CDQ program (see NRC, 1999a). To compensate commercial fishermen who had established catch history in the Bering Sea, a portion of the QS in the Gulf of Alaska (about 3.5%) was given to Bering Sea fishermen.
Accumulation and Transfer of Quota Shares. Rules on the accumulation and transfer of halibut and sablefish IFQs are constantly evolving. In general, there are limits on accumulation and transferability. No person (individual, company, corporation) may own more than 0.5% of the total halibut QS in combined Areas 2C, 3A, and 3B; more than 0.5% of the total halibut QS in Areas 4A-E; or more than 1% of the total QS for Area 2C. No person may control more than 1 % of the total Bering Sea-Aleutian Islands and Gulf of Alaska sablefish QS or more than 1% of the total sablefish QS east of 140°W (East Yakutat and Southeast Alaska, see Figure G.5). Individuals whose initial allocation exceeded the ownership limits were grandfathered-in, but prohibited from acquiring additional QS.
Transferability is also restricted across vessel size categories. Four vessel categories were defined for halibut: (1) catcher vessels less than 35 feet in length overall; (2) catcher vessels 35 to 60 feet in length overall; (3) catcher vessels more than 60 feet in length overall; and (4) catcher-processor vessels. Three categories were defined for sablefish: (1) catcher vessels less than 60 feet in length overall; (2) catcher vessels 60 feet in length overall or larger; and, (3) catcher-processor vessels. The initial allocation of QS was based on the catch record within each vessel class. Transfer of catcher vessel QS between vessel classes was initially prohibited. However, recent program amendments permit small vessels to fish QS that was initially allocated to large vessels.
Catcher vessel QS is transferable only to "qualified" buyers of quota. Buyers must be initial recipients of catcher vessel QS, or they must be able to demonstrate 150 days of accumulated commercial fishing experience. Catcher-processor vessel QS is transferable to any person. Leasing of QS (sale of IFQ) is restricted for catcher vessels but allowable for catcher-processor vessels. Initial QS recipients were permitted to lease up to 10% of their QS during 1995, 1996, and 1997. An amendment to extend leasing provisions is under consideration. Trawlers cannot buy halibut or sablefish QS for directed fishing or bycatch. All QS transfers must be approved by the NMFS RAM Division.
Setting of Quotas and Other Biological Parameters. The setting of quotas continues to be based on the process that was in place before the adoption of IFQs. The IPHC (for halibut) and the NPFMC (for sablefish) are responsible for determining the ABC and OFL. The NPFMC is responsible for setting the TAC for commercial fisheries such that the sum of the commercial, sport, subsistence, treaty catches, and bycatch mortality is less than or equal to the OFL. The
treatment of catches within state waters has been inconsistent. In some instances, catches in state waters have been subtracted from the ABC, consistent with the concept of a single stock. In other instances, consistent with a separate stock hypothesis, the state water catches have been ignored in the determination of the federal TAC. Once the TAC has been determined, determination of the IFQ is straightforward for halibut. In the case of sablefish, approximately 10% of the TAC is set aside for the trawl fishery, and the IFQ is based on the residual.
Monitoring and Enforcement. Monitoring is accomplished through a combination of real-time accounting and posttransaction auditing. Deliveries can only be made to registered buyers following a minimum six-hour advance notice to NMFS. The real-time accounting is accomplished through IFQ Landings Cards and "transactions terminals." IFQ Landings Cards function like a debit card. When a landing is made, a fisherman swipes the IFQ Landings Card through the transactions terminal and enters catch information, and the halibut and sablefish landings are deducted from his or her IFQ balance. In addition to the IFQ Landings Cards, halibut fishermen are required to submit Commercial Fish Tickets (catch reports) to the IPHC. Posttransaction auditing compares the records submitted by registered buyers with the fisherman's landings records to identify inconsistencies.
Because it can be difficult to exhaust an individual's IFQ exactly, the halibut and sablefish IFQ program has a provision for over- and underharvests. In the case of an overharvest, up to 10% of the fisherman's IFQ remaining at the time of the landing will be subtracted from the following year's IFQ. Underharvests up to 10% of the fisherman's IFQ are carried over to the subsequent year's IFQ.
Advance notification of intent to land provides an opportunity for NMFS and other enforcement personnel to observe landings, if desired. During routine boarding of halibut and sablefish vessels, the Coast Guard compares the poundage of fish on board with the balance on the fisherman's IFQ Landings Card. In addition, some of the larger vessels carry NMFS observers who are responsible for estimating the catch and discard of target and non-target species.
Administration and Compensation. The NMFS Alaska Region RAM Division was created to oversee the initial allocation of QS, approve QS transfers and leases, and monitor compliance with program requirements. There were no special taxes or fees to cover the costs of the IFQ program during 1995-1997. In keeping with new Magnuson-Stevens Act requirements, a cost recovery program is now being developed. The act provides the Secretary of Commerce with authority to levy fees up to 3% of the exvessel value of landings to cover the direct costs of IFQ management.
Evaluation and Adaptation. The first amendments to the halibut and sablefish IFQ program had been submitted to the Secretary of Commerce before the program was
implemented in 1995. Virtually every meeting of the NPFMC since January 1995 has addressed one or more amendments or refinements to the program. Pautzke and Oliver (1997) briefly describe the modifications:
- IFQs less than 20,000 pounds were issued as "blocks" with increased restrictions on transferability and accumulation.
- Changes in QS associated with an effort to equalize the impact of a CDQ setaside were exempted from "block" and vessel category transfer restrictions.
- IFQ in IPHC Area 4 was allowed to shift between subareas.
- Vessels were allowed to fish in multiple management areas on a single trip if they carried an onboard observer.
- Sablefish catcher-processor vessels were allowed to fish catcher vessel QS as long as there was no processed product on board while the catcher vessel QS was being fished.
- Large-boat QS could be bought and fished on small boats.
- The sweep-up provisions of the "block" restrictions were changed.
- Weight adjustments were standardized for slime and ice on landed fish.
- The use of pot-longlines was allowed in the Bering Sea.
- The Aleutian Islands sablefish season was extended to 12 months for vessels that hold enough halibut QS to cover anticipated bycatches.
- Heirs were allowed to lease QS for up to three years.
- Ownership requirements for using skippers to fish the owner's QS were modified.
- Halibut QS ownership limits in the Bering Sea and Aleutian Islands regions were increased.
Outcomes of the IFQ Program
Biologic and Economic Outcomes for the Fishery. Gilroy et al. (1996) provide a preliminary description of the initial conservation effects of the halibut and sablefish IFQ programs. The IPHC estimates that halibut fishing mortality from lost and abandoned gear decreased from 554.1 metric tons in 1994 to 125.9 metric tons in 1995. The discard of halibut bycatch in the sablefish fishery is estimated to have dropped from 860 metric tons in 1994 to 150 metric tons in 1995. However, Gilroy et al. (1996) caution that the uncertainty of bycatch discard mortality estimates has not been determined under conditions of the IFQ fishery, and it is unclear whether the estimated reduction is statistically significant. There is no clear difference in sablefish bycatch before and after IFQs were introduced. The discard of other groundfish in the Bering Sea and Aleutian Islands sablefish fishery was higher in 1995 than in the previous four years, but there was no discernible difference in the Gulf of Alaska. There is no evidence of significant underreporting of catches of halibut or sablefish. The frequency of overharvests was significantly reduced by IFQs (Table G.2).
TABLE G.2 Frequency and Magnitude of Halibut Overharvests
|
Year |
Frequency of Overharvest |
Average Overharvest |
|
1977-1994 |
64% |
6% |
|
1995-1996 |
0% |
-8% |
Gilroy et al. (1996) found no evidence that fishermen have tried to increase the halibut or sablefish TAC. The spatial and temporal distribution of halibut catches has changed; differences in sablefish catches have not been evaluated. The biological and ecological consequences of these changes have not been evaluated. CPUE data from the commercial fishery are used in the halibut stock assessment but not the sablefish assessment. Although it is uncertain how CPUE has changed in the IFQ fishery, results from seasonal and area weighted analyses of CPUE in the Canadian IVQ fishery do not differ significantly from those in the pre-IVQ fishery (Sullivan and Rebert, 1998).
Highgrading of halibut and sablefish is prohibited under the halibut and sablefish IFQ programs. Although there is anecdotal evidence for highgrading, there is no evidence of highgrading in the halibut catch size-composition data in Alaska or Canada, nor have any instances of highgrading been documented or prosecuted. Preliminary comparison of the size distribution of sablefish in the commercial landings and catches in the NMFS sablefish longline survey do not suggest widespread highgrading.
Economic and Social Outcomes for the Fishery. It is not possible to quantify the net economic impact of the Alaskan IFQ programs because the outcomes have not yet been well studied. Although season length has increased to 245 days for both species and landings are broadly distributed through the season, it is uncertain how costs and revenues have been affected. Figure G.7 hints that the IFQ program has had a positive effect on the exvessel price of sablefish. However, Figure G.8 indicates a concomitant decrease in exvessel revenues. Without a comprehensive model of exvessel price formation that accounts for changes in landings, inventories, net exports, and exchange rate fluctuations, it is uncertain whether the observed price increase is due to the change in management regime or merely to continued declines in the sablefish TAC and hence supply. The effect of the IFQ program on halibut exvessel price is even more ambiguous. Although Hermann (1996) estimates that the Canadian IVQ program for halibut increased exvessel revenues by an average of Can$5.8 million per year, there is no comparable analysis of post-IFQ prices in the United States. The average real exvessel price for halibut under the IFQ regime is below the pre-ITQ average
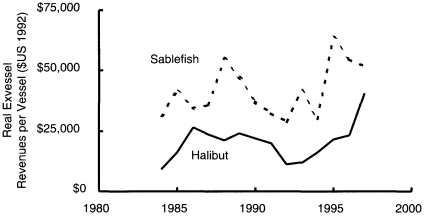
Figure G.14
Average per vessel real exvessel revenues for commercial catches of halibut and sablefish in the U.S. EEZ off Alaska (in 1992 dollars).
(1974-1994) (see Figure G.7). However, in contrast with sablefish, halibut exvessel revenues have increased since the introduction of IFQs (Figure G.8). Extension of the simple model developed in Criddle (1994) suggests that the real exvessel price of halibut increased by $0.56 per pound following IFQ implementation, but the 95% confidence interval on that estimate spans a range of price changes from a $0.05 decrease to a $1.16 increase. Herrmann (1996) estimates that the Canadian IVQ program for halibut increased exvessel revenues by an average of Can$5.8 million per year. The effect of these changes on the average real gross earnings of fishermen is represented in Figure G.14. A statistical analysis of the mean difference between the IFQ and pre-IFQ fisheries suggests that after accounting for changes in total landings, average per vessel real exvessel revenues have increased by $22,990 (the 95% confidence interval is $13,096 to $32,884) for sablefish and $18,658 (the 95% confidence interval is $11,813 to $25,504) for halibut. However, although this result also supports the expectation that IFQs lead to price increases, the observed change in average per vessel exvessel revenues is likely to be due, at least in part, to increases in the average number of quota shares per fisherman.
The economic effects of the IFQ program on revenues and costs for processors, consumers, and communities are even less well understood. The market power held by some processors and communities arose from the need of harvesters to deliver to locations that were near the areas fished, a result in part of the regulated open-access fishery race. There is anecdotal evidence that an increasing number of halibut fishermen are bypassing traditional processors and marketing directly to wholesalers and retailers. However, the magnitude and economic impact of this switch have not been documented. The top five halibut ports
(about 50% of the TAC) have remained, with occasional rank reordering, Kodiak, Homer, Seward, Dutch Harbor, and Sitka (see Tables H.19 and H.21). Because the primary sablefish market is Japan (more than 70% of the 1995 sablefish catch was exported to Japan [Kinoshita et al., 1996]), there is less opportunity for fishermen to market sablefish directly. The list of top sablefish ports has been somewhat more variable, but the top four (about 60% of the TAC) have generally been Seward, Sitka, Kodiak, and Dutch Harbor, both before and after IFQs.
The QS transfer market has been active. More than 3,800 permanent transfers have taken place in the halibut program, and more than 1,100 permanent transfers have occurred in the sablefish program. These transfers have led to some consolidation (Tables G.3 and G.4)
The number of QS holders declined by 24% in halibut and 18% in sablefish between the initial QS issuance in January 1995 and August 29, 1997. However,
TABLE G.3 Percentage Change in Number of Halibut Quota Shareholders Between Initial Issuance and August 29, 1997
|
|
Area |
||||
|
Quota Share (pounds) |
2A |
3A |
3B |
4 |
Total |
|
<3,001 |
-35% |
-28% |
-44% |
-30% |
-33% |
|
3,001-10,000 |
-23% |
-25% |
-36% |
-21% |
-25% |
|
10,001-25,000 |
4% |
-3% |
-2% |
4% |
0% |
|
>25,000 |
50% |
1% |
12% |
4% |
7% |
|
Total |
-26% |
-22% |
-31% |
-20% |
-24% |
|
SOURCE: NMFS (1997a). |
|||||
TABLE G.4 Percentage Change in the Number of Sablefish Quota Shareholders Between the Initial Issuance and August 29, 1997
TABLE G.5 Average Real Exvessel Revenues for Select QS Holdings (in 1992 dollars)
|
Weight (pounds) |
Halibut |
Sablefish |
|
1,000 |
$1,240 |
$1,893 |
|
10,000 |
$12,403 |
$18,925 |
|
25,000 |
$31,007 |
$47,313 |
the number of current (as of August 29, 1997) QS holders (4,947 for halibut and 1,453 for sablefish) still exceeds the annual maximum number of participants in the pre-IFQ fishery (3,883 for halibut and 706 for sablefish). In both fisheries, the bulk of consolidation has taken place in the smaller QS holdings. Although QS holdings of less than 10,000 pounds are probably too small to serve as a primary income source for fishermen (Table G.5), they may provide an important supplement to other income sources.
There is anecdotal evidence that fishermen have reduced crew size and that QS holders are crewing for each other. However, because there are few data on pre-IFQ crewing practices, it is difficult to determine the magnitude of changes, let alone the opportunity cost of crew members who are no longer engaged in the halibut or sablefish fisheries.
Economic and Social Outcomes for Fishery-Dependent Communities. Information on the economic and social outcomes of the halibut and sablefish QS program is largely anecdotal. The regional economic impacts of fishing were not formally modeled before program implementation and have not been formally modeled after implementation. The CFEC (1996a,b) and Knapp (1997a,b) characterize changes in the regional distribution of QS ownership. Continued low prices for salmon have made halibut and sablefish catches increasingly important to regional fishing economies. The regional economic impacts of reductions in crew size are unknown because information on crew participation in the pre-IFQ and IFQ halibut and sablefish fisheries is unknown as is information on crew demographics, residency, and opportunity costs.
Administrative Outcomes and Enforcement. Currently, the increased costs of managing and enforcing the program are not being recovered from QS holders. However, as noted above, a cost recovery program is being developed that will assess fees up to 3% of the exvessel value. With the average nominal exvessel value of recent landings (1995-1997) on the order of $160 million, the fee program can be expected to generate about $5.1 million annually (see Table H.5). This compares favorably with the $3.8 million annual budget of the RAM Division.
Current Perceived Issues. Some dissatisfaction continues over the initial allocation. This dissatisfaction is related to the delay between the qualifying years and the implementation date, and to the exclusion of crew members and processors from the initial allocation. The delays in implementation resulted in the exclusion of some fishermen who were active in the years immediately preceding implementation but were not active during the qualifying years (CFEC, 1997). Similarly, there was dissatisfaction with the award of QS to persons who were active during the qualifying years but inactive in the years immediately preceding implementation. Crew members and processors are discontented that the initial allocation, in addition to rewarding vessel owners, also changed output and factor market power in favor of QS holders.
There are ongoing concerns about the adequacy of enforcement and community impacts. With implementation, have come a heightened awareness of subsistence and sport catches and an effort to define limits on these competing fisheries. This competition has led to concerns about localized depletion and preemption of productive sportfishing grounds by commercial fishermen. Expansion of the fishery for sablefish in Alaska State waters and possible creation of a Gulf of Alaska CDQ program are also of concern.
Florida Spiny Lobster Fishery4
General Description
The fishery for spiny lobster (Panulirus argus) is conducted primarily in the Florida Keys. It is principally a trap fishery, with additional small commercial dive and substantial recreational dive components. Most lobsters are harvested relatively close to shore in shallow water.
Prior Regulatory Conditions in the Fishery
Before the trap certificate system was implemented, the state required fishermen to purchase “crawfish licenses." Catch was limited by a minimum carapace
measurement, but there was (and is) no overall TAC. The fishery was also subject to rules on trap size, markings, and buoys. A closed season was maintained during the lobster spawning period and area restrictions were maintained. Recreational fishermen were subject to bag limits. The state maintained a "trip ticket" system to record each landing of lobster. The fishery was (and is) managed under the federal Spiny Lobster Fishery Management Plan (jointly by the Gulf and South Atlantic Fishery Management Councils) even though the bulk of the fishery is conducted in Florida state waters.
Prior Biological and Ecological Conditions in the Fishery
Local populations of lobsters are seeded from current-borne lobster larvae derived from adult lobsters on reefs west of the Florida Keys. Thus, the local fishery does not fish on total spawning stock. More than 90% of legal-size lobsters are caught each year. Lobster populations are subject to habitat effects in Florida Bay from human activities in the Everglades and South Florida. Despite all of these unknown factors and variable conditions, lobster landings have been relatively constant for more than 20 years.
Prior Economic and Social Conditions in the Fishery
The lobster fishery was traditionally conducted primarily by a relatively small number of independent fishermen, perhaps less than 50. Of the more than 4,000 crawfish licenses issued per year in the 1980s, approximately half of these recorded commercial landings. The remaining approximately 2,000 licenses were held primarily to avoid the recreational bag limit or as a hedge against future limited entry systems. Six to eight hundred of the licensees were responsible for more than 80% of the harvest. The sociological makeup of the fishery is heterogeneous, with a significant Hispanic (primarily Cuban) component. Many fishermen originate outside Florida; the fishery is relatively easy to enter. Florida spiny lobster landings are a small component of the total U.S. lobster market; therefore, local fishermen must accept prices set by markets elsewhere. Spiny lobsters are a high-value, high-demand luxury product.
The Florida Keys region has developed rapidly and has reached a high degree of development and land and water use in some areas. The primary industry in the area revolves around leisure and tourism. Residents and tourists display a high degree of environmental awareness and activism. Monroe County (primarily the Keys) is known as an independent, "maverick" entity, with significant "bandit" (drug traffic) culture.
Problems and Issues That Led to the Consideration of a Tradable Permit System
Before the tradable permit system, the fishery was characterized by relatively constant landings (1975-1990), but the number of traps increased from 200,000 to more than 1,000,000 in the same period. Traps were baited with undersize lobster ("shorts") and the mortality of these juvenile lobsters was unknown. Wooden traps were dipped in oil prior to use to keep them from becoming fouled with marine organisms and infested with ship worms. Crowding had developed in the fishery, creating conflict among commercial users and between commercial and recreational users. Enforcement and administration of fishery regulations was difficult. The fishery was increasingly inefficient and subject to decreasing individual net profits due to the increased number of traps in use but the relatively constant total harvest.
Objectives of the Tradable Permit System
The objectives of the tradable permit system were several:
- To control or reduce effort so that the effort more closely matches the available fishery resource;
- To increase stability in the fishery and promote maximum net incomes for fishermen;
- To promote flexibility for fishermen in their fishing operations;
- To avoid conflict among fishermen and between fishermen and other marine users;
- To ensure that fishermen who have traditionally participated in the fishery be able to continue to due so, as much as possible in their traditional fishing patterns; and
- To make management of the fishery more efficient and effective.
Development Process and Transition to the Tradable Permit System
An outside consultant was solicited to facilitate the development and implementation of an alternative system to address the problems that were being experienced by the lobster fishery. Implementation of the project was encouraged by the State of Florida, the Gulf and South Atlantic Fishery Management Councils, and NMFS; industry expressed cautious interest. To stabilize the fishery before implementation of a new management regime, a moratorium was placed on issuance of new crawfish licenses. Socioeconomic research was performed prior to the consideration of alternatives, and the consultant teamed with industry and other constituents to develop and evaluate alternatives.
Objectives and alternatives for the fishery were developed over a two-year
period through an independent, open workshop process run by the consultant. At the same time, the Florida Marine Fisheries Commission (FMFC) adopted draft rules (not developed through workshop process) to address various issues in the fishery, including the reduction of the number of traps, and these draft rules were the subject of considerable concern by the industry. The industry coalesced around a preferred alternative through the workshop process. Industry, recreational, and environmental groups agreed with the FMFC to approach the Florida legislature for authority to implement the new alternative system. The Florida legislature passed enabling legislation, which was implemented by the FMFC with assistance from industry (the alternative draft rules were dropped). Finally, the Gulf and South Atlantic Fishery Management Councils adopted the Florida program into the federal spiny lobster FMP.
The Tradable Permit System
The Management Units. The management units are individual traps, traded via trap certificates; one certificate enables the use of one trap. Actual trap usage is controlled thorough a tagging system.
The Initial Allocation of Trap Certificates. The initial allocation of trap certificates was based on individual landings history in the fishery. Each fisherman was allowed to select his or her highest individual landings from a three-year qualifying period, and a formula was developed to allocate trap certificates based on each individual's percentage of total landings. A limit was established on the total number of certificates any fisherman could receive under the initial allocation. An Appeals Panel, comprised of representative fishermen, was established to advise the Department of Natural Resources on hearing appeals regarding initial allocations.
Accumulation and Transfer of Trap Certificates. Certificates are marketable to anyone holding a crawfish license. The system includes an "antimonopoly" limit of 1.5% of outstanding certificates that can be held by any individual licensee. Certificates are subject to a transfer fee when sold, and the transfer must be registered. The total number of certificates outstanding may be reduced by the FMFC by up to 10% per year (with individual holdings reduced proportionately) as long as total lobster landings are not affected.
Monitoring and Enforcement. Traps corresponding to certificates must have individual tags. Enforcement is conducted both on land (prior to season opening) and at sea. There is ongoing monitoring of biology, ecology, and administrative effectiveness by the Florida Department of Natural Resources and the FMFC.
Administration and Compensation. The crawfish license fee doubled with the implementation of tradable permits, from $50 to $100. Certificate transfer fees and tag fees were established, with tag fees rising in price (up to $2 per tag) as the
number of traps decreased, to maintain constant revenue. A "windfall profit" surcharge of 25% was applied to the first transfer outside a fisherman's immediate family. Revenues from fees and charges are divided among several beneficiaries. Ninety percent are devoted to dedicated funds for research, monitoring, enforcement, and education related to the spiny lobster fishery. The remaining 10% is allocated to the General Fund of the State of Florida. Provisions for the capture of profits can be implemented at the discretion of the FMFC, the governor, and his cabinet. Record-keeping is administered by the state. The federal FMP requires state certificates and tags for fishing in federal waters. Evaluation and Adaptation. Enabling legislation and administrative rules have been amended, with input from agencies and industry. The permit system is monitored by the state and by academic scientists.
Outcomes of the Tradable Permit System
General. The number of traps decreased from more than 1,000,000 prior to implementation of the program in 1992 to approximately 550,000 in 1996 due to reduced initial allocation of certificates and subsequent annual 10% reductions. Spiny lobster landings have remained stable and trap reductions are on hold for now.
Biological and Ecological Outcomes for the Fishery. Catches have remained stable, with a record high catch in 1995. Little ecological change is traceable to trap reduction, but the system is presumed to have positive economic and biologic benefits.
Economic and Social Outcomes for the Fishery. The total number of crawfish licenses has decreased from more than 4,000 to approximately 2,500, primarily due to exit of recreational fishermen from the license list and trap fishery (although they may not have been active in the first place). The cost of individual trap certificates has risen from the earlier range of $0.50-10.00 per trap to the present range of $50-70 per trap, in response to total trap reduction. The general configuration of fishing operations has remained constant.
Economic and Social Outcomes for Fishery-Dependent Communities. The cost of entry into the lobster fishery has increased due to the need to purchase trap certificates. Many recreational and marginal commercial fishermen have exited the trap fishery, although they are not precluded from participation.
Administrative Outcomes. The system was designed to be revenue positive, but has fallen somewhat short. Enforcement is perceived to be inadequate.
Current Perceived Issues. Some fishermen feel that the system was unnecessary in the first place because the issues involved were primarily social and economic, and some feel a loss of flexibility due to the cost of certificates and the burden of administrative requirements. There is concern about "hidden," localized consolidation of certificate ownership among groups of fishermen.
Summary of Foreign Experience
The Icelandic Individual Transferable Quota Program
Viewed on a world map, especially one with a Mercator projection (which expands the size of high-latitude countries), Iceland does not appear small, but in terms of population it certainly is. The entire population of Iceland was just under 270,000 in 1996, or slightly more than one-half that of Alaska. It goes without saying that Iceland or the Icelandic economy can hardly be noticed in any international statistics, with one exception, fishing. In 1994, Iceland ranked as the fifteenth largest fishing nation, ahead of Spain and Mexico and just behind North Korea and Denmark. In per capita terms, Iceland is roughly comparable to its neighbors in terms of gross domestic product (GDP) and many other indicators of living standards. In 1994, the per capita GDP, measured as purchasing power parity, was 90% of the GDP of the United States, 83% of Denmark's, and 30% higher than in the United Kingdom.
The Icelandic economy is heavily dependent on its fisheries. About 73% of the value of goods exported in 1996 consisted of fish and fish products. Approximately 20 years ago, fishing accounted for as much as 90% of exports. The decline is largely due to the development (since the late 1960s) of energy-intensive metal production (aluminum and ferrosilicon), which accounted for 12% of exports in 1996. In terms of total receipts of foreign currency, the fishing industry is less important but still accounts for more than half (52% in 1995). Tourism is an increasingly important source of foreign currency (12% in 1995, as estimated by the Central Bank of Iceland), but neither tourism nor services are a net source of foreign currency income; in recent years the services account has been roughly in balance.
Like other developed economies, the Icelandic economy is characterized by a large service sector and a high degree of urbanization. In 1995, about two-thirds of all employment was in private and public services, while only 11% of the population was employed in fishing and fish processing, with these latter industries contributing about 15% of the GDP. The productivity of the fishing industry therefore appears reasonably high and is probably higher than that of other industries in Iceland. About 90% of Iceland's population lives in villages and towns with more than 200 inhabitants, and 60% lives in the capital city of Reykjavík and its suburbs. The towns and villages are located primarily on the coast and scattered almost all around the island, with fishing being a dominant
Figure G.15
Relative change in gross domestic product of Iceland (logarithmic scale).
industry in most of these. All towns and villages have road connections, although not necessarily good ones that are dependable in harsh winter weather. Iceland does not have any indigenous population of an ethnic origin different from the rest of the population. Immigration has been very limited.
The waters around Iceland used to be fished by both Icelanders and foreigners, with foreigners taking about one half of the catches of groundfish, of which cod is most important. Both world wars provided a temporary reduction in fishing pressure, as foreign fleets disappeared from the fishing grounds because of dangers to fishing vessels from military actions and the shift in manpower from fishing to fighting; when the wars were over fishing activities rebounded. The total catch of cod peaked in the mid-1950s, and cod became fully exploited and possibly overexploited as early as the late 1950s.
Icelanders are keenly aware of their dependence on the sea. The key to economic growth and rising standards of living was perceived to lie in ever-increasing fish catches. Accomplishing this was believed to require the elimination of foreign fishing around Iceland. The first attempt to reserve the fish stocks around Iceland for Icelanders was the passing of a law in 1948 claiming ownership of the living resources in the waters above Iceland's continental shelf. This law was inspired by the Truman Declaration of 1946 that claimed all resources on and beneath the seabed on the U.S. continental shelf as the federal property of the United States. On the basis of the 1948 law, Iceland extended its fishing limits several times in the 1950s and 1970s, sometimes before recognition of such
extensions as international law and in open conflict with some of its neighbors, most notably Great Britain, which traditionally had been heavily involved in fishing around Iceland.
Economic growth in Iceland was somewhat variable but still rather impressive from World War II until the mid-1980s, about 4% per year (see Figure G.15). In 1987, the economy entered its longest period of stagnation since the Second World War; the per capita GDP was not much higher in 1996 than it had been in 1987, nine years earlier. In the last two or three years, growth has resumed again and was 6% in 1996.
The economic growth over most of the 40-year period from 1945 to 1985 was to a large extent driven by increases in fish catches and productivity in the fishing industry. Catches of cod, the most valuable groundfish, increased from about 200,000 metric tons per year in 1945-1948 to about 300,000 metric tons in 1954-1956. Around 1960, there was a herring bonanza, with catches rising from less than 100,000 metric tons per year before 1960 to 400,000-600,000 metric tons in 1962-1966. This development was brought about by the so-called power block, a device that made it possible to pull nets mechanically instead of by hand, which led to a vast increase in the size of nets (purse seines) and vessels.
Prior Economic and Social Conditions in the Fishery
Establishment of the 200-mile EEZ internationally legitimized the 1948 claim of ownership of the living resources above Iceland's continental shelf since virtually all of the continental shelf around Iceland is contained within the zone. As a result, Iceland gained virtually full control of the demersal stocks around the island, which are largely confined to the waters of the continental shelf. Icelanders rapidly replaced foreigners in the catching of cod and other demersal fish; foreign fishing around Iceland virtually came to a halt in 1976, and the Icelandic catches of cod increased from around 250,000 metric tons annually in 1971-1975 to an all-time high of 461,000 metric tons in 1981. In terms of resource conservation, however, little happened. Iceland embarked on an ambitious vessel construction program in the early 1970s and expanded rapidly into the void created by the displacement of foreign fleets. Only a few years after the establishment of the EEZ, reports began to document overcapacity of the fleet and overexploitation of Icelandic fish stocks, particularly cod. Gradually, it was recognized that it would be necessary to reduce fishing effort and the capacity of the fishing fleet in order to build up the stocks and increase the catches and profitability of the industry.
In principle, there were means available to control both fleet capacity and fishing effort in Icelandic fisheries. Investment in large fishing vessels was usually financed by loans from public investment funds. From 1977 onward, attempts were made to limit overinvestment in the fishing fleet by making it more difficult to obtain such loans, and after 1980, fishing vessels could no longer be
imported without special licenses. In a number of cases, however, political pressure was applied to allow allegedly disadvantaged towns or villages to acquire fishing vessels even though the fleet was considered oversized. Measures to prevent overcapacity were not particularly effective; in the period 1977-1983 the value of the fishing fleet increased by about 17% (2.6% annually).
The first serious limitations of Icelandic fishing effort were temporary bans on fishing on particular grounds. Later, trawlers were limited in the number of fishing days per year, a number that declined over time. After the EEZ was established, the catch of cod was supposed to stay below the TAC, but the TAC was consistently exceeded despite the limitation on the number of fishing days.
By 1982, politicians and interest groups increasingly believed that more radical measures would be needed to limit effort. A vessel quota system was suggested in 1983 to deal with the ecological and economic problems of the fisheries; this system would divide the TAC among industry participants. The precise allocation of catches was debated, until it was agreed late in 1983 that each vessel was to be allocated an annual quota on the basis of its average catch over the past three years.
ITQ Program Development Process and the Transition to the ITQs
Herring and Capelin. The existing Icelandic ITQ program was preceded by developments in the pelagic fisheries. ITQs were first applied in the fishery for a local Icelandic herring stock. In the late 1960s, the Atlanto-Scandian herring stock collapsed, probably because of lower sea temperatures and excessive fishing pressure by Icelandic and Norwegian vessels allowed by the invention of the power block. Two smaller, local Icelandic herring stocks also collapsed, and one is believed to have disappeared altogether. The second herring stock was put under a moratorium in 1972, and after a partial recovery the fishery was opened again on a small scale in 1975. Vessels with a catch history were allowed to participate, but there were many more vessels than could be easily accommodated. There were regulatory attempts at limiting the number of vessels, such as requiring all herring to be salted on board, which disadvantaged the smaller and less seaworthy vessels, but ways were found around this; the regulations did not prevent the salting process from taking place when the vessels were in harbor. In 1976, vessel quotas were introduced, but each vessel received a very small allocation, due to the low TAC and the large number of vessels with a catch history. At first, the quotas were not transferable, but due to the small size of the quotas and the difficulty of fishing them profitably, transfers were allowed from 1979 on.
In 1980, vessel quotas were introduced in the capelin fishery, and in 1986 they were made transferable. This case is of some interest because it is sometimes alleged that ITQs cannot be applied to highly volatile fisheries. Yet, capelin is a short-lived species, and only one or two year classes are fished. Since
the size of the year classes is highly volatile, the TAC is also very variable; there have been years when no fishing for capelin has been allowed. As in other Icelandic fisheries, capelin ITQs are determined as shares of the TAC. The Icelandic experience is not unique; in Norway, boat quotas are applied in the capelin fishery and other pelagic fisheries, but these quotas are not transferable. The Norwegian capelin fishery is even more volatile than the Icelandic one.
Groundfish. By 1982, Icelandic politicians and interest groups increasingly believed that radical measures would be needed to prevent collapse of the cod stock. Also, it was argued, a new approach was needed to reduce overcapitalization in terms of fishing vessels. An ITQ program was introduced by the Icelandic Parliament in 1983 to deal with the problems of the cod fisheries. When the ITQ program was first implemented, each fishing vessel over 10 tons was allotted a fixed proportion of future TACs for cod and five other demersal fish species. Catch quotas for each species, measured in metric tons, were allotted annually on the basis of this permanent ITQ share. Moreover, a new licensing scheme stipulated that new vessels could be introduced to the fisheries only if one or more existing vessels of equivalent size (in GRT) were eliminated in return. The ITQ program has been revised several times, but remains in force.
The ITQ program divided access to the resource among vessel owners on the basis of their fishing record during the three years preceding implementation of the program. Initially, ITQ shares could only be bought or sold undivided along with the fishing vessel to which they were originally allotted, although they could be leased relatively freely; that is, ITQ shares were not fully divisible or independently tradable. The ITQ program was initially put in place for only one year and was seen by many as a temporary emergency measure, to be abolished when the stocks recovered. It was, however, successively prolonged for two or three years at a time, and in 1990 a program of quotas of indefinite duration was emplaced. Quotas did not, therefore, constitute true private property rights. Nevertheless, the program introduced in 1984 was an individual transferable quota program, albeit one with restrictions on transferability. In 1990, several radical alterations were made to the existing ITQ program.
With the Fisheries Law passed by Parliament in 1990, the program was reinforced and extended into the distant future. First, the program was extended by allocating ITQ shares to approximately 900 smaller vessels (6-10 GRT) that had been fishing without restrictions. As a result, the number of ITQ holders increased by 156% (from 451 in 1990 to 1,155 in 1991). Second, the ITQ program was extended to include all major fisheries. Finally, and arguably most significantly, the ITQ program was made indefinite in duration, and ITQs became fully divisible and independently transferable, making them more akin to permanent property rights.
The program prior to 1990 had two major loopholes, the effort quota option and a general exemption for vessels smaller than 10 GRT. The effort quota
option was included in the program partly to accommodate fishermen who felt they had been shortchanged by the initial quota allocation and partly to comply with demands for making allowance for differences in fishing expertise. Under the effort quota option, a vessel was allocated a certain number of fishing days, subject to an upper limit on how much cod could be caught. By taking this option, the catch record of a vessel could be improved, and its allocation under the quota option could be increased the next time quotas were allocated. Because the effort quota vessels usually succeeded in improving their records, the quota allocations for the vessels that consistently stuck to the quota option eroded over time. The effort quota was particularly popular in 1986 and 1987; in these years, less than 40% of the total catch was taken by vessels with catch quota allocations.
Because they were exempt from the quota program, the number of vessels of less than 10 GRT increased from 1,128 in 1984 to 2,023 in 1990, and their share of the total catch of cod increased from 3.3% in 1982 to 13.1% in 1991-1992. These vessels are typically owner operated with only one person on board. Over the years there have been periodic attempts to limit the fishing of these vessels. In 1986, the number of fishing days was limited. In 1988, vessels of 6-10 GRT were incorporated into the quota program, the number of such vessels was frozen, and a new vessel could be acquired only if another vessel was scrapped. Vessels of less than 6 GRT are an ongoing contentious issue, and attempts are still being made to incorporate their activities into the quota program.
The ITQ Program
According to the new fishing law in 1990, most fish stocks around Iceland were incorporated into the quota management program. For groundfish, the main exemption is that vessels less than 6 GRT are subject to limitations in the number of fishing days and an overall limit on how much they can catch, and only one-half of the catch taken by vessels fishing with longlines in the winter months is counted against the quota. Quota shares can be leased or permanently sold. Quota allocations are of an indefinite duration and could be revoked by the Icelandic Parliament at any time, but the prices of permanent quota shares suggest that this is not considered a very high risk; in the summer of 1997, permanent quota shares for cod were trading at about eight times the cost of renting quota shares for a year. Leasing of quota shares cannot be repeated indefinitely; in order to retain their quota share allocations, quota shareholders must fish at least half of their quotas every second year.
There are some restrictions regarding transferability and ownership of quota shares. In order to be eligible for holding quota shares, a person or company must have access to a vessel to which the quota shares are allocated. In most cases the person or the company owns the vessel, but cases have been reported in which a quota shareholder allocates quota shares to someone else's vessel. These cases
are exceptional, however, and considered legally tenuous. Such leasing also goes against the spirit of this regulation, which is meant to prevent absentee ownership. If a quota is to be leased or sold to a vessel operating from a different place, the consent of the municipal government and the local fishermen's union must be obtained. This restriction does not seem to have had much effect; consent to quota leasing and selling appears usually to be given virtually automatically. Trading of quotas appears to be brisk; in the “fishing year" 1993-1994 the trading of cod and saithe quotas amounted to 44% and 96%, respectively, of the total catch. Note, however, that the same quota can be traded more than once.
For groundfish, there is a certain flexibility built into the program. Twenty percent of a year's quota can be shifted to the subsequent year without a penalty, but the overage is subtracted from the quota allocation in the following year. This is less injurious to conservation of stocks than it might appear; the exploitable stock of groundfish consists of ten year classes or more, which smoothes the pattern of catches over time despite large variations in the size of year classes.
Objectives of the ITQ Program
During the policymaking process when ITQs were set for the cod fisheries, ITQs were credited with several positive characteristics. It was argued that under an ITQ program,
- the size of fish stocks would be stabilized, both because it would be easier to ensure that the total catch stayed below the TAC and because harvesters would show greater responsibility in their treatment of the resource;
- fishing would become more efficient and overcapacity would be reduced;
- the quality of landed fisheries products would improve and, therefore, their economic value would increase;
- the management program would become simpler, less "political," and therefore, more efficient; and
- fishing would be safer, resulting in fewer accidents and injuries at sea.
Outcomes of the ITQ Program
Biological and Ecological Outcomes for the Fishery. Since the collapse of Icelandic herring stocks in the late 1960s, management of the herring stock has been very successful. The instantaneous fishing mortality rate for fish age 4-14 years has been kept moderate (it has varied between 0.15 and 0.35 per year and has been about 0.2 per year in recent years, which is probably near optimal for a relatively slow-growing stock consisting of more than ten year classes), and the stock has been built up gradually. Catches have also increased gradually, from less than 20,000 metric tons in 1975 to about 140,000 metric tons in the 19941995 season, but they fell in the 1996-1997 season to about 100,000 metric tons.
Whether or not ITQs have contributed to this recovery is difficult to determine. The primary tool for conservation is the TAC. To the extent the ITQs have kept the total catch below the TAC, they have helped promote conservation.
Management of the Icelandic cod stock, which is also under full Icelandic control, has been much less successful than management of herring, despite the fact that it is also part of the IFQ program and much more important for the Icelandic economy. The cod stock reached an all-time low in 1992 but has recovered somewhat since then. The primary reason for the population decline is probably an excessive TAC; the TAC set by the Icelandic government has consistently exceeded the recommendations of the Icelandic Marine Research Institute. Moreover, catches have surpassed the excessive TAC; in 1984-1996 the excess of catches over TAC was about 12% annually, and the excess of the TAC over the amount recommended has been of a similar magnitude. ITQs cannot be blamed for the depletion of the cod stock; on the contrary, the excess of catches over the TAC is due to exemptions from the quota program, for example, fishing by vessels less than 6 GRT and the hook-and-line fishery in winter. If anything, ITQs should have mitigated the situation by capping the catch of the vessels fully under quota. The effort controls that preceded ITQs were ineffective in keeping the catch below the TAC.
The government has consistently exceeded the recommendations of the Marine Research Institute because of the importance of the cod stock for Iceland's economy and an unwillingness to accept large short-term losses to achieve longer-term gains. Obviously, such trade-offs cannot be made without reference to economic and social conditions, so the recommendations made by the Marine Research Institute, which do not take such factors into account, are not sacrosanct. Nevertheless, it would seem that the Icelandic government has been unduly careless in its trade-offs between the present and the future; in 1992, the cod stock reached an all-time low, although the situation appears to be improving. In 1995, the TAC was set for the first time on the basis of a "TAC Rule," proposed in a bioeconomic study of the fishery. According to this rule, the TAC should be either 25% of the fishable stock or 155,000 metric tons, whichever is greatest. Except for the minimum of 155,000 metric tons, this appears to be a prudently conservative rule for a long-lived and slow-growing species such as cod. The historical minimum and maximum of the annual catch from the Icelandic cod stock are 169,000 (1995) and 546,000 (1954) metric tons per year, respectively.
One of the arguments for the development of ITQs emphasized that the privatization inherent in quota programs would encourage stewardship, as the new "owner" of the resource (or fishing rights) realized that he or she would benefit directly from caring for the resource. Discarding small and immature fish during fishing operations and highgrading the catch seem, however, to continue to be a serious problems in the Icelandic fishery and these problems may have escalated with ITQs. Since quotas are fixed and excessive catch is a violation of
the law and subject to prosecution, a quota shareholder tends to land only the portion of the catch that generates the highest income.
It is not uncommon for vessels that have finished their cod ITQs to accidentally catch a few tons of cod while fishing haddock or another demersal species. If they land the cod, they must acquire an equivalent amount of cod ITQs to cover their catch to prevent loss of their fishing licenses. The price of ITQs leased for this purpose tends to fluctuate considerably in relation to supply and demand. According to many fishermen, this results in considerable amounts of dead fish being thrown back into the sea, especially toward the end of the fishing year when ITQs are scarce and the lease price is inordinately high. ITQs may, therefore, contribute to the waste of living resources, resulting in the erosion of ecological responsibility. It is difficult to estimate the scale of such practices, but it may be noted that the Icelandic Parliament expressed grave concerns and passed strict laws on the "treatment" of fishing catches in June 1996.
Economic and Social Outcomes for the Fishery. ITQs in the herring fishery have led to a substantial increase in economic efficiency. The number of vessels participating in the herring fishery has fallen drastically. In 1996, there were 29 vessels participating in the herring fishery, a decrease from the peak participation year of 1980, when there were more than 200 vessels. At the same time, the total catch has increased, from 53,000 metric tons in 1980 to almost 140,000 metric tons in the 1994-1995 season. It is noteworthy that the number of vessels having quota allocation is considerably higher than the number that actually participated; in 1996, 44 vessels with quota allocations did not participate in the fishery, and 6 participating vessels that had no quota allocation rented their quota from others. Fishing on this stock is seasonal, with a duration of a few months (October to February); all vessels fishing for herring are engaged in other fisheries for the remainder of the year.
The ITQ program appears to have improved the profitability of Icelandic fishing firms considerably. The price that fishing firms are prepared to pay for renting cod quota is a possible measure of this profitability. This price has risen from the equivalent of $US0.05-0.09 per kilogram in 1984 to $US0.90-1.00 per kilogram in 1994, and quotations from the summer of 1997 showed prices up to $US 1.25 dollars per kilogram, which is more than one-half of the normal exvessel price. The increase in quota price is much greater than the rate of inflation, so the real price has undoubtedly risen substantially. It must be noted, however, that these figures reflect not only the increased profitability of fishing operations, but also the increasing scarcity of cod. It must also be kept in mind that the prices that fishing firms are prepared to pay for small amounts of quota do not necessarily reflect their long-term profitability; a vessel owner may be willing to pay an amount equal to the difference between the exvessel price of fish and the marginal operating cost, but the profit margin after taking into account capital costs may be much lower.
TABLE G.6 Profits as a Percentage of Gross Revenue
|
Year |
Profit |
Year |
Profit |
|
1980 |
-5.8 |
1988 |
-5.0 |
|
1981 |
-5.7 |
1989 |
-2.1 |
|
1982 |
-8.6 |
1990 |
1.4 |
|
1983 |
-9.1 |
1991 |
-0.3 |
|
1984 |
-9.2 |
1992 |
3.2 |
|
1985 |
-4.9 |
1993 |
4.0 |
|
1986 |
1.3 |
1994 |
5.1 |
|
1987 |
0 |
1995 |
4.0 |
Figures compiled by the Icelandic National Economic Institute show a rising profitability of the fishing industry in recent years (Table G.6). These figures have been compiled from annual accounts of harvesting and processing firms in the fishing industry (note that the largest firms are vertically integrated, so it probably makes most sense to consider the entire sector rather than just the harvesting sector, even if the quotas are allocated to vessels, thus primarily affecting the harvesting sector). The method of calculation corrects for price changes to correct for earlier years with rampant inflation that could distort profitability figures.
Analyses of productivity in the fishing industry carried out by Asgeir Danielsson (1997) at the National Economic Institute indicate a very substantial growth in productivity from the mid- 1980s until the present. The total productivity of capital and labor in the fishing industry showed extreme sensitivity to changes in the size of the fish stocks in the period 1973-1985. This effect is expected; it is usually cheaper to catch a ton of fish from a plentiful stock than a depleted one. Since 1985, productivity has increased without a similar increase in the stocks. Although this is no proof that ITQs have increased productivity, it is certainly consistent with such an effect. Total productivity of capital and labor in the fishing industry increased by 67% over 1973-1990, despite the fact that the fish stocks were less plentiful in 1990 than in 1973. In the economy as a whole, the total productivity of capital and labor increased by only 20% over the same period.
As previously mentioned, the catch capacity of the Icelandic groundfish fleet had grown well beyond what was needed to catch available stocks by the 1970s. One of the main arguments for ITQs is that they should prevent overcapacity in the fleet or reduce it whenever it has developed. The number of decked vessels began to decline in 1990 when it had reached a peak of about 1,000 and had fallen to 800 by 1996. The size of the fleet in terms of GRT remained relatively steady, however, from 1990, the year ITQs were made indefinite in duration, but in-
creased from 120,000 GRT in 1994 to 130,000 GRT in 1996. Thus, there has been a development toward fewer and larger vessels.
Whether or not ITQs have reduced the excessive capacity of the fleet in ITQ fisheries is still an open question. The size of the entire Icelandic fishing fleet in terms of GRT has increased slightly since 1990, the year when quotas became long term and could be expected to have an impact on fleet size. Some of the increase in capacity may be justified because of increased distant water fishing (the Barents Sea, Flemish Cap), which requires large vessels that can make long trips. Furthermore, reduction in capacity is a process that will (and should) take some time. The way this process works is that vessel owners will not invest in redundant vessels or those that are too large when the time comes to get rid of the old vessel. With poor second-hand markets in used vessels, fleet reduction may take a long time, because it is profitable to continue using an old vessel as long as it recoups its operating costs, even if it will never be replaced by a new vessel.
It may also be noted that the trend toward increased fishing in distant waters has been encouraged by ITQs, because the owners of the largest vessels have leased their groundfish quotas in Icelandic waters to other fishermen and dispatched the vessels to distant waters rather than chasing the limited amount of fish available in the Icelandic EEZ and making little or no contribution to the overall value of the fishery. Such an extension of Icelandic fishing outside Icelandic waters, however, creates classic common-pool problems internationally. Vessel owners are racing for fish on disputed fishing grounds, inviting conflicts with foreign governments.
The Icelandic government initiated a buyback program in 1994, aimed at removing vessels from the fisheries. The existence of this program indicates that the expectations of the ITQ program and the market approach to management for eliminating or reducing overcapacity have not been fulfilled.
Effects on Equity. One way to examine the changing social distribution of quotas is to arrange quota holders into discrete groups, based on the size of their quota share, and examine the number of quota holders in relation to the size of their quota shares. Gísli Pálsson and Agnar Helgason at the University of Iceland have provided such an analysis for the demersal fishery (Pálsson and Helgason, 1995). To simplify, they distinguish between "giant" quota holders (the group with the largest quota shares holding more than 1% of the total quota each), "large" quota holders (holding 0.3-1%), "small" quota holders (with 0.1-0.3%), and "dwarves" (with less than 0.1%). Figure G.16 shows distributional changes of quota shares among vessel owners for an 11-year period (excluding, for the sake of comparison, 6-10 GRT vessels that were incorporated into the system in 1991). There is a steady decrease in the total number of quota holders. A gradual increase in the number of giants is concurrent with a decrease in the numbers of the other three groups.
A more telling way of elucidating distributional changes is to compare the aggregate permanent shares of the groups defined above. Figure G.17 indicates
Figure G.16
Number of quota holders in Iceland (1984-1994).
changes in the relative distribution of quotas for the same 11-year period. Evidently, while the giants have grown in number through the years, they have been accumulating quotas to a disproportionate degree. At the same time, the shares of other groups have diminished in relation to their reduced numbers.
These data indicate a sizable increase in the level of inequality in the distribution of quotas from 1984. Many vessel owners have dropped out of the program, and a large majority of these were the smallest operators. At the same time, quotas are becoming concentrated in the hands of fewer vessel owners and companies. Only the giants average quota share shows a substantial increase, going from 1.64% to 1.91%.
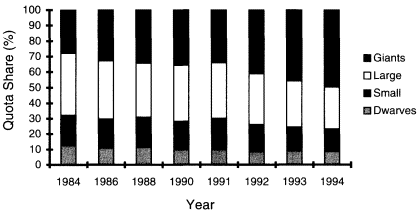
Figure G.17
Quota distribution in Iceland (1984-1994).
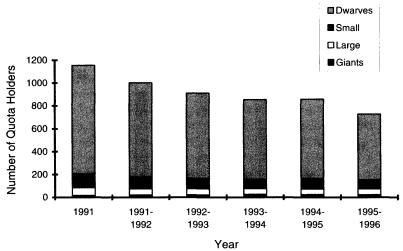
Figure G.18
Number of quota holders in Iceland (1991-1996).
The 1990 fishery law resulted in the inclusion of 704 new small-scale ITQ holders not included in the figures presented. Figures G.18 and G.19 show changes in the number of quota holders and the distribution of holdings since quotas became fully transferable. This time, the 6-10 GRT vessels that were incorporated into the system in 1991 are included.
During this period, the number of quota holders was reduced from 1,155 to 729. Only the group of giants has grown in terms of number. At the same time,
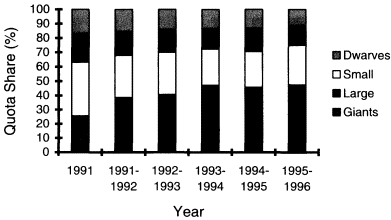
Figure G.19
Distribution of quotas in Iceland (1991-1996).
the quota share of the giants increased from 25.6% to 47.5%. The share of the dwarves, in contrast, decreased from 16.8% to 11.05%. Together giant and large quota holders own 75% of the total quota in the demersal fisheries. Currently, 24 giants own almost half of the total quota. The share of the largest quota holder is about 6%.
If the TAC is reduced, ITQ shares effectively become devalued; that is, all operators in the industry suffer reductions in the amount of fish they are permitted to catch, even though their actual ITQ share remains constant. This aspect of the ITQ program is highly relevant for the distributional developments. After bleak estimates of the fish stocks in Icelandic waters by marine biologists, the Ministry of Fisheries has repeatedly reduced the TACs (particularly for cod). As a result, many small companies have found themselves increasingly left with insufficient catch quotas to keep their vessels active throughout the fishing year. To give some indication of the extent of these devaluations, a vessel owner who controlled an ITQ share in cod of 0.1% (the upper limit of a dwarf) was entitled to approximately 254 metric tons of cod in 1987, 200 metric tons in 1991, but only 106 metric tons in 1994.
Some, if not all, of the giant companies are owned by a large number of shareholders. One could argue, therefore, that the concentration of quotas masks a more egalitarian distribution of access and ownership. However, it is possible that some individuals own shares in several different companies; thus, the distribution of ownership of quotas may be even more unequal than the raw figures on distribution indicate. Also, the distribution of holdings within the largest companies may be very uneven, with few individuals controlling the majority of the shares. Finally, even though shareholders turned out to be more numerous than before, in actual practice a small group of managers has immense power.
Two things must be noted, however, at this juncture. First, some concentration of quota holdings is inevitable and desirable. The purpose of the ITQ program is to restrict access and reduce overfishing and overcapacity. This is bound to mean that not everyone who desires will be able to participate in the fishery, and the reduction of overcapacity means that some participants will have to leave the industry. Second, concentration of quotas in large firms is probably an inevitable consequence of increasing the efficiency of the industry. There are most likely economies of both scale and scope in fishing and fish processing, and the fact that the quotas have been bought and sold freely in an open market indicates that they have gravitated to the most cost-effective firms. Even the largest Icelandic fishing firms are still small when compared with foreign companies. Although it is true that the large Icelandic fishing firms can be quite powerful in their local labor markets, the Icelandic economy cannot afford to miss the advantage of such economies of scale. More than 95% of all fish caught by Icelanders is exported, and more than one-half of all the foreign currency earnings of Iceland result from selling fish and fish products to markets dominated by large wholesalers and retail chains that have a wide range of alternative
suppliers. Only the largest firms in Iceland have attempted to export on their own, and the remainder are partners in a few large (on an Icelandic scale) exporting firms that sell Icelandic products abroad.
Effects on Remuneration and Relative Power. Vessel owners have been permitted to lease their ITQs from the onset of the program. ITQ leasing was originally proposed by administrators as a way for vessel owners to fine-tune their operation to meet short-term needs arising from unexpected "devaluations" of ITQ shares; fluctuations in local, regional, and national markets; and bycatch problems (for example, by trading haddock ITQs for cod ITQs). At first, ITQ leasing did not seem to be a particularly common practice, and it was probably undertaken mainly on a small scale by operators who needed extra ITQs after a particularly successful fishing season. The lessors in most of these cases were operators actively engaged in using their own ITQs. Over time, however, some ITQ shareholders came to realize that considerable profits could be earned through leasing ITQs on a larger scale, particularly with many fishing operations suffering from the devaluation of ITQ shares resulting from repeated reductions in the TAC for cod after 1988.
Recently, new and more formalized modes of ITQ leasing have begun to emerge. These transactions involve long-term contracts between large ITQ holders and smaller operators, in which the former provide the latter with ITQs in return for the catch and a proportion of the proceeds. One such arrangement, usually referred to as "fishing for others," is becoming increasingly widespread within the industry. Invariably, in such arrangements, the supplier of the ITQs is a large vertically integrated company that controls two or more trawlers and a processing plant. The smaller operator's vessel fishes the ITQs and delivers the catch to the supplier's processing plant in return for a payment that usually amounts to about 50-60% of the market value of the catch. There are limits, however, to how far this activity can develop. Fish processing firms must own vessels in order to own ITQs, and they are required to have fished at least one-half of their own quotas on their own vessels over the previous two years.
Strictly speaking, then, there is no lease price paid up front for the ITQs. However, the small-scale operator is effectively paying a lease price of up to one-half the value of the catch. Understandably, the lessee vessel owners cannot make the same level of profits when fishing for others as they can when fishing their own ITQs. Their outlay is identical in both cases, but when fishing for others their income is cut by 40-50%. As a result, they try to compensate for their losses by reducing the shares paid to the crew members. Fishermen receive a share of the value of the catch adjusted to the price of oil on the international market. Before the fishermen's shares are calculated, however, the vessel owner is permitted to deduct maintenance costs from the proceeds of the catch. Increasingly, the lessee vessel owners have resorted to reckoning the fishermen's shares from the amount left after the lease price has been subtracted from the value of the catch. The result is that fishermen working for lessee companies may suffer
up to 50% wage reductions. This is not, however, permitted according to the wage contracts between vessel owners and the fishermen's union.
The typical lessee operator is either an owner of a relatively small vessel that has finished its own annual supply of ITQs or the owner of a vessel that has virtually no ITQs of its own and is operated solely on leased ITQs. Through ITQ leasing, vessel owners with small ITQ holdings manage to prolong their fishing operations throughout the year. Moreover, by lowering the shares of their crews, they are just about able to make such practices economically feasible. For the suppliers of ITQs, however, leasing represents a rather lucrative business. By leasing its ITQ shares, a company can free itself from the expenses of actually catching the fish, while still procuring up to half the market value of the resulting catch. Moreover, it keeps the company's processing facilities well supplied. During recent years, dwarves and small ITQ shareholders have been the typical lessees. This reflects, on the one hand, the distributional changes described earlier and, on the other, the emergence of the relations of tenancy associated with fishing for others. In a number of cases the lessors are integrated fishing firms that have leased part of the quotas of their trawlers and dispatched the latter to distant waters such as the Barents Sea.
Evidently, then, the Icelandic fishing industry is undergoing an extensive restructuring process, in which large vertically integrated companies have strengthened their position while smaller operators are being marginalized or forced out of business. Some of the small operators seem to be persevering by entering into contracts to fish for larger ITQ holders.
Effects on Property Rights. ITQs remain, according to the first clause of the 1990 fisheries management legislation, the "public property of the nation." During debates on the 1990 fisheries laws, some members of the Icelandic Parliament raised doubts about the "legality" of the ITQ program, arguing that proposed privileges of access might imply permanent, private ownership that contradicted some of the basic tenets of Icelandic law regarding public access to resources. Lawyers concluded that the kind of ITQ program under discussion in Parliament was in full agreement with the law and that ITQs represented temporary privileges, not permanent private property. The laws that eventually were passed reinforced such a conclusion by stating categorically that the aim of the authorities was not to establish private ownership.
The issue of ownership, however, is still contested. The Icelandic tax authorities have decided, one may note, that ITQs are to be reported as "property" on tax forms and that the selling of ITQs involves a form of "income." Some evidence indicates that in legal practice, quota shares are gradually acquiring the characteristics of full-blown private property, despite legal clauses to the contrary. Owners of quotas may write them off for tax purposes over five years. In practice, quota shares are passed on as inheritance from one generation to another. Normally, however, the quota shareholder remains the same (a fishing firm), although a new generation is taking over. A case was contested in courts in
which a woman divorcing her husband, the owner of a firm with a sizable quota holding, demanded her share of the estate. The Icelandic Supreme Court ruled on December 3, 1998 in favor of the woman, which may be seen as one further step to the formal recognition of quota shares as private property. Thus, the use rights of fish resources are becoming increasingly entrenched as private property while the resources themselves (i.e., the fish stocks) are proclaimed as being publicly owned. The implications of such a contradictory situation are unclear. Could the Icelandic Parliament, for example, change the ITQ program fundamentally, without compensating quota shareholders for rights they would perceive as having lost? The Icelandic constitution protects the holders of property rights if they can prove their ownership. The issue of protection of resource property rights is being debated by the Icelandic Parliament.
There has been a long discussion over whether quotas can be used as collateral for obtaining loans. Without this possibility, it is considerably more difficult to obtain a loan to buy a fishing vessel, because a vessel without ITQ is worth much less than a vessel with ITQ. The law is unclear on this point, stating on the one hand that quotas cannot be used as collateral but on the other that vessel owners cannot sell their quotas without the consent of whoever has a lien on the vessel. Again, if economic and legal practice recognizes quotas as collateral, it will be a further step in the recognition of quotas as private property, undermining the significance and effect of the statement in the current law on public ownership.
Recently, Orlygsson (1997) analyzed the legal status of fishing quotas. Among his conclusions are the following:
- Quota shares are not to be regarded as the private property of quota holders.
- Quota shares may, however, achieve the characteristics of private property as time passes. Quota shareholders may gain increased legal protection of their shares under clauses concerning the “right to work."
- Quotas are not in any meaningful sense the property of the "nation." The legal clause on fish stocks being the property of the nation expresses the intent of the lawmakers that the resource be managed for the benefit of the public (the equivalent of the U.S. doctrine of the public trust), but the nation does not constitute an owner. On the other hand, with changes to the Icelandic constitution the government may become an owner of the resource.
- The existing program of quota management is in accordance with Icelandic law.
- The government may legally withdraw quota shares and cease to issue quotas without compensation to existing quota shareholders.
- A resource fee would be allowed under the current law. Community quotas and ceilings on the size of quota holdings would also be in accordance with the law.
The 1990 fisheries law is still controversial, however; on December 3, 1998, the Icelandic Supreme Court unanimously concluded that the clause in existing fisheries laws (Art. 5, 38/1990) which privileges those who derive their fishing rights from ownership of vessels during a specific period (during which their "fishing history" was established) is unconstitutional. This privilege, the Court concludes, violates both the Constitutional rule against discrimination (Art. 65) and the rule about the "right to work" (Art. 75). The Court reasoned that while temporary measures of this kind may have been both necessary and constitutional in the beginning, to prevent the collapse of fish stocks, the indefinite legalization of the discrimination that follows from Art. 5 38/1990 is not justified. That Article, in principle, the Court went on, prevents the majority of the public from enjoying the right to work, and the relative share in the common property represented by the fish stocks, to which they are entitled. The implications of the Court's decision will, no doubt, be far-reaching.
Effects on Communities. Some companies that have encountered economic difficulties have sold their quota to companies located elsewhere. Also, when TACs are decreased, some quota holders sell out because their share is not viable anymore. Whatever the reason for movement of quota out of communities, it affects the entire community (Pàlsson and Helgason, 1995). This has caused employment problems and eroded the tax base of certain municipalities, while companies in other municipalities have increased their quota holdings. The pattern of changes in the regional distribution of quota, however, is a complex one. The main accumulators of quota are companies in the larger towns of the northern part of Iceland. Small communities, with fewer than 500 inhabitants, have lost a much larger share of their quota than larger communities. In some cases, rural municipalities have tried to reverse the process of decline by buying or leasing quota or investing in local fishing firms.
Loss of quota in the smallest communities is particularly painful. For one thing, often there are no alternative jobs. Also, smaller communities are characterized by small vessels and household units. Frequently, an entire family is engaged in the operation of a small vessel; the housewife is likely to take care of financial accounts as well as baiting lines and clearing nets. Once the opportunity for fishing has been sold (sometimes because the quota share is too small to provide available fishing operation), the family as well as the fisherman becomes unemployed. At the same time, the family's house is likely to decrease in value because other residents are leaving the area, limiting the chance of establishing a household in another place.
Effects on Safety. Studies of fishing in Iceland and several other contexts—including the United States (notably Alaska), Canada, New Zealand, and Great Britain-have found an excess of work-related deaths and injuries in fisheries. Analyses at the University of Iceland show that between 1966 and 1986, 132 fishermen had fatal accidents at sea (108 died by drowning) (Rafnsson and Gunnarssdóttir, 1992). The number of person-years for the same period, a mea-
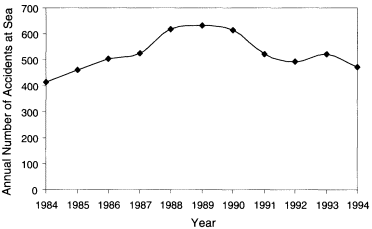
Figure G.20
Reported accidents at sea. Quotas were introduced in various fisheries between 1976 and 1983. Source: G. Pálsson, unpublished analysis.
sure of the number of fishermen at risk, was 147,649, which suggests a mortality of 89.4 per 100,000 person-years. The mortality rate for all accidents did not change appreciably during this period. As mentioned earlier, one of the objectives of the ITQ program was to make fishing safer, resulting in fewer deaths and injuries at sea. It is difficult to evaluate the impact of the quota program in isolation because many other developments have taken place at the same time (the structure of the fleet has changed, as well as the number of fishermen at risk; there are new regulations on safety precautions), and no systematic study has been conducted. Interviews with the people responsible for recording and analyzing accidents at sea do not, however, indicate significant changes in terms of safety and accidents. Data provided from the National Insurance Institute show that the frequency of accidents at sea (including non-quota fisheries in international waters) increased from the onset of the ITQ program to 1994 (see Figure G.20). Additionally, cod are plentiful in the winter, so fishing effort is concentrated then, despite the bad weather. There may also be pressure under the quota program for absentee owners to disregard crew safety.
Current Perceived Issues. Current discontent with the ITQ program can be summarized in several points:
- Many people oppose the privatization of fishing rights entailed by ITQ management because fishing rights are still very much intertwined with the symbolic notions of national sovereignty and equity. The "Cod Wars" with Britain in
- the 1970s, it is often argued, established a common, national fishing space within a 200-mile limit, not a privatized territory for a few vessel owners with quota.
- The initial allocation of quota to vessel owners is often criticized. Crew members point out that prior to the program, fishing was typically regarded as a "co-venture" of vessel owners and crew. Now, they say, vessel owners have become millionaires, while crew members, some of whom have a long fishing history, are disenfranchised. In some contexts, for example, in the Alaska halibut and sablefish fisheries, the allocation of crew shares to individual fishermen would face practical difficulties, due to inadequate records on the fishing history of crew. In Iceland, such difficulties were negligible. Records on crew are just as good as those on vessel ownership. The fact that crew have been left out in the initial allocation in most cases, in Iceland as elsewhere, seems to reflect a common bias toward capital ownership in the theorizing about and applications of ITQs.
- In the public debate, the idea that the fishing industry should pay for the privilege of holding harvesting quotas has a long history, and proposals to this effect have also been framed in the Icelandic Parliament, without obtaining sufficient support. At the present time, industry pays very little in the way of user fees; a fee of up to 0.4% of the catch value is collected to defray the costs of ITQ regulations. The fishing industry is, not surprisingly, adamantly opposed to any collection of fees beyond what would be needed to cover the cost of fisheries management.
- Many Icelanders are wary of the rapid concentration of ITQs in the hands of large vertically integrated companies. A committee appointed by the Ministry of Fisheries recommended that a ceiling for any single quota holder be fixed by law. Parliament decided in 1998 to set the limit at 10% for cod and haddock and 20% for other species.
- There is much resistance to profit-oriented exchange of fishing rights. Vessel owners who engage in such transactions are labeled "quota profiteers." One recent survey established that 60% of vessel owners believed that the buying and selling of ITQs was morally wrong.
- There is much concern with the emergence of the relations of dependency associated with fishing for others. Often, heavily loaded feudal metaphors are used to describe this state of affairs. In public discussion, the large firms that have been accumulating quota shares are habitually referred to as "quota kings" or "lords of the sea." The lessor quota kings are likened to medieval landlords, and conversely, small-scale lessees become "tenants" or “serfs." In January 1994, fishermen went on a national strike, protesting against the ITQ program, especially the effects of the so-called tenancy system. The leading slogan they employed was "No More Profiteering!" To many fishermen, this was a battle aimed at eliminating the ITQ program. As it turned out, the strike resulted in a two-week standstill in the fishing industry. Ultimately, the strike was terminated by temporary laws that forced fishermen back to work. Not content with this turn of events, fishermen went on strike again in May 1995 and once again in Febru-
- ary 1997. A committee established by the government to resolve the conflict suggested changes to the ITQ program in line with some of the fishermen's demands. For one thing, all transactions in quota shares should become transparent and pass through a quota market. Also, fishing and processing should be more clearly separated through the establishment of an office for registering the market prices of fish. Laws that incorporated these changes terminated the strike.
- One of the arguments for quota programs is that they obliterate the bureaucratic "jungle" of temporary regulations typical for traditional methods of dividing access, making it possible to avoid endless revisions and local debates. It is often argued, however, that the complexity of bureaucratic practices and regulations has not been significantly reduced under quota programs.
- Finally, there is much concern with the threat of municipal bankruptcy in fishing villages that have lost most or all of their quota, with massive unemployment and dissolution of communities. There are demands for effective limitations on quota transfers between regions and communities, to avoid extreme uncertainty in employment. Such limitations are applied in Norwegian fisheries, for example.
In summary, many Icelanders seem to have a sense of having been cheated by the designers of fisheries policy, drawing attention to the failures of the democratic political process. The critical decision on ITQs in 1983 was implemented in haste without sufficient public political debate. Neither then nor later has the electorate been presented with clear alternatives for fisheries management because most of the political parties have been divided on the issues involved. Originally, the ITQ program was presented as a short-term "experiment." Given, however, the relative irreversibility of social transformations of this kind, the ITQ program was hardly the innocent experiment that policymakers tended to speak of. Moreover, the program was presented as a fairly limited and technical exercise. There were no serious indications or warnings of the large-scale structural transformations that later took place. In fact, some of the proponents of the program indicate that a pure market-based program was introduced in moderate doses to avoid public rejection at an early stage.
It is one thing to abolish an ITQ program and quite another to change it. Although there is much public discontent with the program, there is no consensus concerning a potential alternative. Many Icelanders, however, insist that certain changes have to be made to the existing fisheries legislation.
New Zealand's Individual Transferable Quota System
Prior Regulatory Conditions in the Fishery
The legislated management of New Zealand's fisheries began with the Fisheries Act 1908, which remained in force until 1983. The act provided the statutory authority for regulatory policies aimed at the biological conservation and
protection of fishery resources. Prior to the declaration of the 200-mile New Zealand EEZ in 1978, marine fisheries were small and confined to an inshore domestic industry, fishing mostly in depths of less than 200 meters. New Zealand extended its jurisdiction initially to 3 miles, then to 12 miles. Outside the territorial sea, the fisheries were exploited by foreign fishing vessels, primarily from Japan, Korea, and the Soviet Union.
Before the introduction of ITQs in 1986, a number of fundamental changes were made in the way that fisheries were managed. From 1938 until 1963, the inshore fishery was managed using a restrictive licensing system involving extensive gear and area controls that required vessels to fish from specific ports. In 1963, the inshore fishery was completely deregulated. During the period of open entry that followed, the federal government encouraged investment in the fishing industry through investment incentives, capital grants, allowances, and tax breaks. The domestic industry expanded rapidly during this period, laying the foundation for the development of the deepwater sector following the declaration of the EEZ. The government's economic objectives remained unfocused, and its policies encouraged overcapitalization of the fishing industry.
In 1978, a moratorium was introduced on the issuance of additional permits to fish for rock lobsters and scallops. This was followed in 1982 by a moratorium on the issuance of new permits to fish for finfish. The moratoriums limited entry into the fisheries but did not limit fishing power, which continued to increase. In 1979, a number of separately managed limited entry fisheries were established for rock lobsters. Licenses were nontransferable, and entry to and exit from the fisheries were managed by a government licensing authority. This system of limited entry failed to control the increase in effort and investment in these fisheries.
When the EEZ was declared in 1978, fisheries inside and outside the 12-mile territorial sea were initially managed separately. For the zone outside 12 miles, a policy of limited domestic expansion, joint venture arrangements, and licensing of foreign fleets was applied. The moratorium continued to operate inside 12 miles.
Subsequently, the Fisheries Act 1983 was passed. This new act consolidated previous fisheries legislation and introduced the concept of fishery management plans. The act, and by extension the management plans, recognized the goal of maximizing the economic returns from fisheries as well as biological objectives. The act did not, however, integrate the economic goals with the goals of biological conservation. The suite of regulatory controls that were used to address the biological goals was largely retained. Most remain in force in 1999.
Also in 1983, the government issued a Deepwater Fisheries Policy that introduced a system of enterprise allocations for the deepwater trawl fisheries based on company individual quotas. This system created the basis for the introduction of the ITQ program into the inshore fisheries.
In 1986, the government passed an amendment to the Fisheries Act 1983 that
allowed for the introduction of the ITQ program in the inshore fishery and for its broader application to the deepwater fishery.
Prior Biological and Ecological Conditions in the Fishery
Prior to the introduction of ITQs in 1986, there was a widespread perception within government and industry that the inshore fisheries were biologically overfished.5 However, because there had been only limited stock assessment research before this time, this perception was supported by little quantitative information.
Initial TACs for most of the inshore finfish stocks were based on average reported landings during periods when the catches were considered to be sustainable. This was a largely qualitative rather than quantitative assessment. For a number of the prime inshore species, the initial TACs were set at levels up to 75% below the catches reported immediately prior to the introduction of ITQs.
Prior Economic and Social Conditions in the Fishery
Prior to the introduction of ITQs in 1986, there was a widespread perception within government and industry that the inshore fisheries were also economically overfished.6 Again, there was limited economic information to support this perception. The only published information available was a statement that the harvesting sector was overcapitalized by about $NZ28 million, based on insured value (Anon., 1984).
Until recently, New Zealand's economy depended mostly on the primary production industries of agriculture, horticulture, forestry, and fishing. In recent years, there has been a rapid growth in tourism in rural areas. Because of this mixture of industries there are no communities that depend solely, or even primarily, on fishing. One notable exception is the Chatham Islands where farming and fishing, and increasingly tourism, are the mainstays of the islands' economy.
Problems and Issues That Led to the Consideration of an ITQ Program
The problems and issues that led to the introduction of the ITQ program were based on the perception that New Zealand's fishery resources were suffering from biological and economic overfishing. The industry was overcapitalized, crippled by "excessive government management intervention" (Crothers, 1988), and subject to rapidly declining economic performance. Recreational fishermen were also concerned about the decline of the amateur fishery.
Objectives of the ITQ Program
During the development of the proposed ITQ program, the government issued a consultation document titled Inshore Finfish Fisheries—Proposed Policy for Future Management (Anon., 1984). This document clearly stated the objectives and aims of the proposed ITQ program:
- To achieve the long-term, continuing, maximum economic benefits from the resources; and
- To preserve a satisfactory recreational fishery.
A proposed management regime was developed and used as the basis for discussion. Within this management regime, ITQs were seen as the best mechanism for maintaining the balance between the harvesting sector and the fish stocks, delivering government restructuring assistance, and maintaining profit and equity within the industry.
The government proposed a management policy with the following characteristics:
- Future management of the inshore fishery would be by ITQs.
- Restructuring assistance would be provided by the government under a competitive tendering scheme to those who voluntarily reduced catches of key species.
- Resource rentals would be introduced with the ITQ property right.
- Future adjustment of TACs would be by purchase or sale of quota by the government by competitive tender.
- The program would be introduced first into the finfisheries and subsequently into the rock lobster and shellfisheries.
- The government decided that it would not consider any assistance for the inshore fishery unless it was assured of the following:
- There was a high level of support, cooperation, and involvement from industry in the proposed policy.
- Benefits gained through catch reductions and restructuring assistance were permanent.
The aims of the proposed management policy using ITQs as the main management mechanism were as follows:
- To rebuild fish stocks to their former levels:
- To ensure that catches would be limited to levels that could be sustained over the long term;
- To ensure that these catches would be harvested efficiently with the maximum benefits to fishermen and the nation;
- To allocate catch entitlement equitably based on fishermen's commitment to the industry;
- To manage the fishery so that fishermen would retain maximum security of access to fish and flexibility of harvesting;
- To integrate the ITQ programs of the inshore and deepwater fisheries;
- To develop a management framework that could be administered regionally in each fisheries management area;
- To assist the harvesting sector financially to restructure its operations to achieve the above aims; and
- To enhance the recreational fishery.
ITQ Program Development Process and the Transition to ITQs
The important features of the ITQ development process and the transition to the ITQ program have been described in detail by Clark and Duncan (1986), Clark et al. (1988), Crothers (1988), Dewees (1989), Boyd and Dewees (1992), and Davies (1992).
The following is a summary of the important steps leading up to implementation of the ITQ program.
- A long period of consultation occurred between 1983 and 1985 in which possible solutions to address the biological and economic overfishing issues facing the industry were explored by government and industry. Two broad types of solutions were considered: (1) regulatory intervention based on input controls and (2) intervention to establish long-term economic management principles, followed by the reductions of government interference to allow market forces to operate within biologically sustainable levels. After consultation, ITQs were chosen as the preferred management option, with industry support.
- During 1982, a moratorium on new entrants into the inshore fishery was implemented. During 1983-1984, regulations prohibited the participation of part-time fishermen. A participating fisherman had to earn a minimum of 80% of his or her income from fishing or $NZ10,000 per year (or both) from fishing. Fishermen not meeting this criterion were excluded from fishing by having their permits removed.
- In 1982, an enterprise allocation scheme for seven important species in the deepwater and offshore trawl fisheries was introduced.
- In 1986, the Fisheries Amendment Act 1986 was passed, making the introduction of ITQs possible.
- TACs were established for the inshore and deepwater finfish species that were included in the program.
- TACs were allocated among fishermen based on their catch history over a period of qualifying years.
- The government provided adjustment assistance to the fishing industry in the form of a buyback of quota entitlements in certain fisheries.
- A computerized reporting system was implemented in 1986, including monthly reports from fishermen and fish buyers, catch logs for vessels, and reports of all quota transfers.
- The ITQ program was implemented on October 1, 1986, and the tendering process was completed by the end of 1986.
The ITQ Program
The important features of the early years of the quota management system (QMS) have been described in detail by Clark and Duncan (1986), Clark et al. (1988), Crothers (1988), Dewees (1989), Boyd and Dewees (1992), and Davies (1992).
ITQ Management Units. As of October 1, 1997, there were 30 species or species groups in the QMS. The fishery for each species in the QMS is divided into a number of different fishery management units, officially designated as Fishstocks. The number of Fishstocks ranges from 2 to 10 for any given species, with a total of 179 different Fishstocks in the QMS. There are 10 different quota management areas (QMAs) in the QMS, and each Fishstock is composed of one or more QMAs. The government plans to introduce all remaining commercially harvested species into the QMS, which will increase the number of Fishstocks by more than 100 from the present number.
Initial Allocation of ITQ. The initial allocation of ITQs was made free of charge. ITQs were allocated in perpetuity and authorized the holders to take specified quantities of each species annually in each quota area (as opposed to a percentage share of an annually adjusted TAC).
Except for the species included in the enterprise allocation system introduced into the deepwater and offshore fisheries in 1983 that is described below, initial allocation was made on the basis of catch history, modified by the results of a buyback scheme and administrative reductions made to match effort more closely to the available resource. Fishermen who held permits in May 1985 were advised in mid-1985 of their individual catch by species for the three years ending in September 1984. They were allowed to choose two of these three years, the average of which would form their ITQ. They had the right to object to these catch histories before regional objections committees on the basis of statistical error, changed fishing patterns, or distortions of their normal catch record due to vessel breakdowns or bad health. Of 1,800 individuals notified of their catch histories, objections were lodged by 1,400. After the objections were heard, fishermen received notification of their catch histories, some of which had been amended, and provisional allocations of quotas shares were made. These
provisional allocations could be amended by the government administratively, reducing provisional quota shares among all fishermen on a prorata basis, or by fishermen offering quota shares back to the government as described below. A Quota Appeal Authority was established to hear objections to the provisional quota share allocations. More than 1,100 appeals were lodged with the authority.
In March 1982, an enterprise allocation system was introduced for seven important species in the deepwater and offshore trawl fisheries. Initial allocations to this sector were made on the basis of investment in catching, onshore capital, and onshore throughput. These allocations were converted to ITQs in 1986. Although catch history was used as the first mechanism for existing fishermen, in the case of some species, for example hoki and orange roughy, the Crown also held quota shares (the difference between the ITQs allocated bycatch history and the TAC) and these were allocated by tender. At least one large company gained its foothold in the deepwater fishery by being a successful tenderer. The allocation of some of the ITQs by tender had an effect on the perception of the strength of the property rights involved. This was used as an argument by industry that those rights were stronger than they would have been if ITQs were simply a recognition of the fishing history of an individual.
The most important aspect in the initial implementation of the ITQ program was the adjustment assistance offered in the form of a buyback of the fixed quota entitlements. The mismatch of the fleet capacity to available catch and the need to achieve significant reductions in the catches of many inshore fish stocks were major problems for the introduction of ITQs. Reductions in catch of as much as 83% for the inshore Fishstocks were required to ensure biological sustainability. Because the reductions in catch levels would not have been spread evenly across the species, the historic catch mix of individual fishermen would have been upset, leading to economic and bycatch problems.
The government provided adjustment assistance to the fishing industry by purchasing all or a portion of participants' quota shares. The sum of ITQs based on catch histories was often too high and exceeded the TACs for many inshore species. The government offered to buy back enough of the provisional allocations based on catch histories so that the sum of the remaining ITQs did not exceed the TACs. The use of voluntary reductions through a buyback scheme allowed individuals to decide whether to remain in the fishery at their historical catch level, sell out, or restructure their operations by selling only part of their provisional quota shares. Two tender rounds took place. The first was a competitive tender in which fishermen made bids to leave the fishery or reduce their effort. This round succeeded in establishing the price levels at which fishermen were seeking to retire quota. However, the full reduction to match the sum of the ITQs to the TACs was not achieved, so a fixed-price offer 20% below that determined by the competitive tender was made to those remaining. This still did not achieve the target reductions for a number of species, and administrative cuts were prorated across the remaining quota shareholders, who were provided with
a guarantee that the cuts will be restored when stocks recover and TACs are increased. Government paid out $NZ45 million to buy back 15,800 out of 21,500 metric tons in catch reductions sought.7
Accumulation and Transfer of ITQs. Maximum and minimum holdings of ITQ have been set. No person or company can hold more than 35% of the total of ITQs (for all areas combined) for each of the seven deepwater and offshore species originally allocated under the enterprise allocation scheme, or more than 20% of the total ITQ for any single Fishstock area for any other species. These limits apply to both owned and leased quota. These upper limits were introduced to address concerns over monopolistic aggregation of quota. A minimum quota holding of 5 metric tons was specified for finfish species and 1 metric ton for shellfish. The minimum limits were introduced to address concerns about excessive splitting of quota share holdings, resulting in too many vessels operating on fishing grounds, and to reduce the administrative costs of servicing and policing many small quota holders.
ITQs may not be held by persons not ordinarily resident in New Zealand or by companies with overseas control. ITQs may not be allocated to or held by owners of licensed foreign fishing vessels. Government has the sole right to lease ITQs to foreign fishing vessels.
Except for the restrictions described above, ITQs are freely transferable on the open market. A national fish quota exchange operated by the New Zealand Fishing Industry Board became operational on January 10, 1987. The exchange ceased operation after a few years because of the low volume of trades. Most quota has exchanged hands through direct negotiations between quota shareholders or through the small number of private quota brokers that have become established.
Monitoring and Enforcement. The New Zealand ITQ monitoring and enforcement system is based on documented product flow control that establishes and tracks a fish "paper trail." Fishermen must sell only to licensed fish receivers. These actions are documented, and details are submitted to the Ministry of Fisheries. All persons selling, transporting, or storing fish must keep business records establishing that the product has been purchased from a licensed fish receiver. Enforcement is largely land based. Fishery officers enforce product flow, and fishery auditors examine business accounts and records to monitor quota compliance. Cost-effective enforcement is enhanced by the use of sophisticated electronic monitoring and surveillance information and analytical systems.
Quota Monitoring and Reporting System. The system through which quotas are reported and monitored is based on three documents that can be cross-
checked—the Catch Landing Log, the Quota Management Report, and the Licensed Fish Receivers Return.
- Catch Landing Log—The Catch Landing Log provides an on-site record. It must be completed by the skipper of the fishing vessel when catch is landed. The log does not have to be submitted at regular intervals, but must be available on demand to any fishery officer or examiner. The log may be used to verify both of the other reports. It provides information on fishing activity and sale of the fish.
- Quota Management Report—This is the basic document for monitoring catch against quota. It must be completed by the quota shareholder and submitted to a Ministry of Fisheries registration office every month, or at shorter intervals if specified. It details (by area) the quantity of fish caught for each species for which quota shares are owned or leased.
- Licensed Fish Receivers Return—The Licensed Fish Receivers Return must be submitted to a Ministry of Fisheries registration office monthly, or more often if specified, by all persons licensed to receive fish from commercial fishermen. It contains the quota shareholder's name and fisherman identification number, and the species and weights on landing for all fish received. The report is designed to monitor commercial fish receiving operations beyond the landing point. It makes receivers as responsible as fishermen and quota shareholders in monitoring the use of the resource.
Other Reporting Systems. The Ministry of Fisheries obtains information from three other systems that can be compared with the information submitted through the Quota Monitoring and Reporting System: Catch and Effort Returns, Observer Programme, and Vessel Monitoring System.
- Catch and Effort Returns—The Ministry of Fisheries operates a compulsory catch and effort return system for 100% of New Zealand's fishing fleet. All fishermen are required to provide details of their fishing operations, including area(s) fished, species caught, amount of effort expended, and other relevant information. Depending on the size of the vessel and the gear type used, information is required either on a trip-by-trip basis or for each day fished. Returns must be supplied monthly.
- Observer Programme—The Ministry of Fisheries operates an at-sea observer program primarily in the deepwater and offshore fisheries that employ larger vessels. The Observer Programme averages 4,000 at-sea days per year and attains coverage of up to 25% of the total at-sea days by the fleet in some fisheries. Observers keep detailed logbooks that capture the same type of information as the Catch and Effort Returns and Catch Landing Logs and can be cross-checked with these other data sources. Observers also monitor at-sea transshipments of fish between vessels.
- Vessel Monitoring System—The Ministry of Fisheries operates a satellite system that monitors the position of fishing vessels. The system is currently required on all vessels greater than 43 m in length and on smaller vessels in selected fisheries. Consideration is currently being given to extending the system's coverage to smaller vessels in other fisheries.
Treatment of Offenses. Offenses against the ITQ program are treated not as traditional fishing violations but as commercial fraud. Penalties include significant fines, forfeiture of fish, vessel, and quota shares and are part of an effective deterrent.
• Quota busting—Reliable estimates of illegal catch are notoriously difficult to obtain and New Zealand is no exception. Quota busting is known to occur in some fisheries, especially those for high-value species such as rock lobster, paua, snapper, and orange roughy. The illegal catch of rock lobsters in 1993 was estimated at 715 metric tons, about 25% of the total New Zealand TAC (Annala, 1994). In previous years, the estimates of illegal catch from individual Fishstocks were as high as 68%. The accuracy of these estimates is not known.
Boyd and Dewees (1992) concluded that quota busting has been substantially suppressed. A few recent well-publicized prosecutions have resulted in heavy penalties, including loss of quota shares, vessels, and plant and equipment. Industry is taking a more active role in helping to reduce illegal fishing, especially in the rock lobster and paua fisheries. An industry-initiated management plan for the east coast North Island rock lobster fishery, which had the highest estimated level of illegal catch, has apparently reduced the level of illegal catch substantially. The fishery is now closed during summer months, the traditional period of greatest illegal activity, and all pots must be removed from the water during the closure period to assist enforcement.
Discarding and highgrading—The discarding or “dumping" of species in the QMS is illegal, except in very limited circumstances. Discarding has been experienced since the introduction of the QMS, but because it occurs at sea, it is difficult to prove. In the multispecies inshore trawl fisheries, fishermen have been known to dump quantities of non-target QMS species rather than use one of the legal mechanisms for dealing with bycatch. In the deepwater trawl fisheries, vessels carrying observers have reported larger quantities of non-target QMS species than vessels fishing the same area that do not carry observers, indicating that discarding probably occurs on vessels without observers. Highgrading has occurred in both the inshore and the deepwater fisheries when a premium price is paid for fish of a certain size or quality and when small fish are discarded because of their unsuitability for processing.
Administration and Compensation. The New Zealand ITQ program is administered primarily by the Ministry of Fisheries. The one major exception is quota trading, which is carried out directly between quota shareholders or through
private brokers. The Ministry of Fisheries is currently consulting with fisheries stakeholders on the transfer of responsibility to the commercial industry for administering the ITQ program.
Some of the major administrative issues encountered during the first 10 years of the New Zealand ITQ program are described below.
Bycatch Problems in Multispecies Fisheries. Most species in the QMS are caught in multispecies trawl fisheries. Bycatch problems have been experienced (mainly in the inshore fisheries) because the TACs set initially in 1986 were not set in proportion to pre-QMS landing levels and because of natural variations in stock size. TACs for the overexploited inshore species were set at levels from 25 to 75% of the pre-QMS levels, depending on the biological status and management objectives for each Fishstock. TACs for under- and fully exploited species taken in the same mixed fisheries were set at levels equal to or greater than their pre-QMS levels. This resulted in an imbalance in the catch mix relative to the available quota. Bycatch problems have resulted in both TAC overruns and underruns.
There are no constraints in the QMS that require fishermen to stop fishing in multispecies fisheries when the quota (either ITQ or TAC) of a particular species has been filled if the quota of other associated species has not been caught. The preferred method for dealing with bycatch problems is for fishermen to change their methods of operation to match their catches to their quota allocation. Where this approach is not successful, a charge of overfishing can be avoided if fishermen obtain quota shares to balance catch within a short period of time (before the fifteenth of the next month) using one of the following mechanisms:
- Purchasing or leasing ITQ from other holders;
- Fishing on behalf of another ITQ holder by either fishing against the other's quota or declaring catch against the other's quota;
- Catching up to 10% in excess of their ITQ for a given species for a given year or carrying over up to 10% of their ITQ to the following year; and
- Leasing to the Crown for the remainder of the fishing year an equivalent value of unfished ITQ of another species that has been approved by the Ministry of Fisheries for the QMA (the bycatch trade-off scheme). The scheme operates only for selected inshore species in certain areas and is not permitted in deepwater fisheries.
If a fisherman cannot obtain quota to cover bycatch using one of the mechanisms described above, there are two additional mechanisms that can be used to avoid an overfishing charge:
- Surrendering the exvessel price value of overcaught fish to the Crown; or
- Paying a "deemed value" for overcaught fish to the Crown. Fishermen have until the fifteenth of the month following the month of the overcatch to obtain quota to cover the overcatch, and if they are successful the deemed value
- will be returned to them. The deemed value is set at a level that discourages dumping of fish caught without quota but does not encourage targeting without quota.
Annala et al. (1991) presented information on the extent of TAC overruns during the first two years of the QMS. In 1986-1987, 15 TACs were exceeded out of the total of 169 Fishstocks. The major reasons for these overruns were the 10% ITQ overrun provision in ten Fishstocks and surrenders and the bycatch trade-off scheme in five Fishstocks. Seven of the fifteen overruns were due to overcatching non-target species in multispecies trawl fisheries.
In 1987-1988, a total of 33 of the 169 TACs were exceeded. The 10% ITQ overrun provision accounted for 9 of the overruns, and surrenders and the bycatch trade-off scheme for 24 overruns. Seventeen of the 33 overruns were due to overcatching non-target species in multispecies trawl fisheries. The increased use of the bycatch trade-off scheme in 1987-1988 was due to a combination of an increase in the number of species and areas in the program and fishermen becoming more familiar with its operation.
The occurrence of TAC overruns has decreased since 1987-1988. Reported landings for the 1993-1994 fishing year indicated that only 22 of the 179 TACs were overcaught. Of these 22 Fishstocks, 6 were overcaught by 2% or less, the same number as were overcaught by this amount in 1987-1988. The 10% overrun provision was the main cause of 12 overruns and surrenders-deemed values-bycatch trades for the other 10.
The reduction in the number of TAC overruns has resulted from changes in the methods of operation of fishermen as they have gained more experience with the QMS. Fishermen have adjusted their quota holdings to reflect their expected catch mix more accurately. Some fishermen have stopped targeting certain species when their ITQ for associated bycatch species is filled if they know they will continue to catch the bycatch species. Industry has actively encouraged the reduction of TAC overruns for bycatch species by introducing codes of practice in some fisheries. An example is the reduction in the bycatch of hake, ling, and silver warehou in the west coast hoki (Macruronus novaezelandiae) fishery. Where these steps have not been possible or successful, the "overfishing" provisions described earlier have been used. Fishery managers have worked in consultation with the fishing industry to fine-tune the use of the overfishing provisions on an annual basis to reduce the amount of overcatch.
Complicated Nature of the Quota Management System. The complicated nature of the QMS, especially related to the overfishing provisions described earlier, has required very complex computer systems to track catch against quota. The inclusion of provisions such as 10% overruns and underruns, "fishing-on-behalf" arrangements, and the deemed value and bycatch trade-off systems have added complexities that have often strained computer systems to near breaking. Catch-against-quota balances have often been late and sometimes inaccurate.
This has reduced the quota shareholders' faith in the system to produce accurate information. These problems are being addressed in the QMS simplification project described below.
Evaluation and Adaptation. Evaluation. One of the glaring gaps in the New Zealand ITQ program is the lack of any systematic, quantitative evaluation of the benefits and costs of the program either by government agencies or by the fishing industry. There is not much in the way of objective, quantitative information available, but there is a great deal in the way of perceptions.
Adaptation. A number of adaptations have been made in the first 10 years of the New Zealand ITQ program. The important ones are described below.
1. Bycatch problems in multispecies fisheries—The adaptations made to the program to address bycatch problems in multispecies fisheries have been described in the previous section.
2. Settlement of Maori fisheries claims—In 1987, a High Court injunction was obtained by the Maori that prevented the QMS from being expanded to incorporate all commercially significant species. This led to a great deal of uncertainty within the industry, both with regard to existing Maori property rights and future implementation of the QMS.
In September 1992, in-depth negotiations began between the government and representatives of Maori fisheries interests. The Maori negotiators had a confirmed mandate from the great majority of Maori tribes to finalize a settlement of claims on certain conditions. The negotiations resulted in the signing of a Memorandum of Understanding that set the basis of the benefits and conditions for final negotiations.
Intense negotiations were carried out on the basis of the Memorandum of Understanding and resulted in the final settlement. The settlement, consisting of the Deed of Settlement and the Treaty of Waitangi (Fisheries Claims) Settlement Act 1992, provided for a full and final discharge of the government's obligations under the Treaty of Waitangi. The settlement provided the following:
- $NZ150 million for the purchase of 50% of Sealord Products, New Zealand's largest fishing company, which had 25% of total allocated fish quota and achieved annual sales of about $NZ250 million;
- The transfer to the Maori of 20% of the quota for all new species entering the QMS;
- Regulations to recognize and provide for the customary food gathering and the special relationship between the Maori and those places that are of customary food-gathering importance to the extent that such food gathering is not conducted in a commercial manner.
The settlement provided for the transfer of NZ$500 million in assets to the
Maori, giving them almost 40% of the New Zealand commercial fishery, with the potential to acquire a larger proportion of the resource with the funds provided by the settlement. The settlement made the Maori the single largest participant in the industry.
The settlement also protected the livelihoods of existing quota shareholders by bringing security to the commercial fishing industry. The settlement prevented the Maori from advancing further commercial fisheries claims through the courts and ensured that the management of fisheries was not compromised by the Maori acting contrary to sustainable management practices. The purchase of Sealord Products had little effect on other quota holders since it was simply a transfer of ownership of a fishing company and had little impact on the distribution of quota shares within the industry.
3. Change to proportional ITQs—When the QMS was introduced in 1986, ITQs were denominated as a fixed tonnage. TACs were to be increased or decreased by the government entering the marketplace and either selling or buying quota. When the QMS was being developed, it was proposed to create a "revolving fund" for such transactions. Resource rentals and revenues from the sale of quota would have gone into the fund, which would be used to buy back quota as necessary. However, the fund was never created.
In the late 1980s, the government was faced with substantial costs to reduce the TACs for, primarily, two orange roughy Fishstocks. The government announced its intention to change the QMS from a program based on fixed-tonnage ITQs to one in which ITQs were denominated as a proportion of the TAC. ITQs would be increased or decreased in proportion to the changes in the TAC.
The government and the fishing industry entered into negotiations over the change from fixed to proportional ITQs. The outcome of the negotiations was an agreement widely known as the "Accord." The main results of the Accord are as follows:
- ITQs were changed from a fixed to a proportional basis on October 1, 1990.
- Resource rentals for all species in the QMS were frozen for five years from October 1, 1989, except for increases in line with movements in the Consumer Price Index.
- During the period from October 1, 1989, to September 30, 1994, compensations for TAC reductions were paid out of the resource rental pool. The compensation period for hoki could be extended beyond this period if TAC reductions exceeded certain limits.
- The price of compensation was to be agreed between the government and the fishing industry, and failing agreement, was to be arbitrated.
- A TAC reduction of 4,000 metric tons for orange roughy on the Chatham Rise was agreed to, and other TAC reductions were to be discussed with industry.
- A body with 50:50 government-industry representation was created to
- advise the Minister of Fisheries on TAC changes. This body has developed into the TAC Advisory Council.
- Quota shareholders who suffered administrative cuts without compensation would receive first preference when TACs are increased.
- Resource rentals were paid on quota shares held until the end of the compensation period.
- The bycatch trade-off system continued, subject to annual review.
- TAC reductions would be accomplished by the Crown first canceling quota owned by it, subject to its various obligations.
The terms of the Accord provided the basis for the move to proportional ITQs. Since October 1, 1990, there have been substantial changes in some TACs, for example, those for orange roughy, snapper, and rock lobster discussed earlier.
The terms of the Accord related to compensation for TAC reductions and payment of resource rentals expired on September 30, 1994. Resource rentals ceased on that date and were replaced by the introduction of cost recovery on October 1, 1994. From October 1, 1994, all of the avoidable costs of managing, researching, and enforcing commercial fisheries are to be paid by the fishing industry. For the 1994-1995 fishing year, about $NZ37 million was recovered from the fishing industry from the total government expenditure of about $NZ46 million in these three areas.
4. Strategies for adjusting TACs in situations with limited information—For many Fishstocks there is limited information available on stock size and population dynamics that can be used to estimate yields to provide a basis for varying TACs. Resource constraints make it unlikely that substantially more information will become available in the near future. For some of these Fishstocks there have been substantial increases in catch in recent years, and the existing TACs either are constraining the catch or are being overcaught. The fishing industry has suggested that these increased catches have not occurred through an increase in effort but are the result of increases in stock abundance.
The fishing industry has proposed increases in TACs for some Fishstocks, using a process that has become known as "adaptive management." The process is not strictly a form of adaptive management as defined by Hilborn and Walters (1992), where an experimental approach is taken in which TACs are set at various levels from total closure to deliberate overexploitation in an effort to obtain better estimates of stock size, productivity, and sustainable yields. The New Zealand approach has been to increase the TACs for certain Fishstocks where anecdotal information suggests that increased catch levels are likely to be sustainable and then to monitor the effects.
The Ministry of Fisheries has recognized that there could be considerable benefits from increasing some of the TACs, as proposed by the fishing industry. These potential benefits include the following:
- Economic benefits to the industry through increased catches;
- Development of precedents for cooperative management of fisheries with the industry, especially insofar as industry is willing to assist with increased data collection and analysis; and
- Changing catch levels in a controlled fashion, which may provide better information that can be used as a basis for future management decisions.
- The following criteria and guidelines under which adaptive management changes could be considered were agreed:
- Catch level increases could be considered for Fishstocks for which abundance appears to have increased, for example, in situations of stable or increasing landings or increasing CPUE where effort has not increased.
- Contingency plans agreed upon by the Ministry of Fisheries and the fishing industry should be finalized before TACs are changed.
- Contingency plans should specify the data that will be collected and the responses to the results of the data collection and subsequent analysis. For example, they should specify what level of change in an indicator variable would indicate that stock size is increasing or decreasing.
- There should be an agreed period over which the TAC changes will take place. There is general agreement that five years is a useful period over which to assess the effects of such changes. However, the effects of TAC changes are assessed each year during the annual stock assessment and TAC-setting process.
- There should be agreement on the nature and extent of cooperative data gathering and research projects and how resources are to be provided for these projects.
- The choice of which Fishstocks to include in the scheme should be based largely on what effective monitoring programs can be established. Inclusion of a large number of Fishstocks is seen as too ambitious, and the scheme should be developed incrementally.
The adaptive management scheme was first implemented for the 1991-1992 fishing year. During the first four years of operation of the scheme, the fishing industry requested TAC increases for 39 Fishstocks (there have been no requests for TAC decreases under the scheme). Increases have been granted for 19 Fishstocks.
The effects of these increases are being monitored in a number of ways. The Ministry of Fisheries operates a mandatory catch and effort logbook system for all fisheries, and data are being collected and analyzed from this system. In addition, data are being collected for some of the adaptive management Fishstocks during the course of Ministry of Fisheries research programs (e.g., trawl surveys) for these and other species. The fishing industry has introduced a voluntary logbook program for some of the adaptive management Fishstocks to collect
more detailed and specific catch and effort and biological information. The fishing industry is also providing resource-specific research projects for some of the Fishstocks and has employed two scientific staff members to work cooperatively with Ministry of Fisheries staff specifically on the adaptive management Fishstocks.
During the 1997 stock assessment and management consultative meetings, criteria were developed by the Ministry of Fisheries, in conjunction with stakeholders, to determine the suitability of the TAC increases that had been granted under the adaptive management program. Criteria included the determination of whether or not the TAC increases were sustainable, based on the available information, and whether effective monitoring programs had been put in place by the industry. The criteria were applied to each of the adaptive management Fishstocks using a decision tree approach. As a result of this evaluation, the TACs for nine Fishstocks were reduced to or toward their lower pre-adaptive management program levels.
Outcomes of the ITQ Program
Biological and Ecological Outcomes for the Fishery. Following are the major biological and ecological outcomes of New Zealand's ITQ program.
Improved Biological Status of the Resource. Before the QMS was introduced in 1986, there had been only limited directed stock assessment research in New Zealand. Most fisheries research had been directed at gathering basic biological information on a few commercially important species. Moreover, because of the lack of a mandate to carry out stock assessment research, abundance estimates were not available for most species. For many species in the QMS, data on age, growth, mortality, fecundity, abundance, and other important factors are still not available.
The QMS was introduced in 1986 because of the perception that many, if not most, of the inshore fish stocks were suffering from high levels of biologic and economic overfishing. TACs for the overexploited inshore species were set at levels from 25% to 75% of the pre-QMS catch levels, depending on the biological status and management objectives for each Fishstock. On the other hand, the offshore, deepwater species were relatively newly exploited, and most were likely to still be in the "fishing-down" phase.
New Zealand legislation has constrained the ability to vary TACs. The criterion that TACs are set and altered to allow the stock to move toward a level of biomass B that will support the maximum sustainable yield (BMSY) has been interpreted very strictly. Estimates of maximum constant yield and current annual yield have been used as reference points when varying TACs and have not necessarily translated directly into TACs (see Annala, 1993, for definitions). TACs cannot be changed unless it can be demonstrated by the stock assessment
process that the stock is moving toward a size that will support the MSY, even when other data suggest that the TAC is at an inappropriate level.
How has the QMS performed with regard to improving the biological status of Fishstocks? Sissenwine and Mace (1992) concluded that there was little evidence of improvement in the condition of fisheries resources since 1986, but because stock assessment information was limited, it was difficult to know. They stated, "The general conclusion is that TACs are not closely tied to the best available assessments of the fisheries resources, nor are catches strongly controlled by the TACs. Some valuable stocks have probably declined in abundance. To date, the track record of ITQ management with respect to conservation is not good."
The current situation based on the 1997 stock assessments (Annala and Sullivan, 1997) is much more positive than the picture painted by Sissenwine and Mace. Of the 179 Fishstocks in the QMS as of October 1, 1997, 30 were created for administrative purposes around an offshore island group that is only lightly fished for a few species. Of the remaining 149 Fishstocks, only 11 (7.4%) were estimated to be below BMSY. Sixteen (10.7%) Fishstocks were estimated to be above and 27 (18.1%) at or near BMSY. The status of the remaining 95 (63.8%) Fishstocks relative to BMSY was not known. Unfortunately, most of the inshore Fishstocks that experienced large reductions in catch levels in 1986 are included in the latter category, and it has not been possible to monitor the rate of stock rebuilding, if any. However, a series of inshore trawl surveys initiated in the late 1980s and early 1990s will provide future estimates of abundance for some of these species so that sustainable yields can be estimated and the rate of rebuilding determined.
Most of the major Fishstocks that are below BMSY are now being rebuilt. The TAC for the largest orange roughy fishery on the Chatham Rise has been reduced from about 38,000 metric tons for the 1988-1989 fishing year to 7,200 metric tons for 1997-1998. The TAC for the Challenger orange roughy fishery was reduced from 12,000 metric tons in 1988-1989 to 1,900 metric tons in 1990-1991 and has remained at this level since. The TAC for the largest snapper fishery in QMA 1 was reduced from 6,000 metric tons in 1991-1992 to 4,900 metric tons in 19921993 and 4,500 metric tons for 1997-1998. In addition, a management plan is being developed to rebuild the stock to BMSY. The combined TAC for the eight North and South Island rock lobster Fishstocks was reduced from 3,275 metric tons in 1990-1991 to 2,383 metric tons in 1993-1994. A 10-year management plan has been developed to address various biological issues to improve the probability of rebuilding stocks.
The need for some large TAC reductions, especially in the orange roughy fisheries, prompted the change from fixed tonnage ITQs to ITQs as a proportion of the TAC in 1990. The change to proportional ITQs has removed the financial burden from the government to buy back quota and has made the reduction of TACs easier.
Open and Transparent Stock Assessment and TAC-Setting Process. One of the strengths of the New Zealand QMS is the completely open and transparent
stock assessment and TAC-setting process. The process is open to all users of the resource and all groups with interests in the fisheries, including the Maori, the commercial industry, recreational fishermen, and environmental-conservation groups. User groups can be represented by consultants, and they have been employed particularly by the commercial industry. All stock assessment data collected by the Ministry of Fisheries are made available (at cost) to all participants in the process. The usual caveats regarding commercial sensitivity apply to the release of catch and effort data collected from the industry. The data are provided only in an aggregated form so that individual fishermen and/or companies cannot be identified.
The foundation of the stock assessment process lies in the Fishery Assessment Working Groups. The working groups analyze the available fishery and research data and prepare draft reports giving the details of the stock assessments and status of the stocks according to agreed terms of reference for all 179 Fishstocks in the QMS.
Fishstocks for which the stock assessments indicate a substantial change in the yield estimates or status of the stocks are referred to the Fishery Assessment Plenary. The plenary session is open to all participants in the process and reviews the data and analyses produced by the working groups. The stock assessment results from the plenary are used as a basis for preparation by the Ministry of Fisheries of an initial position paper providing advice to the Minister of Fisheries as to which Fishstocks may be considered for changes to TACs and other management measures for the following fishing year. Other information (e.g., socioeconomic, environmental) is included in the discussions at this stage. This advice paper is also made available to the users and forms the basis for discussion at a series of consultative meetings between the Ministry of Fisheries and these groups.
After the consultative meetings between the Ministry of Fisheries and the user groups, the Minister of Fisheries holds a series of meetings with users to obtain their views on any proposed management changes. The final authority to decide on TAC changes lies with the Minister of Fisheries.
Economic and Social Outcomes for the Fishery. The following major economic and social outcomes of New Zealand's ITQ program have also been identified.
Secure Access to the Resource. The allocation of quota shares in perpetuity has guaranteed security of access to the resource. When rock lobsters were introduced into the QMS in 1990, court action taken by Maori was settled when the government agreed to rock lobster ITQ being issued for a 25-year term. The settlement of Maori fishing rights issues with the passage of the Treaty of Waitangi (Fisheries Claims) Settlement Act in 1992 resulted in the lifting of the injunction.
A Market-Oriented Industry Structured by Market Forces. Dewees (1989)
found that the fishing industry responded rapidly to the guarantee of access to the resource conferred by ITQs. Many fishermen in the Auckland region had switched from maximizing quantity to maximizing quality, which he attributed largely to the easing of the “race for fish." By May 1987, 40% of the quota shareholders were changing to methods that allowed the onboard handling of individual snapper to supply the lucrative ike jime market in Japan. A more recent development has been the export of live fish (ike dai) to Japan.
Other market developments have been attributed at least partly to the security conferred by ITQs. The export of live rock lobsters has increased from 1,947 metric tons in 1990 to 2,722 metric tons in 1993. Fishermen are also spreading their fishing effort and catching more of their rock lobster quota during months with traditionally low catch rates when the price is higher. New Zealand's largest fishery is the trawl fishery for hoki. The fishery has been carried out primarily on the west coast of the South Island during the July to September spawning period. Most fish were caught by vessels that headed and gutted the fish or with onboard surimi plants. Catch rates of up to 200 metric tons per tow were not uncommon. In recent years, New Zealand companies have invested in vessels with onboard filleting lines designed specially for hoki. These vessels fish for hoki year-round away from the spawning ground and typically target smaller quantities of fish, usually in the range of 4 to 5 metric tons per tow to improve product quality. The catch of hoki caught away from the spawning ground outside the spawning season increased from 30,000 metric tons in 1990-1991 to 69,000 metric tons in 1992-1993.
Reduced Overcapitalization. Some commentators have stated that the QMS has resulted in a reduction in overcapitalization (e.g., Clark, 1993). However, there are few actual data or analyses to support this assertion. One indirect measure that could be used to evaluate the reduction in overcapitalization involves changes in quota holdings. Between 1987 and 1989, the 10 largest ITQ shareholders increased their share of the total quota from 67% to 82% (Anon., 1987; Bevin et al., 1989). However, this share had fallen back to 68% by March 1994 (Parker, 1994), so the concentration of quota may not be a good measure of the reduction in overcapitalization.
The New Zealand fishing industry has experienced strong export revenue growth since the QMS was introduced. The total primary value of the catch (which is estimated as landed catch multiplied by an estimated exvessel price) corrected for inflation increased from $NZ427 million in 1986 to $NZ456 million (1986 dollars) in 1993, while total seafood export receipts increased from $NZ657 million to $NZ896 million (1986 dollars) over the same period. In an ITQ program, the expected rates of return are capitalized into the quota value when it is traded. The strong revenue growth has led both directly and indirectly to large increases in the value of quota for some species. For example, the average sale price of pa (abalone) (Haliotis iris) quota increased from about $NZ50,000 per metric ton in 1991 to about $NZ190,000 (1991 dollars) per metric ton in 1994.
Greater Industry Freedom, Flexibility, and Responsibility. The easing of the race for fish that has resulted from the ITQ program has undoubtedly given fishermen the freedom and flexibility to structure their operations to maximize the value of their catch rather than the volume. Some examples given in the section above describe changes to operations that have resulted in maximization of the value of the landed catch.
There has also been increased industry responsibility and cooperation since the start of the QMS. Some examples follow:
- Quota shareholders in three of the rock lobster Fishstocks are funding two full-time scientific staff members to carry out research in their areas that will contribute to stock assessment.
- Quota shareholders in one of the paua Fishstocks have asked for and taken a voluntary 10% reduction in TAC because of their concern about the state of the Fishstock.
- Quota shareholders in the Chatham Rise orange roughy fishery have spent in excess of $NZ1 million on exploratory fishing ventures, bathymetric surveys, and trawl surveys to estimate relative abundance, which will directly impact the assessment for this fishery.
- Scallop (Pecten novaezelandiae) quota shareholders have formed a company to fully fund an enhancement program for New Zealand's largest scallop fishery. Included in the arrangement is the provision that they will also enhance recreational-only fishing areas.
- In 1989-1990, high levels of bycatch of hake (Merluccius australis ), ling (Genypterus blacodes), and silver warehou (Seriolella punctata ) in the west coast hoki fishery resulted in the TACs for these three species being exceeded. Quota shareholders developed a voluntary code of practice and the catches of these three species have been reduced.
Improved Industry Efficiency, Competitiveness, and Profitability. It is a widely held perception that the efficiency, competitiveness, and profitability of the industry have increased (e.g.. Clark, 1993). Once again, there are few actual data or analyses to support these claims.
An index of the seafood industry's competitiveness has been calculated for 1988-1993 (Parker, 1994). The index was computed as the difference between the seafood industry's costs of production (input index) and the revenue received for output (output index). This competitiveness index increased by about 20% from 1988 to 1993.
Since 1986, an Annual Enterprise Survey of the seafood industry has been carried out by the New Zealand Department of Statistics. The survey provides a financial picture of industry performance over the fishing year. It details costs, assets, and revenue for the catching and processing sectors, which are combined to avoid double counting.
Because it is a survey, the entire industry is not covered, different companies are sampled each year, and it is difficult to compare results between years. However, survey results since the first year of the QMS do not support the perception that industry profitability has increased. For the six years from 1986-1987 to 19911992 the returns on assets (after interest, rentals, and tax) for the major quota holders in the survey were 11.1%, 3.0%, 10.2%, 10.8%, 6.6%, and 11.5%, respectively.
Economic and Social Outcomes for Fishery-Dependent Communities. New Zealand has few communities that are largely dependent on fishing. The economic and social outcomes of the ITQ program for these communities have not been analyzed.
Administrative Outcomes. Major economic and social outcomes of New Zealand's ITQ program have been identified. Sissenwine and Mace (1992) concluded that the QMS had not reduced government intervention. Indeed, the advent of the QMS saw the introduction of new record-keeping and reporting requirements, such as the quota monitoring and reporting system (described in Clark et al., 1988) and the bycatch trades system (Annala et al., 1991). In addition, most input controls, for example, minimum size restrictions, closed seasons and areas, have remained in place.
Although the government paid for the management systems, there were no incentives for individuals in the industry to minimize the system costs. Instead, it was apparently to the industry's advantage to seek an elaborate management system to make it more convenient. The government was generally sympathetic to the requests for convenience, but it either underestimated the costs of elaborating the systems or was reluctant to pay to construct proper systems. The result was poorly constructed complex systems that led to significant dissatisfaction with aspects of the QMS for many years. The lessons from this included:
- Simple systems that work well and are relatively inexpensive have much to commend them compared to complicated systems.
- Having the industry pay for the management systems and having a large role in their design and operation will help balance aspirations for complexity and controlling costs.
Current Perceived Issues. In 1996, a new Fisheries Act was passed by the New Zealand Parliament. The act concluded the review of fisheries legislation that had been ongoing since 1991. It provided a complete rewrite of the Fisheries Act, building on the strengths of the QMS; refined some aspects of the QMS; and added other fisheries management features.
The act has the following principal components that address many of the current issues with regard to the ITQ program.
Environmental Principles. The act provides the following general environmental principles:
- Stocks must be maintained at or above defined levels. TACs must be set at a level that will maintain stocks at or above a level or move them toward the level that will produce the maximum sustainable yield.
- The effects of fishing on associated and dependent species must be taken into account.
- The biological diversity of the aquatic environment must be conserved.
Consultation. The act formalizes the processes for consultation with sector-user groups. This replaces the current informal advisory group structure. The creation of a National Fishery Advisory Council, with representation from all sector-user groups, has been authorized.
Conflict Resolution. The act formalizes the resolution of conflicts concerning access to resources. The process first encourages various sector-user groups to resolve their differences. If the parties are unable to negotiate a solution, the Minister may appoint a commissioner to hold an inquiry and report back to the Minister. All such disputes will be resolved by the Minister.
Addition of New Species into the Quota Management System. The government intends to move all commercially harvested species into the QMS over the next three years. Twenty percent of all new quota will be allocated to Maori. For most species, quota will be allocated on the basis of catch history. There will be an appeals process for quota allocations, but the process will be stricter than previously. The process will not result in any increases to TACs, and there will be a time limit for lodging appeals.
Simplification of the Quota Management System. At present, the central rule in the QMS is that fishermen must hold quota before going fishing. The manner in which this rule is administered has resulted in the overfishing provisions described above and drives much of the complexity of the QMS.
The new Fisheries Act separates the property right (ITQ) from the catching right by introducing a system of annual catch entitlements (ACEs). For most species, fishermen will no longer be required to hold ITQ before going fishing but will be required to hold an ACE. At the beginning of each fishing year, every person who holds quota will be allocated an ACE based on the amount of quota held. ACEs are superficially similar to an annual lease of quota and are tradable rights like ITQs. When the catch exceeds the ACE, a deemed value is payable. The separation of catching rights from ITQs is expected to assist investment in fisheries by increasing the security of ITQs.
The existing 10% overrun of ITQ provision will be abolished. Consultation is occurring with stakeholders to determine which mechanisms will be retained to assist with managing bycatch issues in multispecies fisheries.
Institutional Reform. Another issue is reform of the delivery of fisheries
management services. Recent reforms include the provision of services by agencies outside the Ministry of Fisheries (including fisheries research), the transfer of fisheries stock assessment research into a Crown Research Institute, and the establishment of a stand-alone Ministry of Fisheries. The role of the Ministry of Fisheries is being reduced to one of policy advice; determining the standards and specifications for and purchasing, monitoring, and auditing the contestable services; liaison and facilitating conflict and dispute resolution; and enforcement, compliance, and prosecutions. Contestable services will potentially include all the other functions currently performed by Ministry of Fisheries, including administration of quota and permit registries, catch and effort data management, satellite vessel monitoring, and the observer program. Consultation is occurring on the direct contracting of some of these services by the industry.


