
1
THE DOCTORAL POPULATION IN THE HUMANITIES
Distribution by Field
The estimated population of humanities doctorates in 1991 was 100,300. For this project, the population was defined to include Ph.D.s who earned their degrees in a humanities field from a U.S. institution between January 1942 and June 1990, who were age 75 or younger, and who were residing in the United States in September 1991. Doctorates in English and American languages and literature constituted approximately one-fourth of the humanities population, and another one-fourth was composed of doctorates in fields of history (See Figure 1). Table 1 shows the distribution of the humanities population by field of doctorate and field of employment. More than one-fifth of the humanists were employed in a nonhumanities field in 1991, and 13.4 percent were not employed (this figure includes those who were retired).
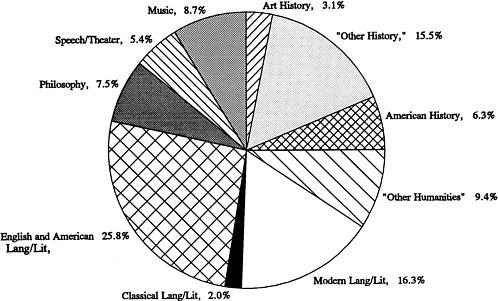
FIGURE 1. Humanities Ph.D. population, percentage by field of doctorate, 1991.
TABLE 1 Distribution of Humanities Doctorates in the United States, by Field of Degree and Field of Employment, 1991
|
Field of Degree |
Field of Employment |
|||
|
No. |
% |
No.* |
% |
|
|
All Fields |
100,300 |
100.0 |
100,300 |
100.0 |
|
American History |
6,300 |
6.3 |
5,900 |
5.9 |
|
“Other History” |
15,500 |
15.5 |
6,700 |
6.7 |
|
European History |
4,300 |
4.3 |
3,200 |
3.2 |
|
History of Other Countries |
4,400 |
4.4 |
2,900 |
2.9 |
|
History and Philosophy of Science |
300 |
0.3 |
600 |
0.5 |
|
Unspecified History† |
6,500 |
6.5 |
N/A |
N/A |
|
Art History |
3,100 |
3.1 |
2,500 |
2.5 |
|
Music |
8,700 |
8.7 |
6,000 |
6.0 |
|
Speech/Theater |
5,400 |
5.4 |
2,200 |
2.2 |
|
Philosophy |
7,500 |
7.5 |
4,400 |
4.4 |
|
English and American Lang/Lit |
25,900 |
25.8 |
14,900 |
14.8 |
|
Classical Lang/Lit |
2,100 |
2.0 |
1,200 |
1.2 |
|
Modern Lang/Lit |
16,400 |
16.3 |
10,100 |
10.1 |
|
“Other Humanities” |
9,500 |
9.4 |
7,800 |
7.7 |
|
Linguistics |
2,900 |
2.9 |
1,000 |
1.0 |
|
American Studies |
1,300 |
1.3 |
300 |
0.3 |
|
Religious Studies |
2,500 |
2.5 |
1,800 |
1.8 |
|
Unspecified Other Humanities |
2,700 |
2.7 |
4,700 |
4.7 |
|
Nonhumanities‡ |
N/A |
N/A |
22,700 |
22.7 |
|
No Report on Employment Field‡ |
N/A |
N/A |
2,400 |
2.4 |
|
Not Employed‡ |
N/A |
N/A |
13,400 |
13.4 |
|
No Report on Employment Status‡ |
N/A |
N/A |
100 |
0.1 |
|
NOTE: Numbers are rounded to the nearest hundred; therefore, subcategories may not add to totals. *Includes postdoctoral appointees as well as doctorates employed full-time and part-time. See Appendix E for a listing of fields. †For some doctorates, the area of study within history was not known. Field of employment is not applicable in this subcategory. ‡Field of degree is not applicable. |
||||
Demographic Characteristics
Gender
Women comprised 32.9 percent of the U.S. population of humanities doctorates in 1991 (see Table 2). The fields of art history and modern languages and literature had the highest representation of females (55.1 and 47.2 percent, respectively), while females constituted only 16.4 percent of the doctorates in philosophy.
Racial/Ethnic Groups
The population of humanities doctorates was 91.7 percent white, 2.4 percent black, 3.3 percent Hispanic, and 2.0 percent other minorities. The highest percentage of blacks (4.3) was in American history, and 12.1 percent of the doctorates in modern languages and literature were of Hispanic origin.
Age in 1991
Slightly more than one-half (50.2 percent) of the total humanities population was aged 50 to 75 in 1991. Individuals in this age group comprised 67.6 and 60.7 percent, respectively, of speech/theater and “other history” doctorates. Music doctorates were generally younger; 60.1 percent were under 50 compared with 49.5 percent of humanities doctorates overall.
Year of Doctorate
Approximately 40 percent of all humanities doctorates in the population were earned in the 1970s. Music, which had the highest proportion of young doctorates, was among those fields with the highest proportion (48.6 percent) of doctorates granted in the 1980-1990 period. Other fields with high proportions of 1980-1990 doctorates were “other humanities” (53.5 percent) and art history (43.3 percent). On the other hand, only 22.5 percent of “other history” doctorates and 23.0 percent of speech/theater doctorates were held by 1980-1990 graduates.
Citizenship Status
Only 3.3 percent of humanists were foreign citizens, and the distribution across fields varied. Modern languages and literature had the highest percentage of foreign citizens (9.2 percent), while the fields of American history and speech/theater each had less than 1 percent. It should be noted that foreign-earned doctorates were not included in this survey; the foreign citizens tabulated here earned their doctoral degrees in the United States.
TABLE 2 Demographic Characteristics of Humanities Ph.D.s, by Field of Doctorate, 1991 (in percent)
|
Demographic Characteristics |
All Fields |
Amer Hist |
“Other Hist” |
Art Hist |
Music |
Speech/Theater |
Phil |
Engl/ Amer Lang/ Lit |
Class Lang/ Lit |
Modern Lang/ Lit |
“Other Hum” |
|
Total Population (No.) |
100,300 |
6,300 |
15,500 |
3,100 |
8,700 |
5,400 |
7,500 |
25,900 |
2,100 |
16,400 |
9,500 |
|
Gender |
|||||||||||
|
Male |
67.1 |
78.3 |
80.1 |
44.9 |
74.2 |
74.9 |
83.6 |
61.9 |
70.9 |
52.8 |
59.6 |
|
Female |
32.9 |
21.7 |
19.9 |
55.1 |
25.8 |
25.1 |
16.4 |
38.1 |
29.1 |
47.2 |
40.4 |
|
Racial/Ethnic Group |
|||||||||||
|
White |
91.7 |
94.1 |
93.3 |
93.4 |
93.0 |
95.0 |
92.4 |
95.1 |
96.3 |
82.7 |
88.8 |
|
Minority Group |
7.6 |
5.6 |
6.1 |
5.9 |
6.4 |
5.0 |
5.4 |
4.3 |
3.4 |
16.8 |
10.7 |
|
Hispanic |
3.3 |
0.8 |
2.3 |
2.4 |
2.0 |
1.2 |
1.3 |
1.1 |
1.2 |
12.1 |
2.0 |
|
Black |
2.4 |
4.3 |
1.7 |
0.3 |
3.2 |
2.8 |
2.0 |
2.0 |
1.6 |
2.3 |
3.7 |
|
Asian |
1.8 |
0.4 |
1.9 |
3.2 |
1.0 |
0.8 |
1.9 |
1.0 |
0.0 |
2.3 |
4.8 |
|
American Indian |
0.2 |
0.2 |
0.3 |
0.0 |
0.3 |
0.3 |
0.3 |
0.1 |
0.6 |
0.1 |
0.3 |
|
Other |
0.2 |
0.3 |
0.0 |
0.0 |
0.7 |
0.0 |
0.2 |
0.1 |
0.0 |
0.2 |
0.3 |
|
No Report |
0.5 |
0.0 |
0.6 |
0.7 |
0.0 |
0.0 |
2.1 |
0.5 |
0.3 |
0.3 |
0.3 |
|
Age In 1991 |
|||||||||||
|
Under 30 |
0.2 |
0.1 |
0.0 |
0.0 |
0.5 |
0.1 |
0.4 |
0.1 |
0.5 |
0.2 |
0.2 |
|
30-34 |
3.0 |
1.6 |
1.4 |
2.2 |
6.2 |
1.2 |
4.6 |
2.8 |
4.4 |
3.0 |
4.3 |
|
35-39 |
9.7 |
9.4 |
7.0 |
11.7 |
15.6 |
7.1 |
12.1 |
8.5 |
8.0 |
9.0 |
12.6 |
|
40-49 |
36.6 |
46.0 |
30.4 |
43.0 |
37.8 |
23.7 |
39.2 |
35.5 |
32.0 |
35.6 |
48.6 |
|
50-59 |
29.5 |
35.6 |
30.8 |
25.4 |
22.4 |
32.7 |
24.6 |
31.7 |
35.0 |
30.5 |
24.1 |
|
60-75 |
20.7 |
7.4 |
29.9 |
17.6 |
17.4 |
34.9 |
18.8 |
20.9 |
19.6 |
21.5 |
10.0 |
|
No Report |
0.3 |
0.0 |
0.4 |
0.0 |
0.1 |
0.3 |
0.3 |
0.5 |
0.6 |
0.2 |
0.3 |
|
Year of Doctorate |
|||||||||||
|
1942-49 |
0.7 |
0.0 |
1.0 |
0.0 |
0.7 |
0.2 |
1.3 |
0.9 |
1.1 |
0.7 |
0.1 |
|
1950-59 |
6.9 |
0.0 |
13.5 |
3.8 |
3.5 |
11.5 |
8.1 |
7.1 |
8.7 |
5.6 |
2.2 |
|
1960-69 |
19.0 |
11.0 |
27.6 |
16.0 |
9.9 |
35.5 |
18.5 |
20.9 |
28.2 |
16.8 |
6.7 |
|
1970-79 |
40.3 |
55.1 |
35.3 |
37.0 |
37.3 |
29.8 |
42.7 |
42.3 |
35.9 |
42.8 |
37.5 |
|
1980-90* |
33.2 |
33.9 |
22.5 |
43.3 |
48.6 |
23.0 |
29.4 |
28.8 |
26.1 |
34.1 |
53.5 |
|
Citizenship |
|||||||||||
|
U.S. |
96.6 |
99.3 |
97.8 |
97.2 |
97.9 |
99.1 |
97.4 |
98.1 |
96.7 |
90.8 |
95.7 |
|
Foreign |
3.3 |
0.7 |
2.2 |
2.8 |
2.1 |
0.9 |
2.4 |
1.7 |
3.3 |
9.2 |
4.3 |
|
NOTE: Numbers are rounded to the nearest hundred; therefore, subcategories may not add to total. *Excludes Ph.D.s awarded from July 1990 to December 1990. |
|||||||||||


