4
Motor Vehicles As a Source of Ozone Precursors
The primary regulated emissions from gasoline-fueled automobiles and trucks—volatile organic compounds (VOCs), nitrogen oxides (NOx), and carbon monoxide (CO)—all contribute to the formation of ground-level ozone. Moreover, these mobile sources distribute ozone precursors more broadly than stationary sources. This chapter reviews motor-vehicle emissions from light-duty vehicles (LDVs) and, in particular, those vehicles fueled by gasoline (LDGVs). It focuses on the regulation of these emissions and the historical effect they appear to have had on emission inventories and air-quality trends. Deviations of actual emissions from levels set by regulatory intent to control them and the probable reasons for such deviations are then reviewed.
Light-Duty Vehicular Emissions by Sources and Regulation
Vehicular-Emissions Sources
Gasoline-fueled automobiles and light trucks (which include certain vans and sport utility vehicles) are important sources of VOCs, NOx, and CO. VOCs that arise from engine combustion exhaust include many different
species, some of which were not present in the original fuel but were created in the combustion reaction and leave the tailpipe without being fully oxidized. Evaporative VOC emissions, on the other hand, result from vapor escaping the fuel storage and transfer system, as well as from fuel leakage, and are thus independent of combustion. NOx and CO emissions are generated during the combustion process and these only occur in the exhaust.
Tailpipe emissions of VOCs, CO, and NOx are measured for emissions certification by means of the Federal Test Procedure (FTP), during which a test vehicle is driven on a chassis dynamometer over a prescribed driving schedule. The car is first stored with the engine off ("soaked") at room temperature for at least 12 hr. Then it is started with a cold engine, run over an 18-cycle urban-like driving pattern, stopped for a 10-min hot soak, restarted, and rerun over the first 5 of those 18 cycles. This 18-cycle driving pattern, known as the LA-4 schedule, was developed in the late 1960s to represent a commute to work in the typical Los Angeles traffic of the time. Following some minor modification, it became the basis of the federal U.S. Environmental Protection Agency (EPA)-mandated certification testing procedure for LDVs in 1975 (and is therefore also called the FTP75).
As illustrated in Figure 4-1, the entire LA-4 schedule covers 7.45 miles (mi) at an average speed of 19.6 miles per hour (mph). After adding the 5 repeat cycles following the hot soak, the entire FTP urban driving schedule covers 11.1 miles of driving in 31 mill, excluding the 10-min hot soak.
During the FTP, tailpipe exhaust is collected in three bags: the so-called cold bag for the first 5 cycles of driving, the stabilized bag for the next 13, and the hot bag for the 5 repeat cycles following the hot soak. For regulatory purposes, the measured mass emissions from each bag are substituted in a prescribed equation to determine the emission rate per unit of travel (in this case, grams per mile) of each regulated emission.
Evaporative emissions, including those resulting from leaks of liquid fuel, are measured separately using a variable-temperature SHED (sealed-housing-for-evaporative-determination) facility; i.e., an instrumented temperature-controlled room in which the test vehicle is housed. The fuel system of each car includes an evaporative canister containing a bed of activated carbon particles that adsorb most of the fuel vapor that might otherwise escape to the environment. The canister is connected to both the fuel-tank headspace and the engine intake. During
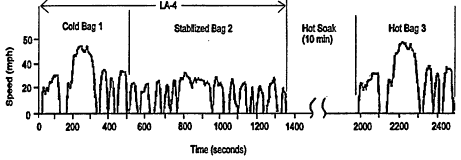
Figure 4-1
The Federal Test Procedure urban driving schedule covers 11.1 miles of driving in 31 min, excluding the 10-min hot soak.
Source: Adapted from Davis 1998.
normal engine operation, stored VOC vapor is purged from the canister, drawn into the engine by intake-manifold vacuum, and consumed in combustion. However, the system is not 100% effective. Escape routes for evaporative gases include the engine intake and vents in the fuel tank as well as the canister itself.
Evaporative emissions, including those resulting from leaks of liquid fuel, can be classified into five categories: diurnal, hot soak, running loss, resting loss, and refueling loss.1 The characteristics and causes for each of these emissions are described briefly below. Originally, only diurnal evaporative emissions were regulated. In more recent years, hot-soak emissions were added to the diurnal emissions for regulatory purposes, with a separate limit being placed on the running loss. The first refueling-loss standard began With a 3-year phase-in period on passenger cars in 1998. These emissions are controlled by an on-board refueling vapor canister.
Diurnal emissions occur because the fuel tank of a parked car "inhales" air at night as the tank cools, then "exhales' a mixture of air and fuel vapor during the day as tank temperature rises. Diurnal emissions
tend to increase linearly with available tank headspace, and are also very sensitive to tank temperatures and fuel volatility.
Hot-soak emissions occur after vehicle operation has been terminated. These emissions are measured over a 1-hr period after the vehicle has completed a prescribed driving schedule. Hot-soak emissions from a given vehicle depend on the previous driving schedule, ambient conditions, and fuel volatility.
Running-loss emissions occur as the tank is heated during vehicular operation and can result from the following:
- Inefficiency of the in-tank fuel pump and motor.
- Recirculation to the tank (in some vehicles) of excess fuel supplied to the port fuel injectors.
- External heat from the nearby exhaust system.
- External heat from the air flowing under the car from the engine compartment.
Vapor generated during vehicle operation is directed to the canister for transfer to the engine, where it is consumed. The line from the canister to the engine contains a valve that regulates that purge flow. However, when the quantity of vapor, thus generated, exceeds the ability of the engine to consume it and the canister has reached its storage capacity, the excess vapor escapes through the canister vent as "breakthrough" emissions and constitutes the running loss. Thus running-loss emissions depend on the driving schedule, ambient conditions, fuel volatility, type of vehicle, and condition of the control system.
Resting-loss emissions include escape of fuel vapor by means of permeation of nonmetallic components of the fuel system while the vehicle is inoperative. Resting-loss emissions depend on fuel characteristics and design features of the fuel system.
Refueling emissions consist of the fuel vapor displaced from the tank headspace by the new liquid fuel being pumped into the tank. Typically, these vapors are stored in the same canister used to control the other categories of evaporative emissions. Refueling emissions occur when these vapors escape, and depend on the volume of fuel pumped and on the respective temperatures and compositions of the fuel remaining in the tank and the pumped fuel.
Control Standards for These Sources
Since their inception, emissions standards have been progressively tightened. The trend toward greater stringency in tailpipe and diurnal evaporative controls through 1993 is tabulated separately for federal and California standards in Table 4-1. These standards were to be satisfied through 50,000 miles of driving; consequently, to ensure compliance, manufacturers calibrated new car emissions levels to be substantially below the specified 50,000-mile level.
Standards in effect from 1993 onward are listed in Table 4-2. Standards are defined for both 50,000- and 100,000-mile compliance. The standards for high mileage accrual are intended to preclude excessive emissions as accumulated service surpasses 50,000 miles. As shown, California has defined a family of low-emissions vehicles: the transitional low-emissions vehicle (TLEV), the low-emissions vehicle (LEV), and the ultra-low-emissions vehicle (ULEV). Not shown is the zero-emissions vehicle (ZEV), which has no tailpipe emissions. The only vehicle currently qualifying as a ZEV is a dedicated electric car or light truck. (However, even in this case, use of the vehicle does in fact result in ozone precursor emissions whenever fossil fuels are burned to generate the electricity required for battery charging.) California allows manufacturers to mix conventional vehicles and members of the low-emissions family, within certain constraints, in a manner that forces a gradual reduction in fleet-average emissions in successive years.
At 50,000 miles, the federal Tier I standards now in place entail reductions in combined tailpipe and crankcase emissions, from the average pre-control car, of 98%, 96%, and 90% for NMHC, CO, and NO x, respectively. For the California ULEV, these reductions increase, respectively, to 99+%, 98%, and 95%.
Major manufacturers have volunteered to build cars to national low-emissions vehicle (NLEV) specifications having NMHC, CO and NOx standards equal to those of the California LEV in Table 4-2, making them available in the Northeast in 1999 and nationwide in 2001. The 70% reduction in tailpipe NMHC and the 50% reduction in NOx with the NLEV, compared with Tier 1 vehicles, pursue a national improvement in air quality earlier than had been anticipated by regulatory schedules. In addition, manufacturers are moving voluntarily to produce light trucks
TABLE 4-1 Emissions Standards for Automobiles (allowable emission levels up through 50,000 miles of driving)
|
|
Federal |
California |
||||||||||
|
Model year |
HC (g/mi) |
CO (g/mi) |
NOx (g/mi) |
PMa (g/test) |
Evap (g/mi) |
HC (g/mi) |
NMHCa (g/mi) |
CO (g/mi) |
NOx (g/mi) |
PMa (g/mi) |
Evap (g/test) |
HCHOa (g/mi) |
|
Pre-control |
14.7b |
84.0 |
4.1 |
|
47 |
14.7b |
|
84.0 |
4.1 |
|
47 |
|
|
1966 |
|
|
|
|
|
6.3 |
|
51.0 |
(6.0)c |
|
|
|
|
1968 |
6.3 |
51.0 |
(6.0)c |
|
|
6.3 |
|
51.0 |
|
|
|
|
|
1970 |
4.1 |
34.0 |
|
|
|
4.1 |
|
34.0 |
|
|
6 |
|
|
1971 |
4.1 |
34.0 |
|
|
|
4.1 |
|
34.0 |
4.0 |
|
6 |
|
|
1972 |
3.0 |
28.0 |
|
|
|
2.9 |
|
34.0 |
3.0 |
|
2 |
|
|
1973 |
3.0 |
28.0 |
3.0 |
|
|
2.9 |
|
34.0 |
3.0 |
|
2 |
|
|
1974 |
3.0 |
28.0 |
3.0 |
|
|
2.9 |
|
34.0 |
2.0 |
|
2 |
|
|
1975 |
1.5 |
15.0 |
3.1d |
|
2 |
0.9 |
|
9.0 |
2.0 |
|
2 |
|
|
1977 |
1.5 |
15.0 |
2.0 |
|
2 |
0.41 |
|
9.0 |
1.5 |
|
2 |
|
|
1978 |
1.5 |
15.0 |
2.0 |
|
6d |
0.41 |
|
9.0 |
1.5 |
|
6d |
|
|
1980 |
0.41 |
7.0 |
2.0 |
|
6 |
|
0.39 |
9.0 |
1.0 |
|
2 |
|
|
1981 |
0.41 |
3.4 |
1.0 |
|
2 |
|
0.39 |
7.0 |
0.7 |
|
2 |
|
|
1982 |
0.41 |
3.4 |
1.0 |
0.60 |
2 |
|
0.39 |
7.0 |
0.7 |
|
2 |
|
|
1983 |
0.41 |
3.4 |
1.0 |
0.60 |
2 |
|
0.39 |
7.0 |
0.4 |
|
2 |
|
|
1984 |
0.41 |
3.4 |
1.0 |
0.60 |
2 |
|
0.39 |
7.0 |
0.4 |
0.60 |
2 |
|
|
1985 |
0.41 |
3.4 |
1.0 |
0.60 |
2 |
|
0.39 |
7.0 |
0.4 |
0.40 |
2 |
|
|
|
Federal |
California |
||||||||||
|
Model year |
HC (g/mi) |
CO (g/mi) |
NOx (g/mi) |
PMa (g/test) |
Evap (g/mi) |
HC (g/mi) |
NMHCa (g/mi) |
CO (g/mi) |
NOx (g/mi) |
PMa (g/mi) |
Evap (g/test) |
HCHOa (g/mi) |
|
1986 |
0.41 |
3.4 |
1.0 |
0.60 |
2 |
|
0.39 |
7.0 |
0.4 |
0.20 |
2 |
|
|
1987 |
0.41 |
3.4 |
1.0 |
0.20 |
2 |
|
0.39 |
7.0 |
0.4 |
0.20 |
2 |
|
|
1989 |
0.41 |
3.4 |
1.0 |
0.20 |
2 |
|
0.39 |
7.0 |
0.4 |
0.08 |
2 |
|
|
1993 |
0.41 |
3.4 |
1.0 |
0.20 |
2 |
|
0.39 |
7.0 |
0.4 |
0.08 |
2 |
0.015 |
|
a Particulate matter, applicable to diesel cars only; NMHC = nonmethane hydrocarbons; HCHO = formaldehyde. b Includes 4.1 g/ml of crankcase emissions, fully controlled by 1966. c Uncontrolled NOx increased as HC and NOx standards were implemented. d Change in test procedure. NOTE: Empty cells indicate no standards in place for those years. Source: Adapted from Calvert et al. 1993. |
||||||||||||
and vans, rated above the maximum weight range covered by the federal standards of Table 4-2, in a manner that will enable these vehicles to be certified to the more stringent passenger-car standards. This should have a substantial air-quality benefit because these heavier vehicles accounted for nearly half of new-vehicle sales m the general public in 1998.
Magnitudes and Trends of Light-Duty Vehicular Emissions
To gauge the potential air-quality benefit from the use of reformulated gasolines, in general, and specific oxygenates within these gasolines, it is useful to review the magnitudes and trends in the emissions of VOC, CO, and NOx from motor vehicles and other sources The 55-year trends illustrated in Figures 4-2, 4-3, and 4-4 for VOC, NOx, and CO, respec
TABLE 4-2 Automobile Emissions Standards, Tier I and Beyond (standards for 50,000 miles or 5 years (100,000 miles or 10 years))
|
Federal |
|||||
|
|
NMHC (g/mi) |
NMOGa (g/mi) |
CO (g/mi) |
NOx (g/mi) |
HCHO (g/mi) |
|
Tier I (1994) |
0.25 |
|
3.4 |
0.4 |
|
|
(0.31) |
|
(4.2) |
(0.6) |
|
|
|
Tier II (2003) |
(0.125) |
|
(1.7) |
(0.2) |
|
|
California |
|||||
|
Conventional vehicles (1993)b |
|
0.25 |
3.4 |
0.4 |
0.015 |
|
|
(0.31) |
(4.2) |
(0.6) |
(0.018) |
|
|
TLEVs (starting in 1994)b |
|
0.125 |
3.4 |
0.2 |
0.015 |
|
|
(0.156) |
(4.2) |
(0.3) |
(0.018) |
|
|
LEVs (starting in 1997)b |
|
0.075 |
3.4 |
0.2 |
0.015 |
|
|
(0.09) |
(4.2) |
(0.3) |
(0.018) |
|
|
ULEVs (starting in 1997)b |
|
0.04 |
1.7 |
0.2 |
0.008 |
|
|
(0.055) |
(2.1) |
(0.3) |
(0.011) |
|
|
a NMOG = nonmethane organic gases (NMHC + oxygenated HC). b Measured NMOG adjusted for reactivity, relative to conventional gasoline. Source: Adapted from Calvert et al. 1993. |
|||||
tively, are based On inventory estimates compiled by EPA. In viewing these inventories, it should be noted that large uncertainties are typically associated with emission inventories, especially those arising from motor vehicles. Historically, it has been found that the contribution of emissions from mobile sources had been underestimated, and each time new information and data became available, these emissions had to be revised upward (NRC 1991). Moreover, the accuracy of contemporary mobile source emission inventories remains the subject of some debate (Sawyer et al. 1998).
From Figure 4-2, it can be seen that the contribution to anthropogenic VOCs from highway vehicles appears to have peaked around 1970. By 1995, this share had declined to 28% of the anthropogenic total, by which time industrial processes were estimated to account for 47% of
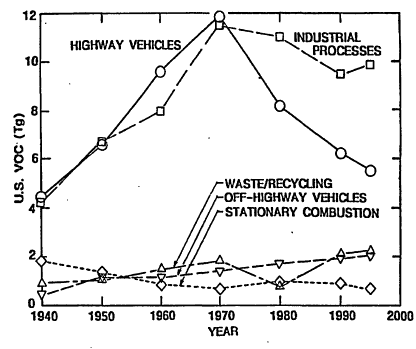
Figure 4-2
Estimated trends in VOC emissions from various types of sources in the United States. Emissions are presented in units of teragrams (Tg). 1 Tg=106 metric tons. The contribution from "Highway Vehicles" includes LDVs, the automobiles and light trucks that are the subject of this study, and heavy-duty vehicles (HDVs), larger trucks and buses. Source: Adapted from Davis 1997.
anthropogenic VOCs. The remainder was attributable primarily to waste disposal and recycling (5%), off-highway vehicles (12%), and stationary fuel combustion (5%).
In the case of NOx emissions, Figure 4-3 indicates that highway vehicles accounted for about 31% of all anthropogenic NOx in 1995. Approximately 70% of this came from LDVs, which are powered primarily by gasoline engines, with the balance produced by HDVs, which are primarily diesel-powered. In 1995, stationary combustion accounted for 45% of anthropogenic NOx, 20% came from nonhighway vehicles, 3% was attributable to industrial processes, and the balance came from miscellaneous sources.
Figure 4-4 indicates that highway vehicles have long dominated national CO sources. In 1995, they were responsible for 60% of the CO total. Adding in off-highway (off-road) transportation sources, the entire transportation sector was responsible for about 80% of the national CO emissions that year.
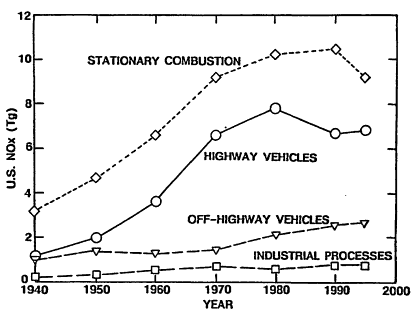
Figure 4-3
Estimated trends in NOx emissions from various types of sources in the United States. Emissions are presented in units of teragrams (Tg). 1 Tg = 106 metric tons. The contribution from "Highway Vehicles" includes LDVs, the automobiles and light trucks that are the subject of this study, and heavy-duty vehicles (HDVs), larger trucks and buses.
Source: Adapted from Davis 1997.
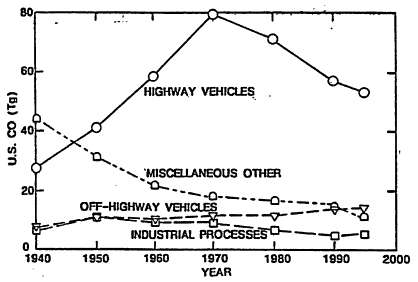
Figure 4-4
Estimated trends in carbon monoxide (CO) emissions from various types of sources in the United States. Emissions are presented in units of teragrams (Tg). 1 Tg = 106 metric tons. The contribution from "Highway Vehicles" includes LDVs, the automobiles and light trucks that are the subject of this study, and heavy-duty vehicles (HDVs), larger trucks and buses.
Source: Adapted from Davis 1997.
Comparison of the national inventory estimates with inventory estimates for California developed by the California Air Resources Board (CARB) reveals some substantial differences. For example, CARB estimates that, in 1995, 25% of its statewide emissions of VOC (total organic gas emissions), 44% of its reactive organic gas (ROG) emissions, and 60% of its NOx emissions were from on-road vehicles (http://www.arb.ca.gov/ceidars/emssumcat.submit_form). (VOCs include non-reactive organic compounds that are not included within the ROG category and hence emissions of VOCs are greater than those of ROGs.) In contrast, the federal inventory for 1995 ascribes 28% of VOC emissions and 31% of NOx emissions to on-road vehicles (Davis 1998). The differences in the on-road-vehicle contribution (especially for NOx) in the two inventories are most likely indicative of the unique characteristics of California as compared to the rest of the nation. However, the possibility that they also arise, at least in part, from inaccuracies in one or both inventories cannot be ruled out.
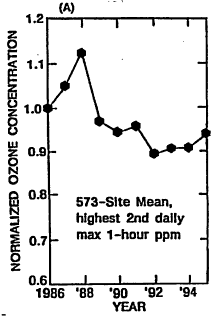
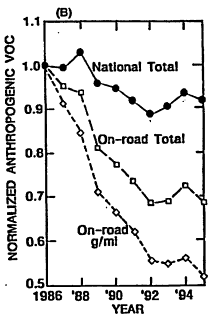
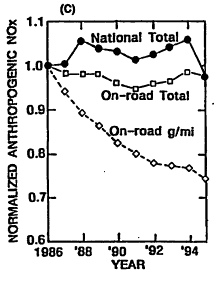
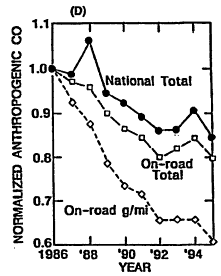
Given the historical trends in ozone precursor emissions, it is interesting also to review what the corresponding achievements have been in ozone reduction. National air quality and emissions have been reviewed for the period from 1986 to 1995 (EPA 1996a). In Figure 4-5A, the arithmetic mean ozone concentration from 573 measuring sites (normalized using the mean for 1986) is plotted versus year. This trend is compared with the normalized trends in national emissions of VOCs, NOx, and CO over the same period in Figures 4-5B, 4-5C, and 4-5D, respectively. The substantial year-to-year variability in the ozone trace reflects annual variations in meteorology. For example, before 1996, 1988 was the third hottest year of the century, and temperatures were also high in 1995. Because high ambient temperature is conducive to ozone formation, it is not surprising that ozone levels were, on average, higher in those years. EPA endeavored to correct these annual data for variations in meteorology and concluded that average ozone is decreasing about 1% per year. Additional discussion of variability in ozone trends is contained in Chapter 6 of this report. Over the same period, national anthropogenic emissions of VOCs, NOx, and CO are estimated to have decreased by about 9%, 2% and 16%, respectively, with emissions attributed to on-road vehicles decreasing by about 31%, 2%, and 20%, respectively. Over this same period, vehicle miles traveled (VMT) by on-road vehicles increased 32%, so that the actual reductions in vehicular emissions of all precursors in units of g/mi were quite substantial (as would be expected from the data in Table 4-1).
Relating the national trend in ozone to the trends in precursor emissions is problematic because of such important influences as variations in precursor reactivity, nonuniformity in the geographical distribution of precursors, and meteorological effects. Nevertheless, the data clearly reflect improvement in air quality over the decade that is likely attributable at least in part to: (1) the advent of more stringent standards for vehicles that gradually replace old vehicles built to more lenient emissions standards than current models; (2) maturation of new-vehicle emissions control hardware and software as field experience accumulated; and (3) recent improvements in gasoline properties. The air-quality improvement is reported despite the increase in VMT, and an increasing preference among consumers for light trucks and vans that emit more precursors.
It is also apparent that during this period, the contribution of LDVs to ground-level ozone pollution has decreased substantially. According to
EPA, the contribution of on-road vehicles to VOC and NOx emissions has decreased by about 30% and 3%, respectively. One consequence of this decreasing contribution is that ozone mitigation strategies based on further reductions in motor-vehicle emissions such as that of the reformulated gasoline programs must necessarily also have a reduced potential to improve air quality. For example, if ozone concentrations responded linearly to a reduction in VOC concentrations, a reduction of 20% in VOC emissions from a reformulated gasoline program might decrease ozone by only about 6%, given that on-road vehicles are currently responsible for about 30% of the total emissions. Even if the contribution of VOC emissions has been underestimated by a factor of 2, the ozone reduction would only be a little more than 10%. In reality, the ozone reduction would be significantly smaller since the response of ozone concentrations to VOC reductions are generally less than linear. As discussed in more detail in Chapter 6, this shrinking contribution to ozone precursors from gasoline-powered motor vehicles makes it very difficult to discern the impact of reformulated gasoline on ambient ozone concentrations, let alone distinguish between the effects of different reformulated gasoline blends. This, however, should not be interpreted to mean that emissions controls on LDVs are not important. Clearly they are; it is just that discerning incremental benefits becomes increasingly difficult as the relative contribution of LDV emissions decreases.
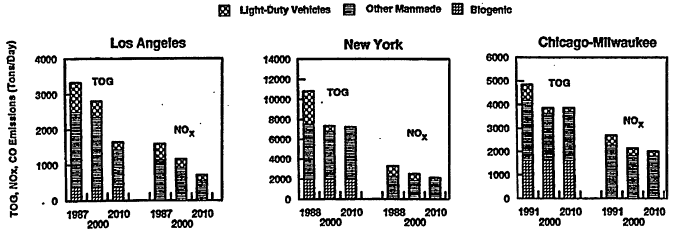
It is also relevant to note that the contribution from motor vehicles might very likely continue to shrink. For example, Figure 4-6 illustrates the estimated and projected emissions for VOCs (shown as TOGs) and NOx in Los Angeles, New York, and the Chicago-Milwaukee region for 1988, 2000, and 2010 by the Auto/Oil study (AQIRP 1997a). In these projections, use of conventional gasoline (representing a 1988 national average composition) was assumed for the base year and use of various reformulated gasoline blends were assumed for future years. "Other manmade" sources include diverse sources such as power lawn mowers, earth-moving equipment, surface coatings, and solvents and cooking and baking activities. Substantial reductions in LDV emissions were projected for each city. From the base year to 2010, decreases in the LDV emissions were estimated to be from 74% to 92% for VOCs and 54% to 69% for NOx, depending on the city. At the time when this modeling was performed, the large reduction estimated for LDV emissions anticipated benefits from replacement of older vehicles, lower vehicle emission standards, on-board diagnostics, reduced gasoline vapor pressure, refor-
mulated gasoline, and more stringent inspections and maintenance programs. CARB has also projected large reductions in emissions from on-road mobile sources (which include HDVs). For example, these sources are expected to lower their share of statewide ROG emissions from 44% in 1995 to 18% in 2010 (http://www.arb.ca.gov/emisinv/emsmain/emsmain.htm). If those projections turn out to be accurate, the probable impact from subtle changes in RFG blends will be buyer reduced. However, it should be noted in this regard that projections of future mobile source emissions depend upon assumptions concerning trends in technology, economics, and human behavior and, as a result, are highly uncertain.
Influence of Driving Patterns on Emissions Variability
As discussed above, regulation of LDV exhaust emissions is based on the FTP which is, in turn, built around the LA-4 driving schedule. There is, however, growing concern that this driving schedule is not able to characterize accurately emissions from LDVs under normal driving conditions (Darlington et al. 1992; Kelly and Groblicki 1992). Three potentially important sources of error are discussed below: off-cycle transient events, underrepresented events, and variable events.
Off-Cycle Transient Events
When the LA-4 driving schedule was first devised, the ability of existing chassis dynamometers to accommodate high vehicular accelerations was limited. Consequently, accelerations on the schedule were arbitrarily restricted to a maximum of 3.3 mph/sec. However, data from instrumented cars in typical traffic have shown peak accelerations as high as 15 mph/sec at 20 mph, with somewhat lower rates at higher speeds but all in excess of 3.3 mph/sec (Ross et al. 1995). This raises the possibility that the FTP misses important aspects of typical driving that could result in undetected, increased off-cycle emissions of VOCs, CO, and NOx (see Text Box 4-1). On the other hand, analysis of in-use survey data indicates that driving at an air-to-fuel ratio of 12% richer than stoichiometric occurs only about 1% to 2% of the time (Ross et al. 1995),
|
TEXT BOX 4-1 Power Enrichment Can Affect Exhaust Emissions Warmed-up, conventional gasoline engines are now calibrated to operate under most circumstances at or very near the stoichiometric air-to-fuel ratio to accommodate the three-way catalytic converter. At this ratio (about 14.7:1 for gasoline), a fuel is combusted nearly completely With almost no air appearing unutilized in the combustion products. However, as the throttle is gradually opened to provide more than about 75% of the maximum available at any given speed, the mixture is gradually enriched from the stoichiometric to a lower air-to-fuel ratio for a number of reasons. First, theoretically, the engine is capable of producing about 5% more power when the mixture is enriched about 10% beyond the stoichiometric ratio. As vehicular performance potential is determined by maximum power, this degree of enrichment allows about a 5% reduction in piston displacement for the same performance potential, making it possible to meet performance criteria With a smaller engine with better fuel economy. Second, for a given air-to-fuel ratio, the exhaust gas temperature is highest at full throttle. When the average full-throttle mixture is set at the stoichiometric ratio, there is always a small amount of oxygen in the exhaust stream, ideal chemistry notwithstanding. Should one cylinder experience an instance of poor combustion, raw fuel, oxygen, and a high exhaust temperature can co-exist in the catalytic converter. This invites a significant upward excursion in catalyst temperature that can hasten deterioration, and, in severe cases, even lead to destruction of the catalyst. To prevent this from occurring, the mixture is enriched. Third, to suppress combustion knock (see Chapter 5), some engines are calibrated even richer than the maximum-power ratio at full throttle. This allows use Of a higher compression ratio for better fuel economy at part load, at which the engine operates most of the time. With respect to emissions, as an engine approaches full throttle, power enrichment significantly decreases engine-out NOx. However, vehicular tests have shown that the catalytic Converter can pass an increasing fraction of this raw NOx as the mixture is enriched (Ross et al. 1995). This catalyst behavior might be the result of insufficient exhaust residence time in the converter at high engine-flow rates. Power enrichment at high loads also substantially increases engine-out CO and VOCs just as the rich mixture is depriving the catalytic converter of enough oxygen to destroy those emissions. |
suggesting that power enrichment might not make a major contribution to LDV emissions resulting from typical driving. Nevertheless, the Clean Air Act Amendments of 1990 directed EPA to devise a Supplemental FTP (SFTP) to assess some of the real-world emissions not properly addressed in the LA-4 schedule. It is intended to add a more aggressive driving pattern, a change made possible by improvements to chassis dynamometers since the 1960s.
As defined by the EPA rule of October 1996 (EPA 1996b), beginning with vehicular certifications for model year 2000 (MY2000) and phasing to 100% application for MY2002 (MY2004 for larger light trucks), driving schedule US06, illustrated in Figure 4-7, will be run immediately following the current FTP to contribute exhaust to a fourth collection bag. Emissions from this bag will be weighted in a calculation together with those from the first three to arrive at the exhaust certification emission rate (grams per mile). An improved correction test for air-conditioning load, called the SC03, will also be conducted. The SFTP is expected to lead to more realistic control of emissions in real-world driving.
Underrepresented Events
The warm-up time for emissions-control components, especially for catalysts, varies across makes and models of vehicles. Because those components do not operate at peak efficiency during warm-up, emissions can be unusually high for a brief period every time a vehicle is cold-starred or restarted. Other factors remaining equal, the magnitude and duration of this excursion in a given vehicle depend on ambient temperature and the length of time the engine has been shut down. Multipurpose, chained trips involving at least one intermediate stop of 15 min or less, such as from home to a series of retail establishments, to school, and to a final destination, are now recognized as becoming increasingly common, accounting for perhaps as many as half of the total trips (FHWA 1997). For this reason, the extra emissions associated with a chain of short trips are a growing concern.
The current FTP includes one cold start and, after a 10-rain soak with the engine off, one hot restart over 11.1 miles. It does not directly incorporate any hot soaks, but those soaks can be an important contributor to total emissions in chain driving. For regulatory purposes, hot-soak
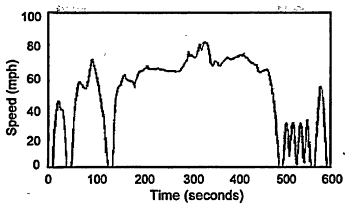
Figure 4-7
Driving schedule US06 test procedure to be used immediately after the Federal Test Procedure to contribute exhaust to a fourth collection bag.
Source: EPA 1996b.
emissions are currently measured separately as part of SHED testing (for which the standard is based on a maximum total mass of evaporative VOCs) and thus are not integrated with tailpipe emissions. Hot soaks and other important aspects of modem driving practices might currently be misrepresented in the overall certification procedure.
Other sources of evaporative emissions are affected by in-use driving activities. The major source of unburned hydrocarbons in the fuel storage and supply system of a fuel-injected vehicle is the fuel-tank vapor space. The rate at which tank vapors are collected and purged by the evaporative emissions-control canister (as part of the running losses) tends to be a function of both driving pattern and engine-on time. For example, high purge rates are generally associated with high constant-speed driving, whereas low rates tend to accompany lower-speed driving with more frequent stops (Kishan et al. 1993).
A departure from FTP conditions that occurs in real driving is the existence of highway slopes, or grades. A U.S. Department of Transportation survey concluded that 10% of nationwide driving occurred up grades of 0.5% to 1.0%, 12% up 1% to 3% grades, 7% up 3% to 5% grades, and 3% up grades of over 5% (EPA 1980). Driving uphill increases the power requirement of the vehicle by an amount proportional to the grade and the speed of the vehicle. Depending on engine displacement and calibration, the need for extra power can lead to fuel enrichment. In general, the lower the power-to-weight ratio of the vehicle, the
more likely it is to encounter power enrichment on upgrades. It is improper to focus exclusively on the increased emissions that accompany increased fuel flow when traveling uphill. A vehicle driven uphill must eventually travel downhill. Although the mass emissions may be lowered as the fuel flow is decreased on a downgrade, the extra emissions that were produced on the upgrade are not exactly canceled by an equivalent reduction in emissions on the downgrade.
Variable Events
A factor of growing significance that affects emissions is increasing urban traffic congestion. During peak hours in some cities, expressways built for high speed resemble parking lots full of vehicles with all their engines idling. Because of the low fuel rate during idling, it has been concluded that excess emissions from idling due to traffic congestion are relatively low in a properly functioning vehicle (Ross et al. 1995). On the other hand, the phenomenon frequently observed on urban freeways of alternating between hard acceleration as congestion diminishes and braking to a stop at the back of a queue results in more fuel consumption and emissions than if the same distance were covered at a constant speed. Improved traffic management schemes, including variable message signing and increased highway automation, are expected eventually to improve this situation by smoothing traffic flow, but the implementation of such systems will be gradual. Meanwhile, the differences in power demand and the random distribution of individual vehicles operating in these "sawtooth" driving conditions render estimation of their aggregate emissions very uncertain.
Irrespective of the habits of individual drivers, highway conditions collectively give rise to important departures from driving norms. Recurrent congestion results in trips of longer duration and, concomitantly, more aggregate engine-on time than would be the case in the absence of excessive traffic. This in turn can lead, for example, to higher fuel-tank heating, with increases in the temperature of the fuel itself. Even in properly functioning vehicles, this might contribute to high running-loss emissions (Kishan et al. 1993). In late-model vehicles, the tank-heating problem is being addressed by eliminating the practice of recirculating hot, unused fuel from the injectors back to the tank.
Another variable environmental factor affecting power requirement is wind. The power expended in overcoming aerodynamic drag increases
as the cube of wind speed relative to the vehicle. A car driving 20 mph into a 20-mph head wind encounters 8 times the aerodynamic drag of that same car driving 20 mph in still air. As with grades, however, there is somewhat of a compensating effect when that same car has a 20-mph tail wind. In most urban driving, vehicular speed is low enough that the effect of wind on demand for total vehicular power, hence on fuel consumption and emissions, is much less than would be the case in highway driving.
Even in the absence of wind, the aerodynamic efficiency and performance of a vehicle can be negatively affected by loads such as a rooftop carrier, which adds drag as well as mass. Pulling a trailer adds rolling resistance, weight, and drag.
Yet another real-world consideration is the use of air-conditioning. On the present FTP, increasing the dynamometer load 10% simulates the use of an air conditioner. That this simple expedient cannot accurately reflect the influence of the air conditioner on power requirement, hence emissions, is obvious from the fact that when the car is stationary with the engine idling, 10% of the dynamometer load is zero. In a real car the air conditioner is extracting more than zero power from the engine while the vehicle is stationary. The SFTP air-conditioner load cycle is intended to correct this discrepancy.
Emissions Deterioration and Prospects for Detection
The engines propelling recently manufactured cars incorporate technologies unheard of when emissions regulation began. Electronically controlled port fuel injectors have replaced the carburetor of yesterday. An on-board computer has been incorporated into a closed-loop control system that oscillates the air-to-fuel ratio within a narrow window about the stoichiometric ratio. This ensures that a three-way catalyst maintains a high conversion efficiency for VOCs, CO and NOx concurrently, as illustrated in Figure 4-8. Typically, the on-board computer doses the mixture-ratio control loop using signals from an inlet airflow sensor, the fuel injectors, and an exhaust-gas oxygen sensor that indicates whether the air-to-fuel ratio is being maintained within the desired range. In addition, exhaust-gas recirculation (EGR) is employed to decrease the flame temperature for lower NOx emission.
During the cold start that initiates the FTP, the room-temperature
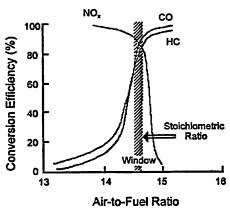
Figure 4-8
Illustration of the range of control efficiency for a three-way catalyst with respect to NOx, CO, and VOC emissions. Source: Adapted from Canale et al. 1978.
catalyst is ineffective, as illustrated in Figure 4-9. Similarly, the exhaust-gas oxygen sensor must undergo a warm-up period before it becomes functional, although that problem is now typically minimized by electrically heating the sensor during starting.
Unfortunately, the ineffectiveness of the cold catalyst coincides with the need for a rich air-to-fuel ratio to ensure engine starting, because the spark plug cannot ignite the air-to-fuel mixture unless the ratio of air to fuel vapor is within the flammability limits of the fuel. Because gasoline is a mixture of hydrocarbons with a range of volatilities and the low-volatility components do not vaporize in the cold-cylinder environment, extra fuel is needed to increase the quantity of high-volatility components present to ensure a combustible air-to-fuel ratio for starting.
A consequence of the simultaneous ineffectiveness of a catalytic converter not yet heated to its operating temperature and the need for a temporarily rich starting mixture is that, in recent low-emissions cars, as much as 80% of the FTP VOCs are emitted during the first 1 or 2 min after the cold start. Also, because of the high conversion efficiency of the warmed-up catalyst, tailpipe emissions are profoundly affected by excessive deterioration of catalyst efficiency as mileage is accumulated. A manufacturer makes allowance for reasonable deterioration by setting emissions performance targets for new cars at a level well below (more stringent than) the 50,000-mile standards.
Given the high conversion efficiency of the contemporary warmed-up
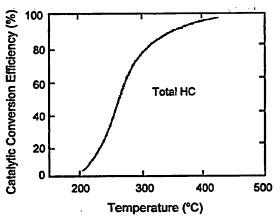
Figure 4-9
Relationships between catalytic conversion efficiency and catalyst temperature. At ambient temperature, the catalytic converter is ineffective. Source: Adapted from Heywood 1988.
catalyst, there is strong motivation to decrease emissions during the cold start by shortening catalyst warm-up time. Conserving heat by insulating the pipe or pipes connecting the engine to the catalytic converter is now common practice. Electrically heated catalysts have been tried, but their acceptance is hampered by concern about the increased drain on the car battery, an issue particularly worrisome in cold northern winter climates. A more popular trend is to use a second, or warm-up, converter located close to the exhaust manifold. This minimizes heat loss upstream of the catalyst. An additional converter might also be placed downstream of this warm-up converter.
Although new cars are designed to meet applicable emissions standards over their useful life, there is a continuing need to verify that vehicles in the hands of the public are satisfying this objective. Many tests conducted to monitor the emissions from such vehicles indicate that an unsatisfactorily high proportion of them fail to meet expectations in use (Calvert et al. 1993).
On new vehicles, EPA and CARB use a selective enforcement audit to spot check emissions performance of manufactured vehicles at the end of the assembly line. Though manufacturers might perform voluntary quality assurance checks, provisions of 40 CFR 86.603-88(e) statutorily limit EPA to auditing no more than one in every 300,000 of each manufacturer's model-year production destined for the U.S. market, with
thresholds in the audit count set at 150,000 units. Therefore, at a production level of 450,000 units, there is a transition from one to two audits; at 750,000 units, from two to three audits, and so forth. For those manufacturers producing fewer than 150,000 vehicles for the U.S. market, the annual audit limit is one.
However, if there is evidence of noncompliance with standards, the EPA administrator can issue additional test orders. If the emissions failure rate of new vehicles coming off an assembly line is excessive, the line can be shut down until the problem is fixed. The manufacturer also must recall and repair any such vehicles already produced.
Vehicles already in use are subject w an after-market, in-use test. Each year, EPA and CARB select some engine families and ask a number of owners of vehicles with those engines to submit their vehicles for testing. These vehicles typically have accumulated 30,000 to 50,000 miles of customer service. An excessive failure rate can trigger a recall. This approach has been criticized because it is voluntary. The regulatory agencies cannot force an invited owner to participate, thus imposing an unintended bias on the test sample. Also, from the sample recruited, only properly maintained vehicles are tested.
Inspection and Maintenance (I&M) programs have been instituted in states required to comply with mobile-source air-quality attainment provisions of the Clean Air Act. The object of such programs is to identify LDVs that are significantly out of compliance and have them repaired as a requirement for continued licensing. Previously, this technique was able to identify two common causes of malfunction in control systems: misfueling and tampering. Misfueling a catalyst-equipped car with leaded gasoline led to poisoning of the catalytic converter. With the removal of leaded gasoline from the market (see Chapter 5), this problem has been eliminated. In the 1970s, drivers sometimes tampered with their vehicles by rendering parts of their emissions-control systems nonfunctional in the belief that it would improve driveability or fuel economy. Disconnecting a hose to deactivate the EGR system (an NOx control technique) was an example. The modem control system is so complex and sophisticated that tampering has become a rarity, and can often be self-defeating with respect w fuel economy or performance.
I&M can, in principle, detect a malfunctioning control system. In practice, however, the test has been too simplified in most locations to detect more than a few possible malfunctions. For example, a frequently employed I&M technique involves only measurement of the CO and VOC
concentrations in the tailpipe of a warmed-up idling engine and possibly a visual check for tampering. Recent enhancements to I&M procedures, such as a 240-sec test called the IM240 that mimics the driving loads of key portions of the FTP, involve operating the engine under load on a chassis dynamometer. Although not yet uniformly adopted, 1M240 procedures are now employed in areas such as parts of Indiana, Arizona, and Colorado.
Studies of on-road emissions performance have been conducted using a remote sensing technique that involves measuring the absorption of infrared light beamed across a single traffic lane behind a passing vehicle in normal traffic (Stephens et al. 1997). EPA has granted incremental emissions reduction credits to I&M programs that also incorporate such remote sensing. These measurements suggest that despite all precautions, a significant number of high polluters exist in the fleet. However, caution should be exercised in applying this technique (Ross et al. 1995). A single drive-by measurement provides only a snapshot of the tailpipe emission. If it measures emissions concentration before the catalyst has warmed up, or during a heavy acceleration, or during coasting with the throttle dosed, measured results correlate poorly with a dynamometer test, which, in this case, would provide a more-comprehensive reflection of actual driving conditions. Correlation can be improved by using a multipass average.
A number of other studies of in-use emissions have been conducted on an irregular basis, including repetitions of new vehicle certification tests on LDVs that have accumulated mileage in customer service. In one such study, it was determined that 80% of the stabilized and hot-soak VOCs came from the worst 20% of the vehicles on the road (AQIRP 1997b). In another series of tests on 1979 to 1989 models, 62% of the total CO from the test fleet came from only 7.6% of the vehicles (Ross et al. 1995). To illustrate the significance of these high emitters, if this 7.6% of the fleet were replaced with a like number of cars having the average CO emissions of the rest of the fleet, the total CO from the fleet would be decreased by about 60%. Either repairing high emitters or removing them from the fleet might be as effective as tightening emissions standards (Calvert et al. 1993).
As tailpipe-emissions standards become more stringent, evaporative emissions assume increasing importance. Deterioration of evaporative-emissions controls in the field has received less study than deterioration of exhaust emissions controls. In one examination of approximately 300
in-service vehicles, 15% were judged to have high evaporative emissions (Brooks et al. 1995). Among the high evaporative emitters, problems were found with failed gas caps and caps that were either not tightened properly or completely missing. Such problems are now detected by the latest on-board diagnostics (OBD-II). VOC emissions associated with liquid leaks have also been found. Fuel-hose deterioration, broken or missing hose clamps, and damaged fuel tanks are among the sources of leaks. Indications are that vehicles with leaks, although small in number, can exceed the evaporative emissions of a corresponding nonleaking vehicle by 1 or 2 orders of magnitude (GAO 1997). A half teaspoon of leaked fuel represents more VOCs emitted than exit the tailpipe of a car meeting the current federal standard as it travels over the LA-4 driving schedule (the first two segments of the FTP).
An inherent shortcoming of deterioration studies conducted on large samples of in-service vehicles, whether aimed at exhaust or evaporative emissions, is that they must be restricted to vehicles that have been driven by the public for enough years for malfunctions to develop. Such studies do not account for the effects of future improvements. First, as existing technologies mature, failure rates decrease. Second, gasoline improvements such as reduced volatility and sulfur content decrease emissions (see Chapter 5). Third, new technologies continually emerge. In this latter category is the second generation of on-board diagnostics.
The modem emissions-control system relies on a large number of sensors to provide inputs to the electronic control module. It is important that these sensors operate as intended. First-generation on-board diagnostic capability was introduced with the closed-loop control system in the early 1980s. It checks the function of such key sensors as those measuring coolant temperature, mass airflow, manifold absolute pressure, and throttle position. Malfunction of any of them illuminates a "Service Engine Soon" light on the dashboard, signaling the driver to have the indicated fault corrected by a technician. Second-generation on-board diagnostics, mandated for all model-year 1996 and later LDVs, adds functionality checks on important emissions-control subsystems. For example, the instantaneous acceleration rate of the flywheel is measured to signal a misfiring spark plug. The evaporative emission control system is checked for leaks. Satisfactory function of the oxygen sensor is verified and another check ensures that the EGR valve is working. Comparing signals from oxygen sensors located upstream and downstream of the catalytic converter monitors its effectiveness. EPA expects
such advanced early-warning diagnostics to lead to prompt correction of previously undetected malfunctions.
Functionality of Catalysts, Oxygenated Fuels, and Exhaust Emissions
Modem LDVs are equipped with a three-way catalyst that, with proper control of the air-to-fuel ratio via the oxygen sensor, promotes oxidation of most CO and VOCs in the tailpipe to CO2 and H2O and reduction of most NOx to N2. Moreover, once the catalyst becomes operational, it most readily catalyzes oxidation of the VOC species with the highest reactivity, thus reducing the reactivity of the exhaust stream as well as the total mass of emissions.
Oxygenated fuel makes additional oxygen available to the combustion process and thus, under appropriate circumstances, has the ability to decrease CO emissions. Appropriate circumstances exclude closed-loop operation of the current properly functioning control system because the oxygen sensor adjusts the air-to-fuel ratio to avoid exhaust oxygen. The oxygen sensor cannot discriminate between oxygen molecules in the exhaust that came from air entering the engine and those coming from the fuel itself. On the other hand, during open-loop operation, as during a cold start or a full-throttle acceleration, a system that meters fuel in proportion to airflow without a signal from the exhaust oxygen sensor will supplement the oxygen in the intake air with the additional oxygen in the oxygenated fuel. As this effectively makes the mixture leaner, some reduction in exhaust CO can be expected. (Chapters 6 and 7 discuss effects of the presence of oxygenates in the fuel on the total mass of VOC emissions, as well as the reactivity of those emissions.)
A large fraction of total emissions from the LDV fleet is now known to arise from vehicles without properly functioning emissions control systems. Some of these high emitters might suffer from an improperly functioning catalytic converter. In the limit of a complete failure of the catalyst, the composition of the vehicle tailpipe exhaust approaches the composition of the engine exhaust, and the oxygenated fuel may decrease engine-out VOC and CO emissions somewhat. However, fueling such a high-emitter with an oxygenated fuel will not compensate completely for the loss of conversion efficiency in the catalyst. Also, if the evaporative emissions control system is defective, the higher RVP typical
of ethanol-blended RFG might increase evaporative emissions to a greater extent than would a fuel having a lower RVP. The significance of malfunctioning evaporative systems to total VOC emissions from the vehicle has not been studied extensively. The contribution of high emitters is expected to increase in the coming decade (Sawyer et al. 1998).
Summary
Regulatory control of emissions from LDVs has become ever more stringent since the passage of the Clean Air Act. Manufacturers have responded with appropriate control technologies that have become more effective as they mature.
The contribution of ozone precursors to the national emissions inventory by on-road vehicles has been trending downward, despite a substantial increase in vehicle miles traveled.
Evidence indicates that the proportion of driving time spent in transient driving maneuvers that depart significantly from those accounted for by the current FTP is small, but those departures can contribute a disproportionate share of tailpipe emissions. Of particular concern are emissions arising from cold starts and trips with multiple stopovers. Changes to the certification procedure to account for shortcomings of the FTP are forthcoming. However, ongoing monitoring of driving profiles is warranted to ensure realistic integration of tailpipe emissions measurement with the presently uncoupled measurement of evaporative emissions.
The relatively small proportion of high-emitting vehicles present in the fleet can add disproportionately to total fleet emissions. Effectively repairing such vehicles or removing them from the fleet could be the single most effective ozone-precursor reduction strategy in the mobile-source control arsenal. The new generation of on-board diagnostics is expected to decrease the incidence of high emitters. Meanwhile, an ongoing program that diagnoses the specific emissions-component malfunctions in high-emitting vehicles could help to avoid high emitters in the future.

