
5
Research and Development Statistics: Funding, Performance, and Innovation
The Changing Organization of R&D
Changes in the sources and organization of research and development (R&D) funding and performance also prompt a review of the SRS portfolio at this time. Indeed, many structural changes in R&D have been underway since the early 1980s, so a review of the R&D data program is long overdue. The need to address these changes is substantial if we are to fully understand the allocation and use of science and engineering resources and the ways they contribute to national goals.
R&D in the Post-World War II Era
The use of scientific and technological R&D during World War II initiated a new era in the history of the financial resources made available for scientific research and technological development in the United States. Before World War II, basic scientific research evolved in universities independently of the federal government, often with philanthropic support. Industry funded its own scientific and technical research, often in central laboratories. The scientific and technical requirements of the military in WWII changed this as the federal government engaged the science and engineering enterprise in the production of weapons systems in support of the war effort. Towards the end of WWII, Vannevar Bush, director of the wartime Office of Scientific Research and Development, saw that successful coordination of scientific research to solve the war effort's technical issues could be profitably continued in peacetime to promote the nation's health, economic well-being, and national security. While beginning his work under the Roosevelt administration, Bush delivered to President Harry Truman his 1945 report, Science: The Endless Frontier, which provided the rationale and targets for federal investments in a federally-supported science and engineering enterprise that has continued into the 1990s (Bush 1945).
While Bush's report urged the use of science to support health research and
economic progress, the Cold War that soon followed WWII made defense a substantial component of the federal role in scientific and technological research. During the ensuing years, the defense rationale for the federal role only intensified. As is well known, the Soviet launch of Sputnik in 1957 shocked the United States into additional investments in U.S. science. This led to the creation of the National Aeronautics and Space Administration (NASA) and spurred the American drive to place a man on the moon by the end of the 1960s. In the aftermath of Sputnik, the United States also created the Defense Advanced Research Projects Agency (DARPA) (Boesman 1997).
These events set the stage for postwar funding of science and engineering in the United States. When data were first collected by NSF on sources of R&D funding in 1953, the federal government was already the leading source of funds for R&D in the United States and this continued to be the case for the next three decades (NSF 1999b). Similarly, federal spending on defense R&D exceeded federal non-defense R&D spending from the early 1950s through the mid-1960s when civilian R&D finally caught up due to explosive increases in space science. Defense and non-defense R&D were then funded at relatively comparable levels until the early 1980s (AAAS 1999).
U.S. R&D Since 1980
Total annual R&D expenditures in the United States by industry, government, universities and colleges, and nonprofit organizations reached a record high of $220.6 billion in 1998. Adjusted for inflation, R&D expenditures increased 5.3 percent from 1997 to 1998. Moreover, with this new level of spending, R&D as a percentage of gross domestic product (GDP) is 2.61 percent in 1998, the highest level since 1992 (NSF 1999f).
These expenditure levels are within the bounds of historic trends. Fueled by continued increases in industrial spending on R&D, average annual growth in total U.S. R&D expenditures in real terms has been 4.3 percent per year for the period 1995 to 1998. This is substantially higher than the 1.6 percent average real annual growth in total U.S. R&D for 1985 to 1995, but also lower than the 5.6 percent real average increases for the period 1975 to 1985. Also, R&D as a percentage of GDP increased recently, but it remains below R&D's share of GDP in the early 1990s when it exceeded 2.7 percent. The 1998 figure of 2.61 percent falls between the low point in the last 40 years, 2.12 percent in 1978, and the high point, 2.87 percent in 1964 (NSF 1999f).
While aggregate levels of the nation's R&D spending are within historic bounds, policymakers and researchers have observed that structural changes within the U.S. R&D system have been occurring for some time and will likely continue well into the future (NSB 1998a, Mowery 1999). These changes can be seen in industrial R&D and innovation, federal R&D funding, and academically-performed R&D.
Industrial R&D and Innovation
Changes in industrial R&D have been a central factor in the restructuring of the U.S. R&D system generally. There have been substantial increases in industry R&D expenditures overall, sizeable increases in the proportion of industrial R&D performed in the service sector, and changes in the structural organization of industrial R&D and innovation.
First, industry has been the largest source of R&D funding in the United States for almost two decades, and its share continues to grow. In 1980 industry passed the federal government as the largest supplier of R&D
funding in the United States. Industry's share has continued to grow such that in 1998, industry expenditures on R&D reached $143.7 billion or 65.1 percent of total R&D expenditures. The growth in industry's share of U.S. R&D is the result of continued, high-rate growth in industry R&D spending and decreasing R&D spending by the federal government. The average real annual growth in industry R&D spending from 1977 to 1997 was 5.4 percent. After a decline in real industry R&D spending earlier in the 1990s, average real annual growth in industry R&D spending from 1994 to 1998 was 6.2 percent. Meanwhile, federal R&D expenditures, which grew 60 percent in real terms from 1975 to 1987 and closely tracked the aggregate amount of industry spending during that time, has since declined by more than 20 percent in constant dollars.
An important result of the declining defense share in federal and national R&D funding has been a shift in funding for development from government to industry. As shown in Figure 5-1, development expenditures by industry and the federal government as a percent of total R&D expenditures from these sources has been stable over the past quarter century. However, the share of development funding from these sources provided by industry has increased from one-half to three-quarters. Industry spending on development has increased substantially, while federal spending on development, especially defense development, has declined (NSB 1998a).
Indicators from the mid-1990s suggest that trends in sectoral share of expenditures would be the opposite for basic research, but this has not been borne out in the long run. In 1991, industry provided one-third of the combined spending by industry and the federal government on basic research. Industry spending on basic research dropped, in real terms, from 1991 to 1992, and then held steady until dropping again in 1995, but industry spending on basic research has since rebounded. In 1997, the combined level of funding by industry and the federal government for basic research is about the same, in constant dollars, as in 1991, and the relative contributions of the federal government and industry are also about the same now as in 1991. With some minor fluctuation, industry has allocated its expenditures across the categories of basic research, applied research, and development in a fairly consistent manner over the past quarter century. For example, in 1977 basic research, applied research and development comprised 4.4 percent, 22.5 percent, and 73.2 percent of industry spending respectively. In 1997, the respective shares for these categories were 6.0, 22.1, and 71.9 percent (NSB 1998a).
Second, the distribution of industry R&D performance across industrial sectors has changed substantially over time, prompting the National Science Board to write, "probably the most striking change in industrial R&D performance during the past decade is the service sector's increased prominence" (NSB 1998a). An important component of service sector R&D that has been driving this increase is software development. In the early 1980s, R&D performance by non-manufacturing industries made up less than 5 percent of total industry R&D performance. Then, R&D performance by non-manufacturing firms as measured by SRS doubled between 1984 and 1988 and doubled again between 1988 and 1990 as seen in Figure 5-2. By 1991, non-manufacturing industries accounted for almost 25 percent of industrial R&D performance. While some of this apparent growth is due to the reclassification of some R&D (e.g., in software and telecommunications) from manufacturing to non-manufacturing sectors, this expansion in the percentage of R&D in the service sector corresponds with a similar expansion of the service sector within the economy generally.
Third, the structure of industrial R&D and innovation has been reorganized in the last two decades. In the early 1980s the competitiveness and technological leadership of U.S. firms in a global economy were generally seen as troubled at best and imperiled at worst (NRC 1999; Mowery 1999). A report by the NRC's Board on Science, Technology, and Economic Policy (STEP), Securing America's Industrial Strength, has outlined the factors generating resurgence in U.S. industrial strength amidst increasing global competition and technological change from the early 1980s to the late 1990s. Elements of the resurgence have included federal policy changes, shifting firm strategies, and changes in the U.S. system of innovation.
Changes in federal macro-and microeconomic policies since 1978 have created a new economic and regulatory environment that has encouraged U.S. industrial resurgence. Macroeconomic policies in recent years have helped keep inflation low and economic growth strong. Beginning with airline deregulation during the Carter administration in 1978, a series of changes in microeconomic policies have also contributed to U.S. industrial resurgence. These policies have included economic deregulation, lenient antitrust enforcement, protecting intellectual property, trade liberalization, and ongoing federal support of research and development (NRC 1999).
At the same time, firms have pursued strategies that have also been critical to industrial resurgence. A particularly important source of renewed strength for U.S. firms has been their ability to reposition themselves in their markets by introducing new products and processes. Securing America's Industrial Strength notes that firms have accomplished this by ''capitalizing on shifts in demand to create new markets, often through the deployment of technologies new to those industries, as well as to accomplish
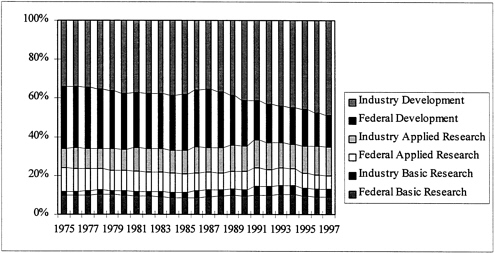
Figure 5-1 Distribution of Combined Industry and Federal Agency Spending on Research and Development across R&D Categories, 1975–1997
Source: National Science Board, Science and Engineering Indicators—1998, Appendix Tables 4-10, 4-14, 4-18 (1996 and 1997 data are preliminary).
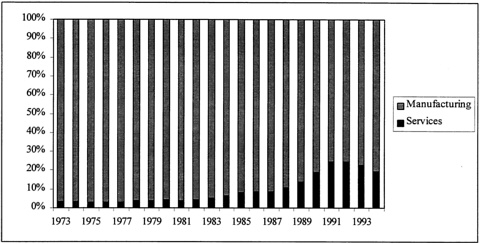
Figure 5-2 Percentage of Total Industrial R&D Performed by Manufacturing and Service Firms, 1974–1994.
Source: National Science Board, Science and Engineering Indicators—1998, Appendix Table 6–9.
cost reduction and quality improvement" (NRC 1999). Other firm strategies have included merging with or acquiring other firms, focusing on a specific product niche, and globalization of R&D, production, and distribution.
Perhaps more to the point, a changing organization of innovation has also contributed to the improved position of U.S. firms in domestic and global markets. Securing America's Industrial Strength illustrates the point by citing Timothy Bresnahan's description of how innovation in the computer industry has been reorganized from an "IBM" to a "Silicon Valley" system of innovation. Under the IBM model, innovation was "integrated, hierarchical, [and] more self-contained.'' In Silicon Valley, by contrast, innovation in the computer industry is organized through co-location of "multiple innovative companies excelling in components, hardware, software, networking, and other specialized parts of the industry" (NRC 1999).
Increased collaboration in R&D has played a growing role in the organization of the U.S. innovation system. A series of legislative acts has encouraged this collaboration. For example, the National Cooperative Research Act of 1984 (NCRA) has provided firms that collaborate on "generic, pre-competitive research" with certain protections in the event of private suits and limited damages in the event that cooperative R&D is later found to be in violation of anti-trust statutes. Research Joint Ventures (RJVs) registered under the NCRA with the Department of Justice have totaled more than 665 from 1985 to 1996 (NSB 1998a). In addition, many firms, beginning with some large corporations with central research facilities, have reduced internal R&D capabilities and have relied increasingly on outsourcing. This has been true of such large
firms as AT&T, IBM, Dupont, Xerox, and General Electric during the mid-1990s, but not of other large corporations, such as the Ford Motor Company. Even so, it is not yet clear whether this is a long-term trend or a one-time structural adjustment. In general, there has been a "proliferation of joint research ventures, strategic alliances, with foreign and other U.S. firms, . . .and cooperative arrangements with federal laboratories through CRADAs"1 (NRC 1999).
Federal R&D Expenditures
Meanwhile, shifting patterns in federal spending on research and development since the 1960s have been shaped by changing federal policy priorities and consequent changes in funding provided to mission agencies.
As shown in Figure 5-3, federal expenditures on defense R&D and non-defense R&D were roughly comparable from the mid-1960s until the early 1980s. Then, a rapid build-up of defense R&D spending in the 1980s combined with cuts in non-defense R&D set the pattern for nearly the rest of the decade. Defense R&D expenditures were reduced slightly in 1990, and with the end of the Cold War, have been reduced further, while funding for non-defense R&D has rebounded. The President's fiscal year 2000 budget proposed to spend more on non-defense R&D than defense R&D for the first time since 1981.
The most discussed trend in civilian R&D this decade has been the accelerated spending on health-related R&D, especially through the National Institutes of Health (NIH). This is the latest, though potentially most enduring, of a series of trends that have resulted from changing civilian policy and budget priorities. As shown in Figure 5-4, funding for the U.S. space program in the 1960s resulted in substantial space-related R&D during that decade. By the 1970s, space R&D funding had declined, but reaction to the energy crisis in the wake of the oil embargo by the Organization of Petroleum Exporting Countries (OPEC) led to substantial increases in energy-related R&D that continued into the 1980s. As defense R&D expanded in the 1980s, space R&D was cut further, and then energy R&D funding was reduced. Space science funding has rebounded somewhat in the 1990s, but the primary trend of the most recent decade has been the acceleration of the long-term growth in funding for health-related R&D. A less observed, but also important trend has been the increase in general science funding, including budget increases for the National Science Foundation that have been used across fields of science and engineering R&D.
These changes in federal spending priorities have had consequences for expenditures across R&D spending categories. The defense build-up of the 1980s generated a bulge in federal development expenditures. In constant dollars, federal development expenditures increased almost 50 percent from 1980 to 1988 before declining again to the 1980 level in 1996. Similarly, federal expenditures on applied research increased more than 40 percent from 1980 to 1990, but the subsequent decline has not been as steep as for development. Federal applied research expenditures remain above the 1980 level. Federal expenditures on basic research, however, increased steadily in constant dollars from 1980 to 1994, before taking a two-year decline. Federal expenditures for basic research have since increased in fiscal years 1997, 1998, and 1999.
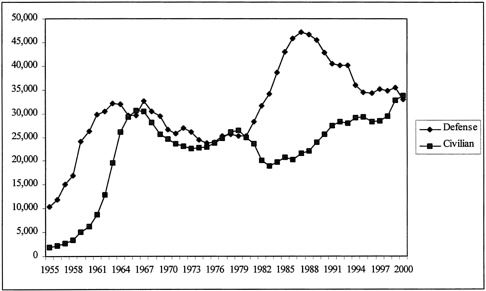
Figure 5-3 Federally-Funded R&D for National Defense and Civilian Functions, Fiscal Years 1955-2000 (millions of constant 1992 dollars). Note: Fiscal year 1999 is the latest estimate and Fiscal year 2000 is based on President's budget request. Figures for both fiscal years are estimated based on data in AAAS, converted to 1992 constant dollars using deflators in President's Budget Request, Fiscal Year 2000.
Sources: NSF 1999d, Table 3; AAAS 1999, Table 1–16.
Changing priorities have also had an impact on funding for specific fields of science and engineering. A recent analysis by the NRC's Board on Science, Technology, and Economic Policy (STEP) revealed that, in the 1990s, increases in funding for the National Institutes of Health and other mission agencies along with cuts in defense spending may be creating long-term increases in some fields and decreases in others. For example, between 1993 and 1997, overall federal spending increased in the biological sciences, medical sciences, aeronautical engineering, computer sciences, materials engineering, and oceanography. Federal spending decreased in electrical engineering, mechanical engineering, physics, mathematics, chemistry, chemical engineering, civil engineering, and geology (NRC 1999).
Academically-Performed R&D
Analysts have also been concerned about the impact of these changes on the portfolio of R&D activities performed by the nation's colleges and universities. While the federal government provides the majority of funding for academically-performed R&D, its percentage of such R&D declined from 70 percent in 1970 to 58 percent in 1991. It has hovered since at around 59 or 60 percent. The share of state government funding for academically-performed R&D has also
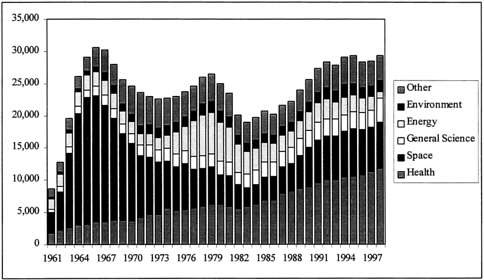
Figure 5-4 Federal Civilian Research and Development Funds, by Budget Function, Fiscal Years 1961–1998 (millions of constant 1992 dollars) Notes: For fiscal years, 1961–1977, data are federal obligations. For fiscal years, 1978–1998, data are for budget authority. Beginning in fiscal year 1998 a number of Department of Energy programs were reclassified from energy to general science.
Source: NSF 1999d, Table 25.
decreased slightly from 10 percent in 1970 to 7 percent in 1998. Meanwhile, institutional funds increased from 11 percent of total academic R&D funding in 1970 to more than 19 percent in 1998. Industrial support has grown faster than other sources of academic R&D funding, increasing from less than 3 percent in 1970 to 7 percent in 1990, where it has remained (NSF 1998d). Since the federal government nevertheless remains the largest funder for academically-performed R&D, changing federal funding levels and priorities affects college and university research and development activities. Alan Rapoport has recently demonstrated that between 1973 and 1996, field shares of total academically performed R&D have increased for the medical sciences, engineering, computer sciences, and astronomy; remained roughly constant for the mathematical sciences; and declined for the social sciences, psychology, environmental sciences, physics, chemistry, biological sciences, and agricultural sciences. These changes are due, in part, to shifts in federal funding streams noted above (NSF 1998b).
The National Academies' Committee on Science, Engineering, and Public Policy (COSEPUP) has observed that recent federal obligations for academic R&D may continue these trends in funding by field and warns that it is important to invest "in a balanced way across a broad range of fields to maintain the overall health of the science and technology portfolio." COSEPUP notes that federal obligations for academic R&D would increase by 16.6 percent in constant dollars from FY 1997 to FY 2000 under the President's budget proposal. However, when funding from the
Department of Health and Human Services (99 percent of which is from the National Institutes of Health) is excluded, support for academic R&D would increase only 1.9 percent in constant dollars from FY 1997 to FY 2000. Moreover, DOD support for academic R&D, which funds a large proportion of R&D in engineering, material science, computer science, and mathematics, would decrease 31.7 percent in constant dollars from FY 1997 to FY 2000 (NAS 1999).
Data for Research and Innovation Policy
Investment in research and development is commonly thought to provide high rates of return to the economy and that subsidizing it is an appropriate activity of the federal government. For example, the House Science Committee report Unlocking the Future recently argued "because the scientific enterprise is a critical driver of the Nation's economy, investment in basic scientific research is a long-term economic imperative" (U.S. House of Representatives 1998). The Progressive Policy Institute (PPI) also recently asserted that in addition to increasing venture capital investment and growing R&D expenditures by firms, federal support for R&D remains important and "has significant economic payoffs" (Atkinson and Court 1998). Similarly, the Council on Competitiveness argues that ''now, more than ever, research and development (R&D) drives the process of innovation that underpins our nation's economic well-being and national security" (Council on Competitiveness 1998). The Committee on Economic Development began its recent report on basic research by arguing that "basic research is a critically important—yet often undervalued—source of American economic growth and prosperity (Committee on Economic Development 1998). Economists, too, note that the outcomes of scientific research lead to economic growth. "The lags between basic research and its economic consequences may be long," Paula Stephan writes, "but the economic impact is indisputable" (Stephan 1996). David Mowery writes that several factors have aided innovation in the U.S. economy and the competitive position of U.S. firms. One of these is the U.S. domestic market which "remains that largest high-income region that possesses unified markets for goods, capital, technology, and labor." Another is a federal policy structure that supports economic experimentation through appropriate competition policies, intellectual property rights, and "large-scale federal funding of R&D in universities and industry" (Mowery 1999).
While government investment in R&D is held to be positive, how the government invests funds in R&D is an important policy issue that requires relevant data for proper analysis. Changes in the structure of the U.S. R&D system discussed above have led to new questions about the allocation of these resources in the 1990s:
-
What are appropriate sources and levels of short and long-term R&D support?
-
What should the level of direct federal support for R&D be, and how should it be allocated across agency missions, across fields of science and engineering, and across short and long-term research activities?
-
How have shifts in federal priorities (i.e., decreases in defense R&D; increases in health research) affected the balance of funding among fields?
-
What is the role of multidisciplinary research or integrative research across fields in the overall science and technology portfolio?
-
What is the nature of R&D and innovation in the service sector and what does this mean for the federal investment in science and technology given its role in promoting economic growth?
-
What are the future roles of federal regulatory, technology, trade, and macroeconomic policies in supporting industrial innovation?
-
What role should strategic alliances among firms, universities, and government play in the performance of R&D?
-
Do universities have adequate facilities for research in light of changing federal priorities and of the increase in strategic alliances among industry, government, and academia?
-
What do the existence of geographic clusters of innovation or the globalization of R&D suggest for the way federal funds for R&D are allocated?
In the remainder of this chapter we examine specific changes SRS should make to improve its data on R&D funding and performance in order to help answer these questions.
Industrial R&D Statistics
The principal source of national data on industrial R&D is the Survey of Industrial Research and Development (RD-1) conducted for SRS by the Census Bureau. Changes in the U.S. R&D system since the 1980s have already had implications for data collected by SRS on the funding and performance of R&D by private firms through this instrument. From its inception through the 1970s, RD-1 served as a suitable instrument for collecting industrial R&D data and NSF changed the instrument little during these decades. In the 1980s, however, as the economy and industrial R&D began to change, the instrument became increasingly non-reflective of current R&D organization and practices:
In the 1980s, issues of U.S. industry's competitiveness, rapidly changing technology, and globalization interrupted the survey's stability and challenged its design and objectives. These issues first became evident in the R&D survey with the changing dynamics of company organization. Simply maintaining the survey panel in the midst of countless mergers, acquisitions and divestitures was a demanding process (Champion 1998).
Other issues became evident: the increase in R&D performed by non-manufacturing firms; a growing number of small, start-up companies conducting R&D; and an apparent increase in the number of intra- and inter-sectoral R&D partnerships.
In the 1990s, SRS substantially modified the sample design for RD-1 to begin addressing some of the issues raised by this changing world. First, evidence of increased R&D in the service sector compelled SRS to draw a sample that included many more non-manufacturing firms from a broader range of non-manufacturing industries. Second, the approach SRS was using to administer RD-1 and estimate industrial R&D was missing R&D performed by a variety of firms. For example, SRS drew a sample of 14,000 firms in 1987 and administered RD-1 to them in that year. From 1988 to 1991, however, only about 1,700 of these firms were annually surveyed; data for the other 12,300 or so firms was estimated. Among other things, this approach was inadequate for capturing R&D performed by smaller firms and by firms that were new performers of R&D. To provide more reliable estimates of R&D, therefore, SRS not only expanded the representation of non-manufacturing industries and small companies, but also decided to draw an expanded sample of 25,000 firms annually (NSF 1999g).
SRS also added questions to RD-1 on company-sponsored R&D in addition to company-performed R&D. This was initially added as a quality control measure, but it consequently provided meaningful information on outsourced R&D and R&D performed by foreign subsidiaries. The Census determined that companies could report foreign R&D by country and added this
question to the survey in 1993 (Champion 1998).
Still, a number of issues remain. First, given the large number of multi-product firms, should RD-1 be fielded at the firm level, as is presently done, or should it be fielded at the line-of business level? Second, since R&D performed in the service sector appears to differ substantively from R&D in the manufacturing sector, are we collecting the right data on one-quarter of industrial R&D? Third, because translating scientific and technological advances into new processes and products is a critical component of generating returns on R&D investment, what useful data and analyses could be obtained on industrial innovation to inform policymakers, managers, and researchers? Fourth, how does an apparent increase in the number of intra and inter-sectoral partnerships affect how R&D data should be collected?
Improving Data on R&D by Industry Group
At present, the long version of RD-1 asks firms to provide data every other year on how their expenditures for applied research and for development break down by product group. However, high nonresponse to this question leaves the resulting data of questionable value. Many firms have difficulty categorizing applied research and development by these fields, or if they can categorize them, they do not want to disclose them because the data are considered strategic or proprietary. For these reasons, nonresponse to product field for applied research and development is unlikely to improve. We recommend that SRS drop this question from the survey.
Although SRS may be constrained in this area because it has very limited authority to compel responses from surveyed parties, we believe SRS should investigate options available for obtaining more detailed and accurate data on industrial R&D expenditures in lieu of the product group question. Currently, Census administers RD-1 to firms. All R&D spending within a firm is attributed to the firm's industry classification. Thus, if 51 percent of a firm's business is in motor vehicles and 49 percent in other products, all of its R&D expenditures are counted as in "motor vehicles." As a result, such data collection likely skews how industrial R&D is portrayed by industrial classification.
Administering RD-1 to business units rather than firms as an option for obtaining more accurate R&D data by industrial classification was the subject of much discussion at the Workshop on Research and Innovation Indicators held by the NRC's Board on Science, Technology, and Economic Policy (STEP) in February 1997. The report summarizing the workshop's findings maintains that SRS should collect data by administering RD-1 to business units:
In an economy in which large, complex, multiproduct firms perform most R&D activities, the business unit represents a more homogeneous set of activities, whereas combining responses on a range of variables for a variety of products and processes will obscure significant industry-specific conditions that affect technological innovation. Moreover, managers at the business unit level are likely to be better informed about innovation-related investments and performance measures than are corporate headquarters officials (NRC 1997c).
Workshop participants concluded that RD-1 should be administered to business units, and should collect data on "R&D expenditures, composition of R&D (process versus product; basic research, applied research, and development), share of R&D that is self-financed, supported by government or other contract, as well as contextual information on business unit sales, domestic and foreign, and growth history of the business unit" (NRC 1997c).
SRS should carefully consider a variety of questions in assessing the costs and benefits of administering RD-1 to business units. For example, it should investigate whether the business unit, perhaps well enough understood by business managers, is sufficiently well defined in operational terms to be a useful construct with which it could collect R&D data reliably. SRS should also examine and learn from the experiences of the Federal Trade Commission in the late 1970s in the administration of business unit surveys. Collecting R&D data at the business unit level would allow more accurate detail on R&D by product or service. In addition, obtaining the geographic location of the business unit would allow these R&D data to be linked with other locational data, such as demographic, educational, and economic data by metropolitan statistical area. Of considerable importance, though, is whether data collected at the business unit level could be aggregated to the firm level, since other economic data to which RD-1 might be linked are available at that level.
R&D and Innovation
David Mowery argues that current R&D expenditure data do not provide adequate information on many activities contributing to innovation such as "investments in human resources and training, the hiring of consultants or specialized providers of technology-intensive services, and the reorganization of business processes." He also contends that R&D expenditure data "do not shed much light on the importance or content of the activities and investments essential to inter-sectoral flow and adoption of information technology-based innovations." He notes further that in such non-manufacturing industries as trucking or food retailing R&D inputs may not be adequately captured because they are indistinguishable from other corporate expenses on operations, materials, or marketing. These contentions are of particular concern, because the second structural change in industrial R&D in the last two decades has been the increasing share of R&D that is performed within non-manufacturing firms. SRS and Census have expanded the sample for RD-1 to include more non-manufacturing firms, and this has improved the data available on formal R&D funding. However, these data may not fully capture aspects of how R&D is performed and how its outputs are adopted. "Without substantial change in the content and coverage of data collection,'' Mowery advises, "our portrait of innovative activity in the U.S. economy is likely to become less and less accurate" (Mowery 1999).
In light of these problems, SRS should collect additional data or conduct different kinds of analyses to better understand innovation in the service sector as well as in manufacturing. First, SRS should pursue plans to develop a survey of industrial innovation as recommended in the report of the 1997 STEP workshop as one means for providing data on technology adoption and the development of new processes and products (NRC 1997c). SRS should examine and learn from the experiences of the many individuals and organizations who have attempted to administer innovation surveys, from the efforts of Hansen, Hill, Stein, and More in the early 1980s to its own pilot survey in 1994 (Hill, Hansen, and Stein 1983, Hansen, Stein, More 1984). As part of this review SRS should examine innovation surveys conducted in other countries. SRS should include both potential survey respondents and data users in determining the kinds of research questions that would be addressed by such a survey, in developing the survey instrument, and in determining appropriate means for administering the survey.
Second, SRS should also conduct or sponsor further research into the nature of service sector R&D. For example, since technology is as often diffused by the movement and interaction of scientists and engineers as by other means, SRS could
examine whether human resources data can be used to explore important characteristics and trends in research utilization and industrial innovation in both the service and manufacturing sectors. As one individual interviewed for this study noted, analysts first understood that the service sector was an increasingly important locus of R&D performance when scientists and engineers moved into the financial services sector. Human resources data could potentially shed light on technological diffusions between sectors and fields as seen in career mobility, the nature and extent of intra- and inter-sectoral partnerships and alliances, and the locational aspects of R&D and innovation.
An examination of how human resources data could be used to characterize research utilization and industrial innovation would also provide an excellent opportunity for SRS to examine how data sets could be linked to improve analytical range and depth, as we also recommend elsewhere. In this case, linking SRS human resources data with data on patents and publications, R&D funding and performance data, and other demographic and economic data available by geographic location could potentially enrich analysis.
Partnerships
"Beginning in the 1980s, a combination of severe competitive pressure, disappointment with perceived returns on their rapidly expanding investments in internal R&D, and a change in federal antitrust policy led many U.S. companies to externalize a portion of their R&D," writes David Mowery (Mowery 1999). Indeed, indicators do point to increasing numbers of joint ventures, strategic alliances, and cooperative research agreements:
-
From 1985 to 1996, more than 665 research joint ventures (RJVs) among firms working on generic, pre-competitive research have been registered with the Department of Justice under the National Cooperative Research Act (NSB 1998a).
-
The 1980s and 1990s saw an increase in the number of partnerships formed among high-technology firms (information technology, biotechnology, and new materials) for technology development or technology transfer. Over time, research joint ventures have been replaced by contractual and equity arrangements as the primary vehicles for arranging strategic technology partnerships. International partnerships have increased but not at the same rate as domestic ones (Hagedoorn 1996).
-
The fastest growing source of funding for academically-performed R&D is industry, which financed less than 3 percent in 1970, but increased its share thereafter to 7 percent in 1990, where it has remained (NSF 1998d).
-
3,512 Cooperative Research and Development Agreements (CRADAs) were executed between federal laboratories and private firms from 1992 to 1995 (NSB 1998a).
These indicators are suggestive of an important trend, and even of structural change, but they do not provide a complete picture of the role and variety of partnerships. As the STEP report on Securing America's Industrial Resurgence points out, "the incidence and value to firms of outsourcing R&D are unclear" (NRC 1999). Changes to SRS survey instruments could help illuminate these phenomena further.
SRS currently asks respondents to the Survey of Industrial Research and Development to provide the amount of federal funds, company funds, and total funds spent for research and development performed in the United States on behalf of the firm by others outside the company. The Survey also asks for an aggregate of company funds for
research and development performed by foreign subsidiaries or other organizations outside the United States. To further describe the nature of partnerships, SRS should examine the efficacy of asking firms to provide data on the number of new, continuing, and terminating alliances each year and how this might vary by type of alliance. Data that Hansen, Hill, and Stein collected in their 1981 and 1983 surveys would be a useful reference in regard to response rates, definitional problems, and other aspects of collecting this sort of data (Hill, Hansen, and Stein 1983). SRS might also ask firms to break out their responses to R&D performed with company funds overseas into that performed by foreign subsidiaries and that performed by foreign subcontractors.
At our September workshop, Patrick Windham noted that some large firms, such as Cisco Systems, acquire start-up companies as an R&D strategy. Other firms gain access to R&D and innovations by making equity investments in other companies. These practices are thought by some to be increasingly common in high-technology industries, such as information technology and telecommunications. If they are widespread, then an accurate picture of the total amount of corporate R&D spending must account for these kinds of investments. SRS should work with experts in this area to investigate how widespread this practice is, and how it may be characterized in certain industries, especially in the information technology industry. Based on the results of its investigation, SRS should consider whether to account for these phenomena in the Survey of Industrial Research and Development or by other means.
Some analysts have suggested that industry has compensated for the downsizing of central labs by contracting research to university-or nonprofit-based researchers. The decentralized nature of some large corporate R&D operations makes it difficult for firms to track these alliances effectively. Even if they could, firms might balk at providing data on outsourcing that would expose corporate R&D strategies. In 1992 and 1993, the Census Bureau interviewed companies about the feasibility of reporting several new data items on the Survey of Industrial R&D, including the type of organizations that receive subcontracts. For the proposal, Census developed a list of organization types that might receive funds from industry to perform R&D. Census found that their list was inadequate. However, they did not revise it because respondents indicated they would have considerable difficulty in providing the information because grants could be made to universities outside of the R&D budget, and it may be difficult to distinguish between research and other awards (Champion 1998).
This remains an important issue, however, and several alternative means for collecting these data may be identified. For example, SRS might explore whether detailed data on the extent of industry-university partnerships could be collected through the Survey of Research and Development Expenditures at Universities and Colleges. Currently, this survey asks for the aggregate amount of R&D funding the institution received from industry, but it could also ask for this amount to be disaggregated by field as it does for total expenditures and federally funded expenditures, thereby providing more detail in this area. SRS could also ask academically-based respondents to the Survey of Doctorate Recipients about the number and type of relationships they have with industry and the dollar amounts associated with them.
Allocating Federal Funds for Research and Development
In the face of constrained budget resources and changing federal priorities for scientific and technological research, the U.S. Congress called on the National Academies in 1994 for guidance in developing a more systematic and
prioritized approach to federal R&D funding. The Senate Appropriations Committee that year requested a study from the National Academy of Sciences, National Academy of Engineering, and Institute of Medicine to address:
the criteria that should be used in judging the appropriate allocation of funds to research and development activities, the appropriate balance among different types of institutions that conduct such research, and the means of assuring continued objectivity in the allocation process.
The resulting NRC report, Allocating Federal Funds for Science and Technology, recommended a new budget process for science and technology to ensure that the United States continues as the world leader in these areas by funding agency missions and the broad range of science engineering fields. Data on resources for the science and engineering enterprise should inform the process for allocating federal research investments and the examination of the federal science and technology budget (NRC 1995).
Priority Setting in Federal Science and Technology
Allocating Federal Funds laid the groundwork for subsequent debate about resource allocation by focusing on the "federal science and technology" (FS&T) budget. The FS&T budget "would reflect real investment in the creation of new knowledge and technologies and exclude activities not involving the creation of new knowledge or technologies, such as the testing and evaluation of new weapons systems." The FS&T budget includes funding for basic and applied research from all departments and agencies and all civilian development funding. However, it only includes that part of defense development at the Department of Defense (DOD) and the Department of Energy (DOE) that includes generic technology development (6.3 at DOD and its equivalent in the DOE atomic energy defense program). For FY 2000, federal research and development in the President's proposed budget is $78.2 billion while the FS&T budget, a subset of the former, would be $49.6 billion (NAS 1999).
Among other goals, the report wanted to assure that science was funded adequately across field, recommending that "departments and agencies should make FS&T allocation decisions based on clearly articulated criteria that are congruent with those used by the Executive Office of the President and by Congress" and "the President and Congress should ensure that the FS&T budget is sufficient to allow the United States to achieve preeminence in a select number of fields and to perform at a world-class level in the other major fields" (NRC 1995).
Four years later, the budget context for research appropriations has not changed dramatically, even with the advent of a budget surplus, since caps on discretionary spending remain in place. As a result, calls for prioritization in the allocation of resources for research continue. The Academies continue to follow this issue by providing annual observations on the FS&T budget and by developing international benchmarks by field (NAS 1999). In presenting the "21st Century Research Fund" as a component of the President's fiscal year 2000 budget submission, Neal Lane, the President's science advisor, noted that the Fund was designed to reflect the National Academies' FS&T concept. Indeed, the President's budget request states "This budget also reflects an effort to re-establish an optimum balance between health care research and other scientific disciplines—a concern voiced in recent years throughout the science community" (U.S.O.M.B. 1999). Science magazine recently took an editorial position in favor of a more ''scientific" approach to establishing priorities for allocating federal funds for science research (Bloom 1998). This
issue was also raised by interviewees as a critical resources issue for the post-Cold War era that has yet to be resolved.
The National Science Board has also taken an active role in priority setting across agencies and fields. The Board recently recognized in its Strategic Plan that the Academies' report on Allocating Federal Funds laid "the foundation for future efforts in what remains a formidable challenge." Still it has noted that "presently, there is no widely accepted way for the federal government, in conjunction with the scientific community, to make priority decisions about the allocation of resources in and across scientific disciplines." The Board has argued that this is true both of the OMB budget process and the congressional appropriations process. While recognizing that this is a "difficult and controversial" task, the NSB has determined to "conduct a state of the art assessment for methodologies for priority setting for research, including an examination of the experiences of other countries'' (NSB 1998d).
SRS should continue to monitor whether the Survey of Federal Funds for Research and Development provides data that policymakers, researchers, and others require to measure the concepts in funding for fields of science and engineering they find important at this time.
First, at a recent SRS-sponsored Workshop on Federal Research and Development, participants suggested a more accurate portrayal and analysis of the FS&T could be obtained if data provided by DOE and NASA more explicitly specified the science and technology components of their research and development budgets. The Department of Defense (DOD), for example, does this by specifying spending for basic research, applied research, and advanced technology as distinct from weapons systems development in its research and development program. Also, FS&T data that can now be accessed are available only at aggregate funding levels. Disaggregating federal R&D funding into FS&T and non-FS&T components for more detailed trends—such as trends in federal support for research at U.S. colleges and universities—would further enable more meaningful analysis.
Second, SRS should also continue to work toward resolving discrepancies in the results obtained by the Survey of Federal Funds for Research and Development, the Survey of Industrial Research and Development, and the Survey of Research and Development Expenditures at Universities and Colleges. As shown in Figure 5-5, the discrepancy in the level of federal obligations to colleges and universities obtained by the federal funds survey and the level of federally-funded R&D expenditures reported by colleges and universities in the academic R&D survey has grown since 1992. By 1997, the difference in results between the two surveys was more than $1.9 billion. As noted in Chapter 3, SRS is aware of this discrepancy, has begun investigating it, and has some preliminary observations about the reasons for the discrepancy (e.g., increasing research subcontracting among universities that results in double counting, differences between federal obligations and expenditures, etc.)
If these data sets are to continue to have credibility and usefulness as sources of data for analysis of the distribution of federal funding across fields, they should produce similar trends by field even if the aggregate totals differ. Table 5-1 displays data by field on federal obligations for research to colleges and universities (as reported through the Survey of Federal Funds for Research and
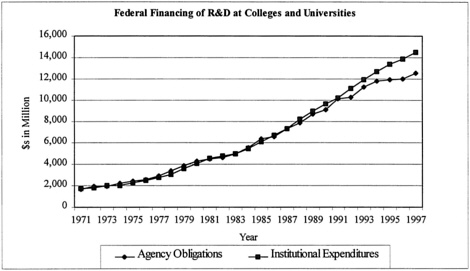
Figure 5-5 SRS Data on Federal Obligations to Universities and Colleges for Research Compared to SRS Data on Federally-Funded Academic Research and Development Expenditures, 1971–1997
Source: Obligations: NSF/SRS, Survey of Federal Funds for Research and Development; Expenditures: NSF/SRS, Survey of Research and Development Expenditures at Universities and Colleges.
Development) and federally-funded R&D expenditures by colleges and universities (as reported through the Survey of R&D Expenditures by Universities and Colleges).
The data show very different funding trends by field. For example, federal obligations for academic electrical engineering research decreased in constant dollars from 1993 to 1997 by 31.6 percent. At the same time, according to the academic R&D survey, federally-funded R&D expenditures in that field increased by 27.2 percent. The Federal Funds survey provides data by field for research categories only and the academic R&D survey provides data by field only for research and development combined. Thus, this table is, in a sense, comparing "apples" with "apples and oranges." However, development is only about ten percent of federally-funded academic R&D, so it is hard to imagine that this by itself would account for such different results. For these data to be useful for analysis of funding by field these discrepancies must be accounted for.
Third, SRS should continue to work with agencies to ensure that data reported by field is accurate and consistent over time. Interviews conducted for this study suggested that agency respondents work with contract classification systems that may have evolved long ago and may no longer fit current classifications of fields in science and engineering. In addition, the budget officer who is the respondent to the federal funds survey may base the field classification on the title of particular procurement in a very subjective way. SRS has begun working with policymakers in agencies that use these data to encourage them to impress on those who reply to the SRS survey the importance of providing good,
Table 5-1 Federal Obligations to Universities and Colleges for Research Compared to Federally-Funded Research and Development Expenditures, by Field, 1993 and 1997
|
|
Federal Obligations for Academic Research |
Federally-Funded Academic R&D |
||||
|
|
Constant 1999 dollars |
% Change |
Constant 1999 dollars |
% Change |
||
|
|
1993 |
1997 |
1993–1997 |
1993 |
1997 |
1993–1997 |
|
S&E, total |
10,659 |
11,050 |
3.7% |
13,352 |
14,866 |
11.3% |
|
Engineering, total |
992 |
1,013 |
2.1% |
2,075 |
2,326 |
12.1% |
|
Aeronautical/Astronautical |
82 |
69 |
-15.8% |
179 |
185 |
3.3% |
|
Chemical |
73 |
65 |
-11.0% |
160 |
171 |
7.2% |
|
Civil |
42 |
46 |
8.7% |
172 |
202 |
17.4% |
|
Electrical |
219 |
150 |
-31.6% |
512 |
651 |
27.2% |
|
Mechanical |
131 |
78 |
-40.4% |
346 |
335 |
-3.2% |
|
Metallurgical/materials |
225 |
268 |
19.2% |
168 |
229 |
36.4% |
|
Other, n.e.c. |
222 |
338 |
52.2% |
538 |
553 |
2.6% |
|
All Sciences, total |
9,667 |
10,037 |
3.8% |
11,277 |
12,540 |
11.2% |
|
Physical sciences |
1,310 |
1,193 |
-8.9% |
1,690 |
1,748 |
3.4% |
|
Astronomy |
134 |
172 |
28.5% |
184 |
190 |
2.9% |
|
Chemistry |
389 |
350 |
-10.1% |
564 |
572 |
1.4% |
|
Physics |
679 |
535 |
-21.2% |
791 |
836 |
5.8% |
|
Other, n.e.c |
108 |
136 |
25.8% |
150 |
150 |
0.0% |
|
Environmental sciences |
659 |
689 |
4.5% |
971 |
1,060 |
9.2% |
|
Atmospheric |
179 |
211 |
18.2% |
180 |
191 |
6.0% |
|
Earth Sciences |
211 |
127 |
-39.8% |
271 |
278 |
2.4% |
|
Oceanography |
164 |
220 |
34.2% |
367 |
385 |
4.9% |
|
Other, n.e.c. |
107 |
130 |
21.4% |
152 |
205 |
35.0% |
|
Mathematical sciences |
152 |
121 |
-20.4% |
227 |
211 |
-6.9% |
|
Computer sciences |
395 |
464 |
17.4% |
472 |
527 |
11.5% |
|
Life sciences |
6,143 |
6,731 |
9.6% |
7,133 |
8,079 |
13.3% |
|
Agricultural sciences |
166 |
177 |
6.6% |
503 |
582 |
15.8% |
|
Biological sciences |
3,246 |
3,739 |
15.2% |
2,580 |
2,786 |
8.0% |
|
Medical sciences |
2,609 |
2,601 |
-0.3% |
3,764 |
4,400 |
16.9% |
|
Other, n.e.c. |
122 |
213 |
75.1% |
287 |
310 |
7.8% |
|
Psychology |
321 |
290 |
-9.5% |
261 |
276 |
5.5% |
|
Social sciences |
241 |
202 |
-16.3% |
378 |
428 |
13.5% |
|
Other sciences, n.e.c. |
446 |
346 |
-22.3% |
144 |
211 |
46.6% |
|
Sources: NSF/Survey of Research and Development Expenditures at Universities and Colleges (NSF 1999a, Table B-4); and NSF/Survey of Federal Funds for Research and Development (NSF 1999c, Table 62). |
||||||
consistent responses. We encourage SRS to continue with this work. At the same time, agencies must be very careful about how they do make changes when they are warranted. For example, a recent analysis using data from the Federal Funds Survey found that it was difficult to track changes by fine field over time because the National Science Foundation, in responding to the survey, had changed its procedures for classifying research obligations by field beginning in fiscal year 1996. This resulted, for example, in substantial increases
that year in such areas as "engineering, n.e.c." and "physics, n.e.c." 2 (NRC 1999).
Fourth, as we have recommended elsewhere, SRS should use a common science and engineering taxonomy across its surveys to facilitate linkages across its data sets—and especially between its R&D investment and human resources data sets—in order to better support analysis of the allocation of science and engineering resources. In a recent analysis of trends in federal spending on science and engineering research, Michael McGeary and Stephen Merrill sought to examine how such trends have affected funding for specific science and engineering fields, and moreover, graduate training in those fields. While they were able to look at trends in federal support for graduate training in a very broad way, the differences in field taxonomy for the Federal Funds Survey and the Survey of Graduate Students and Postdoctorates in Science and Engineering made it difficult to associate changes in federal research by field with changes in graduate training by fine field (NRC 1999, Appendix A). The ability to link data sets would allow such analyses to be carried out in a more detailed and effective manner.
Interdisciplinary Research
SRS should also investigate further the degree to which inter-or multidisciplinary research is increasingly prevalent and important in scientific and technological research in the United States. "Interdisciplinary research is a mantra of science policy," write Norman Metzger and Richard Zare. "Virtually any meeting on the current state and future of science is leavened by obligatory statements about the importance of enabling researchers to work seamlessly across disciplinary boundaries and by solemn declarations that some of the most exciting problems in contemporary research span the disciplines." Metzger and Zare argue, however, that the way federal agencies currently fund research does not encourage as much interdisciplinary research as there ought to be since such research would "enrich and enlarge" science and engineering in the United States by reintegrating knowledge (Metzger and Zare, 1999).
Data on the extent of interdisciplinary research conducted are important to analyses of science and engineering resources for two reasons: they are critical for accurately measuring the science and engineering enterprise generally, and they have implications for priority setting by field within that enterprise if certain projects are indeed inter-or multidisciplinary. Yet how much federally-funded R&D is multidisciplinary in nature is not clearly known, partly due to the limitations of SRS data. Data from NSF's Federal Funds survey or other data sources do not reveal the extent or nature of multidisciplinary research supported by the federal government, industry, or other organizations at present. Only one federal agency, the U.S. Department of Agriculture, is required by law to track how much of its research is multidisciplinary.
SRS has taken some preliminary steps to explore the nature and extent of interdisciplinary research, but more needs to be done. For example, SRS explored the recent increases within major fields of federal funding that is "not elsewhere classified" (i.e., categorized by fine field) on the theory that much multidisciplinary research may be so classified. However, other kinds of projects or research in newly emerging fields (e.g., bioengineering) may also be classified as n.e.c. until the taxonomy is changed to provide its own category. Thus, n.e.c. is not a precise proxy for multidisciplinary work. Several participants at the SRS Workshop on Federal Research and Development suggested that
other agencies, in addition to USDA, should explicitly track how much of their funding is for multidisciplinary research, but others believed it would be difficult to sort projects in this manner, and that such a procedure would add to the respondent burden. That latter claim should be investigated further by SRS.
SRS should continue to investigate how the extent of multidisciplinary research may be obtained through surveys in both its R&D and human resources statistics programs. The division should consider holding a workshop or commissioning a study to better understand the nature and extent of this phenomenon and how to implement changes consistently throughout its data collection activities, as needed and where possible. The workshop or study should provide guidance or recommendations on how to consistently implement such changes.
Federal Funding of Academic Facilities
Concerned about the condition of research facilities at U.S. colleges and universities, the U.S. Congress mandated that NSF collect data on academic science and engineering (S&E) research facilities issues. These issues include the amount and condition of current space for conducting academic S&E research, the percentage of existing space that needs to be repaired or renovated, the need for new construction of research space, the extent of current repair work and construction, and the sources of funds for repair and new construction (NSF 1999j).
The federal government bears only a small share of the costs of building and maintaining academic research facilities in the United States, but the federal government has struggled throughout the 1990s with ensuring that reimbursements to major research universities for facilities and administrative (indirect) costs are proper. In 1990 and 1991, institutions used their own resources to fund 55 percent of new construction, renovation, and repair, while state and local government provided 32 percent, and the federal government 14 percent. In 1996 and 1997, the respective shares of funding from these sources were 62, 29, and 9 percent. Nonetheless, the U.S. Office of Management and Budget (OMB) sought in 1998 to revise OMB Circular A-21 on university indirect cost reimbursement for facilities. Through the revised circular, OMB instructed institutions to document—using data from SRS's Survey of Scientific and Engineering Research Facilities at Universities and Colleges and other sources—their construction costs for new buildings so that they could be compared with similar costs for other institutions. Associations for the universities, however, argued that existing data from that NSF survey were not adequate for comparing costs among institutions.
SRS should continue to cooperate with OMB in the development and refinement of a survey that would follow up the Survey of Scientific and Engineering Research Facilities at Universities and Colleges to collect detailed data on the space and cost of buildings at academic institutions with science and engineering facilities with construction costs over $25 million. This follow-up questionnaire should collect data for analyzing reimbursement for federally funded research facilities through the application of the facilities and administrative (indirect cost) rate. The follow-up survey, focusing on buildings, the use of which is anticipated to be over 50 percent for research, should assess the cost of buildings by science and engineering discipline. The survey should meet OMB's needs and also the needs of the National Center for Education Statistics (NCES) for use of square footage. We believe that this is an important test of whether SRS data can directly support an important federal science and engineering policy question. SRS should cooperate with OMB in this endeavor and
revise the Facilities survey to meet this need. Another question that may be addressed by the Survey of Scientific and Engineering Research Facilities at Universities and Colleges concerns the financial requirements for renewing the science and engineering infrastructure across all fields at academic institutions. It should examine the feasibility of posing a one-time question to obtain an estimate of the costs associated with future renovation of the academic research infrastructure. Data on these requirements, especially in light of ongoing concerns about federal reimbursement of indirect costs, would help plan for an orderly renewal of academic infrastructure.


