
4
DOSE ESTIMATION
IN assessing the risks of exposure to MeHg, quantitative exposure assessments are required to derive dose-response relationships from epidemiological data. A quantitative exposure assessment also allows risk assessment of an exposed population by comparing actual exposures to a reference dose (or similar benchmark) derived from critical studies. In contrast to experimental animal studies, in which the dose can be closely controlled, the dose in population-based epidemiological studies is not controlled and is therefore viewed as a random variable distributed across the study population. Three metrics for retrospective dose estimation and reconstruction are available for MeHg: dietary assessment, hair analysis, and blood analysis. Each metric has advantages and disadvantages. Ponce et al. (1998) proposed an approach for examining the relative uncertainties of those metrics.
DIETARY ASSESSMENT
With the exception of intakes through breast milk, which is less well characterized, exposure to MeHg occurs almost entirely from a single dietary category — fish (IPCS 1990, 1991). For that reason, the task of assessing dietary intake or assessing ongoing intake in populations with uncontrolled exposures is relatively straight forward compared to assessment of multiple types of food. There are several basic approaches to the estimation of MeHg exposure from dietary intake: collection of
duplicate portions of foods consumed; food-consumption diaries, in which daily fish intakes are recorded quantitatively; recall methods, such as 24-hr recall of fish consumption; diet histories of usual consumption at various meals; and food-frequency measures of usual frequency of consumption of fish and shellfish. Duplicate-diet collections and food-consumption diaries are prospective approaches, and the others are retrospective approaches.
General considerations for duplicate-diet studies were recently discussed by Berry (1997) and Thomas et al. (1997). In duplicate-diet studies, participants collect an identical portion of the food they consume and provide it to the investigator for laboratory analyses. In theory, duplicate-diet studies have the potential to provide the most accurate information on the ingested dose of MeHg, because the mass of fish and other nutrients and contaminants, in addition to MeHg, can be measured directly. The fact that only the fish portion of any given meal will contain MeHg simplifies the burden of duplicate-diet collection. In practice, however, this approach is limited by the demands it makes on the participants, the difficulty in identifying individuals who are willing to carry out such a study, the influence exerted by investigator observation, and the potential change in diet resulting in response to the burden of food collection. Thomas et al. (1997), working with nine highly motivated households, was able to collect duplicate samples for 97% of meals and 94% of snacks over a 7-day period. The number of uncollected meals, however, tripled after the first 3 days, and participants strongly recommended that future studies be limited to a maximum of 3-4 days. When such studies are confined to fish consumption, 3-4 days of collection might be useful only for populations with very frequent and highly regular patterns of fish consumption. Because of the practical limits on the length of the collection period, the authors recommended that duplicate-diet studies for risk-assessment purposes should be done over multiple intervals of time. Moreover, when the calorie content of collected food was compared with the estimated energy requirements of participants, duplicate portions were found to be underestimated.
Duplicate-diet studies have been specifically applied to the estimation of MeHg exposure by Sherlock et al. (1982) and Haxton et al. (1979). Sherlock et al. (1982) carried out a 1-week duplicate-diet study with 98 participants selected on the basis of frequent fish consumption. In
addition, a 1-month dietary diary was kept by the participants; the last week of the diary corresponded to the duplicate-diet collection. No indication is provided of the completeness of the duplicate-diet collection, but the weight of fish calculated from the diary during the week of duplicate-diet collection corresponded closely to the weight of fish measured from the duplicate samples. The authors noted however, indirect evidence of undercollection of duplicate-diet portions relative to consumed portions. It should also be noted that the preselection of subjects with frequent fish consumption increased the likelihood of collecting a meaningful number of samples over a 1-week period. A similar study with a randomly selected study sample would be less likely to provide adequate representation of infrequent consumers.
Haxton et al. (1979) conducted a 1-week duplicate-diet study with 174 subjects selected from fishermen and their families in coastal communities to obtain a population with high fish-consumption rates. No simultaneous diaries were kept, but the characteristic intake for each individual was identified from pre-collection interviews. No estimate of the completeness of the duplicate-diet collection was provided. However, the authors noted that the measured weight of weekly fish intake from the duplicate-diet samples was lower than that calculated from the interviews, and all measured intakes were below the calculated mean intake. The authors suggested that the discrepancy resulted from misidentification of characteristic intake in the interviews rather than from undercollection of dietary samples. No data are provided to support that assertion. As with the Sherlock et al. (1982) study, the preselection of subjects with frequent fish consumption made the relatively short collection period feasible.
Multiple-day food records (food-consumption diaries) are often used in conjunction with duplicate-diet studies ( Sherlock et al. 1982, Thomas et al. 1997). This method, if conducted appropriately, has the advantage of recording information prospectively with little reliance on recall. It also requires less effort from participants than the duplicate-diet approach. However, daily recording of foods eaten at each meal requires a continuous and significant time commitment. Because fish are consumed relatively infrequently, the duration of the recording period might require many weeks to adequately capture infrequent consumers as well as variability in consumption among more frequent consumers. Furthermore, the design must be such that possible seasonal patterns of
consumption are observable. The determination of the mass of food consumed when using food-consumption diaries can be made by weighing samples or by participants' estimating portion size. The former is preferable but more invasive, especially when foods are consumed away from home. Participants' estimation of portion size introduces a degree of measurement error not seen with duplicate-diet methods. Furthermore, if the diary approach is used without duplicate-diet collection, analysis of Hg concentration in each fish meal consumed cannot be made directly but must be based on the characteristic Hg concentration in each reported species. Such studies must, therefore, rely on participants for correct identification of species. Incorrect species identification can lead to errors in estimation of MeHg intake. Consumers, as well as the markets from which they purchase fish, might not know or correctly identify the species that was bought and consumed.
The data from the Continuing Survey of Food Intake by Individuals (CSFII) generated by the U.S. Department of Agriculture from 1989 to 1995 rely on self-administered food consumption diaries for the second and third days of its 3 days of reporting (discussed in EPA 1997). The CSFII data have been used by the U.S. EPA to estimate fish consumption in the U.S. population (Jacobs et al. 1998) and to estimate MeHg intake (EPA 1997). The National Purchase Diary conducted by the Market Research Corporation used dietary diaries over 1-month periods between 1973 and 1974 (discussed in EPA 1997). The fish-consumption portions of these diary data were used to estimate MeHg exposure in the U.S. population (Stern 1993, EPA 1997).
Retrospective dietary-assessment methods are simpler and less expensive than prospective and duplicate-diet methods, and therefore are used more often as the basis of dietary exposure assessments. Food-frequency studies take the form of participants identifying their typical fish consumption (e.g., “How many times per week/month do you usually eat fish A?”). Diet histories involve recollection of specific meals over a specific time (e.g. 24-hr or 1-week periods). In the studies mentioned above, Sherlock et al. (1982) and Haxton et al. (1979) used retrospective assessment of typical consumption to preselect subjects. In a recent study of MeHg exposure among pregnant women in New Jersey (Stern et al. 2000), participants were asked to identify their typical consumption frequency and typical portion size of 17 species of fish and
fish dishes (e.g., fish sticks). MeHg intake was estimated as the product of the characteristic MeHg concentration for each fish species, the self-reported yearly frequency of consumption, and the self-reported average portion size. The yearly MeHg intake estimated in that manner was poorly correlated with the Hg concentration in hair from the same individuals. The authors attributed the discrepancy to the relatively infrequent consumption of fish in general. Therefore, the hair segments might have been too short to provide an adequate sample of the yearly intake. Uncertainty in the reporting of characteristic consumption frequency and portion size was also suspected as a contributing factor to the poor correlation.
The usefulness of studies using dietary recollection over a specific period depends on the participants' ability and willingness to recall information about fish meals over the target period. Recall of fish consumption seems to be much better than recall of other dietary items or of food intake in general. However, short-term recall methods of dietary assessment will tend to underrepresent the consumption characteristics of infrequent consumers (Whipple et al. 1996; Stern et al. 1996). If the species of fish (and thus the characteristic Hg concentration in the fish) consumed by frequent and infrequent consumers differ, or if the average portion size consumed by each group differs, the estimate of MeHg intake in the overall population will not be accurate.
The CSFII data used by EPA to estimate fish consumption (Jacobs et al. 1998) and MeHg exposure (EPA 1997) nationally are, as noted above, based on 1 day of recall and 2 succeeding days of diary entries. The National Health and Nutrition Examination Surveys (NHANES III) dietary data, generated from 1-day recall, were also used by the EPA to generate estimates of MeHg in the U.S. population (EPA 1997). Stern et al. (1996) used data from a fish-consumption-specific telephone survey of New Jersey residents. The survey elicited a 7-day recall. Relatively short-term recall studies can miss long-term patterns of variability in consumption and might not adequately capture consumption patterns of infrequent consumers. To address those issues, information on respondents' usual frequency of fish consumption was also elicited. That information allowed identification of infrequent consumers of fish in the sample. The information was used to investigate reweighting of the data to estimate the distribution of consumption frequency represented
in a hypothetical 1-year recall study. Interestingly, the reweighting of the data using several different approaches resulted in only minor differences in estimates of fish consumption and MeHg exposure.
Retrospective dietary data and diary data on fish consumption have frequently been used to stratify a study population into broad classes of MeHg intake before more quantitative estimation of exposure by measurement of Hg in biomarkers. Such data have also been used to provide a rough validation of biomarker analyses (e.g., Dennis and Fehr 1975; Skerfving 1991; Grandjean et al. 1992; Holsbeek et al. 1996; Vural and Ünlü 1996; Mahaffey and Mergler 1998). Less frequently, retrospective and diary data on fish consumption are used directly in quantitative estimations of MeHg exposure (Buzina et al. 1995; Stern et al. 1996; Chan et al. 1997). Such estimates, however, generally require species-specific Hg concentrations (microgram of Hg per gram of fish), which are combined with the reported consumption frequency (grams of fish per day), to yield an Hg intake rate (micrograms Hg per day). The assignment of species-specific concentration data is a potential source of error in such studies for several reasons. First, the identity of the species on the part of the retailer or the consumer is often ambiguous. Second, Hg concentrations characteristic of a given species in local and regional markets or waters might differ from the characteristic concentrations identified on the basis of nationwide sampling. Finally, characteristic Hg concentrations derived from data that are often decades old might not be valid today.
In the United States, data on Hg concentration in commercial fish are largely available from two sources: (1) the National Marine Fisheries Service (NMFS) study, which sampled fish that were intended for human consumption and which were landed in the United States in the early to mid-1970s (Hall et al. 1978); and (2) the U.S. Food and Drug Administration (FDA) sampling conducted in the early 1990s (FDA 1992). Both data bases represent samples of fish collected from landings and markets in various parts of the United States but do not identify the locations at which samples were obtained or sold. The NMFS data were collected more systematically, represent more species, and generally contain considerably more samples for each species than the FDA data. However, the FDA data are about 20 years more recent than the NMFS data. Analysis of species represented in both data bases by at least three samples (n=15) indicates that, in almost all cases, the Hg concentration
reported by FDA in a particular species is significantly lower than the concentration reported by NMFS. The most likely explanation for the discrepancy is the decreased availability of large fish due to overfishing (Stern et al. 1996). Those data cannot be used, therefore, to reflect potentially important local or regional differences in the characteristic concentrations of Hg by species. Studies addressing smaller populations with fewer varieties of fish (e.g., Buzina et al. 1995) can generate population-specific estimates of Hg concentrations by species. Given the variability in concentration within species, the assignment of a single representative value of Hg concentration is another potential source of error in such studies. The NMFS data base provides no estimate of such variability in U.S. commercial supplies. The FDA data base provides concentration ranges as well as average concentrations by species, but the ability to assess intraspecies variability in Hg concentration is limited by the generally small sample sizes. A study of Hg concentration in canned tuna (Yess 1993) indicates coefficients of variation of 55-120% across the several types of tuna commonly sold in cans. In general, sparse data on fish from commercial sources in the United States (FDA 1992) and data on food fish from noncommercial sources (e.g., Schuhmacher et al. 1994; Castilhos et al. 1998) often show a 2-3-fold difference between the mean and the maximum concentrations of Hg. Interspecies variability can be considerably larger. When data are available on intraspecies variability in MeHg concentrations, the variability can be integrated into estimates of intake through Monte Carlo probabilistic analysis (Chan et al. 1997). Intraspecies variability in Hg concentration might be less of a source of error in studies of frequent consumers of that species. With repeated consumption of a species of fish, total MeHg intake by consumers will approach the average concentration in that species. However, for populations with infrequent or sporadic consumption of a species, the effect of ignoring intraspecies variability in Hg concentrations could be significant.
BIOMARKERS OF EXPOSURE
MeHg lends itself to assessment of exposure through direct measurement in blood and hair. Assessment of Hg exposure through analysis of nail clippings has also been done (Pallotti et al. 1979; MacIntosh et al.
1997), but its correlation with fish consumption has yet to be clearly established. Hg exposure through breast milk has also been investigated (Pitkin et al. 1976; Fujita and Takabatake 1977; Skerfving 1988; Grandjean et al. 1995; Oskarsson et al. 1996). Compared with whole blood, breast milk (which is derived from maternal plasma) contains a much higher proportion of inorganic Hg (Skerfving 1988; Oskarsson et al. 1996). Therefore conclusions regarding the exposure of infants to MeHg from breast milk should use MeHg-specific analysis. Finally, there have been no reports of measurement of Hg in the fetal brain, the ultimate target of MeHg developmental neurotoxicity, although Cernichiari et al. (1995a) reported on a small set of measurements of Hg in infant brain.
The relationship among the several possible indicators of exposure is shown in Figure 4-1. Some of the indicators, such as the biomarkers of hair and blood Hg concentration, are commonly measured directly, whereas others, particularly fetal brain Hg concentration, are assumed to be correlated with the directly measured quantities. For the purposes of risk assessment, biomarker concentrations of MeHg serve two functions. First, a biomarker concentration is used as a surrogate for the unknown biologically relevant dose of MeHg in the developing fetal brain. That permits the development of a “dose”-response relationship in which the dose is represented by the biomarker concentration. Second, once such a dose-response relationship has been established, the biomarker concentration identified as the critical (e.g., benchmark) concentration must be translated into an estimate of the ingested dose. At that point, public-health interventions and regulatory measures can be guided by that estimate. The translation of the biomarker concentration to the ingested dose involves the use of toxicokinetic modeling to recapitulate the steps that precede the measured biomarker compartment in Figure 4-1 (see Chapter 3).
Methylmercury in Blood
The detection limit for total Hg in blood is generally in the range of 0.1 to 0.3 µg/L (ppb) (Grandjean et al. 1992; Girard and Dumont 1995; Oskarsson et al. 1996; Mahaffey and Mergler 1998). The mean concentration reported in U.S. studies in which high-fish-consuming populations were not specifically selected appears to be in the range of 1 to 5
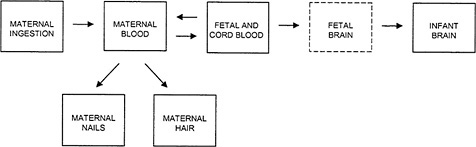
FIGURE 4-1Relationship among the various indicators of MeHg exposure. Maternal ingestion of MeHg refers to the ingested dose, the magnitude of which depends on the amount of fish consumed and the concentration of MeHg in the fish. The concentration of Hg measured in the maternal blood, fetal blood, cord blood, maternal nails, and maternal hair are all biomarkers of exposure. Concentrations of Hg in the fetal brain, if available, would be considered the effective dose. (Note: The Fetal Brain box is shown with a dotted line because no direct data are available on Hg concentrations in the fetal brain.)
µg/L (Humphrey 1975; Brune et al. 1991; Nixon et al. 1996; EPA 1997; Kingman et al. 1998; Stern et al. 2000). Thus, current methods for blood MeHg determination appear to be adequate for fully characterizing population distributions of MeHg exposure and are, in practice, limited only by the volume of blood that can be obtained. Fish and other seafood, including marine mammals, are the only significant source of MeHg exposure (IPCS 1990). Therefore, the blood Hg concentrations in populations with little or no fish consumption should reflect exposure to inorganic Hg. The mean blood Hg concentration in such populations was reported to be about 2 µg/L (standard deviation (SD) = 1.8 µg/L) (Brune et al. 1991). Blood Hg concentrations in populations with high fish consumption are usually considerably higher than that value. For example, median cord-blood concentration in a cohort with high fish consumption in the Faroe Islands was 24 µg/L (Grandjean et al. 1992). Therefore, the measurement of the concentration of total Hg in blood is generally a good surrogate for the concentration of MeHg in blood in populations with high fish consumption. In populations with relatively low fish consumption, inorganic Hg concentration might constitute a larger fraction of total Hg concentrations. Therefore, for such popula-
tions, estimates of MeHg exposure from cord blood might be unreliable. Adult blood Hg concentration has frequently been used as a biomarker of adult MeHg exposure, and it has been used to assess dose-response relationships in adult neurotoxicity (e.g., Hecker et al. 1974; Dennis and Fehr 1975; Gowdy et al. 1977; Palotti et al. 1979; Skerfving 1991; Mahaffey and Mergler 1998). Cord-blood or maternal-blood Hg concentrations have also been used with some frequency in assessing exposure to the developing fetus (Dennis and Fehr 1975; Pitkin et al. 1976; Fujita and Takabatake 1977; Kuhnert et al. 1981; Kuntz et al. 1982; Sikorski et al. 1989; Grandjean et al. 1992; Girard and Dumont 1995; Oskarsson et al. 1996).
In assessing the appropriateness of a particular biomarker of exposure, it is important to consider three factors: (1) how well the biomarker of exposure (i.e., the concentration of Hg in hair or blood) correlates with the ingested dose of MeHg; (2) how well the biomarker of exposure correlates with the Hg concentration in the target tissue; and (3) how well the variability over time in the biomarker of exposure correlates with changes in the effective dose at the target tissue over time.
For developmental neurotoxicity, the target organ is the developing fetal brain. The kinetics of MeHg transport among compartments is subject to interindividual variability at each step, and therefore, the more closely a compartment is kinetically related to the target tissue, the more closely the concentration measured in that compartment is likely to correlate with the concentration in the target tissue. As shown in Figure 4-1, the fetal and cord-blood compartment is one compartment removed from the fetal-brain compartment. Thus, the cord-blood Hg concentration might be a reasonable surrogate for the biologically relevant dose to the fetal brain. Having determined a critical concentration of Hg in the blood, it is then necessary to back-calculate the ingested dose (micrograms of Hg per kilogram of body weight per day) corresponding to the critical concentration in blood (Stern 1997). Just as the kinetic proximity of the biomarker compartment to the target tissue increases the correlation between biomarker concentration and dose to the target tissue, the kinetic closeness of the biomarker compartment to the ingested dose will increase the correlation between the critical biomarker concentration and the estimated intake. The cord-blood Hg concentration is more closely linked to the fetal-brain compartment than
to the ingested dose. Maternal-blood Hg concentration is more closely linked to the ingested dose than to the fetal-brain compartment. Thus, with the use of blood as a biomarker of MeHg exposure, there is a trade-off between the precision in the derivation of the dose-response relationship and the precision in the estimate of the corresponding ingested dose.
The mean half-life of total MeHg in blood in humans is about 50 days (Stern 1997; EPA 1997), but much longer half-lives (more than 100 days) are observed. Blood Hg concentration, therefore, reflects relatively short-term exposures relative to the total period of gestation. However, the Hg blood concentration at any given time reflects both the decreasing concentration from earlier exposures and the increase in concentration from recent exposures. Individuals with frequent and regular patterns of fish consumption achieve, or approximate, steady-state blood Hg concentrations (IPCS 1990). At steady state, the daily removal of Hg from the blood equals the daily addition to the blood from intake. Under such conditions, an individual's blood Hg concentration at any given time provides a good approximation of the mean blood Hg concentration over time. For individuals with infrequent or irregular fish consumption, however, recent fish consumption will result in peaks in blood Hg concentration. A single blood sample showing an elevated concentration, without additional exposure information, does not provide a temporal perspective and does not permit differentiation between increasing peak concentrations, decreasing peak concentrations, and steady-state exposure. Conversely, a single blood sample obtained between peak exposures and showing a low blood Hg concentration provides no evidence of peak exposures. That result can introduce error into dose-response and risk assessment in adult populations in whom short-term peak exposures might be relevant to chronic toxicity. The blood Hg concentration can correlate well with the dose presented to the brain at the time of sampling, but such information cannot necessarily be extrapolated to dose at the target tissue at other times. A blood Hg measurement that might be adequate to reflect exposure over time can be determined to some extent by obtaining dietary intake data that corresponds to several half-lives preceding the Hg measurement. In assessing exposure and dose-response relationship in utero, the temporal considerations associated with the use of blood Hg concentration as a biomarker are further complicated by two additional factors: (1) the
fetal brain is developing during much of gestation and might not be equally sensitive to the MeHg during all periods; and (2) the half-life of MeHg in cord blood might not be the same as that in maternal blood.
As summarized by IPCS (1990) and Gilbert and Grant-Webster (1995), there are clear differences between fetal and adult MeHg neurotoxicity. However, few data provide specific information on the differences in sensitivity to MeHg developmental neurotoxicity across the fetal period. The existence of such differences can be inferred, however, from summaries of experimental animal data presented by Gilbert and Grant-Webster (1995) and ATSDR (1999). The timing of maternal dosing in these studies was generally not chosen to relate differences in effect to specific stages of neurological development; therefore, it is difficult to infer specific information about developmental periods of specific sensitivity in the human fetus. It is assumed that there are windows of vulnerability to MeHg during neurological development (Choi 1989), and specific types of developmental effects (e.g., motor and cognitive) might have separate windows of vulnerability. In general, the embryonic period of development (fewer than 4 weeks of gestation), when there is no brain per se, might show little sensitivity to MeHg developmental neurotoxicity. Fetal stages during which the structure of the brain is forming are the periods in which the broad abnormalities in brain architecture, most characteristic of MeHg developmental neurotoxicity, are likely to occur. MeHg exposure during late fetal development, when brain structure is basically established, is likely to produce more function-specific effects on brain architecture. Even within early-to-middle fetal developmental stages, there might be discrete windows of sensitivity. As discussed above, the existence of such windows of sensitivity might have little practical significance if maternal MeHg intake does not vary substantially during pregnancy. However, individuals and populations with irregular patterns of MeHg intake will have peaks of exposure that might or might not occur during a window of vulnerability. If the half-life of MeHg in fetal blood is the same as in maternal blood (~50 days), the cord-blood MeHg concentration would be expected to reflect to some extent fetal exposures over about three half-lives (150 days) prior to delivery. That time (calculating backwards from birth) corresponds approximately to the second half of the second trimester and the third trimester. However, the cord-blood concentration would be most heavily influenced by exposures during
the most recent half-life, which corresponds to the last half of the third trimester. If that period is not critical for MeHg neurological developmental toxicity, dose-response assessments conducted using cord-blood Hg might lead to misclassification of exposure.
Because the fetus (and presumably the infant) has no independent mechanism for excreting or metabolizing MeHg to mercuric mercury (Grandjean and Weihe 1993), any elimination of Hg by the fetus will be by passage across the placenta to the maternal blood. Therefore, if the fetus does not have a specific affinity for MeHg, the half-life of MeHg in the fetal blood will be the same as that in the maternal blood, and the ratio of MeHg in the fetal blood to the maternal blood will be 1.0. However, Dennis and Fehr (1975), Pitkin et al. (1976), and Kuhnert et al. (1981), as well as additional studies cited by the latter two studies, found the concentration of Hg to be about 20-30% higher in cord blood than in maternal blood. On the other hand, Kuntz et al. (1982) and Sikorski et al. (1989) found a ratio close to 1.0. If the Hg concentration in cord blood is 20-30% higher than that in maternal blood (because of a longer half-life in fetal blood), the cord-blood Hg concentration would be more influenced than the maternal-blood concentration by exposures during the latter portion of the second trimester and the first half of the third trimester.
Methylmercury in Hair
In contrast to adult blood sampling, hair sampling is noninvasive and can be done without medical supervision. Although cord-blood collection is also essentially noninvasive, the logistics of its collection can be difficult. Hg concentration in hair is often used to estimate exposure to MeHg. In some studies, hair and blood Hg are measured for comparison. More often, hair is used as the sole biomarker of exposure. Using the standard cold-vapor analytical techniques, the detection limit for total Hg in human hair is generally reported to be in the range of 0.01 to 0.04 µg/g hair (e.g., Airey 1983; Bruhn et al. 1994; Lópes-Artiguez et al. 1994; Holsbeek et al. 1996; Gaggi et a1.1996; Stern et al. 2000). Few studies have reported on hair Hg concentrations in U.S. populations that were not specifically selected for high fish consumption. Among these, the mean hair Hg concentration appears to be in the range of 0.3 to 1.0
µg/g (Smith et al. 1997; EPA 1997; Stern et al. 2000). Thus, the sensitivity of the standard methodology should be adequate to characterize population distributions of MeHg exposure in the United States. Among individuals, whose hair Hg concentrations are presumed to reflect inorganic Hg exposure because of little or no fish consumption, hair Hg concentrations are reported to be in the range of 0.2 to 0.8 µg/g (Pallotti et al. 1979; Grandjean et al. 1992; Oskarsson et al. 1994; Bruhn et al. 1994; Batista et al. 1996; Smith et al. 1997). Populations selected for dose-response analysis on the basis of high fish consumption generally have considerably higher hair Hg concentrations (e.g., the mean maternal-hair Hg concentration in the Seychelles main study cohort was 6.8 µg/g (Cernichiari et al. 1995), and the median maternal-hair Hg concentration in the Faroes cohort was 4.8 µg/g (Grandjean et al. 1992)). Hair Hg concentrations that exceed those attributable to inorganic Hg exposure in fish-consuming populations must arise from MeHg exposure. Thus, the use of total hair Hg concentration in fish-consuming populations as a surrogate for hair MeHg concentration in fish-consuming populations should not lead to significant exposure misclassification.
Blood Hg concentration, unless supplemented by additional temporal exposure data, provides no clear information about the magnitude or timing of the exposures that yield the total Hg concentration observed in a given sample. In contrast, hair Hg concentration as a biomarker of MeHg exposure has the advantages of being able to integrate exposure over a known and limited time and recapitulate the magnitude and the timing of exposure. The ability to obtain such information from hair is predicated on two assumptions: that growing hair shafts incorporate Hg from the circulating blood in proportion to the concentration of Hg in the blood, and that hair shafts grow at a constant rate that does not vary significantly among individuals. The first of these assumptions is necessary to establish a quantitative relationship between hair Hg concentration and MeHg intake, the blood Hg concentration being an intermediate kinetic compartment. The second assumption is necessary to establish a relationship between location along the hair strand and time of exposure.
Although the proximal portion of the growing hair shaft is exposed to circulating blood for several days, that exposure appears to be indirect, as the shaft grows from a group of matrix cells located in the dermis, and these matrix cells are in direct contact with the capillaries
(Hopps 1977). Furthermore, the growing portion of the shaft is also in direct contact with sweat and sebum, both of which can contribute to the incorporation of trace elements into the shaft (Hopps 1977; Katz and Chart 1988). Therefore, measured concentrations of Hg in blood and hair can be separated, at least in part, by one or more kinetic compartments. Interindividual pharmacokinetic variability in these compartmental transfers could explain some of the scatter seen in plots of hair and blood Hg concentrations (e,g., Sherlock et al. 1982; Grandjean et al. 1992).
The growth rate of hair varies both within and among individuals. Among individuals, variations in hair-growth rate occurs because individual hair follicles experience a cycle of growth, transition, and terminal resting (Katz and Chatt 1988). Direct incorporation of trace elements, including MeHg, into the hair occurs only during the growth phase. The growth phase is the longest phase, although for scalp hair (the hair commonly used as an MeHg biomarker), estimates of the proportion of the total cycle during which growth occurs vary from 70% to 90% (Katz and Chatt 1988). In humans, individual hair follicles have independent growth cycles (Hopps 1977), and given the predominance of the growth portion of the follicle's life cycle, a sample of multiple hairs largely reflects hair that was recently incorporating MeHg. However, such a sample potentially has 10% to 30% of its follicles in the terminal resting phase. The Hg concentration in such follicles reflects less-recent exposure than that reflected by follicles in the growth phase. That difference can lead to exposure misclassification for the period of interest. The potential for exposure misclassification due to collection of follicles in the terminal resting phase is a particular concern in single-strand hair analysis for Hg. That analysis implicitly assumes that a point on a hair strand at a given distance from the scalp corresponds to the same point in time on all other strands from that individual.
There appears to be significant interindividual variability in hair-growth rate. An average growth rate of 1.1 centimeters (cm) per month for scalp hair is commonly assumed (Grandjean et al. 1992; Cernichiari et al. 1995; Boischio and Cernichiari 1998). However, Katz and Chatt (1988) characterize hair-growth rates as highly variable and dependent on age, race, gender, and season. They provide a summary of studies of hair-growth rates expressed as ranges. Interstudy values typically range from 0.6 to 1.5 cm per month, but ranges of 2.3 to 3.4 and 3.3 ± 0.6 cm per
month are also reported. Thus, a 9-cm length of maternal hair intended to correspond to approximately 8 months of gestation (assuming a hair-growth rate of 1.1 cm per month) could correspond to a period of 6-15 months (assuming a growth rate of 0.6 to 1.5 cm per month). There is also evidence of intraindividual variability in hair-growth rates (Giovanoli-Jakubczak and Berg 1974). Furthermore, during pregnancy, the rate of hair growth slows slightly (approximately 7% during the second trimester), and the interindividual variability in growth rate appears to increase (Pecoraro et al. 1967), thus adding to the temporal uncertainty inherent in assessing MeHg exposure from hair analysis. In addition, the physical characteristics of the hair alter somewhat, and the percentage of thick hairs increases (Pecoraro et al. 1967). Those physical changes suggest that the uptake and binding of MeHg might be altered. Attempts to identify segments of hair corresponding to all or part of the period of gestation (Grandjean et al. 1992; Cernichiari et al. 1995) by using the average growth rate of 1.1 cm per month might include exposure data from unintended time periods or exclude exposure data from a portion of the intended period. The use of such misidentified segments can result in exposure misclassification in dose-response analysis.
An additional difficulty in identifying the segment of hair corresponding to the entire period of gestation or to any specific period of gestation is the location of the most recently formed portion of the hair shaft, which is below the scalp until pushed out by subsequent growth. To assign an exposure period to a segment of hair, a chronological benchmark on the hair strand is needed to relate measurements of length and time. The proximal end of the shaft, as it emerges from the scalp, is generally taken as such a benchmark, even though the hair is not cut exactly at the scalp level (Hislop et al. 1983). Because the hair below the scalp represents the hair formed at the time of sampling, the proximal end of the cut hair must be assigned a time of formation that accounts for the lag time between formation and sampling (Cernichiari et al. 1995).
Hislop et al. (1983) related the time course of MeHg elimination from blood and hair cut at the scalp with the assumption that the hair Hg concentration is proportional to the blood Hg concentration. The blood was sampled at regular intervals. The hair was sampled once and divided into 8-mm segments. The measurement of the hair-growth rate was 8 mm of growth per 20 days. The presence of a distinct maximal
concentration in the serial blood samples and the segmental hair analysis allowed calculation of the lag between equivalent concentration points in the blood and hair samples. The hair segment with the maximum Hg concentration was found to be offset from the appearance of the maximum concentration in the blood by 20 days. It should be noted that the 20-day estimate is based on a measurement of hair-growth rate specific to this study. Different characteristic hair-growth rates in different populations and variability in the growth rates among individuals in a population would yield different estimates of the time difference in hair and blood measurements. Because the concentration of Hg in the blood represented a precise time point but was compared with the average concentration in the 8-mm segment representing 20 days of exposure, the 20-day estimate is somewhat uncertain.
Cernichiari et al. (1995) attempted to further refine this estimate by assuming that the average concentration in the 8-mm segment is the concentration in the mid-point of the segment and by estimating the time at which that point on the strand appeared just above the scalp. The validity of that assumption is not clear, as there does not appear to be any justification for assuming that the average concentration in a hair segment necessarily represents the concentration at any specific point along that segment. Furthermore, it is not clear that an estimation of the time necessary for a given point along a hair strand to appear just above the scalp is particularly useful unless one is analyzing segments shorter than 8 mm. Grandjean et al. (1998) reported that the appearance of Hg in a hair strand above the scalp is delayed by about 6 weeks. That is more than twice the delay reported by Hislop et al. (1983). However, Grandjean and coworkers provide no specific data to evaluate their assertion.
As discussed for blood Hg analysis, temporal uncertainties might not be critical for individuals with steady-state MeHg concentrations. However, for individuals with variable or peak exposures that might occur at critical periods during development, the uncertainties in assigning a specific time during pregnancy to specific hair segments might result in significant misclassification of exposure.
Despite the potential for temporal misclassification of exposure, the potential for identifying the segment of hair corresponding to a specific period of gestation (and neurological development) has a distinct advantage over cord-blood analysis. However, analysis of Hg concentration
in any given segment of a hair sample will yield only the average exposure over the corresponding time period. Details of exposure within that time period, including peak exposures, will not be elucidated except as they influence the overall average concentration within a segment. As an illustration, consider a 3-cm-long segment of maternal hair (the hair samples analyzed in the Faroe Islands study were generally 3 cm in length (Grandjean et al. 1998) corresponding to approximately 3 months of exposure and intended to correspond to a given trimester of pregnancy. Assume that during that time period, the individual contributing the hair consumed several fish meals high in Hg in close succession and achieved a peak hair concentration that was double the steady-state concentration before consumption of the fish. Assume further, that MeHg is removed from her blood following first-order decay kinetics (IPCS 1990) with a half-life of 50 days (Stern 1997). It can be calculated that (even if blood and hair Hg concentrations are perfectly correlated) the Hg concentration detected in such a hair segment would be only 20% higher than the concentration in the segment before the high-Hg fish consumption. That small observed increase occurs because the rise and return to background of the Hg-concentration peak occurs over a shorter time period than the exposure period represented by the entire 3-cm hair segment. Therefore, the average segment concentration reflects the dilution of the peak concentration by the adjacent stretches of background concentration in the segment. The true peak concentration, representing a doubling in exposure, would likely be identified as a significant increase in exposure if the concentration at that point could be measured, but it is not clear whether the observed 20% increase would be identified as a significant increase in exposure. Such an approach to segmental hair analysis would not give an accurate indication of the magnitude or duration of the peak concentration in the maternal or fetal blood. To some extent, the sensitivity to peak exposures can be increased by analyzing smaller-length segments of hair corresponding to narrower periods of exposure. Following the example above, a 1-cm (approximately 30-day) segment of hair containing the record of a peak doubling of exposure would be seen as an average increase of 50% above the steady-state background concentration. Such an increase is more likely to be recognized as significant but still does not provide a clear indication of the true peak concentration. If peak concentrations of fetal exposure are important to the elucidation of a
dose-response relationship, even the accurate identification and analysis of the segment of hair corresponding to a putative window of developmental sensitivity might result in exposure misclassification. Furthermore, practical considerations might prohibit increasing the number of analyses that would be required for the analysis of shorter hair segments. Despite those limitations, hair samples have the potential to provide temporal information on Hg exposures.
An alternative to segmental hair analysis is continuous single-strand hair analysis using x-ray fluorescence (XRF) (Marsh et al. 1987; Cox et al. 1989). This nondestructive method involves measurement along the length of the strand. It is not truly continuous because determinations are made on consecutive 2-mm segments. Assuming a mean hair-growth rate of approximately 1.1 cm per month, 2 mm corresponds to about 6 days of growth. Assuming first-order decay kinetics, a peak concentration on a single day would decrease by only 8% during this 6-day averaging period. Thus, single-strand analysis will give a much finer picture of exposure peaks than individual segmental hair analysis. In addition, as illustrated in Cox et al. (1989), single-strand analysis avoids errors in the alignment of multiple strands, which will tend to flatten and broaden peaks. Localization of portions of a hair strand corresponding to a given period of gestation, however, is still subject to uncertainty arising from variability in hair-growth rate. In addition, as discussed above, analysis of individual strands in terminal resting phase will give misleading estimates of the exposures corresponding to any time period. For 45 individuals in the Iraqi poisoning, Cox et al. (1989) compared the maximal concentration in two hair strands from the same individual. The overall correlation was good, and the peaks in the Iraqi poisoning episode were distinct and easily identifiable, thus reducing the error in comparing corresponding points in each analysis. Furthermore, it appears that the correlation was based on matching the value rather than the location of the peak in each strand. Thus, this determination does not necessarily address the errors inherent in the temporal calibration of hair strands or in the selection of hair strands in the terminal resting phase. In the Cox et al. (1989) analysis, a few of the residual errors in the comparison between concentrations on alternate strands appear to be on the order of 25%. Such observations might reflect errors in temporal calibration. Continuous single-strand analysis allows the investigation of multiple plausible dose metrics in dose-response analy-
sis. Those metrics include peak concentration in a specific trimester, peak concentration at any time during gestation, average peak concentration, average concentration during a specific trimester, and average concentration during the entire gestation. Overall, single-strand hair analysis by XRF appears to be a powerful tool with the distinct advantage of being able to determine short-term changes in exposure, including peak exposures.
As is the case for blood Hg, the use of maternal hair Hg as a dose metric in the derivation of a reference dose for effects of MeHg on neurological development requires that the hair Hg concentration be used in two separate determinations. The first determination is the derivation of a dose-response relationship between hair Hg concentration and effects. The second determination is the estimation of the MeHg ingested dose that corresponds to the critical Hg concentration in hair identified in the dose-response relationship. In the first determination, the maternal-hair Hg concentration is a surrogate for the unknown dose to the fetal brain. In the second, the critical Hg concentration is used in a pharmacokinetic model to back-calculate the ingested dose.
Comparison of Biomarkers of Exposure
As shown in Figure 4-1, the fetal brain is one kinetic compartment further removed from hair Hg than from cord-blood Hg. Therefore, for the somewhat uncertain period of gestation represented by the cord-blood Hg concentration, the fetal-brain Hg concentration would be expected to correlate more closely with the cord-blood Hg concentration than with the maternal-hair Hg concentration. Cernichiari et al. (1995a), however, presented data comparing the correlations of maternal-hair and infant-brain Hg concentrations, and infant-blood and infant-brain Hg concentrations measured from autopsy samples. The hair samples were collected at delivery, and represent a period of approximately 20 days before delivery. The correlation of maternal-hair and infant-brain Hg concentrations (r = 0.6-0.8, depending on the specific brain region) was generally comparable to the correlation of infant-blood and infant-brain Hg concentrations (0.4-0.8). That finding suggests that, as predictors of Hg concentration in the infant brain, maternal hair and infant blood might have equal validity. However, the error of the regression
slope of infant-brain Hg to maternal-hair Hg is about 3-6 times the error of the slope of infant-brain Hg to infant-blood Hg (although the coefficient of variation for the brain-hair relationship is smaller than that for the brain-blood relationship) (Stern and Gochfeld 1999; Davidson et al. 1999). Perhaps more important in considering the relevance of those comparisons to the choice of dose metric for reference-dose development is the fact that Cernichiari et al. (1995a) examined the correlation between maternal hair and infant brain rather than between maternal hair and fetal brain. Likewise, infant blood rather than cord blood was compared with infant brain. Cernichiari et al. (1995a) do not give the age of the infants in this study, but postnatal infant brain cannot be considered identical to fetal brain, especially since the fetal brain changes substantially during development. Although the vulnerable periods for MeHg effects on neurological development are unknown, they might occur much earlier in gestation than the perinatal period. Furthermore, infant blood is not necessarily comparable to fetal blood due to the ongoing replacement of fetal hemoglobin with adult hemoglobin. At birth, fetal hemoglobin constitutes about 75% of total hemoglobin, but after about 50 days, it constitutes only about 50% of the total (Lubin 1987). Therefore, it is not clear to what extent these observations elucidate the relationship of fetal-brain to either cord-blood, or maternal-hair Hg concentrations.
For the back-calculation of the average ingested dose corresponding to a given biomarker critical concentration, the maternal-hair Hg compartment and the cord-blood Hg compartment are equally distant kinetically from ingestion (see Figure 4-1). The estimation of the ingested dose corresponding to a critical biomarker concentration requires the intermediate estimation of the corresponding maternal-blood Hg concentration. Although no study was found that specifically supplies data on the variance inherent in the ratio of cord-blood to maternal-blood Hg concentrations, the ability of MeHg to pass freely through the placenta (IPCS 1990) suggests that there might be interindividual variability in the extent of transfer of MeHg between the cord-blood and maternal-blood compartments. As discussed above, the mean cord-blood/maternal-blood Hg ratios reported for several populations differed by 20-30% at most. For maternal-hair Hg, the few studies reporting data on the variance in the maternal hair /maternal-blood Hg ratio within a given study population give widely differing coefficients of
variation (Stern 1997). The mean maternal-hair/maternal-blood Hg ratios reported for different population groups can differ at most by a factor of about 2, although nearly all observations fall within approximately 20% of the overall mean of the various observations (Stern 1997; ATSDR 1999). Nonetheless, when the estimation of the ingested dose from a critical concentration in hair is carried out probabilistically and interindividual variability in the various pharmacokinetic inputs is taken into account, sensitivity analysis reveals that the maternal-hair/maternal-blood ratio is one of the key contributors to the variability in the predicated ingested dose (Stern 1997; Clewell et al. 1999).
Overall, in comparing maternal hair and cord blood as possible biomarkers of in utero MeHg exposure, each has significant advantages and disadvantages. At least conceptually, cord blood is kinetically more closely linked to the fetal brain-target and could, therefore, yield a more precise dose-response relationship if the critical period for toxicity coincides with the time period reflected in the cord-blood Hg measurement. However, the cord-blood Hg measurement is not capable of providing information about the specific patterns of exposure during gestation and does not reflect exposure over a clearly delineated period of gestation. In addition, cord blood is not capable of providing information about variability in exposure, even for the time period it most directly reflects. Simple maternal-hair analysis can provide information about average exposure over the entire period of gestation but provides no information about variability in exposure during that period. Identification of the specific portion of a hair strand corresponding to all of gestation is uncertain and is a potential source of exposure misclassification. In addition, maternal-hair Hg concentration is kinetically more distant from the fetal brain than is cord-blood Hg. Segmental hair analysis has the potential to provide information about exposure during specific portions (e.g., trimesters) of gestation, but uncertainties related to hair-growth rate make the identification of segments corresponding to periods as short as a single trimester uncertain. Although segmental hair analysis can provide some information about variability in exposure during different periods of gestation, it is of limited use in identifying either the magnitude or the duration of peak exposures. Continuous single-strand hair analysis, on the other hand, can provide precise information on peak exposures and thus permits the investigation of several different dose metrics in dose-response assessment. This ap-
proach is potentially the most powerful for investigation of dose-response relationships. However, single-strand analysis is still hampered by uncertainty in assigning specific periods of gestation to a given section of hair strand. The utility of cord blood and hair as biomarkers of MeHg exposure can be substantially improved by linking them to accurate dietary intake information. Data on frequency, amount, and type of fish consumption in the period during and immediately preceding pregnancy can provide information on the overall variability in exposure as well as on peak exposures. Furthermore, accurate dietary information can provide benchmarks for the temporal calibration of both cord blood and hair Hg data. Recognizing that each of the available metrics provides different and complementary information, the most useful and powerful approach to exposure and dose assessment for MeHg is the collection of comparable dietary, cord-blood and single-strand hair data.
ANALYTICAL ERROR IN BIOMARKER MEASUREMENTS
In comparing the outcomes of the Faroe Islands, Seychelles, and New Zealand studies, it is important to consider the relative analytical errors in the measurement of the biomarker of exposure among those studies. Unfortunately, the reporting of such data in those studies is inconsistent and incomplete. The Seychelles study analyzed only maternal hair. Several analytical methods were used for various purposes in that study, the dose-response analysis used hair Hg concentration determined by cold vapor atomic absorption (CVAA). Although determinations were carried out to compare CVAA results with those from a reference method (counts of exogenously applied 203Hg) (Cernichiari et al. 1995), no summary statistics of the comparison are provided. Results of an interlaboratory comparison of CVAA determinations of hair Hg concentration are reported (Cernichiari et al. 1995), and 100% of all samples analyzed were less than or equal to ± 2 standard deviation (SD) of the target value. The nature of the target value is not, however, discussed. The reporting of analytical quality-control data in the Faroe Islands study is somewhat confusing, because different analytical methods were used at different times for hair and blood, and various analyses were carried out in different laboratories (Grandjean et al. 1992). It appears,
however, that all hair Hg analyses used in the dose-response analyses were carried out in the laboratory of the Seychelles study group (i.e., University of Rochester) using CVAA. Presumably then, the analytical errors in the analyses of hair Hg concentrations in both studies are highly comparable. It appears that all cord-blood Hg analyses used for dose response were carried out in the laboratory of the Faroe Islands group (i.e., Odense University) using ultraviolet (UV) absorption spectrometry. The accuracy of this method was determined relative to four reference samples of trace metals in blood. For the sample with a reference Hg concentration of 9.9 µg/L, the mean reported value was 9.9 µg/L (0% difference). For the three reference samples with much larger Hg concentrations (98, 103, and 103 µg/L), the percent difference between the mean reported values and the reference value was +13.0%, +11.2%, and +10.0%, respectively. The authors report that all the reported values were within the “acceptable range,” although this range is not further defined. Analytical imprecision (coefficient of variation for repeated analyses of the same sample) for the first three of those four reference samples ranged from 7.0% to 14.1%, the lowest concentration having the largest imprecision. The New Zealand study generated data only on hair Hg concentration (Kjellstrom et al. 1986, 1989). The reporting of analytical quality control data from the New Zealand study is somewhat complicated because the study was carried out in two stages. During the first stage, no reference samples were available. Reference samples were available for the second stage of the study, and samples from additional mothers were analyzed for that stage. For the most part, however, it appears that samples analyzed during the first stage of the study were not re-analyzed during the second stage. Given the lack of reference samples during the first stage of the study, analytical quality during that stage was based on interlaboratory comparison. Sixteen samples analyzed by CVAA in the laboratory of the New Zealand study group (i.e., University of Auckland) (reporting Hg concentrations of more than 10 ppm) were re-analyzed by CVAA at the University of Rochester. The percent difference (sum of absolute values) for 13 of those samples was 22.8%; 62% of University-of-Auckland values were smaller than the corresponding University-of-Rochester values. The values for the remaining three samples were grossly different. When those three samples were re-analyzed by the University of Auckland, a much closer agreement with the University-of-Rochester values was
achieved. This raises some concern. In the second stage of the New Zealand study, 12 reference samples of hair were analyzed and the results compared with the maximum acceptable deviation (MAD) which was defined as (true valueppm ± (10% of true value ± 1 ppm)). The basis for that metric is not entirely clear. The regression line for the reported values versus the true values was found to lie completely within the MAD lines. Some individual values, however, were marginally outside the MAD lines, and the regression line was biased toward reported values underestimating reference values.
In summary, given the nature of the reporting of the quality-control data in these three studies, it is difficult to assess the analytical error inherent in the biomarker concentrations and ultimately in the dose-response relationships. It is also difficult to quantitatively or qualitatively compare the extent of analytical error in these studies. Some concern, however, is warranted with respect to the analytical error inherent in the New Zealand study. The extent to which that error might affect the interpretation of the dose-response relationship based on the New Zealand study is not clear.
EXPOSURE AND DOSE ASSESSMENT IN THE SEYCHELLES, FAROE ISLANDS, AND NEW ZEALAND STUDIES
Exposure in the Seychelles studies was measured as total Hg in maternal-hair samples. Other biomarkers of exposure were not investigated. Cernichiari et al. (1995) reported that the majority of mothers in the study provided at least two hair samples. The first sample was obtained at delivery, and the second, 6 months after delivery. In the first sample, the hair was cut at the scalp, and the proximal 9 cm was used for Hg analysis. A growth rate of 1.1 cm per month was assumed, and therefore a 9-cm segment of hair corresponded to 8.2 months of gestation. The hair representing the last month of gestation was assumed to lie beneath the scalp at the time of sampling. In the second sample, a segment of hair intended to correspond to the same time period as the first sample of hair was identified by assuming a 1.1 cm per month growth rate. Cernichiari et al. (1995) presented a scatterplot of the correspondence of the mean Hg concentration in those two samples. Regression statistics were not supplied, but the regression slope was
reported to be insignificantly different from unity. There is, however, significant scatter around the regression line, and the data are not symmetrical at the line of equality. The most likely explanation for the scatter and asymmetry appears to be intraindividual variability in hair-growth rates. It is not clear whether the Hg concentration from one of the samples or the average concentration of both samples was used as the actual dose metric in the dose-response assessment. Hair samples from 86% of the main cohort were also divided into segments intended to represent the three trimesters of pregnancy. The average Hg concentration in each of the segments was compared with the average concentration in the complete 9-cm segment. The correlations (r) were all similar and ranged from 0.85 to 0.91. In addition, intercepts were each close to zero. The general comparability of each of the segmental average Hg concentrations to the total average Hg concentration suggests that intake did not vary greatly by approximate trimester for the cohort as a whole. Potential seasonal variations in Hg exposure would not likely be detectable in such an analysis because the cohort was not in synchrony with respect to the onset of gestation. In considering individual variability, the overall strong correlations notwithstanding, a considerable number of outliers can be seen in the scatterplots of these trimester comparisons, particularly in the assumed third-trimester segment. Those outliers suggest that some individuals might have had significant variability in exposure over the course of gestation. As discussed previously however, such analyses are relatively insensitive to short-term peaks in exposure. More specific information about intraindividual exposure variability or peak exposures cannot be deduced from these data. Data from this segmental analysis was not used in dose-response assessment.
Dietary information was obtained from the Seychelles cohort 6 months after delivery (Shamlaye et al. 1995). The extent to which this survey included the entire cohort is not reported. A median fish consumption of 12 meals per week, as well as some additional population percentiles of fish consumption, was reported. Those data, however, reflect self-reported average intake and do not provide information on variability in fish intake during pregnancy. In addition, although data on characteristic Hg concentrations for commonly consumed species of fish were generated (and included some species with relatively high characteristic Hg concentrations) (Davidson et al. 1998), data on con-
sumption by species does not appear to have been collected. Thus, dietary data in the Seychelles studies cannot be used to suggest the extent to which individual exposure was variable or peaked during pregnancy.
In the Faroe Islands studies, exposure was measured by the concentration of Hg in maternal hair obtained at delivery and by cord-blood Hg concentration (Grandjean et al. 1992). The collection and analysis of the cord blood appears to be standard. However, the hair samples analyzed were not of uniform length and varied from 3 to 9 cm (Grandjean et al. 1999), thus reflecting exposure over variable times during gestation. As discussed above, cord-blood Hg concentration is influenced by exposure over an indeterminate time period, possibly including the latter part of the second trimester but weighted most heavily toward the latter part of the third trimester. Assuming a delay of about 20 days between incorporation of Hg into a growing hair strand and its appearance above the scalp, a 3-cm hair sample proximal to the scalp would reflect average exposure from the end of the second trimester to the second-third of the third trimester. A 9-cm hair sample would reflect average exposure beginning before conception. If, as asserted by Grandjean et al. (1998), the delay in appearance above the scalp of a section of a hair strand containing a given Hg concentration is 6 weeks rather than 20 days, the 3-cm hair segment would reflect exposure starting before the middle of the second trimester. Taking into account the apparent inconsistency in the length of the hair segments, as well as the inherent variability in hair-growth rates, the extent to which the hair and cord-blood MeHg concentrations reflect common exposures is uncertain. The correlation of hair and blood MeHg concentrations following log transformation (r = 0.78) was reasonably strong (Grandjean et al. 1998). However, it is not clear whether that correlation indicates consistency of the hair and blood measurements or it reflects little or no intraindividual variability in exposure during gestation.
Dietary exposure to MeHg in the Faroe population is complicated. The cohort generally consumed fish frequently; 48% ate fish dinners three or more times per week (Grandjean et al. 1992). However, the species of fish generally consumed were coalfish, ling, turbot, and salmon, which characteristically have relatively low concentrations of Hg (Grandjean et al. 1998). On the other hand, pilot whale is a traditional Faroese food that has considerably higher characteristic MeHg
concentrations (less than 1 to more than 3 ppm) (Grandjean et al. 1998). The availability of pilot whale meat is somewhat irregular, as the catch is opportunistic rather than systematic. In the Faroese cohort, 79% of the mothers reported in prenatal interviews that they ate at least one whale dinner per month, but only 27% reported eating three or more whale dinners per month (Grandjean et al. 1992). It should be noted, however, that these data do not provide information on portion size, and refer to dinners only. Grandjean et al. (1998) suggested that whale meat is also eaten at other meals and as snacks (dried). This incomplete dietary intake information makes assessment of variability in exposure difficult. Nonetheless, sporadic consumption of meals high in Hg is expected to result in temporal variability in exposure and possibly in peak exposure. Grandjean et al. (1992) reported on the results of analysis of Hg in multiple segments, each 1.1 cm long, from each of the six women in the Faroese cohort. Coefficients of variation (i.e., comparison among segments from the same individual) ranged from 8.1 to 23.8%. Although that suggests low-to-moderate intraindividual variability in MeHg intake over time, generalization to the entire cohort is not warranted because of the small sample size.
The relative magnitude of potential peak exposures from sporadic consumption of whale meat is possible to estimate. Assume that a pregnant woman consumes whale meals of 113 g each on 3 consecutive days when whale meat is available, and that her maternal-hair Hg concentration is 4.5 ppm (the median maternal-hair concentration in the Faroese cohort (Grandjean et al. 1992). Assume that pilot whale contains Hg at 3.3 ppm (Grandjean and Weihe 1993), and assume that absorption of MeHg from the gastrointestinal tract is 95% complete, that 5% of the ingested dose is distributed to the blood (IPCS 1990), and that the blood volume for a woman of child-bearing age is 3.6 L (Stern 1997). Ginsberg and Toal (2000) have shown that the one-compartment pharmacokinetic model for MeHg provides a reasonable approximation of the accumulation of Hg in hair for single exposures. Using the one-compartment model, therefore, assume that the rate constant for elimination of MeHg from the blood is 0.014 per day (equivalent to a half-life of 50 days) (Stern 1997). Finally, assume that the ratio of maternal-hair Hg concentration to maternal-blood concentration is 0.250 (µg/g)/ (mg/L) (IPCS 1990). Based on those assumptions, the one-compartment model predicts that the hair Hg concentration will increase by about 3.6 ppm to a
total concentration of 8.1 ppm and decrease to the baseline concentration (assuming no additional exposures above background) in about 6 weeks. Thus, this scenario of a fairly large intake over a short time period is predicted to result in a hair concentration that less than doubles the original concentration and returns to the original concentration all within a length of hair slightly greater than 1 cm.
The hair samples analyzed in the Faroe Islands study were generally 3 cm long (Grandjean et al. 1998) and thus represent a longer time period than that incorporating the entire rise and decline of such peaks. As discussed previously, the average Hg concentration in the 3-cm segment is a dilution of the peak value. With the moderate increases that might be represented by such peaks, it is unclear to what extent such peaks would have been discernable when averaged over the length of the longer segment.
In the New Zealand study (Kjellström et al. 1986, 1989), hair Hg concentration was the only biomarker of MeHg exposure used. Cord-blood samples were collected but were analyzed only for lead. Hair samples were obtained from all mothers in the original cohort shortly after delivery. The proximal 9 cm of the sample were analyzed for total Hg to give an average Hg concentration over that entire length. Those 9-cm average values were the dose metric used in the dose-response analyses. As discussed previously, the length of hair approximately corresponding to the last 20 days of gestation remained beneath the scalp, and (assuming a hair-growth rate of approximately 1 cm per month) the distal 1 cm of the 9-cm segment analyzed corresponded to the period preceding conception. In addition to the 9-cm sample of hair, when the mothers provided a sufficient quantity of hair, the sample was split, and another bundle of 9-cm length hair was sectioned into nine 1-cm segments. Analyses of the segments were carried out on samples from 47 of the 237 (19.8%) mothers in the second stage of the study (children at 6 years of age, (Kjellström et al. 1989)). A 1-cm segment of hair represents about 30 days of exposure. As discussed previously, a rapid doubling in Hg exposure during that period, such as that resulting from a few successive high-Hg fish meals, for a 1-cm segment would be reflected as a 50% increase compared with neighboring segments with no such peak exposures. Analysis of these segments would likely detect significant peaks in exposure but would not necessarily provide accurate information on the absolute magnitude of those peaks. Peak concentra-
tion was defined as the single largest excursion above the overall 9-cm average concentration. On average, the ratios of individual peak concentrations to the average 9-cm concentrations ranged between 1.4 and 1.6, the highest ratio (1.64) being in the group with hair Hg concentrations in the 6-10-ppm range. The group with the highest average hair concentration (at or above 10 ppm) had a ratio of 1.44. The largest individual ratio of peak-to-average concentration was 3.61, and the next largest value was 1.94. Those data do not permit an assessment of the number of peak exposures during gestation, but the range of average ratios is consistent with actual doublings in exposure at least once during gestation. Generalization to the entire cohort is difficult given the relatively small fraction for which segmental data were obtained. However, those data suggests that MeHg exposure in the New Zealand cohort might have been relatively spiky as opposed to constant and regular. It is interesting that the peak exposures were not regularly distributed across the period of gestation. The largest fraction of peak exposures (30%) occurred in the 9-cm segment most distal to the scalp, and 57% of the peak exposures occurred in the three distal-most segments. Only 19% of peak exposures occurred in the three segments most proximal to the scalp. The reason for the disparity is not clear, but it suggests that, at least for this subsample of the cohort, peak exposures might have been less common during the third trimester.
Information on fish consumption was obtained at about the same time as the hair sample through the administration of a questionnaire. The questionnaire requested information on the overall frequency of consumption of fish and shellfish. In addition, more detailed information on consumption frequency and portion size was obtained for specific fresh fish (lemon fish, snapper, gurnard, and “all other fresh fish”), canned fish (tuna, salmon, smoked, and “all other canned fish”), fish products (fish cakes and fish “fingers”), shellfish (oysters, scallops, mussels, and “all other shellfish”), and fried “takeaway” (i.e., fast food, fish-and-chips) fish. Although consumption of shark was not specifically queried, shark was stated to be a common source of takeaway fish. No data were provided on the characteristic Hg concentration in the species identified by the mothers. That lack precludes quantitative estimates of the contribution of individual species and eating patterns to possible peaks in exposure. In terms of overall fish consumption, 1.5% of mothers claimed daily fish consumption during pregnancy, and
consumption of fish “a few times a week” during pregnancy was identified by 19% of mothers. The most frequently identified fish-consumption category (32% of mothers) was “once a week.” Thus, about 53% of the mothers in the original cohort ate fish at least once per week. Therefore, although this population cannot be considered subsistence fish consumers, it is clear that fish constituted a significant fraction of the overall diet. Furthermore, such an overall consumption pattern, in which fish is eaten frequently, but not continuously, is consistent with the possibility of peak or spiky MeHg exposures. Among the possible choices of fish type, consumption of snapper was most closely correlated with hair Hg concentration. Information on the correlation between consumption and hair Hg concentration is not provided for any other species. It appears that additional information on those mothers who were likely to have experienced short-term peak exposures can be recovered from the questionnaire data, particularly from more detailed consideration of the frequency of takeaway fish. Further analysis of these data, therefore, might provide some indication of the influence of peak exposures on MeHg dose-response relationships for neurodevelopmental effects.
The frequency of overall fish consumption was used in the first stage of the study to screen for both the high Hg-dose group (consumption of fish more than three times per week), and the reference group (one or less than one fish meal per week). Ultimately, however, the high Hg-dose group for the first and second stages of the study was selected from among frequent consumers on the basis of hair Hg concentrations of more than 6 ppm. In the second stage of the study, each child in the high Hg-dose group was matched with three control children on the basis of low hair Hg concentration. One of these control children was additionally selected on the basis of frequent (more than three times per week) maternal fish consumption during pregnancy.
Given the differences, uncertainties, and limitations of the exposure-assessment approaches used in the Seychelles, Faroe Islands, and New Zealand studies, none of the approaches can be identified as better or more relevant. It is clear, however, that each of the approaches supplied different, and not necessarily comparable pictures of exposure and dose. Grandjean et al. (1999) noted in the Faroe Islands study that cord-blood MeHg appeared to better predict deficits in cognitive functions (language, attention, and memory), and maternal-hair MeHg appeared to
better predict deficits in fine-motor function. The authors attributed those qualitative differences to the different periods of development reflected by each of the measurements. That conclusion is consistent with the idea that discrete windows of vulnerability in the developmental toxicity of MeHg are differentially represented by hair- and cord-blood Hg measurements. However, the lack of uniformity in the lengths of the hair segments analyzed in the Faroe Islands study (Grandjean et al. 1999) make a clear interpretation of such differences somewhat problematic. Therefore, the uncertainties and limitations in the various biomarkers that are used for MeHg exposure assessment could result in exposure misclassification in the dose-response assessment.
Misclassification of exposure in these studies could take several forms. Those include incorrectly considering exposures that occurred during developmental periods during which there is little or no vulnerability of the observed developmental endpoints to MeHg; failing to identify peak concentrations that might be more toxicologically relevant than the measured average concentrations; and using portions of hair with Hg concentrations that accumulated before or after pregnancy. Generally, exposure misclassification biases to the null — that is, use of an incorrect exposure level in a regression analyses of outcome data leads to decreased power to detect a real effect. Thus, the likely implication of the uncertainties and limitations in the dose metrics used in the Seychelles and the Faroe Islands studies is that the probability of observing true associations of dose and response will be reduced. In addition, the magnitude of those observed associations may be underestimated. Therefore, the existence of uncertainties and limitations notwithstanding, those statistically significant dose-response associations observed with any of the dose metrics are likely to reflect (perhaps indirectly) true associations (if other sources of bias have been adequately addressed). Failure to observe statistically significant dose-response associations could well be due to exposure misclassification resulting from one or more of the uncertainties and limitations discussed above.
SUMMARY AND CONCLUSIONS
-
Duplicate diet data can potentially provide accurate data on MeHg intake, although interindividual pharmacokinetic variability creates
-
uncertainty in the use of such data to estimate the dose to the fetal brain. The collection of duplicate dietary data places demands on study participants. This approach is, therefore, generally limited to short periods of observation that might not capture critical intake variability in populations with high intraindividual variability in intake of fish.
-
Retrospective dietary data (diary and recall) are relatively simple to collect, but diary-based data are subject to participant errors in species identification, portion estimation, and assignment of MeHg concentration by species. The number of days of dietary-intake data collected needs to be long enough to characterize adequately the frequent fish consumer and to differentiate the levels of less frequent consumption. Recall-based data are additionally subject to recall errors. Such data might be useful in stratifying exposure and in temporal calibration of hair strands.
-
On the other hand, prospective data on all sources of Hg exposure, such as vaccines and dental amalgams and, in particular, dietary intakes of MeHg are essential to understanding the effects of environmental Hg exposures on any outcomes. Quantitative dietary intake data on intakes of all marine food sources can and should be collected in any serious study of this contaminant. Such data are essential for quantifying exposures, separating out the effect modifiers that account for the differences between exposures and target tissue concentrations. Intake data are also essential for identifying possible confounding factors, such as other contaminants or nutrients that are abundant in some of these food sources but not in others.
-
Cord-blood Hg concentration is closely linked kinetically to the fetal-brain compartment and should correlate closely with the concentrations at the target organ near the time of delivery. Cord-blood Hg is less closely linked to the ingested dose. That separation can introduce uncertainty into the back-calculation of a reference dose from cord-blood-based dose-response data.
-
Cord-blood Hg measurement cannot show temporal variability in exposure. It can provide data on a limited portion of gestation whose duration is somewhat uncertain but which occurs late in gestation. That portion of gestation might not correspond to the periods of greatest fetal sensitivity to MeHg neurotoxicity.
-
Maternal-hair Hg concentration is less closely linked kinetically to the fetal-brain compartment than is cord-blood Hg concentration, and the kinetic distance between the maternal-hair and fetal-brain compartments might be a significant source of statistical error in dose-response assessment.
-
Hair Hg measurement can potentially provide a range of dose metrics. Analysis of longer strands corresponding to all or part of gestation will provide average exposure data but no information on temporal variability in exposure. Segmental analysis can isolate specific periods of gestation, but peak exposures might be inadequately represented. Continuous single-strand analysis is a powerful technique that can recapitulate MeHg exposure during the entire period of gestation with accurate representation of peak exposures. This approach presents a range of dose metrics that can be investigated in assessing dose response.
-
Because of intraindividual and interindividual variability in hair-growth rates, attempts to identify hair Hg concentrations corresponding to specific time periods during gestation might be subject to significant error which can result in exposure misclassification in dose-response assessment. The temporal calibration of Hg measurements along a hair strand can be aided by consideration of corresponding dietary intake data for Hg.
-
Each of the dose metrics — dietary records, cord blood, and hair — provides different exposure information. Use of data from two or more of these metrics will increase the likelihood of uncovering a true dose-response relationship.
-
In the Seychelles studies, dose was estimated from the average Hg concentration in a length of hair assumed to represent the first 8 months of pregnancy. That approach precluded observing any intraindividual variability in exposure over the course of gestation.
-
Fish-consumption data for the Seychelles cohort established the generally high level of fish consumption but could not provide any data on intraindividual variability in exposure.
-
In the Faroe Islands studies, dose was estimated from cord-blood and single-sample maternal-hair Hg concentration. The cord-blood Hg data cover exposures over an indeterminate period late in gestation. The hair Hg samples appear not to have been of uniform length and therefore do not necessarily reflect comparable periods
-
of gestation. Those differences in length are relevant only if there is significant variability in MeHg exposure during gestation. Neither of these metrics has the ability to show intraindividual variability over the course of gestation.
-
Fish-consumption data for the Faroe cohort indicated a high rate of consumption of fish with low Hg concentrations, and less frequent consumption of pilot whale containing high concentrations of MeHg. Such a diet suggests a pattern of peaking exposures. Exposure modeling suggests that as reflected by accumulation in hair such peaks might represent a moderate increase above baseline concentrations.
-
The uncertainties and limitations in exposure assessment in these studies can result in exposure misclassification, which will lessen the ability to detect significant dose-response associations and might result in inaccuracies in the derivation of dose-response relationships.
-
If exposure misclassification occurred in the studies of MeHg, such misclassification would tend to obscure any true effect. Therefore, statistically significant dose-response associations are likely to reflect true dose-response relationships, assuming that other sources of bias are adequately addressed.
-
Dose-response assessments using either cord-blood or maternal-hair Hg concentrations are adequate to support the derivation of an RfD.
RECOMMENDATIONS
-
Quantitative dietary intake data on patterns of consumption of the primary sources of MeHg including all marine food sources, should be collected in all prospective studies of MeHg exposure. Estimates of exposures will improve dose-response analyses that have implications for regulatory purposes.
-
In future studies, data on maternal fish intake by species and by meal should be collected along with Hg biomarker data. Those data should be used to provide estimates of temporal variability in MeHg intake during pregnancy.
-
Future studies should collect data on maternal-hair, blood, and
-
cord-blood Hg concentrations. All three dose metrics should be considered in attempting to identify dose-response relationships.
-
Data are needed that reliably measure both Hg intake and biomarkers of Hg exposure to clarify the relationship between the different dose metrics. NHANES IV data should be examined when it becomes available to determine if it satisfies those needs.
-
To detect exposure variability, archived hair strands from both the Seychelles and the Faroe Islands studies should be analyzed by continuous single-strand XRF analysis. The possible dose metrics that can be derived from XRF analysis should be examined in the dose-response assessment. Such considerations should also be addressed in future studies.
REFERENCES
Airey, D. 1983. Total mercury concentrations in human hair from 13 countries in relation to fish consumption and location. Sci. Total Environ. 31(2):157-180.
ATSDR (Agency for Toxic Substances and Disease Registry). 1999. Toxicological Profile for Mercury (Update). U.S. Department of Health and Human Services, Agency for Toxic Substances and Disease Registry . Atlanta, GA.
Batista, J., M. Schuhmacher, J.L. Domingo, and J. Corbella. 1996. Mercury in hair for a child population from Tarragona Province, Spain . Sci. Total Environ. 193(2):143-148.
Berry, M.R. 1997. Advances in dietary exposure research at the United States Environmental Protection Agency-National Exposure Research Laboratory. J. Expo. Anal. Environ. Epidemiol, 7(1):3-16.
Boischio, A.A.P., and E. Cernichiari. 1998. Longitudinal hair mercury concentration in riverside mothers along the Upper Madeira river (Brazil). Environ. Res. 77(2):79-83.
Bruhn, C.G., A.A. Rodríguez, C. Barrios, V.H. Jaramillo, J. Becerra, U. Gonzáles, N.T. Gras, O. Reyes, and Seremi-Salud. 1994. Determination of total mercury in scalp hair of pregnant women resident in fishing villages in the Eighth Region of Chile. J. Trace Elem. Electrolytes Health Dis. 8(2):79-86.
Brune, D., G.F. Nordberg, O. Vesterberg, L. Gerhardsson, and P.O. Wester. 1991. A review of normal concentration of mercury in human blood. Sci. Total Environ. 100(spec No):235-282.
Buzina, R., P. Stegnar, S.K. Buzina-Suboticanec, M. Horvat, I. Petric, and T.M. Farley
. 1995. Dietary mercury intake and human exposure in an Adriatic population . Sci. Total Environ. 170(3):199-208.
Castilhos, Z.C., E.D. Bidone, and L.D. Lacerda. 1998. Increase of the background human exposure to mercury through fish consumption due to gold mining at the Tapajos River region, Para State, Amazon. Bull. Environ. Contam. Toxicol. 61(2):202-209.
Cernichiari, E., T.Y. Toribara, L. Liang, D.O. Marsh, M.W. Berlin, G.J. Myers, C. Cox, C.F. Shamlaye, O. Choisy, P. Davidson, et.al. 1995. The biological monitoring of mercury in the Seychelles study. Neurotoxicology 16(4):613-628.
Cernichiari, E., R. Brewer, G.J. Myers, D.O. Marsh, L.W. Lapham, C. Cox, C.F. Shamlaye, M. Berlin, P.W. Davidson, and T.W. Clarkson. 1995a. Monitoring methylmercury during pregnancy: Maternal hair predicts fetal brain exposure. Neurotoxicology 16(4):705-710.
Chan, H.M., P.R. Berti, O. Receveur, and H.V. Kuhnlein. 1997. Evaluation of the population distribution of dietary contaminant exposure in an Arctic population using Monte Carlo statistics. Environ. Health Perspect. 105(3):316-321.
Choi, B.H. 1989. The effects of methylmercury on the developing brain. Prog. Neurobiol. 32(6):447-470.
Clewell, H.J., J.M. Gearhart, R. Gentry, T.R. Covington, C.B. VanLandingham, K.S. Crump, and A.M. Shipp. 1999. Evaluation of the uncertainty in an oral Reference Dose for methylmercury due to interindividual variability in pharmacokinetics. Risk Anal. 19(4):547-558.
Cox, C., T.W. Clarkson, D.O. Marsh, L. Amin-Zaki, S. Tikriti, and G.G. Myers. 1989. Dose-response analysis of infants prenatally exposed to methyl mercury: An application of a single compartment model to single-strand hair analysis. Environ. Res. 49(2):318-322.
Davidson, P.W., G.J. Myers, C. Cox, C. Axtell, C. Shamlaye, J. Sloane-Reeves, E. Cernichiari, L. Needham, A. Choi, Y. Wang, M. Berlin, and T.W. Clarkson. 1998. Effects of prenatal and postnatal methylmercury exposure from fish consumption on neurodevelopment: Outcomes at 66 months of age in the Seychelles Child Development Study. JAMA 280(8):701-707.
Davidson, P.W., G.J. Myers, C. Cox, E. Cernichiari, T.W. Clarkson, and C. Shamlaye. 1999. Effects of methylmercury exposure on neurodevelopment. [Letter]. JAMA 281(10):896-897.
Dennis, C.A., and F. Fehr. 1975. Mercury levels in whole blood of Saskatchewan residents. Sci. Total Environ. 3(3):267-274.
EPA (U.S. Environmental Protection Agency). 1997. Mercury Study Report to Congress. Vol. IV: An Assessment of Exposure to Mercury in the United States .
EPA-452/R-97-006. U.S. Environmental Protection Agency, Office of Air Quality Planning and Standards, and Office of Research and Development.
FDA (U.S. Food and Drug Administration). 1992. Compilation of methylmercury results by species for FY=91 and FY=92 . Office of Seafood, Washington, DC.
Fujita, M., and E. Takabatake. 1977. Mercury levels in human maternal and neonatal blood, hair and milk . Bull. Environ. Contam. Toxicol. 18(2):205-209.
Gaggi, C., F. Zino, M. Duccini, and A. Renzoni. 1996. Levels of mercury in scalp hair of fishermen and their families from Camara de Lobos-Madeira (Portugal): A preliminary study. Bull. Environ. Contam. Toxicol. 56(6):860-865.
Gilbert, S.G., and K.S. Grant-Webster. 1995. Neurobehavioral effects of developmental methylmercury exposure. Environ. Health Perspect. 103(Suppl. 6):135-142.
Ginsberg, G.L., and B.F. Toal. 2000. Development of a single meal fish consumption advisory for methyl mercury. Risk Anal. 20(1):41-48.
Giovanoli-Jakubczak, T., and G.G. Berg. 1974. Measurement of mercury in human hair. Arch. Environ. Health 28(3):139-144.
Girard, M., and C. Dumont. 1995. Exposure of James Bay Cree to methylmercury during pregnancy for the years 1983-91. Water Air Soil Pollut. 80:13-19.
Gowdy, J.M., R. Yates, F.X. Demers, and S.C. Woodward. 1977. Blood mercury concentration in an urban population. Sci. Total Environ. 8(3):247-251.
Grandjean, P., and P. Weihe. 1993. Neurobehavioral effects of interuterine mercury exposure; potential sources of bias. Environ. Res. 61(1):176-183.
Grandjean, P., E. Budtz-Jørgensen, R.F. White, P. Weihe, F. Debes, and N. Keiding. 1999. Methylmercury exposure biomarkers as indicators of neurotoxicity in children aged 7 years. Am. J. Epidemiol 150(3):301-305.
Grandjean, P., P. Weihe, P.J. Jørgensen, T. Clarkson, E. Cernichiari, and T. Viderø. 1992. Impact of maternal seafood diet on fetal exposure to mercury, selenium, and lead. Arch. Environ. Health 47(3):185-195.
Grandjean, P., P. Weihe, L.R. Needham, V. W. Burse, D.G. Patterson, Jr., E.J. Sampson, P.J. Jørgensen, and M. Vahter. 1995. Relation of a seafood diet to mercury, selenium, arsenic, and polychlorinated biphenyl and other organochlorine concentrations in human milk. Environ. Res. 71(1):29-38..
Grandjean, P., P. Weihe, R.F. White, N. Keiding, E., Budtz-Jørgensen, K. Murato, and L. Needham. 1998. Prenatal exposure to methylmercury in the Faroe Islands and neurobehavioral performance at age seven years. Response to workgroup questions for presentation on 18-20 November, 1998. In: Scientific Issues Relevant to Assessment of Health Effects from Exposure
to Methylmercury. Appendix II-B.- Faroe Islands Studies. National Institute for Environmental Health Sciences. [Online]. Available: http://ntp-server.niehs.nih.gov/Main_Pages/PUBS/MethMercWkshpRpt. html
Hall, R.A., E.G. Zook, and G.M. Meaburn. 1978. Survey of Trace Elements in the Fisheries Resource. Technical Report NMFSSSRF-721. National Oceanic and Atmospheric Administration. National Marine Fisheries Service. 313pp.
Haxton, J., D.G. Lindsay, J.S. Hislop, L. Salmon, E.J. Dixon, W.H. Evans, J.R. Reid, C.J. Hewitt, and D.F. Jeffries. 1979. Duplicate diet study on fishing communities in the United Kingdom: Mercury exposure in a “critical group”. Environ. Res. 18(2):351-368.
Hecker, L.H., H.E. Allen, and B.D. Dinman. 1974. Heavy metals in acculturated and unacculturated population. Arch. Environ. Health 29(4):181-185.
Hislop, J.S., T.R. Collier, G.P. White, D.T. Khathing, and E. French. 1983. The use of keratinised tissues to monitor the detailed exposure of man to methylmercury from fish. Pp. 145-148 in Clinical Toxicology and Clinical Chemistry of Metals, S.S. Brown, ed. New York: Academic Press.
Holsbeek, I., H.K. Das, and C.R. Joiris. 1996. Mercury in human hair and relation to fish consumption in Bangladesh . Sci. Total Environ. 186(3):181-188.
Humphrey, H.E.B. 1975. Mercury concentrations in humans and consumption of fish containing methylmercury. Pp. 33 in Heavy Metals in the Aquatic Environment Proceedings of the International Conference held in Nashville, TN, December, 1973, P.A. Krenkel, ed. Oxford: Pergamon Press.
Hopps, H.C. 1977. The biologic basis for using hair and nail for analyses of trace elements. Sci. Total Environ. 7(1):71-89.
IPCS (International Programme on Chemical Safety). 1990. Environmental Health Criteria Document 101 - Methylmercury. Geneva: World Health Organization.
IPCS (International Programme on Chemical Safety). 1991. Environmental Health Criteria Document 118 -Inorganic Mercury. Geneva: World Health Organization.
Jacobs, H.L., H.D. Kahn, K.S. Stralka, and D.B. Phan. 1998. Estimates of per capita fish consumption in the U.S. based on the continuing survey of food intake by individuals (CSFII). Risk Anal. 18(3):283-291.
Katz, S., and A. Chatt. 1988. Pp. 6-12 in Hair Analysis: Application in the Biomedical and Environmental Sciences . New York: VCH Publishers.
Kingman, A., T. Albertini, and L.J. Brown. 1998. Mercury concentrations in urine and whole blood associated with amalgam exposure in a U.S. military population. J. Dent. Res. 77(3):461-471.
Kjellström, T., P. Kennedy, S. Wallis, and C. Mantell. 1986. Physical and
Mental Development of Children with Prenatal Exposure to Mercury from Fish. Stage I: Preliminary Tests at Age 4. National Swedish Environmental Protection Board Report 3080. Solna, Sweden.
Kjellström, T., P. Kennedy, S. Wallis, A. Stewart, L. Friberg, B. Lind, T. Wutherspoon, and C. Mantell. 1989. Physical and Mental Development of Children with Prenatal Exposure to Mercury from Fish. National Swedish Environmental Protection Board Report No. 3642.
Kuhnert, P.M, B.R. Kuhnert, and P. Erhard. 1981. Comparison of mercury levels in maternal blood, fetal cord blood, and placental tissues. Am. J. Obstet. Gynecol. 139(2):209-213.
Kuntz, W.D., R.M. Pitkin, A.W. Bostrom, and M.S. Hughes. 1982. Maternal and cord blood background mercury levels: A longitudinal surveillance. Am. J. Obstet. Gynecol. 143(4):440-443.
López-Artiguez, M., A. Grilo, D. Martinez, M.L. Soria, L. Nuñez, A. Ruano, E. Moreno, F. García-Fuente, and M. Repetto. 1994. Mercury and methylmercury in population risk groups on the Atlantic coast of southern Spain. Arch. Environ. Contam. Toxicol. 27(3):415-419.
Lubin, B.H. 1987. Reference values in infancy and childhood. Pp. 1683 in Hematology of Infancy and Childhood, 3rd Ed., D.G. Nathan, and F.A. Oski, eds. Philadelphia: W.B. Saunders.
MacIntosh, D.L, P.L. Williams, D.J. Hunter, L.A. Sampson, S.C. Morris, W.C. Willett, and E.B. Rimm. 1997. Evaluation of a food frequency questionnaire-food composition approach for estimating dietary intake of inorganic arsenic and methylmercury . Cancer Epidemiol. Biomarkers Prev. 6(12):1043-1050.
Mahaffey, K.R., and D. Mergler. 1998. Blood levels of total and organic mercury of residents of the upper St. Lawrence River basin, Quebec: Association with age, gender, and fish consumption. Environ. Res. 77(2):104-114.
Marsh, D.O., T.W. Clarkson, C. Cox, G.J. Myers, L. Amin-Zaki, and S. Al-Tikriti. 1987. Fetal methylmercury poisoning. Relationship between concentration in single strands of maternal hair and child effects. Arch. Neurol. 44(10):1017-1022.
Nixon, D.E., G.V. Mussmann, and T.P. Moyer. 1996. Inorganic, organic and total mercury in blood and urine: Cold vapor analysis with automated flow injection sample delivery. J. Anal. Toxicol. 20(1):17-22.
Oskarsson, A., B.J. Lagerkvist, B. Ohlin, and K Lundberg. 1994. Mercury levels in the hair of pregnant women in a polluted area in Sweden. Sci. Total Environ. 151 (1):29-35.
Oskarsson, A., A. Schütz, S. Skerfving, I.P. Hallén, B. Ohlin, and B.J. Lagerkvist. 1996. Total and inorganic mercury in breast milk and blood in relation to fish consumption and amalgam fillings in lactating women. Arch. Environ. Health 51(3):234-241.
Pallotti, G., B. Bencivenga, and T. Simonetti. 1979. Total mercury levels in
whole blood, hair and fingernails for a population group from Rome and its surroundings. Sci. Total Environ. 11(1):69-72.
Pecoraro, V., J.M. Barman, and I. Astore. 1967. The normal trichogram of pregnant women. Pp. 203-210 in Advances in Biology of Skin, Vol. IX, Hair Growth. Proceedings of the University of Oregon Medical School Symposium on the Biology of Skin. Pub. No. 277, Oregon Regional Primate Research Center, W. Montagna, and R.L. Dobson, eds. Oxford: Pergamon Press.
Pitkin, R.M, J.A Bahns, L.J. Filer, Jr., and W.A. Reynolds. 1976. Mercury in human maternal and cord blood, placenta and milk. Proc. Soc. Exp. Biol. Med. 151(3):565-567.
Ponce, R.A., S.M. Bartell, T.J. Kavanagh, J.S. Woods, W.C. Griffith, R.C. Lee, T.K. Takaro, and E.M. Faustman. 1998. Uncertainty analysis methods for comparing predictive models and biomarkers: A case study of dietary methyl mercury exposure. [Review]. Regul. Toxicol. Pharmacol. 28(2):96-105.
Schuhmacher, M., J. Batiste, M.A. Bosque, K.L. Domingo, and J. Corbella. 1994. Mercury concentrations in marine species from the coastal area of Tarragona Province, Spain. Dietary intake of mercury through fish and seafood consumption. Sci. Total Environ. 156(3):269-273.
Shamlaye, C.F., D.O. Marsh, G.J. Myers, C. Cox, P.W. Davidson, O. Choisy, E. Cernichiari, A. Choi, M.A. Tanner, and T.W. Clarkson. 1995. The Seychelles child development study on neurodevelopmental outcomes in children following in utero exposure to methylmercury from a maternal fish diet: background and demographics. Neurotoxicology 16(4):597-612.
Sherlock, J.C., D.G. Lindsay, J.E. Hislop, W.H. Evans, and T.R. Collier. 1982. Duplicate diet study on mercury intake by fish consumers in the United Kingdom. Arch. Environ. Health 37(5):271-278.
Sikorski, R., T. Poszkowski, P. Slawinski, J. Szkoda, J. Zmudzki, and S. Skawinski. 1989. The intrapartum content of toxic metals in maternal blood and umbilical cord blood. Ginekol. Pol. 60(3):151-155.
Skerfving, S. 1988. Mercury in women exposed to methylmercury through fish consumption and in their newborn babies and breast milk. Bull. Environ. Contam. Toxicol. 41(4):475-482.
Skerfving, S. 1991. Exposure to mercury in the population. Pp. 411-425 in Advances in Mercury Toxicology, T. Suzuki, N. Imura, and T.W. Clarkson, eds. New York: Plenum Press.
Smith, J.C., P.V. Allen, and R. Von Burg. 1997. Hair methylmercury levels in U.S. women. Arch. Environ. Health 52(6):476-480.
Stern, A.H. 1993. Re-evaluation of the reference dose for methylmercury and assessment of current exposure levels. Risk Anal 13(3):355-364.
Stern, A.H. 1997. Estimation of the interindividual variability in the one-
compartment pharmacokinetic model for methylmercury: implications for the derivation of a reference dose. Regul. Toxicol. Pharmacol. 25(3):277-288.
Stern, A.H., L.R. Korn, and B.E. Ruppel. 1996. Estimation of fish consumption and methylmercury intake in the New Jersey population. J. Expo. Anal. Environ. Epidemiol. 6(4):503-525.
Stern, A.H., and M. Gochfeld. 1999. Effects of methylmercury exposure on neurodevelopment. [Letter]. JAMA 281(10):896-897.
Stern, A.H., M. Gochfeld, C. Weisel, and J. Burger. 2000. Mercury and methylmercury exposure in the New Jersey pregnant population . Arch. Environ. Health. In press.
Thomas, K.W., L.S. Sheldon, E.D. Pellizzari, R.W. Handy, J.M. Roberds, and M.R. Berry. 1997. Testing duplicate diet sample collection methods for measuring personal dietary exposures to chemical contaminants. J. Expo. Anal. Environ. Epidemiol. 7(1):17-36.
Vural, N., and H. Ünlü. 1996. Methylmercury in hair of fisherman from Turkish coasts. Bull. Environ. Contam. Toxicol. 57:315-320.
Whipple, C., L. Levin, and C. Seigneur. 1996. Sensitivity of mercury exposure calculations to physical and biological parameters of fish consumption. Presented at Fourth International Conference on Mercury as a Global Pollutant, Hamburg, August 4-8.
Yess, N.J. 1993. U.S. Food and Drug Administration survey of methyl mercury in canned tuna. J. AOAC Int. 76(1):36-38.


