
3
BIOLOGICAL VARIABILITY
INDIVIDUAL responses to MeHg exposure are variable. For example, individuals receiving the same dose of MeHg in the Iraqi accident did not all have the same effects. Even in controlled animal experiments, considerable variability in response is noted (Burbacher et al. 1988; Rice and Gilbert 1990). Differences in susceptibility to MeHg might be due to differences in the uptake, storage, transport, or metabolism of MeHg. Susceptibility to the effects of MeHg can also be predetermined by genetic polymorphisms that affect the delivery of MeHg to the target organs or affect the response of the target organs to MeHg. In addition, other external factors can influence vulnerability to the effects of MeHg. Factors that deserve consideration are age, gender, health status, nutritional status, and the intake of other foods or nutrients that might influence the absorption, uptake, distribution, and metabolism of MeHg. The ability of the individual to compensate for damage caused by MeHg exposure would also affect susceptibility. This chapter discusses those factors that could underlie the variability in response to Hg exposure. The implications of that variability on the study of the toxicokinetics of Hg are discussed.
AGE-RELATED SUSCEPTIBILITY
Exposure to MeHg during the neonatal period, infancy and childhood has different effects due to the different stages of brain development and
organ growth and the ratio of the MeHg concentration to body size. Age also affects the detection of toxic responses to MeHg, because some of the most sensitive end points examined — neurological development and cognitive ability — are dependent upon the age of the subject and the stage of cognitive maturation. There are also natural differences among individuals in performance on tests used. Therefore, the sensitivity of the test or assessment is dependent upon the developmental stage and age of the subject. In addition, many of the tests are carried out during periods of rapid development, which results in greater natural variation between individuals.
Data from Japanese poisoning episodes provide strong evidence that susceptibility to MeHg changes with age. Takeuchi (1968) described three distinct patterns of MeHg neuropathology termed adult, infantile, and fetal Minamata disease. In autopsy cases following fetal exposures, clear evidence of interference with brain development was observed. Disorganized cell layers and misoriented cells were observed, providing evidence of disrupted cell migration. For fetal and infantile exposures, lesions were observed throughout the cortex. A more selective pattern of lesions, localized in the calcarine and precentral cortices, particularly in the depths of the sulci, was observed in adult cases. Lesions in the granular layer of the cerebellum were observed in all cases. Reports of age-related neurological effects due to MeHg exposure in Japan and Iraq have also been described (Bakir et al. 1973; Harada 1968; Marsh et al. 1980). In both cases, mothers with few or no symptoms gave birth to infants severely affected. Studies with animal models also have reported significant age-dependent effects from MeHg exposure. As in human cases, offspring are sometimes severely affected with little or no signs of toxicity in the mother (Spyker et al. 1972; Mottet et al. 1987). Thus, age needs to be considered in the design of studies of MeHg, including in the choice of end points and the determination of how to analyze the results.
GENDER DIFFERENCES
Several reports have described gender differences in the toxicokinetics and the toxicodynamics of MeHg. Evidence of gender-dependent MeHg metabolism has been reported in humans (Miettinen 1973) and
animal models (Thomas et al. 1986; Nielsen and Andersen 1991). However, this gender sensitivity does not apply in the same way for all outcomes. The Iraqi MeHg epidemic appeared to affect three times as many females as males (Magos et al. 1976). Epidemiological studies of human infants and children have reported gender specific effects on development with males exhibiting greater effects than females. (McKeown-Eyssen et al. 1983)
In general, results in animal studies indicate that females exhibit a higher body burden of Hg per given dose than males. That result might be due to higher metabolism and urinary-excretion rates for MeHg in sexually mature male mice compared with female mice (Hirayama and Yasutake 1986). Animal data also indicate gender differences in the sensitivity to MeHg toxicity. Fowler (1972) and Yasutake et al. (1990) found that females are more likely to show renal toxicity following MeHg exposure. Yasutake and Hirayama (1988) found the gender differences to be strain sensitive following oral administration of MeHg chloride at 5 mg/kg per day since male Balb/cA mice died earlier than female Balb/cA mice, but female C57B/6N mice died earlier than male C57B/6N mice. Reports regarding the neurological effects have been mixed; females were found to be more susceptible than males in some studies, and males were observed to be more susceptible than females in others (Magos et al. 1976; Tagashira et al. 1980; McKeown-Eyssen et al. 1983; Vorhees 1985; Tamashiro et al. 1986a).
GENETICS
Aside from gender differences within a population, there is evidence of differences in sensitivity within populations that result in greater damage from a given exposure in one individual than in another. The extent to which that difference is due to familial characteristics compared with nutritional and environmentally mediated susceptibility remains to be determined. Differences in enzymatic expression might result in individual differences in sensitivity to MeHg. Currently, no evidence of polymorphisms affecting the metabolism or detoxification of MeHg exists. The lack of evidence, might be due to the inadequate study of those interactions in human populations and animal models. Therefore, the extent to which interindividual variability in effects at
similar doses is attributable to genetic differences in susceptibility remains unknown (Tamashiro et al. 1986).
MECHANISMS OF NUTRITIONAL INFLUENCE ON MeHg HEALTH EFFECTS
Overall, nutritional status and dietary interactions can affect the outcomes of MeHg studies, either by influencing the toxicity of Hg or by having effects on the end points measured. The main source of exposure to MeHg is through the food chain, largely through consumption of nonherbivorous fish and marine mammals, with smaller amounts contributed by intake of other fish and seafood. The nature of dietary exposures is such that consumption of one food group is generally related to a reduction or avoidance of other food groups. Establishing causality becomes particularly complex under those circumstances. Pathways through which diet and nutrients might affect the results of MeHg toxicity studies include the potential for attenuating a MeHg effect, exacerbating a MeHg effect, or acting as a confounder by causing toxicity due to other common food components or contaminants. Those three pathways are outlined in Figure 3-1.
Potentially harmful effects of MeHg might be attenuated by protective effects of such nutrients as selenium and omega-3 fatty acids. At the other extreme, malnourishment could affect study results either by directly reducing the sensitivity of an end point tested or by exacerbating the effects of MeHg, thereby increasing the sensitivity to MeHg toxicity. Nutritional factors that disrupt neuronal development, such as iron or folate deficiencies, might increase the impact of MeHg on neural development. Conversely, adequate levels of iron and folate in the diet might reduce the impact of MeHg. Such nutrient deficiencies could arise from an inadequate diet or, secondarily, from repeated infection, intestinal parasites, or excessive alcohol consumption.
The available data for the birth weight, gestation, and weight of the children studied in the Faroe Islands, Seychelles, and New Zealand do not suggest that there are energy or macronutrient (protein, carbohydrate, and fat) deficiencies in these populations. However, micronutrient deficiencies, such as iron and zinc, due to low intake of fortified or unrefined grains, fruits, and vegetables are possible. There
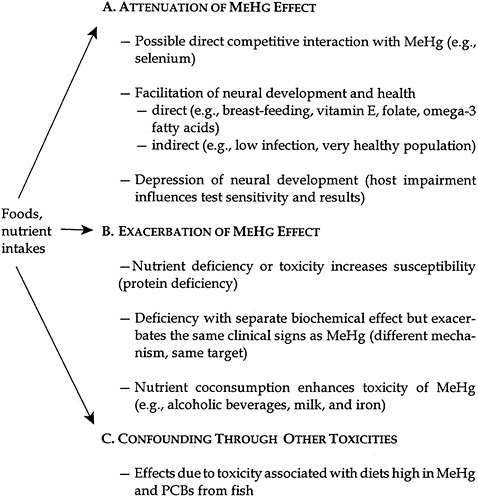
FIGURE 3-1 Hg nutrient interactions. Source: Modified from NIEHS 1998.
is insufficient information on the extent of breast-feeding of the infants to determine whether the use of other sources of milk and milk substitutes affected the outcome because of inadequate levels of iron, vitamins, and other minerals in those sources. The effects of such deficiencies on neurobehavioral end points might be evident long before any clinical signs of deficiency are present, and such deficiencies might not
have been obvious in the study populations. Although those deficiencies could affect the risk estimate, an artifactual response will be seen only if those deficiencies are disproportionally distributed among the individuals exposed to MeHg at different doses.
Dietary Interactions and Confounding
Dietary factors can also confound studies of the effects of MeHg when consumption of a food contributes to the measured outcome through more than one component in that food. If a factor is associated with both MeHg exposure and outcome measures but is not part of the pathway by which MeHg effects neurological or other responses, it can be considered a confounding factor and must be controlled for in the analyses. Because the primary source of exposure is from fish consumption, it is difficult to determine whether the Hg in that source is the only cause of the fish-related effects. Other contaminants that could be present in fish, such as polychlorinated biphenyls (PCBs) or dichlorodiphenyltrichloroethane (DDT), could confound a study. High fish consumption could also result in the absence of another important food or nutrient from the diet. Conversely, fish consumption might be associated with the intake of protective substances, such as selenium and omega-3 fatty acids. Such an association was seen by Osman et al. (1998), who examined blood MeHg and selenium concentrations in Polish children from Katowice.
The understanding of the causal relationship between MeHg and adverse effects, therefore, would be greatly enhanced by information on the intake of all dietary constituents and adjustment for other toxicants. Availability of quantitative dietary information and incorporation of that information into assessments of MeHg effects could improve the analysis of the studies.
It is important to remember that fish and shellfish are high-quality food sources of protein and nutrients and that they are low in saturated fats. They contain nutrients that are essential for proper central-nervous-system development and function, and they might have potential health benefits in the prevention of cardiovascular disease and cancer. A reduction in the consumption of fish and shellfish might result in dietary patterns that are generally more harmful.
Selenium
Although the effect of selenium on MeHg toxicity has not been well documented in humans, it has been known for over two decades that organic and inorganic selenium can influence the deposition of MeHg in the body and protect against its toxicity in animals (Ganther et al. 1972). In animals, selenium deficiency has been associated with enhanced fetotoxicity following MeHg exposure (Potter and Matrone 1974; Nishikido et al. 1987). At the other extreme, the toxicity of MeHg can be enhanced in the presence of very high selenium supplementation (as in its absence) (Nobunaga et al. 1979). Over 40 studies have examined the interaction of selenium and mercury in various systems. These have recently been reviewed by Chapman and Chan (2000).
Selenium also influences tissue deposition in a form- and dose-dependent manner. Administration of seleno-methionine increased MeHg and total Hg content in the blood of rats exposed to MeHg through fish consumption. Administration of selenium dioxide lowered Hg concentrations by 24-29% in the blood and liver of rats in the same model system. Selenite supplementation in the diet of female rats before mating, during gestation, and during lactation antagonized the central-nervous-system effects following in utero exposure to MeHg (Fredriksson et al. 1993). Selenium injection during gestation has been shown to increase Hg concentrations in the neonatal brain (Satoh and Suzuki 1979), whereas ingestion has been shown to reduce brain levels (Fredriksson et al. 1993).
Therefore, animal experiments show that selenium might be protective in terms of neurodevelopmental responses but this is not clear. The selenium dose, form, and exposure route (injection vs ingestion) might affect the tissue deposition profiles. Although selenium appears to have a protective effect in animals, no association has been confirmed in humans. The mechanism by which selenium influences the deposition of Hg is not established. Proposed mechanisms include the formation of seleno-MeHg complexes, a selenium-induced release of MeHg from sulfhydryl bonds in the blood, and tissue-specific mechanisms that influence intracellular uptake (Glynn and Lind 1995).
Garlic
Garlic might be an important effect modifier in MeHg studies. Many
compounds (or their metabolites) in garlic could act as metal chelating or complexing agents and increase MeHg excretion. Such chemicals can be converted to thiols or include thiols (diallyldisulfide, diallyltrisulfide, propylallyldisulfide, and diallylsulfide), glutathione, vitamin C, and thiol amino acids (see review by Block 1985 ). Garlic also contains selenium (0.72-1.52 µg of selenium per gram of garlic), which, as previously discussed, might influence Hg toxicokinetics.
Animal studies support a protective role of garlic against Hg toxicity (Cha 1987; Rhee et al. 1985). Male Sprague-Dawley rats were simultaneously administered MeHg (4 ppm), cadmium, and phenylmercury in their drinking water as well as 8% peeled, crushed raw garlic (Allium satirum) in the feed (200 ppm allicin) for 12 weeks. Results indicate a statistically significant reduction in Hg tissue concentrations compared with rats that did not receive garlic (Cha 1987). It is not clear from that study whether the garlic removed Hg that had been deposited in the tissues or whether it prevented its accumulation before deposition. Severe pathology was noted in the kidneys of rats receiving the MeHg in the absence of garlic, and only mild or no damage was noted in MeHg-exposed rats receiving 6.7% or 8 % garlic, respectively. Interpretation of that study must be done cautiously, however, because the effects might be due to cadmium and not Hg toxicity. It should also be noted that the protection is against the renal effects of MeHg, not the neurotoxicity.
In an earlier paper, Rhee et al. (1985) exposed rats (40 per group) intraperitoneally to MeHg (5 mg/kg of body weight per day) for 8 days. One group also received garlic. Tissue Hg concentrations were lower in the garlic-exposed animals than in the rats that did not receive garlic.
It should be noted that the doses of garlic used in those studies (6-8% by animal weight) are well above the expected garlic content in the human diet, even in those cultures that use relatively high amounts of garlic in their cooking. More extensive study of the interactions between garlic and MeHg is needed.
Omega-3 Fatty Acids
Polyunsaturated fatty acids are essential for brain development. During perinatal development, docosahexaenoic acid (DHA), an omega-3 fatty acid, accumulates in membrane phospholipids of the nervous
system. Deficiency in DHA impairs learning and memory in rats (Greiner et al. 1999).
The ratio of omega-3 to omega-6 fatty acids might also be important. The largest source of omega-3 fatty acids, in particular eicosapentanoic acid and its metabolite DHA, in the human diet is oily fish, such as salmon, herring, and other cold- water fish. Chalon et al. (1998) demonstrated that fish oil affects monoaminergic neruotransmission and behavior in rats. Omega-3 fatty acids might enhance neurotoxicological function and their deficiency might contribute to lower test results, which would confound MeHg toxicological studies in human populations. Individuals consuming less fish might perform more poorly. Individuals on a diet high in fish might demonstrate the competing effects of enhanced function from these fatty acids and reduced function because of the presence of MeHg in the same food source. A case-control study in Greece concluded that low fish intake is associated with an increased risk of cerebral palsy (Petridou et al. 1998). Populations eating diets rich in fish might have enhanced neural development that could mask adverse effects on development caused by MeHg. Therefore, controlling for intake of essential fatty acids in MeHg studies is important. That can be done by measuring biomarkers of long-term exposure to fatty acids, such as adipose tissue (Kohlmeier and Kohlmeier 1995). However, there is no evidence to date that supplementation of omega-3 fatty acid to the diet of a well-nourished term infant further enhances neurological development or attenuates the toxic effects of Hg.
Protein
The type and amount of protein consumed might affect the uptake and distribution of Hg in the body. Low protein intakes have been associated with increased Hg in the brain of the mouse (Adachi et al. 1994; Adachi et al. 1992). Sulfur amino acid ingestion might also increase blood, renal, and hepatic concentrations of Hg. Cysteine appeared to enhance transport of MeHg to the brains of rodents (Aschner and Clarkson 1987; 1988; Aschner and Aschner 1990; Hirayama 1985) when the amino acid was injected into the animals at the time of oral dosing or injection of MeHg chloride. There is some indication that
leucine might inhibit MeHg uptake (Mokrzan et al. 1995). In contrast, in vitro studies indicate that methionine might stimulate MeHg uptake (Alexander and Aaseth 1982; Wu 1995).
Alcohol
Ethanol has been shown to potentiate MeHg toxicity in mice and rats (Takahashi et al. 1978; Turner et al. 1981). Five studies conducted in rodents examined the potential for alcohol interactions with MeHg. These studies indicate that the coconsumption of alcohol with MeHg can potentiate toxicity, particularly in the kidney (Takahashi et al. 1978 as cited in Chapman and Chan 2000; Rumbeiha et al. 1992; Tamashiro et al. 1986b; Turner et al. 1981; McNeil et al. 1988). Ethanol administered to male rats in conjunction with daily injections of MeHg chloride has resulted in a dose-dependent increase in tissue concentrations of both total Hg and MeHg in the brain and kidneys and in the morbidity and mortality of these animals. The applicability of these findings to human alcohol consumption and MeHg exposure patterns is unknown.
Other Foods That Might Influence Hg Uptake
Two studies indicated that the addition of milk to rodent diets increases the total body burden of Hg as well as Hg concentrations in the brain (Landry et al. 1979; Rowland et al. 1984). Landry et al. (1979) showed a 56% increase in the whole-body retention of Hg in female BALB/c mice fed liquid diets of evaporated whole milk as compared with their standard diet. That increase was attributed to the binding of heavy metals to the milk triglycerides, enhancing gut absorption. Those findings of an increased retention of MeHg with a diet containing evaporated milk were confirmed by Rowland et al. (1984).
There are strong indications that wheat bran, but neither cellulose nor pectin, when consumed concurrently with MeHg administration, might reduce Hg concentrations in the brain. In a study of male BALB/c mice, a dose-response relationship between brain Hg concentrations and the percentage of wheat bran was seen across 0%, 5%, 15%, and 30% wheat bran in the diet. The highest dose of wheat bran decreased the half-time
of Hg elimination by 43%, and decreased the brain Hg concentrations by 24%. Corresponding reductions were seen in the Hg concentrations in the blood of the bran-fed animals. Reductions of that magnitude have been associated with a lower incidence and severity of symptoms of neurotoxicity in rats. The effect has been attributed partially to binding of the Hg to bran, reducing its absorption from the gut and decreasing intestinal transit time. Using evidence of an increase in mercuric Hg in the large intestines of the bran-fed mice, it has also been hypothesized that wheat bran increased the rate of demethylation of organic Hg in the gut (Rowland et al. 1986).
Vitamin E
The protective effect of coconsumption of α-tocopherol supplementation in the diet has been shown to be protective against Hg toxicity in tissue cultures and animals models. For example, in studies of male golden hamsters, the injection of 2 ppm α-tocopherol acetate completely prevented the neurotoxic effects and histological changes associated with injection of 2 ppm MeHg (Chang et al. 1978). The hypothesized mechanism is an antioxidant effect related to lipid peroxidation and to the prevention of neuronal degeneration ( Kling and Soares 1982; Kling et al. 1987; Chang et al. 1978; Kasuya 1975; Park et al. 1996; Prasad et al. 1980).
Nutrient Enhancement of Toxicity
In addition to the effects of protein, milk, and alcohol discussed earlier, four other nutrients have been implicated in the enhancement of MeHg toxicity: vitamin A, vitamin C, iron, and β carotene. Welsh (1977) reported in an abstract that vitamin A (10,000 IU/kg) decreased the time of onset of Hg toxicity in Fischer 344 rats given methylmercuric chloride at 10-15 ppm in drinking water. Vitamin C was shown to increase the absorption of Hg from the gastrointestinal tract, shortening the survival time of guinea pigs exposed to methylmercuric iodide at 8 mg/kg per day (Murray and Hughes 1976). The iron chelator, deferoxamine, was shown to inhibit the formation of reactive oxygen species in the cerebel-
lum of rats treated with MeHg at 5 mg/kg (LeBel et al. 1992). Finally, Andersen and Andersen (1993) reported that β-carotene at 1,000 to 10,000 IU/kg enhanced Hg-induced lipid peroxidation in the liver, kidney, and brain of CBA mice exposed to methylmercuric chloride. β-carotene did not affect the activity of total glutathione peroxidase or selenium-dependent glutathione peroxidase.
Beneficial Effects of Fish Consumption
The committee is aware of the other nutritional advantages of diets rich in fish, including fish being a rich source of vitamin D, omega-3 fatty acids, protein, and other nutrients that might be marginal in some diets. Cardiovascular disease, osteoporosis, and cancer might be partially prevented by the regular consumption of fish. Those are major chronic diseases that afflict large proportions of the U.S. population. For that reason, the long-term goal needs to be a reduction in the concentrations of MeHg in fish, rather than a replacement of fish in the diet by other foods, such as saturated fat rich sources of protein like red meat.
In the interim, the best methods of maintaining fish consumption and minimizing Hg exposure is the consumption of smaller fish within a species and the selection of species of fish known to have lower MeHg concentrations. Ikarashi et al. (1996) reported that, within a species, the MeHg content of the fish relates to the size of the fish, presumably because larger fish have had a longer life span and more time to accumulate MeHg.
TOXICOKINETIC VARIABILITY
Typically, biomarkers of MeHg exposure (i.e., hair or blood total Hg concentrations) are used as a surrogate for dose in the derivation of a reference dose (RfD) for MeHg. As discussed in Chapter 4, hair Hg is approximately 90% MeHg. Total Hg concentration in blood can reflect exposures to both MeHg and inorganic Hg. One goal of a dose-response assessment is thus to identify a biomarker concentration that is associated with a no-observed-adverse-effect level (NOAEL), low-observed-adverse-effect level (LOAEL), or a benchmark dose. That biomarker
concentration is then translated into an RfD. An RfD is a dose of MeHg that is considered safe to ingest and is expressed in micrograms of MeHg per kilogram of body weight per day. Therefore, to derive the RfD, it is necessary to determine the ingested dose that resulted in the measured Hg concentration in the biomarker. That is referred to as dose reconstruction. That determination requires the back-calculation of dose using a toxicokinetic model. There are several toxicokinetic parameters that determine the tissue (or biomarker) MeHg concentration after ingestion of a given dose of MeHg. Those parameters include the uptake of MeHg from the gastrointestinal tract, the distribution of MeHg to the various body tissues (including the biomarker tissues), and the elimination of MeHg or Hg from those tissues. The uptake, distribution, metabolism, and elimination have been described by a physiologically based pharmacokinetic (PBPK) model (Clewell et al. 1999) and by a one-compartment pharmacokinetic model (IPCS 1990; EPA 1997). Both models require a quantitative description of several physiological and toxicokinetic inputs (e.g., body weight, blood volume, and hair-blood partition coefficients).
The PBPK model of Clewell et al. (1999), illustrated in Figure 3-2, attempts to characterize the distribution and redistribution of MeHg among several body compartments, including maternal hair and fetal cord blood. Although the PBPK model is conceptually more accurate and flexible than the one-compartment model, it is also considerably more complex, and thus, more difficult to evaluate.
In contrast, the one-compartment model, illustrated in Figure 3-3, collapses the maternal-body compartments to a single maternal-blood compartment. The blood concentration of MeHg (and Hg2+ resulting from MeHg metabolism) is assumed to be at steady state, and the model permits the estimation of the blood Hg concentration resulting from a given ingested dose. The corresponding hair Hg concentration can then be estimated by using an empirically derived hair-to-blood Hg concentration ratio.
The rate of MeHg entry into the blood, I (micrograms per day), is calculated by
I = D × W × A × F, (1)
where D is the ingested dose (micrograms per kilogram of body weight
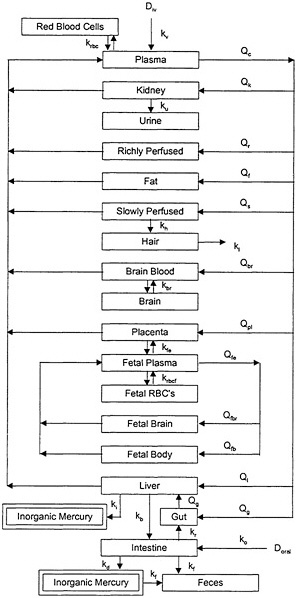
FIGURE 3-2 PBPK model for MeHg. Model parameters denoted by k represent rate constants for MeHg. Model parameters denoted by Q represent plasma flow rates. D represents the dose of MeHg. Source: Clewell et al. 1999. Reprinted with permission from Risk Analysis; copyright 1999, Plenum Publishing Corporation.
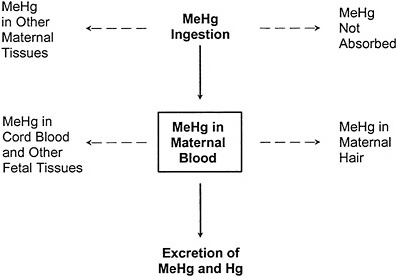
FIGURE 3-3 The one-compartment model relating ingestion of MeHg to MeHg in maternal blood. The one-compartment model predicts the steady-state MeHg concentration in the maternal-blood compartment under the assumption that the daily mass of MeHg entering the compartment from ingestion is equal to the daily mass leaving the compartment by excretion. Dotted lines indicate other toxicokinetic compartments that are not directly considered in the model.
perday); W is the body weight (kilograms); A is the fraction of ingested MeHg that is absorbed; and F is the fraction of absorbed MeHg that is distributed to the blood.
The rate of MeHg elimination from the blood, E (micrograms per day), is calculated by
E = C × b × V, (2)
where C is the concentration of MeHg in the blood (micrograms per liter); b is the elimination-rate constant, expressed as the fraction of the concentration eliminated per day (day-1); and V is the blood volume (liters).
By definition of steady state, the rate of MeHg entry into the blood is
equal to the rate of MeHg elimination from the blood. Therefore, at steady state, I = E and
D × W × A × F = C × b × V. (3)
Equation 3 can be solved for C to calculate the blood MeHg concentration resulting from a given steady-state dose:
Equation 3 can also be solved for D to calculate the steady-state dose corresponding to a given blood concentration:
The MeHg concentration in hair, H, is related to the concentration in blood, C, through the empirically derived hair-to-blood Hg concentration ratio (µg/g)/(µg/L), R, as follows:
C = (1/R) × H. (6)
The inverse form, (1/R), is used to maintain the ratio in the form in which it is traditionally expressed in the scientific literature.
To calculate the ingested dose that gave rise to a measured hair concentration, Equation 6 can be combined with Equation 5 as follows:
Equation 5 and 7 can thus be used to estimate the ingested dose of MeHg that gave rise to a maternal-blood and maternal-hair MeHg concentration, respectively, which are associated with a given level of adverse effects.
When fetal-cord-blood MeHg concentration is the biomarker measured, the corresponding maternal-blood concentration can be estimated
using an empirically derived ratio of cord-blood concentration to maternal-blood concentration.
Due to interindividual variability in physiology and kinetics, there is no single correct value that can be assigned to any of the parameters in either toxicokinetic model. Each of the model parameters is a random variable whose possible values in a population can be described by a probability distribution. The ingested dose of MeHg corresponding to a measured biomarker concentration, therefore, is also described by a probability distribution. That distribution is determined by the combination of the distributions of the individual model parameters according to the mathematic form of the model. The central-tendency value of the ingested dose corresponding to a given biomarker concentration could be estimated using the central-tendency value for each parameter of the model. However, no single value, including the central tendency, can capture the range of possible values for a parameter in a heterogenous population. Furthermore, no combination of single-number (point-estimate 1) parameter values in a model can estimate the range of possible ingested doses. Because the RfD is intended to protect the most sensitive individuals in a population, an estimate based solely on the central tendency of the distribution (without uncertainty adjustment) would not provide a protective RfD. To be protective of the sensitive population, the ingested dose used as the basis for the RfD should be at the lower range of doses that could result in a given MeHg biomarker concentration. Figure 3-4 presents an estimate, using the one-compartment model, of the percentage of women of childbearing age having a hair Hg concentration of 11 ppm with a given MeHg ingested dose. The use of central-tendency values for each of the model parameters would approximate the ingested dose at which 50% of the population would achieve a hair MeHg concentration of 11 ppm. In that example, the dose is approximately 0.4 µg/kg per day. However, 50% of the population is predicted to achieve a hair Hg concentration of a 11 ppm with an ingested dose of MeHg of less than 0.4 µg/kg per day. An RfD based on an ingested dose of 0.4 µg/kg per day without further adjustment would, therefore, be protective of only 50% of the population. In that example, to protect 95% of the population from having a hair Hg
|
1 |
A point estimate is a single value, selected from a distribution of values, that is intended to represent the entire distribution. |
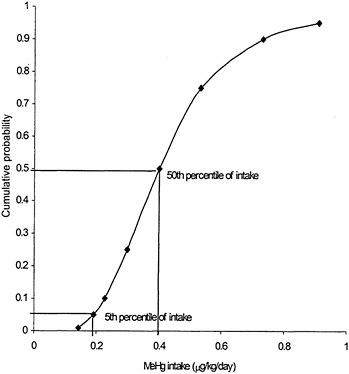
FIGURE 3-4 Predicted mean probability of MeHg intake corresponding to 11 ppm MeHg in hair. Source: Data from Stern 1997.
concentration above 11 ppm, the ingested dose would be about 0.2 µg/kg per day, or half the dose predicted using central-tendency values for the model parameters.
In estimating the range of ingested doses which could have resulted in a given biomarker concentration, there are three main sources of variability errors in model selection, errors in estimation of model parameters, and true population variability (i.e., heterogeneity). The variability due to the first two sources can be reduced by the collection
of more or better data and through development of more accurate models. However, heterogeneity in toxicokinetics is inherent in human populations, and the variability in estimates due to population variability cannot be decreased.
In its derivation of an RfD for MeHg, the U.S. Environmental Protection Agency (EPA) used point estimates to calculate an ingested dose from its benchmark hair concentration (EPA 1997). EPA did not address the distribution of the model parameters or of the predicted dose, nor did it characterize how inclusive its point estimate of dose was of the range of ingested doses that could have given rise to the benchmark hair concentration. An uncertainty factor of 3, however, was used to account for “variability in the human population, in particular, variation in the biological half-life of MeHg, and the variation that occurs in the hair/blood ratio for Hg.” Appendix D of volume 5 of the EPA Mercury Study Report to Congress (EPA 1997; see also Swartout and Rice 2000), presents an ad hoc probabilistic assessment of interindividual toxicokinetic variability, using the one-compartment model, in the calculation of the ingested dose. The results of that analysis, however, were not used by EPA in the derivation of its RfD.
In the derivation of an MRL for MeHg, ATSDR (1999) also used point-estimate values in the one-compartment model to calculate the ingested dose without addressing the distribution of the model parameters or of the predicted dose. Parameter estimates in the model were selected to reflect the central tendency of the range of values in the population. Two uncertainty factors of 1.5 each (summed to give an overall uncertainty factor of 3) were applied to the NOAEL to address “variability in hair-to-blood ratios among women and fetuses in the U.S. population, as determined by pharmacokinetic modeling of actual data by Clewell et al. (1998),” and “to address the remainder of any inter-individual variability (i.e., pharmacodynamics) in the U.S. population.” The appropriateness of such an overall adjustment that addresses interindividual variability in only one parameter of the toxicokinetic model (i.e., the hair-to-blood ratio) and the poorly characterized adjustment to account for the “remainder” of variability are difficult to assess.
Three analyses have been carried out to characterize the interindividual toxicokinetic variability in the estimates of the MeHg-ingested dose corresponding to a given concentration of Hg in a biomarker (Stern 1997; Swartout and Rice 2000 (see also EPA 1997); Clewell et al. 1999). Each
of those analyses used a Monte Carlo simulation to combine the probability distributions for the individual model parameters to generate a probability distribution of the corresponding ingested dose. That probability distribution estimates the fraction of the maternal population who could achieve a specific hair Hg concentration from a given MeHg ingestion. The analyses by Stern (1997) and Swartout and Rice (2000) are based on the one-compartment model, and that by Clewell et al. (1999) is based on the PBPK model.
Stern (1997) identified data on the distribution of parameters in the one-compartment model from the published literature. Blood volume and body weight were assumed to be correlated. A similar approach was used by Swartout and Rice (2000). In that analysis, however, some of the parameters are described by different distributional shapes or by distributions from different data sources than those used by Stern (1997). Swartout and Rice (2000) assumed correlations between several pairs of parameters: the hair-to-blood ratio and the elimination-rate constant; body weight and blood volume; and the fraction of the absorbed dose in the blood and body weight.
Clewell et al. (1999) likewise identified data on the distribution of parameters from the literature, but because the PBPK model contains many parameters that are not used in the one-compartment model, the distributions used in this analysis are not directly comparable to those used in one-compartment-model analyses. In addition, given the large number of parameters and the inconsistent availability of distributional data for those parameters, Clewell et al. (1999) tended to use default distributions for their model parameters.
The variability in the relationship between the concentration of Hg in maternal hair or cord blood and the ingested dose of MeHg predicted by the three analyses is summarized in Table 3-1. If the ingested dose is calculated from the Hg concentration in hair or blood from the central-tendency estimates of model parameters in either the one-compartment or the PBPK model, then the resulting ingested dose should approximate the 50th percentile of the population distribution. The ratio of the ingested dose corresponding to the 50th percentile of the distribution to the dose at the 5th percentile of the distribution, therefore, is an estimate of the factor by which the central-tendency estimate of the ingested dose should be divided to make the dose estimate inclusive of the variability in 95% of the population. Likewise, the ratio of the ingested dose
TABLE 3-1 Comparison of Results from Three Analyses of the Interindividual Variability in the Ingested Dose of MeHg Corresponding to a Given Maternal-Hair or Blood Hg Concentration
|
Study |
Maternal Medium |
50th percentilea (µg/kg-d) |
50th percentile/5thb percentile |
50th percentile/1st percentilec |
|
Stern (1997) |
hair |
0.03-0.05d (mean = 0.04) |
1.8-2.4 (mean = 2.1) |
2.3-3.3 (mean = 2.7) |
|
blood |
0.01 |
1.5-2.2 (mean = 1.8) |
1.7-3.0 (mean = 2.4) |
|
|
Swartout and Rice (2000) |
hair |
0.08 |
2.2 |
Data not reported |
|
bloode |
0.02 |
2.1 |
2.8 |
|
|
Clewell et al. (1999) |
hair |
0.08 |
1.5 |
1.8 |
|
Clewell et al. (1999) |
bloodf |
0.07 |
1.4 |
1.7 |
|
aPredicted 50th percentile of the ingested dose of methylmercury that corresponds to 1 ppm Hg in hair or 1 ppb in blood. bRatio of 50th percentile of ingested dose of methylmercury that corresponds to 1 ppm Hg in hair or 1 ppb in blood to the 5th percentile. cRatio of 50th percentile of ingested dose of methylmercury that corresponds to 1 ppm Hg in hair or 1 ppb in blood to the 1st percentile. dRange reflects minimum and maximum values among eight alternative analyses. eData from J. Swartout, U.S. Environmental Protection Agency, personal commun.; June 9, 2000. fData from H.J. Clewell, ICF Consulting, personal commun.; April 19, 2000. |
||||
corresponding to the 50th percentile of the distribution to the dose at the 1st percentile is an estimate of the factor by which the central tendency estimate should be divided to make the dose estimate inclusive of the variability in 99% of the population. In general, Stern (1997) and Swartout and Rice (2000) predicted similar variability in the relationship between hair Hg concentration and ingested dose, but both predicted a somewhat larger variability than did Clewell et al. (1999). Nonetheless, the three studies differ only by a factor of 1.5 in their predictions of both the 50th:5th and the 50th:1st percentile ratios. Although the three studies predict similar relative variability, examination of the median (i.e., 50th percentile) ingested dose predicted to correspond to 1 ppm Hg in maternal hair (Table 3-1) indicates that the absolute value of the central tendency of the distribution of ingested doses predicted by Stern
(1997) is lower than that predicted by the other two studies. In other words, the distribution predicted by Stern appears to be shifted toward lower-ingested dose values compared with the other two analyses. That difference appears to be due to selection of different data sets for several key model parameters. Given the existence of several valid data sets for those parameters, it is not clear which central-tendency estimate is more appropriate.
Each of those analyses (Stern 1997; Swartout and Rice 2000 (see also EPA 1997); Clewell et al. 1999) estimated the ingested dose corresponding to maternal-hair Hg concentration. For studies in which the biomarker measured is the Hg concentration in cord blood (e.g., the Faroe Islands studies), the estimation of the ingested dose would follow the same approach, except that the hair-to-blood ratio would be omitted from the model. The analyses of variability of the ingested dose can be recalculated for the variability of the ingested dose corresponding to a given blood Hg concentration. The results of that calculation for the three analyses are presented in Table 3-1. Comparison of the relative variability in the ingested dose based on the ratio of hair Hg concentration to blood Hg concentration indicates that the variability for maternal-hair Hg concentration is 1.1 to 1.2 times greater than that for the maternal-blood Hg concentration. That result is consistent with the results of sensitivity analyses conducted in each of the three studies, which identified the hair-to-blood ratio as a major contributor to the variability in the predicted ingested dose. Nonetheless, the Table 3-1 data, which are intended to describe the distribution of ingested doses that corresponds to a given cord-blood Hg concentration, actually describe the relationship between the ingested dose and the maternal-blood Hg concentration. The application of estimates based on the ratio of maternal-blood Hg concentration to estimates of cord-blood Hg concentration assumes that those two concentrations are equal. Some observations suggest that Hg concentrations in cord blood are larger than in maternal blood by at least 20-30 % (Dennis and Fehr 1975; Pitkin et al. 1976; Kuhnert et al. 1981), however, such differences are not seen consistently (Fujita and Takabatake 1977;Sikorski et al. 1989). Therefore, the data in Table 3-1 might underestimate the variability in ingested doses calculated from cord-blood Hg concentrations, however, that is not entirely clear.
On the basis of the data in Table 3-1, if an estimate of the ingested
dose from a benchmark hair Hg concentration is generated using point estimates of the central tendency for each model parameter, then dividing this initial estimate by an uncertainty factor of 2 would result in a dose that includes approximately 95% of the interindividual toxicokinetic variability in the population. Dividing the initial estimate by an uncertainty factor of 2-3 would include approximately 99% of the interindividual toxicokinetic variability. Similarly, for estimates of the ingested dose based on a benchmark blood Hg concentration, the data in Table 3-1 indicate that adjustment of a central-tendency estimate of the ingested dose by an uncertainty-factor adjustment of about 2 takes into account 95-99% of the interindividual toxicokinetic variability.
The use of uncertainty factors to adjust a central-tendency estimate of the ingested dose for interindividual variability is an indirect, or “back-end,” approach to accounting for such variability in the RfD. A direct, or “front-end,” approach would be to select as the starting point for the derivation of the RfD the ingested dose that corresponds to a given (e.g., benchmark) hair or blood Hg concentration for the percentile of the population variability that is to be accounted for. In that case, no uncertainty-factor adjustments would be necessary to account for toxicokinetic variability in the dose conversion. For example, with reference to Figure 3-4, if the benchmark (or NOAEL) hair concentration is 11 ppm and the RfD is intended to include the toxicokinetic variability in 95% of the population, then the corresponding ingested dose would be approximately 0.2 µg/kg per day. The difficulty with using such an approach is that, in the direct approach the estimate of the absolute value of the ingested dose is the critical determination. Whereas in the uncertainty factor approach the estimate of the relative variability in the ingested dose is critical. As discussed previously, for a given hair concentration the absolute value of the ingested dose for any given percentile of the population is not consistent in the analyses of Stern (1997), Swartout and Rice (2000), and Clewell et al. (1999). The analysis of Stern (1997) predicts lower absolute values of the ingested dose for a given percentile of the population than the other two analyses. Therefore, the use of the direct approach requires that a choice be made among the probability distributions predicted by those analyses. The differences in the analyses are due to the use of different data sets for parameter estimates, and there is no clear basis for choosing one data set over another. Even when central-tendency estimates and uncertainty
factors are used, the most appropriate value for each model parameter must be selected. Selection of different values for model parameters could underlie differences in the modeling results. The advantage of the uncertainty-factor approach, however, is that the choice for each model parameter is explicit. That allows for a more reasoned and detailed discussion of those choices. The analyses of Stern (1997), Swartout and Rice (2000), and Clewell et al. (1999) all discuss their choices of parameter estimates. The information presented in those discussions should be considered in the selection of the central-tendency estimates of the individual parameters.
CONCLUSIONS
-
Sensitivity to the toxic effects of MeHg is related to the age at which exposure occurs. Because of that, the fetus and young infants exposed during periods of rapid brain development are particularly vulnerable.
-
Sex differences appear to affect the metabolism, tissue uptake, excretion and toxicity of Hg.
-
Gender specific effects due to developmental exposure to MeHg typically indicate a greater sensitivity for male offspring.
-
Gender sensitivity in toxicity appears to be dependent on the species used and outcome studied.
-
-
Dietary nutrients and supplements might protect against the toxicity of MeHg. Data regarding the relative presence or absence of such nutrients and supplements either in the populations studied or in the United States are not available. The lack of that information contributes to overall data-base uncertainty, but it does not detract from the suitability of those studies for determining the risk associated with MeHg.
-
In addition to the above factors, intraindividual differences are clearly noted in responses to similar exposures. Those are explained, in part, by nutritional factors that might exacerbate or attenuate the effects of Hg toxicity in the host. Currently unknown genetic susceptibilities could be expected to play a role in response variability.
-
In any MeHg risk assessment in which the exposure metric is a Hg
-
biomarker concentration, it is necessary to use a toxicokinetic model to estimate the ingested dose that gave rise to the critical biomarker concentration (e.g., benchmark or NOAEL concentration).
-
The simpler and more easily manipulated one-compartment model and the more complex but more realistic PBPK model have been used for that purpose.
-
The parameters in those models are variables whose possible values are described by probability distributions reflecting the interindividual variability in the population.
-
The ingested doses predicted by the one-compartment and PBPK models, therefore, are also probability distributions that reflect the likelihood that any given ingested dose could give rise to the critical biomarker concentration.
-
Failure to consider interindividual toxicokinetic variability can result in an RfD that is not protective of a substantial portion of the population.
-
Interindividual toxicokinetic variability can be addressed in the derivation of the RfD by application of an uncertainty factor to a central- tendency estimate of the ingested dose.
-
It is uncertain which values are most appropriate for the model parameters used to derive the central-tendency estimates. The basis for each choice should be carefully considered with reference to discussions already presented in the published analyses of toxicokinetic variability.
-
RECOMMENDATIONS
-
Future studies of MeHg exposures in humans should include a thorough assessment of the diet during the periods of vulnerability and exposure. They should involve assessment of the nutritional adequacy of the group, including the assessment of nutritional and environmental factors that might attenuate or exacerbate the effect of MeHg on the health end points measured.
-
Dietary assessment should be conducted concurrently with the exposures, because retrospective assessment is influenced by many factors, including memory, changes in eating behavior,
-
-
food fortification, and use of prenatal and postnatal vitamin and mineral supplementation. Dietary assessment should be conducted on a person-specific basis, with particular effort to estimate quantitatively individual consumption and consumption patterns of fish and pilot whale.
-
For all the studies, the estimates of consumption of fish (and whale meat as appropriate) should be used with information on MeHg concentrations in the food to estimate possible MeHg intake by pregnant women, young children, and adults. Attempts should be made to validate estimates of intake by using experimental data on the relationship between hair Hg concentration and diet intake.
-
Future studies should include a standardized measure of the duration of breast-feeding and the quantity of breast milk ingested by infants. The dose of MeHg is dependant on the amount of milk ingested and the MeHg content of the milk. Historical recording of duration of breast-feeding is likely to be biased; therefore, a prospective diary of breast-feeding and weaning should be considered.
-
Studies using animal models should examine changes in the dose response characteristics of Hg effects associated with nutritional or genetic factors.
-
Any biomarker-based RfD for MeHg should specifically address interindividual toxicokinetic variability in the estimation of dose corresponding to a given biomarker concentration.
-
The starting point for addressing interindividual toxicokinetic variability should be a central-tendency estimate of the ingested dose corresponding to a critical biomarker concentration (e.g., a benchmark hair concentration).
-
The central-tendency estimate of the ingested dose should be based on careful consideration of the several possible and sometimes contradictory data sets for each parameter. A starting point for such consideration is the discussion of parameter distributions presented in the analyses of Stern (1997), Swartout and Rice (2000), and Clewell et al. (1999).
-
-
An uncertainty-factor adjustment should be applied to any central-tendency estimate of the ingested dose corresponding to the critical biomarker concentration.
-
For an RfD based on maternal-hair Hg concentration, an uncertainty-factor adjustment of 2 should be applied to the central-tendency estimate of dose to be inclusive of 95% of the toxicokinetic variability in the population. An uncertainty-factor adjustment of 2-3 should be applied to be inclusive of 99% of the toxicokinetic variability.
-
For an RfD based on blood Hg concentration, an uncertainty factor adjustment of about 2 should be applied to the central-tendency estimate of dose to be inclusive of 95-99% of the toxicokinetic variability in the population.
-
Because of the recognized nutritional benefits of diets rich in fish, the best method of maintaining fish consumption and minimizing Hg exposure is the consumption of fish known to have lower MeHg concentrations.
REFERENCES
Adachi, T., A. Yasutake, and K. Hirayama. 1992. Influence of dietary protein levels on the fate of methylmercury and glutathione metabolism in mice. Toxicology 72(1):17-26.
Adachi, T., A. Yasutake, and K. Hirayama. 1994. Influence of dietary levels of protein and sulfur amino acids on the fate of methylmercury in mice. Toxicology 93(2-3):225-23.
Alexander, J., and J. Aaseth. 1982. Organ distribution and cellular uptake of methyl mercury in the rat as influenced by the intra- and extracellular glutathione concentration . Biochem. Pharmacol 31(5):685-690.
Andersen, H.R., and O. Andersen. 1993. Effects of dietary alpha-tocopherol and beta- carotene on lipid peroxidation induced by methyl mercuric chloride in mice. Pharmacol. Toxicol. 73(4):192-201.
Aschner, M., and J.L. Aschner. 1990. Mercury neurotoxicity: Mechanisms of blood-brain barrier transport . Neurosci. Biobehav. Rev. 14(2):169-176.
Aschner, M., and T.W. Clarkson. 1987. Mercury 203 distribution in pregnant and nonpregnant rats following systemic infusions with thiol-containing amino acids. Teratology 36(3):321-328.
Aschner, M., and T.W. Clarkson. 1988. Uptake of methylmercury in the rat brain: Effects of amino acids. Brain Res. 462(1):31-39.
ATSDR (Agency for Toxic Substances and Disease Registry). 1999. Toxicological Profile for Mercury (Update). U.S. Department of Health and Human Services, Public Health Service. Agency for Toxic Substances and Disease Registry Atlanta, GA. March.
Bakir, F., S.F. Damluji, L. Amin-Zaki, M. Murthadha, A. Khalidi, N.Y. al-Rawi, S. Tikriti, S H.I. Dahahir, T.W. Clarkson, J.C. Smith, and R.A. Doherty. 1973. Methylmercury poisoning in Iraq. Science 181:230-241.
Block, E. 1985. The chemistry of garlic and onions. Sci. Am. 252(3):114-119.
Burbacher, T.M., M.K. Mohamed, and N.K. Mottett. 1988. Methylmercury effects on reproduction and offspring size at birth . Reprod. Toxicol 1(4):267-278.
Cha, C.W. 1987. A study on the effect of garlic to the heavy metal poisoning of rat . J. Korean Med. Sci. 2(4):213-224.
Chalon, S., S. Delion-Vancassel, C. Belzung, D. Guilloteau, A.M. Leguisquet, J.C. Besnard, and G. Durand. 1998. Dietary fish oil affects monoaminergic neurotransmission and behavior in rats. J. Nutr. 128(12):2512-2519.
Chang, L.W., M. Gilbert, and J. Sprecher. 1978. Modification of methylmercury neurotoxicity by vitamin E. Environ. Res. 17(3):356-66.
Chapman, L., and H.M. Chan. 2000. The influence of nutrition on methyl mercury intoxication. Environ. Health Perspect. 108(Suppl.1):29-56.
Clewell, H.J., P.R. Gentry, A.M. Shipp, and K.S. Crump. 1998. Determination of a Site-Specific Reference Dose for Methylmercury for Fish-Eating Populations. ICF Kaiser International, KS Crump Group, Ruston, Louisiana.
Clewell, H.J., J.M. Gearhart, P.R. Gentry, T.R. Covington, C.B. VanLandingham, K.S. Crump, and A.M. Shipp. 1999. Evaluation of the uncertainty in an oral reference dose for methylmercury due to inter-individual variability in pharmacokinetics. Risk Anal. 19(4):547-558.
Dennis, C.A., and F. Fehr. 1975. The relationship between mercury levels in maternal and cord blood . Sci. Total Environ. 3(3):275-277.
EPA (U.S. Environmental Protection Agency). 1997. Mercury Study Report for Congress. Vol. V: Health Effects of Mercury and Mercury Compounds. EPA-452/R-97-007. U.S. Environmental Protection Agency, Office of Air Quality Planning and Standards, and Office of Research and Development.
Fowler, B.A. 1972. Ultrastructural evidence for nephropathy induced by long-term exposure to small amounts of methyl mercury. Science 175(23):780-781.
Fredriksson, A., A.T. Gardlund, K. Bergman, A. Oskarsson, B. Ohlin, B. Danielsson, and T. Archer. 1993. Effects of maternal dietary supplementation with selenite on the postnatal development of rat offspring exposed to methylmercury in utero. Pharmacol. Toxicol. 72(6):377-382.
Fujita, M., and E. Takabatake. 1977. Mercury levels in human maternal and neonatal blood, hair and milk . Bull. Environ. Contam. Toxicol. 18(2):205-209.
Ganther, H.E., C. Goudie, M.L. Sunde, M.J. Kopecky, and P. Wagner. 1972. Selenium: Relation to decreased toxicity of methylmercury added to diets containing tuna. Science 175(26):1122-1124.
Glynn, A.W., and Y. Lind. 1995. Effect of long-term sodium selenite
supplementation on levels and distribution of mercury in blood, brain and kidneys of methyl mercury-exposed female mice. Pharmacol. Toxicol. 77(1):41-47.
Greiner, R.S, T. Moriguchi, A. Hutton, B.M. Slotnick, and N. Salem, Jr. 1999. Rats with low levels of brain docosahexaenoic acid show impaired performance in olfactory-based and spatial learning tasks. Lipids 34(Suppl.): S239-S243.
Harada, Y. 1968. Congenital (or fetal) Minamata disease. Pp. 93-118 in Minamata Disease. Study group of Minamata Disease. Japan:Kumamoto University.
Hirayama, K. 1985. Effects of combined administration of thiol compounds and methylmercury chloride on mercury distribution in rats. Biochem. Pharmacol. 34(11):2030-2032.
Hirayama, K., and A. Yasutake. 1986. Sex and age differences in mercury distribution and excretion in methylmercury-administered mice. J. Toxicol. Environ. Health 18(1):49-60.
Ikarashi, A., K. Sasaki, M. Toyoda, and Y. Saito. 1996. Annual daily intakes of Hg, PCB and arsenic from fish and shellfish and comparative survey of their residue levels in fish by body weight . [in Japanese]. Eisei Shikenjo Hokoku (114):43-47.
IPCS (International Programme on Chemical Safety). 1990. Environmental Health Criteria Document 101 — Methylmercury. Geneva: World Health Organization.
Kasuya, M. 1975. The effect of vitamin E on the toxicity of alkyl mercurials on nervous tissue in culture. Toxicol. Appl. Pharmacol. 32(2):347-54.
Kling, L.J., and J.H. Soares, Jr. 1982. Effect of mercury and vitamin E on tissue glutathione peroxidase activity and thiobarbituric acid values. Poult. Sci. 61:1762-1765.
Kling, L.J., J.H. Soares, Jr., and W.A. Haltman. 1987. Effect of vitamin E and synthetic antioxidants on the survival rate of mercury-poisoned Japanese quail. Poult. Sci. 66:325-331.
Kohlmeier, L., and M. Kohlmeier. 1995. Adipose tissue as a medium for epidemiologic exposure assessment. Environ. Health Perspect. 103(Suppl.3): 99-106.
Kuhnert, P.M., B.R. Kuhnert, and P. Erhard. 1981. Comparison of mercury levels in maternal blood, fetal cord blood, and placental tissues. Am. J. Obstet. Gynecol. 139(2):209-213.
Landry, T.D., R.A. Doherty, and A.H. Gates. 1979. Effects of three diets on mercury excretion after methylmercury administration . Bull. Environ. Contam. Toxicol. 22(1-2):151-158.
LeBel, C.P., S.F. Ali, and S.C. Bondy. 1992. Deferoxamine inhibits methyl mercury induced increases in reactive oxygen species formation in rat brain. Toxicol. Appl. Pharmacol. 112(1):161-165.
Magos, L., F. Bakir, T.W. Clarkson, A.M. Al-Jawad, and M.H. Al-Soffi. 1976. Tissue levels of mercury in autopsy specimens of liver and kidney . Bull. WHO 53(Suppl.):93-97.
Marsh, D.O., G.J. Myers, T.W. Clarkson, L. Amin-Zaki, S. Tikriti, and M.A. Majeed. 1980. Fetal methylmercury poisoning: Clinical and toxicological data on 29 cases. Ann. Neurol. 7(4):348-353.
McKeown-Eyssen, G.E.,J. Ruedy, and A. Neims. 1983. Methylmercury exposure in northern Quebec. II. Neurologic findings in children. Am. J. Epidemiol. 118(4):470-479.
McNeil, S.I., M.K. Bhatnager, and C.J. Turner. 1988. Combined toxicity of ethanol and methylmercury in rat. Toxicology 53(2-3):345-363.
Miettinen, J.K. 1973. Absorption and elimination of dietary (Hg++) and methylmercury in man. Pp. 233-246 in Mercury, Mercurial, and Mercaptans, M.W. Miller, and T.W. Clarkson, eds. Springfield, IL: C.C. Thomas.
Mokrzan, E.M., L.E. Kerper, N. Ballatori, and T.W. Clarkson. 1995. Methylmercury-thiol uptake into cultured brain capillary endothelial cells on amino acid system L. J. Pharmacol. Exp. Ther. 272(3):1277-1284.
Mottet, N.K., C.M. Shaw, and T.M. Burbacher. 1987. The pathological lesions of methyl-mercury intoxication in monkeys . Pp. 73-103 in The Toxicity of Methyl Mercury, C.U. Eccles, and Z. Annau, eds. Baltimore: Johns Hopkins.
Murray, D.R., and R.E. Hughes. 1976. The influence of dietary ascorbic acid on the concentration of mercury in guinea-pig tissues. Proc. Nutr. Soc. 35(3):118A-119A.
NIEHS (National Institute of Environmental Health Sciences). 1998. Scientific Issues Relevant to Assessment of Health Effects from Exposure to Methylmercury. Workshop organized by Committee on Environmental and Natural Resources(CENR) Office of Science and Technology Policy (OSTP) The White House. November 18-20, 1998. Raleigh, NC.
Nielsen, J.B., and O. Andersen. 1991. Methyl mercuric chloride toxicokinetics in mice. II: Sexual differences in whole-body retention and deposition in blood, hair, skin, muscles and fat. Pharmacol. Toxicol. 68(3):208-211.
Nishikido, N., K. Furuyashiki, A. Naganuma, T. Suzuki, and N. Imura. 1987. Maternal selenium deficiency enhances the fetolethal toxicity of methyl mercury. Toxicol. Appl. Pharmacol. 88(3):322-328.
Nobunaga, T., H. Satoh, and T. Suzuki. 1979. Effects of sodium selenite on methyl mercury embryotoxicity and teratogenicity in mice. Toxicol. Appl. Pharmacol. 47:79-88.
Osman, K., A. Schutz, B. Akesson, A. Maciag, and M. Vahter. 1998. Interactions between essential and toxic elements in lead exposed children in Katowice, Poland. Clin. Biochem. 31(8):657-665.
Park, S.T., K.T. Lim, Y.T. Chung, and S.U. Kim. 1996. Methylmercury-induced neurotoxicity in cerebral neuron culture is blocked by antioxidants and NMDA receptor antagonists. Neurotoxicology 17(1):37-45.
Pitkin, R.M., J.A. Bahns, L.J. Filer, Jr., and W.A. Reynolds. 1976. Mercury in human maternal and cord blood, placenta, and milk. Proc. Soc. Exp. Biol. Med. 151(3):565-567.
Petridou, E., M. Koussouri, N. Toupadaki, S. Youroukos, A: Papavassiliou, S. Pantelakis, J. Olsen, and D. Trichopoulos. 1998. Diet during pregnancy and the risk of cerebral palsy. Br. J. Nutr. 79(5):407-412.
Potter, S., and G. Matrone. 1974. Effect of selenite on the toxicity of dietary methylmercury and mercuric chloride in the rat. J. Nutr. 104(5):638-647.
Prasad, K.N., and S. Ramanujam. 1980. Vitamin E and vitamin C alter the effect of methylmercuric chloride on neuroblastoma and glioma cells in culture. Environ. Res. 21(2):343-349.
Rhee, M.G., C.W. Cha, and E.S. Bae. 1985. The chronological changes of rat tissue and the effect of garlic in acute methylmercury poisoning. Kor. Univ. Med. J. 22(1):153-164.
Rice, D.C., and S.G. Gilbert. 1990. Effects of developmental exposure to methyl mercury on spatial and temporal visual function in monkeys. Toxicol. Appl. Pharmacol. 102(1):151-163.
Rowland, I.R., R.D. Robinson, and R.A. Doherty. 1984. Effects of diet on mercury metabolism and excretion in mice given methylmercury: Role of gut flora. Arch. Environ. Health 39(6):401-408.
Rowland, I.R., A.K. Mallett, J. Flynn, and R.J. Hargreaves. 1986. The effect of various dietary fibres on tissue concentration and chemical form of mercury after methyl mercury exposure in mice. Arch. Toxicol. 59(2):94-98.
Rumbeiha, W.K., P.A. Gentry, and M.K. Bhatnagar. 1992. The effects of administering methylmercury in combination with ethanol in the rat. Vet. Hum. Toxicol. 34(1):21-25.
Satoh, H., and T. Suzuki. 1979. Effects of sodium selenite on methylmercury distribution in mice of late gestational period. Arch. Toxicol. 42(4):275-279.
Sikorski, R., T. Paszkowski, P. Slawinski, J. Szkoda, J. Zmudzki, and S. Skawinski. 1989. The intrapartum content of toxic metals in maternal blood and umbilical cord blood. Ginekol. Pol. 60(3):151-155.
Spyker, J.M., S.B. Sparber, and A.M. Goldberg. 1972. Subtle consequences of methyl mercury exposure: Behavioral deviations in offspring of treated mothers. Science 177(49):621-623.
Stern, A.H. 1997. Estimation of the inter-individual variability in the one-
compartment pharmacokinetic model for methylmercury: Implications for the derivation of a reference dose. Reg. Toxicol. Pharmacol. 25(3):277-288.
Strange, R.C., and A.A. Fryer. 1999. Chapter 19. The glutathione S-transferases: Influence of polymorphism on cancer susceptibility. IARC Sci. Publ. (148):231-249.
Swartout, J., and G. Rice. 2000. Uncertainty analysis of the estimated ingestion rates used to derive the methylmercury reference dose. Drug Clin. Toxicol. 23(1):293-306.
Tagashira, E., T. Urano, and S. Yanaura. 1980. Methylmercury toxicosis. I. Relationship between the onset of motor incoordination and mercury contents in the brain. [ in Japanese]. Nippon Yakurigaku Zasshi 76(2):169-177.
Takahashi, H., K. Shibuya, and Y. Fukushima. 1978. A study of the factors influencing toxicity of methylmercury. [in Japanese]. Kumamota University Medical School Toxicol. Rep. 11:15-16.
Takeuchi, T. 1968. Pathology of Minamate disease. Pp. 141-228in Minamata Disease. Study Group of Minanata Disease, ed. Kumamoto, Japan: Kumamoto University.
Tamashiro, H., M. Arakaki, H. Akagi, K. Hirayama, K. Murao, and M.H. Smolensky. 1986a. Sex differential of methylmercury toxicity in spontaneously hypertensive rats (SHR). Bull. Environ. Contam. Toxicol. 37(6):916-924.
Tamashiro, H., M. Arakaki, H. Akagi, K. Murao, K. Hirayama, and M.H. Smolensky. 1986b. Effects of ethanol on methyl mercury toxicity in rats. J. Toxicol. Environ. Health 18(4):595-605.
Thomas, D.J., H.L. Fisher, M.R. Sumler, A.H. Marcus, P. Mushak, and L.L. Hall. 1986. Sexual differences in the distribution and retention of organic and inorganic mercury in methyl mercury-treated rats. Environ. Res. 41(1):219-234.
Turner, C.J., M.K. Bhatnagar, and S. Yamashiro. 1981. Ethanol potentiation of methylmercury toxicity: A preliminary report . J. Toxicol. Environ. Health 7(3-4):665-668.
Vorhees, C.V. 1985. Behavioral effects of prenatal methylmercury in rats: A parallel trial to the Collaborative Behavioral Teratology Study. Neurobehav. Toxicol. Teratol. 7(6):717-725.
Welsh, S.O. 1977. Contrasting effects of vitamins A and E on mercury poisoning. [Abstract]. Fed. Proc. 36(1146):4627.
Wu, G. 1995. Screening of potential transport systems for methyl mercury uptake in rat erythrocytes at 5 degrees by use of inhibitors and substrates . Pharmacol. Toxicol. 77(3):169-176.
Yasutake, A., and K. Hirayama. 1988. Sex and strain differences of susceptibility to methylmercury toxicity in mice. Toxicology 51(1):47-55.


