20 Questions & Answers
Is the climate warming?
How do scientists know that recent climate change is largely caused by human activities?
Is the climate warming?
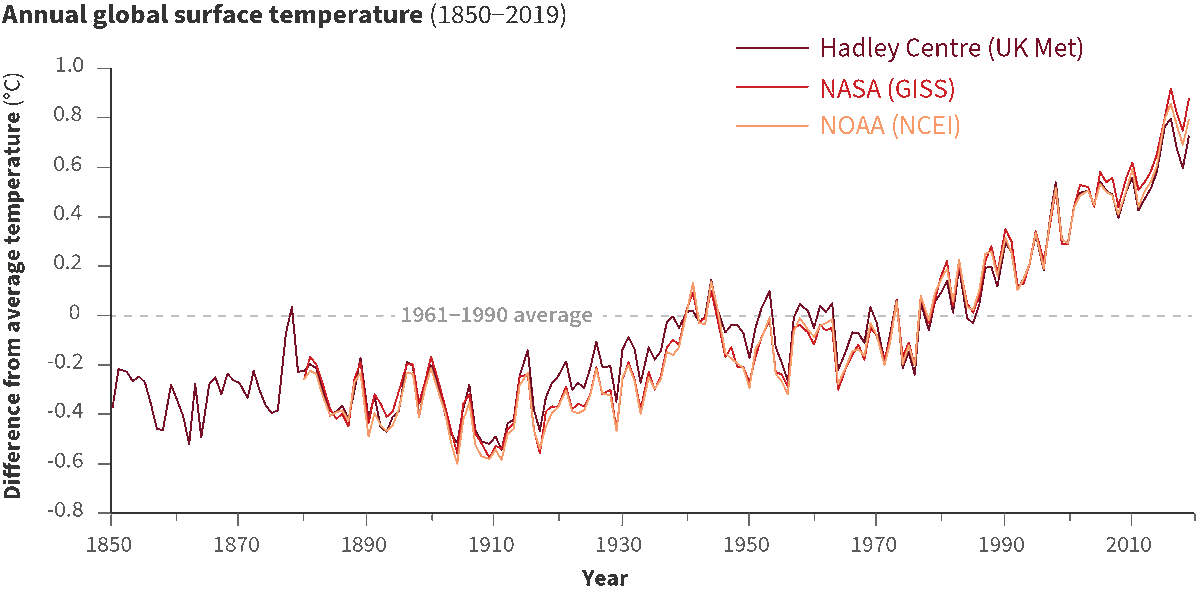
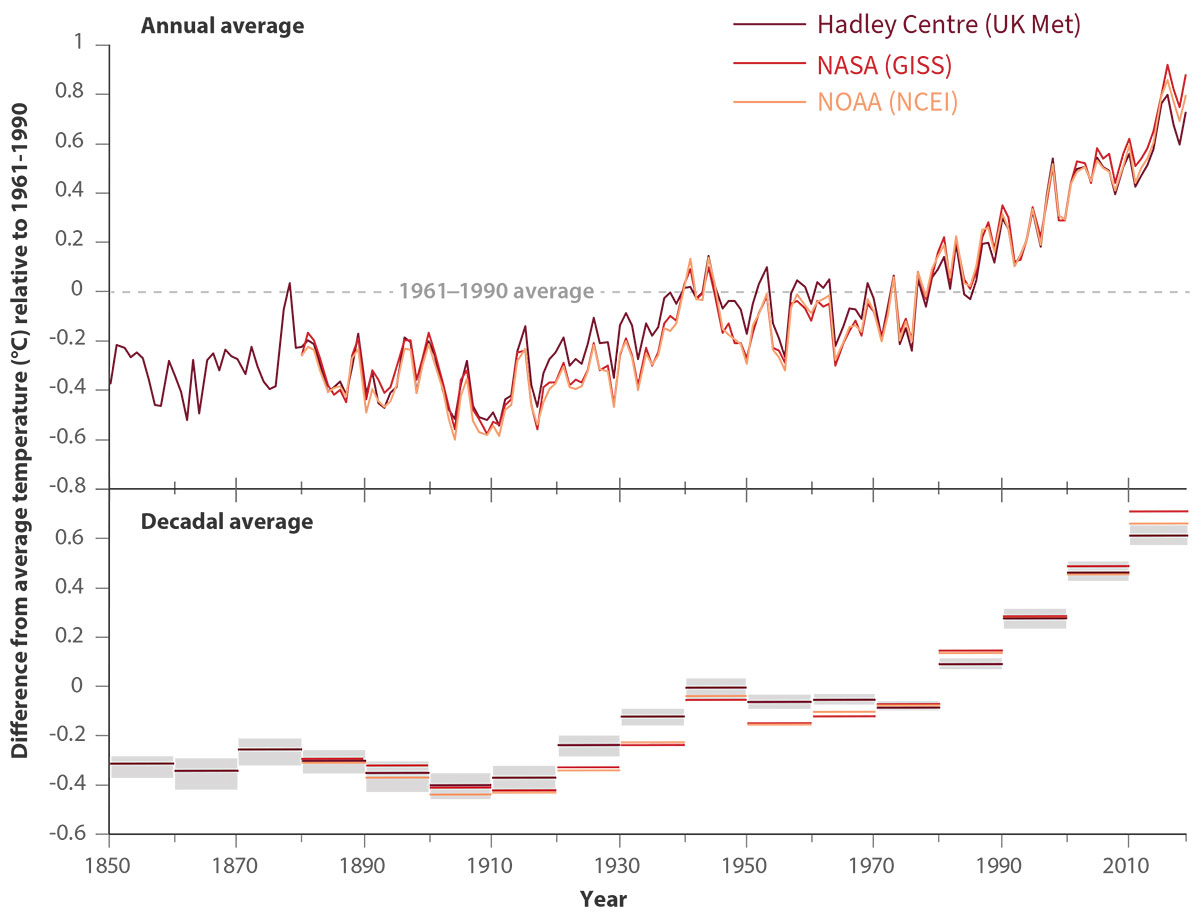
Yes. Earth’s average surface air temperature has increased by about 1 °C (1.8 °F) since 1900, with over half of the increase occurring since the mid-1970s [Figure 1a]. A wide range of other observations (such as reduced Arctic sea ice extent and increased ocean heat content) and indications from the natural world (such as poleward shifts of temperature-sensitive species of fish, mammals, insects, etc.) together provide incontrovertible evidence of planetary-scale warming.
The clearest evidence for surface warming comes from widespread thermometer records that, in some places, extend back to the late 19th century. Today, temperatures are monitored at many thousands of locations, over both the land and ocean surface. Indirect estimates of temperature change from such sources as tree rings and ice cores help to place recent temperature changes in the context of the past. In terms of the average surface temperature of Earth, these indirect estimates show that 1989 to 2019 was very likely the warmest 30-year period in more than 800 years; the most recent decade, 2010-2019, is the warmest decade in the instrumental record so far (since 1850).
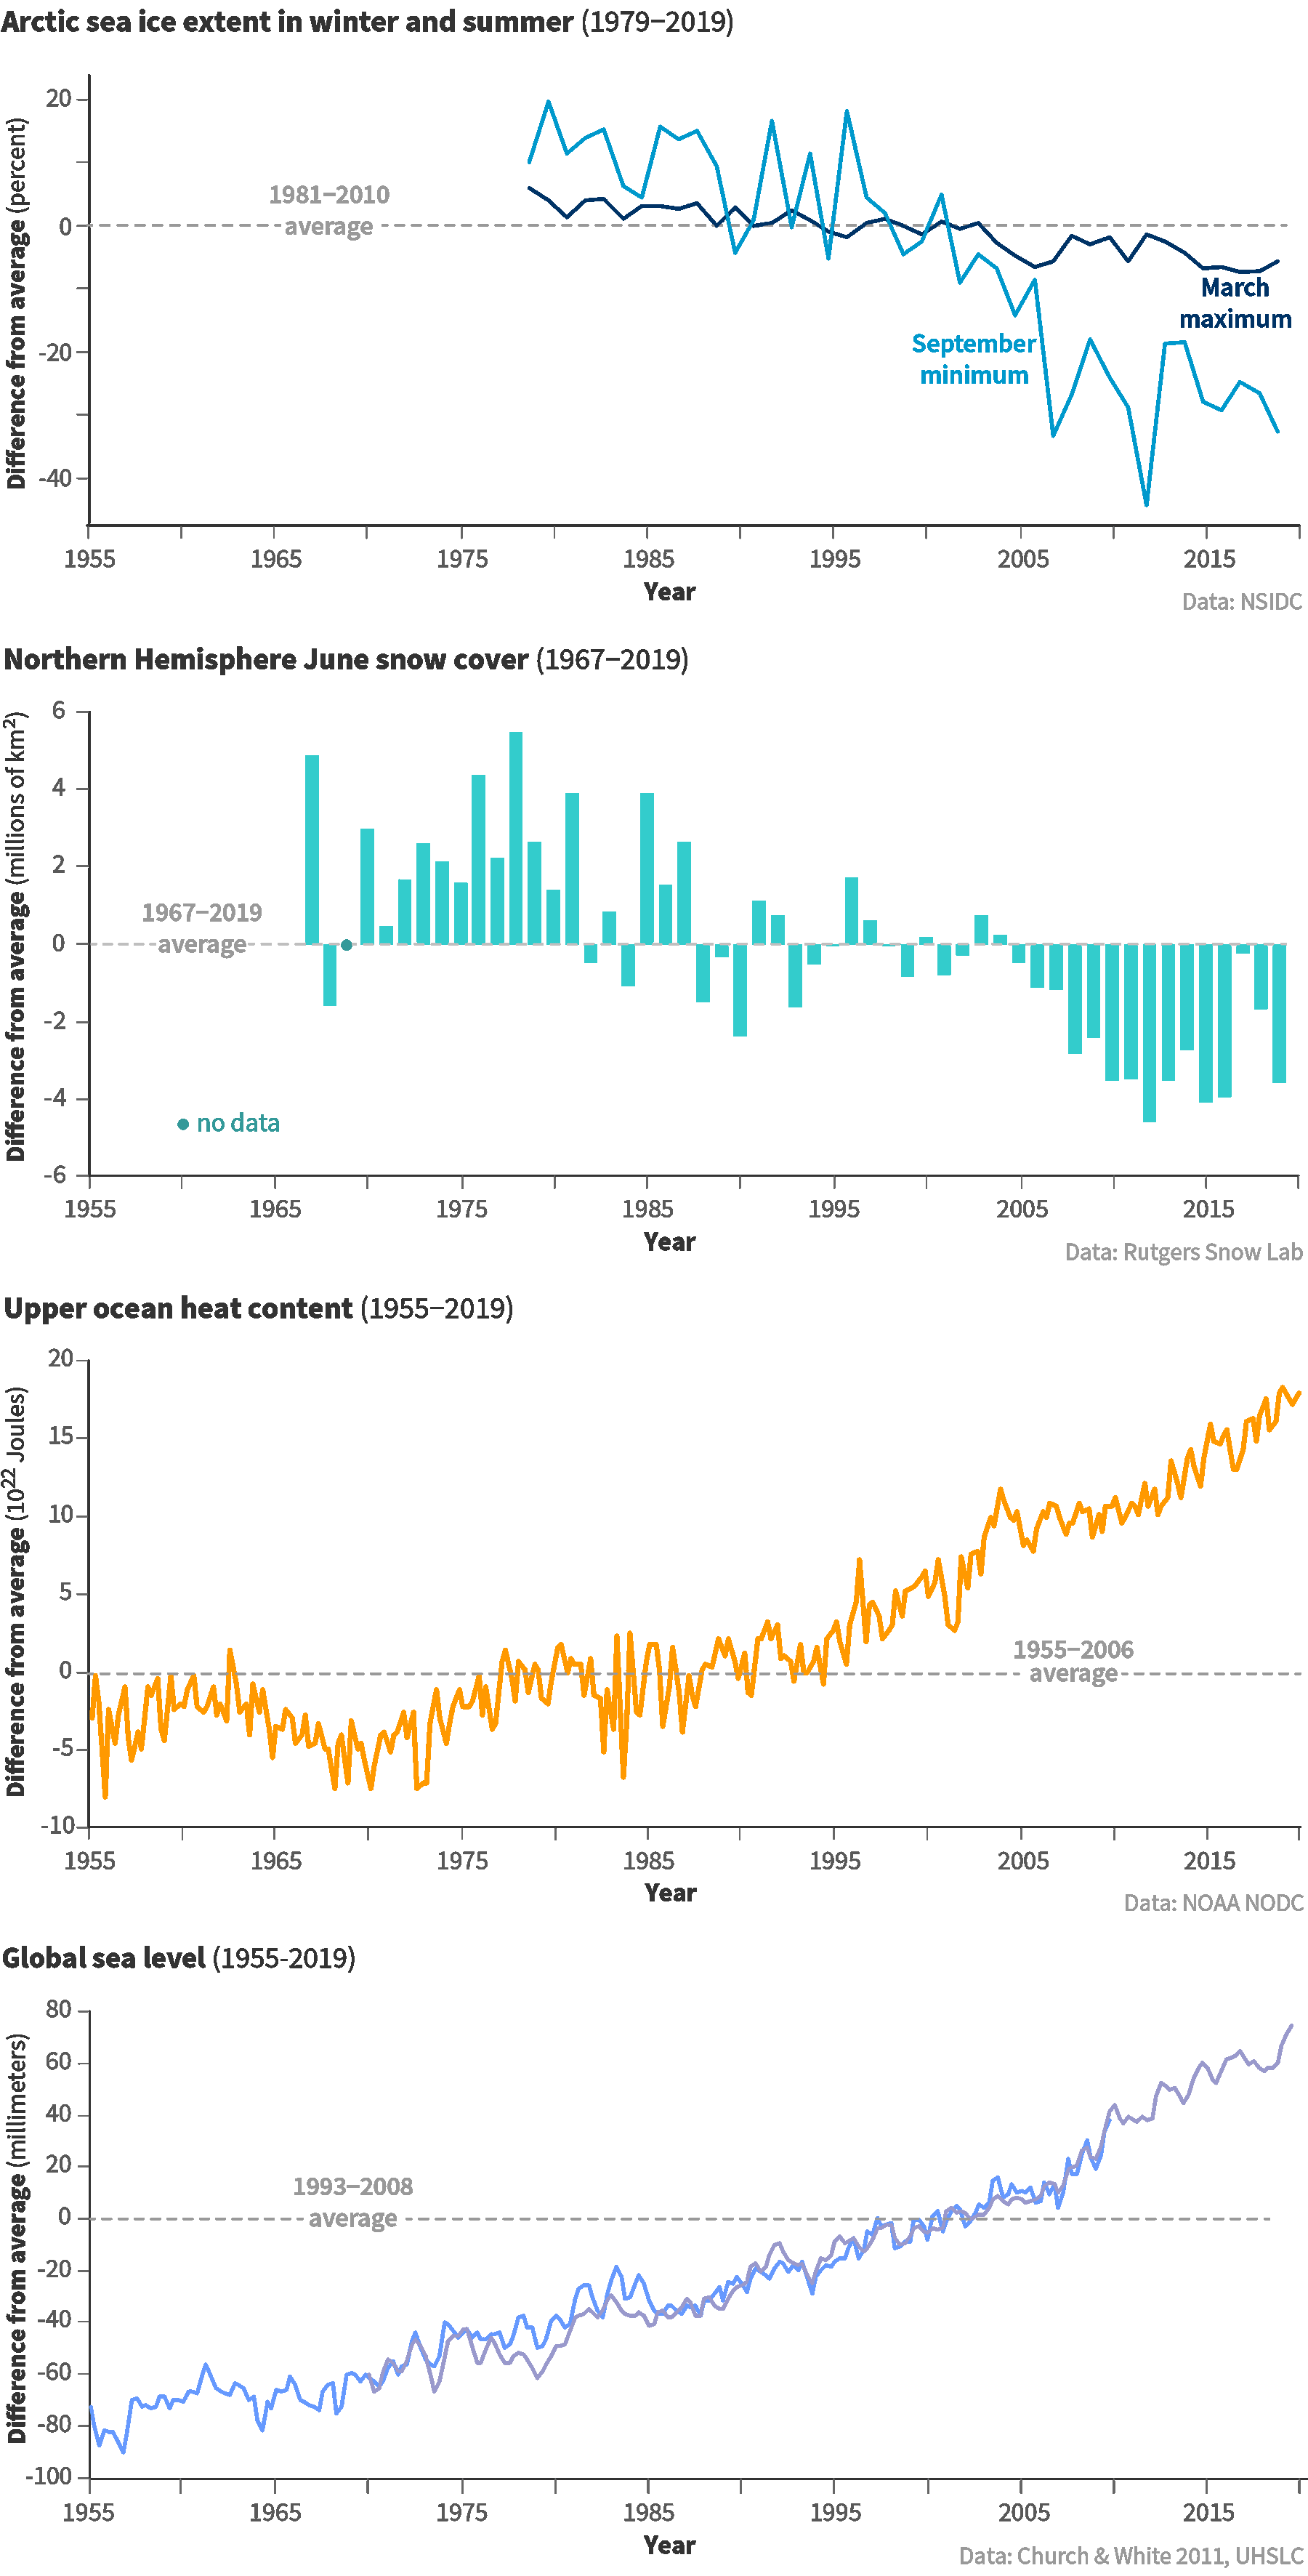
A wide range of other observations provides a more comprehensive picture of warming throughout the climate system. For example, the lower atmosphere and the upper layers of the ocean have also warmed, snow and ice cover are decreasing in the Northern Hemisphere, the Greenland ice sheet is shrinking, and sea level is rising [Figure 1b]. These measurements are made with a variety of land-, ocean-, and space-based monitoring systems, which gives added confidence in the reality of global-scale warming of Earth’s climate.
CO2 is already in the atmosphere naturally, so why are emissions from human activity significant?
What role has the Sun played in climate change in recent decades?
CO2 is already in the atmosphere naturally, so why are emissions from human activity significant?
Human activities have significantly disturbed the natural carbon cycle by extracting long-buried fossil fuels and burning them for energy, thus releasing CO2 to the atmosphere.
In nature, CO2 is exchanged continually between the atmosphere, plants, and animals through photosynthesis, respiration, and decomposition, and between the atmosphere and ocean through gas exchange. A very small amount of CO2 (roughly 1% of the emission rate from fossil fuel combustion) is also emitted in volcanic eruptions. This is balanced by an equivalent amount that is removed by chemical weathering of rocks.
The CO2 level in 2019 was more than 40% higher than it was in the 19th century. Most of this CO2 increase has taken place since 1970, about the time when global energy consumption accelerated. Measured decreases in the fraction of other forms of carbon (the isotopes 14C and 13C) and a small decrease in atmospheric oxygen concentration (observations of which have been available since 1990) show that the rise in CO2 is largely from combustion of fossil fuels (which have low 13C fractions and no 14C). Deforestation and other land use changes have also released carbon from the biosphere (living world) where it normally resides for decades to centuries. The additional CO2 from fossil fuel burning and deforestation has disturbed the balance of the carbon cycle, because the natural processes that could restore the balance are too slow compared to the rates at which human activities are adding CO2 to the atmosphere. As a result, a substantial fraction of the CO2 emitted from human activities accumulates in the atmosphere, where some of it will remain not just for decades or centuries, but for thousands of years. Comparison with the CO2 levels measured in air extracted from ice cores indicates that the current concentrations are substantially higher than they have been in at least 800,000 years (see Question 6).

What role has the Sun played in climate change in recent decades?
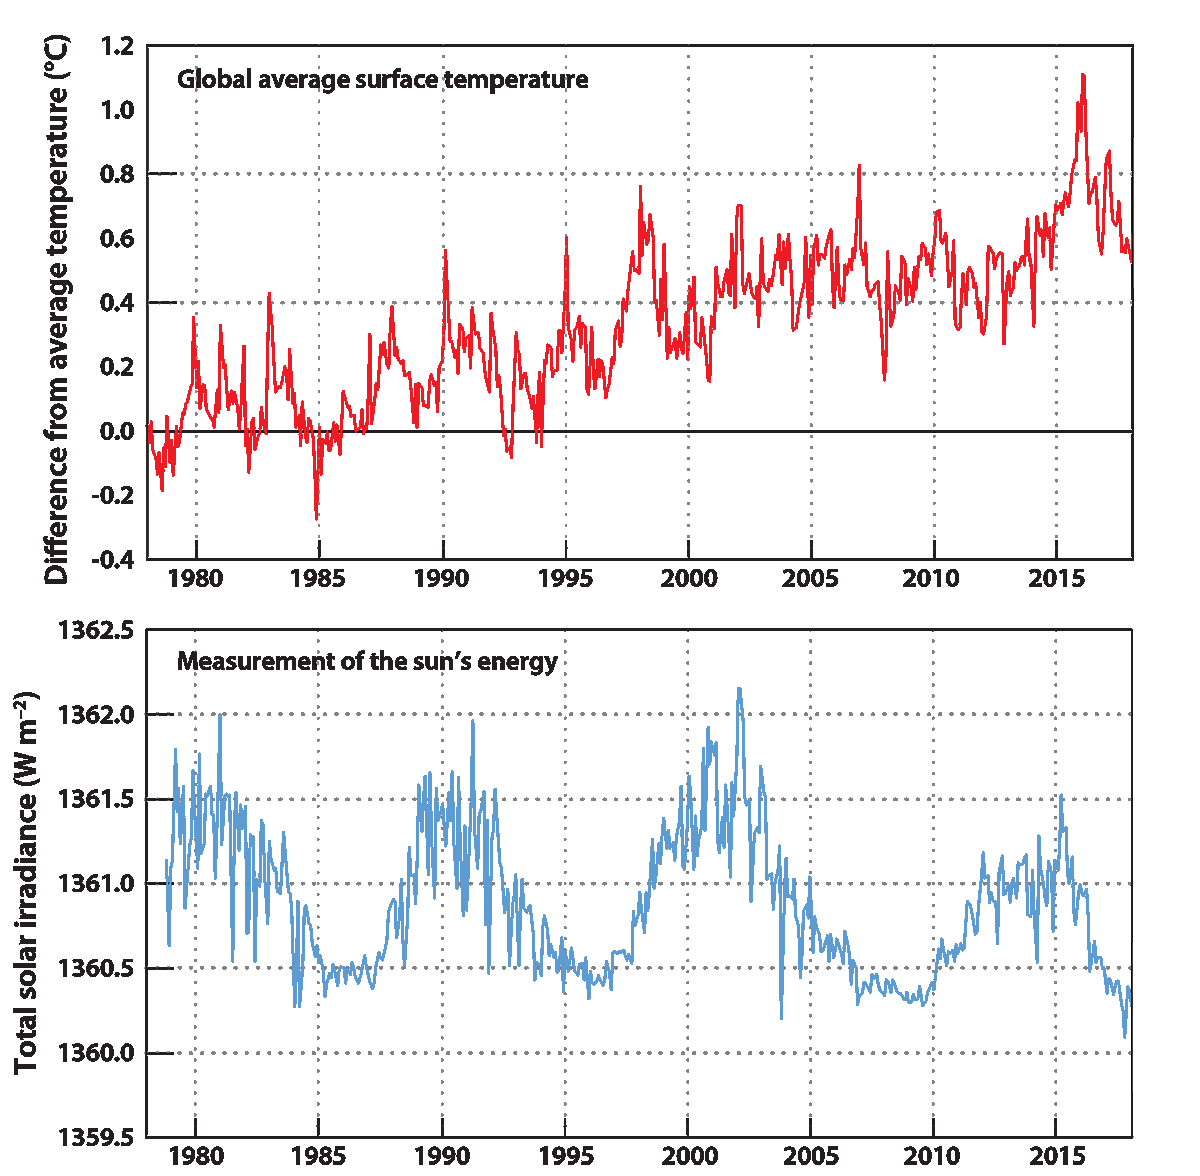
The Sun provides the primary source of energy driving Earth’s climate system, but its variations have played very little role in the climate changes observed in recent decades. Direct satellite measurements since the late 1970s show no net increase in the Sun’s output, while at the same time global surface temperatures have increased [Figure 2].
For periods before the onset of satellite measurements, knowledge about solar changes is less certain because the changes are inferred from indirect sources — including the number of sunspots and the abundance of certain forms (isotopes) of carbon or beryllium atoms, whose production rates in Earth’s atmosphere are influenced by variations in the Sun. There is evidence that the 11-year solar cycle, during which the Sun’s energy output varies by roughly 0.1%, can influence ozone concentrations, temperatures, and winds in the stratosphere (the layer in the atmosphere above the troposphere, typically from 12 to 50km above earth’s surface, depending on latitude and season). These stratospheric changes may have a small effect on surface climate over the 11-year cycle. However, the available evidence does not indicate pronounced long-term changes in the Sun’s output over the past century, during which time humaninduced increases in CO2 concentrations have been the dominant influence on the long-term global surface temperature increase. Further evidence that current warming is not a result of solar changes can be found in the temperature trends at different altitudes in the atmosphere (see Question 5).
What do changes in the vertical structure of atmospheric temperature —from the surface up to the stratosphere—tell us about the causes of recent climate change?
Climate is always changing. Why is climate change of concern now?
What do changes in the vertical structure of atmospheric temperature —from the surface up to the stratosphere—tell us about the causes of recent climate change?
The observed warming in the lower atmosphere and cooling in the upper atmosphere provide us with key insights into the underlying causes of climate change and reveal that natural factors alone cannot explain the observed changes.
In the early 1960s, results from mathematical/physical models of the climate system first showed that human-induced increases in CO2 would be expected to lead to gradual warming of the lower atmosphere (the troposphere) and cooling of higher levels of the atmosphere (the stratosphere). In contrast, increases in the Sun’s output would warm both the troposphere and the full vertical extent of the stratosphere. At that time, there was insufficient observational data to test this prediction, but temperature measurements from weather balloons and satellites have since confirmed these early forecasts. It is now known that the observed pattern of tropospheric warming and stratospheric cooling over the past 40 years is broadly consistent with computer model simulations that include increases in CO2 and decreases in stratospheric ozone, each caused by human activities. The observed pattern is not consistent with purely natural changes in the Sun’s energy output, volcanic activity, or natural climate variations such as El Niño and La Niña.
Despite this agreement between the global-scale patterns of modelled and observed atmospheric temperature change, there are still some differences. The most noticeable differences are in the tropics, where models currently show more warming in the troposphere than has been observed, and in the Arctic, where the observed warming of the troposphere is greater than in most models.
Is the current level of atmospheric CO2 concentration unprecedented in Earth’s history?
Is there a point at which adding more CO2 will not cause further warming?
Is the current level of atmospheric CO2 concentration unprecedented in Earth’s history?
The present level of atmospheric CO2 concentration is almost certainly unprecedented in the past million years, during which time modern humans evolved and societies developed. The atmospheric CO2 concentration was however higher in Earth’s more distant past (many millions of years ago), at which time palaeoclimatic and geological data indicate that temperatures and sea levels were also higher than they are today.
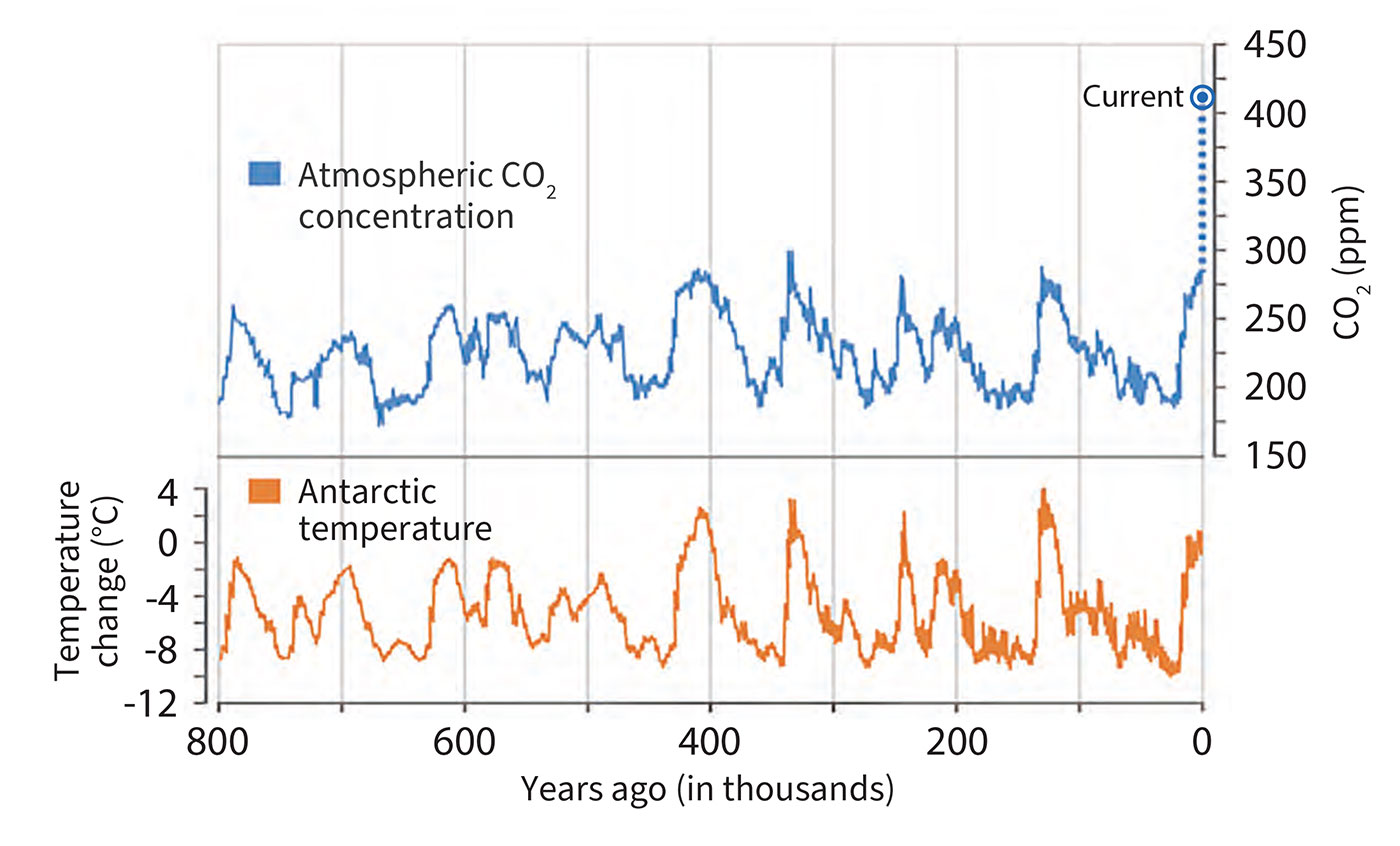
Measurements of air in ice cores show that for the past 800,000 years up until the 20th century, the atmospheric CO2 concentration stayed within the range 170 to 300 parts per million (ppm), making the recent rapid rise to more than 400 ppm over 200 years particularly remarkable [figure 3]. During the glacial cycles of the past 800,000 years both CO2 and methane have acted as important amplifiers of the climate changes triggered by variations in Earth’s orbit around the Sun. As Earth warmed from the last ice age, temperature and CO2 started to rise at approximately the same time and continued to rise in tandem from about 18,000 to 11,000 years ago. Changes in ocean temperature, circulation, chemistry, and biology caused CO2 to be released to the atmosphere, which combined with other feedbacks to push Earth into an even warmer state.
For earlier geological times, CO2 concentrations and temperatures have been inferred from less direct methods. Those suggest that the concentration of CO2 last approached 400 ppm about 3 to 5 million years ago, a period when global average surface temperature is estimated to have been about 2 to 3.5°C higher than in the pre-industrial period. At 50 million years ago, CO2 may have reached 1000 ppm, and global average temperature was probably about 10°C warmer than today. Under those conditions, Earth had little ice, and sea level was at least 60 metres higher than current levels.
Does the rate of warming vary from one decade to another?
Did the slowdown of warming during the 2000s to early 2010s mean that climate change is no longer happening?
Does the rate of warming vary from one decade to another?
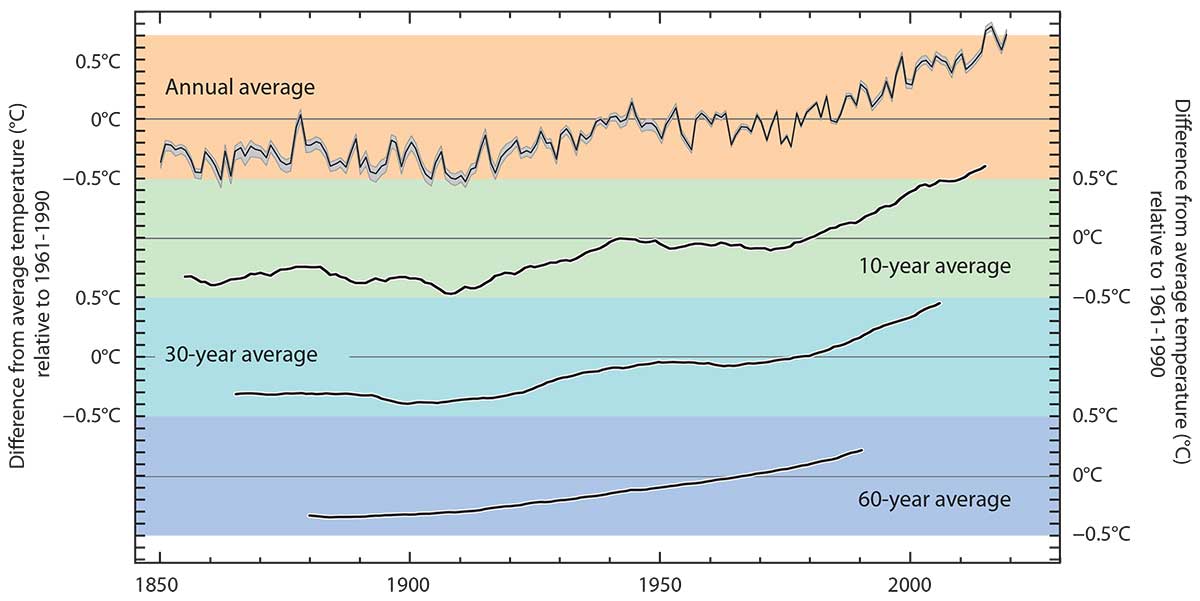
Yes. The observed warming rate has varied from year to year, decade to decade, and place to place, as is expected from our understanding of the climate system. These shorterterm variations are mostly due to natural causes, and do not contradict our fundamental understanding that the long-term warming trend is primarily due to human-induced changes in the atmospheric levels of CO2 and other greenhouse gases.
Even as CO2 is rising steadily in the atmosphere, leading to gradual warming of Earth’s surface, many natural factors are modulating this long-term warming. Large volcanic eruptions increase the number of small particles in the stratosphere. These particles reflect sunlight, leading to short-term surface cooling lasting typically two to three years, followed by a slow recovery. Ocean circulation and mixing vary naturally on many time scales, causing variations in sea surface temperatures as well as changes in the rate at which heat is transported to greater depths. For example, the tropical Pacific swings between warm El Niño and cooler La Niña events on timescales of two to seven years. Scientists study many different types of climate variations, such as those on decadal and multi-decadal timescales in the Pacific and North Atlantic Oceans. Each type of variation has its own unique characteristics. These oceanic variations are associated with significant regional and global shifts in temperature and rainfall patterns that are evident in the observations.
Warming from decade to decade can also be affected by human factors such as variations in emissions of greenhouse gases and aerosols (airborne particles that can have both warming and cooling effects) from coal-fired power plants and other pollution sources.
These variations in the temperature trend are clearly evident in the observed temperature record [Figure 4]. Short-term natural climate variations could also affect the long-term human-induced climate change signal and vice-versa, because climate variations on different space and timescales can interact with one another. It is partly for this reason that climate change projections are made using climate models that can account for many different types of climate variations and their interactions. Reliable inferences about human-induced climate change must be made with a longer view, using records that cover many decades.
If the world is warming, why are some winters and summers still very cold?
Why is Arctic sea ice decreasing while Antarctic sea ice has changed little?
If the world is warming, why are some winters and summers still very cold?
Global warming is a long-term trend, but that does not mean that every year will be warmer than the previous one. Day-to-day and year-to-year changes in weather patterns will continue to produce some unusually cold days and nights and winters and summers, even as the climate warms.
Climate change means not only changes in globally averaged surface temperature, but also changes in atmospheric circulation, in the size and patterns of natural climate variations, and in local weather. La Niña events shift weather patterns so that some regions are made wetter, and wet summers are generally cooler. Stronger winds from polar regions can contribute to an occasional colder winter. In a similar way, the persistence of one phase of an atmospheric circulation pattern known as the North Atlantic Oscillation has contributed to several recent cold winters in Europe, eastern North America, and northern Asia. Atmospheric and ocean circulation patterns will evolve as Earth warms and will influence storm tracks and many other aspects of the weather. Global warming tilts the odds in favour of more warm days and seasons and fewer cold days and seasons. For example, across the continental United States in the 1960s there were more daily record low temperatures than record highs, but in the 2000s there were more than twice as many record highs as record lows. Another important example of tilting the odds is that over recent decades heatwaves have increased in frequency in large parts of Europe, Asia, South America, and Australia. Marine heat waves are also increasing.

Why is Arctic sea ice decreasing while Antarctic sea ice has changed little?
Sea ice extent is affected by winds and ocean currents as well as temperature. Sea ice in the partly-enclosed Arctic Ocean seems to be responding directly to warming, while changes in winds and in the ocean seem to be dominating the patterns of climate and sea ice change in the ocean around Antarctica.
Some differences in seasonal sea ice extent between the Arctic and Antarctic are due to basic geography and its influence on atmospheric and oceanic circulation. The Arctic is an ocean basin surrounded largely by mountainous continental land masses, and Antarctica is a continent surrounded by ocean. In the Arctic, sea ice extent is limited by the surrounding land masses. In the Southern Ocean winter, sea ice can expand freely into the surrounding ocean, with its southern boundary set by the coastline of Antarctica. Because Antarctic sea ice forms at latitudes further from the South Pole (and closer to the equator), less ice survives the summer. Sea ice extent in both poles changes seasonally; however, longer-term variability in summer and winter ice extent is different in each hemisphere, due in part to these basic geographical differences.
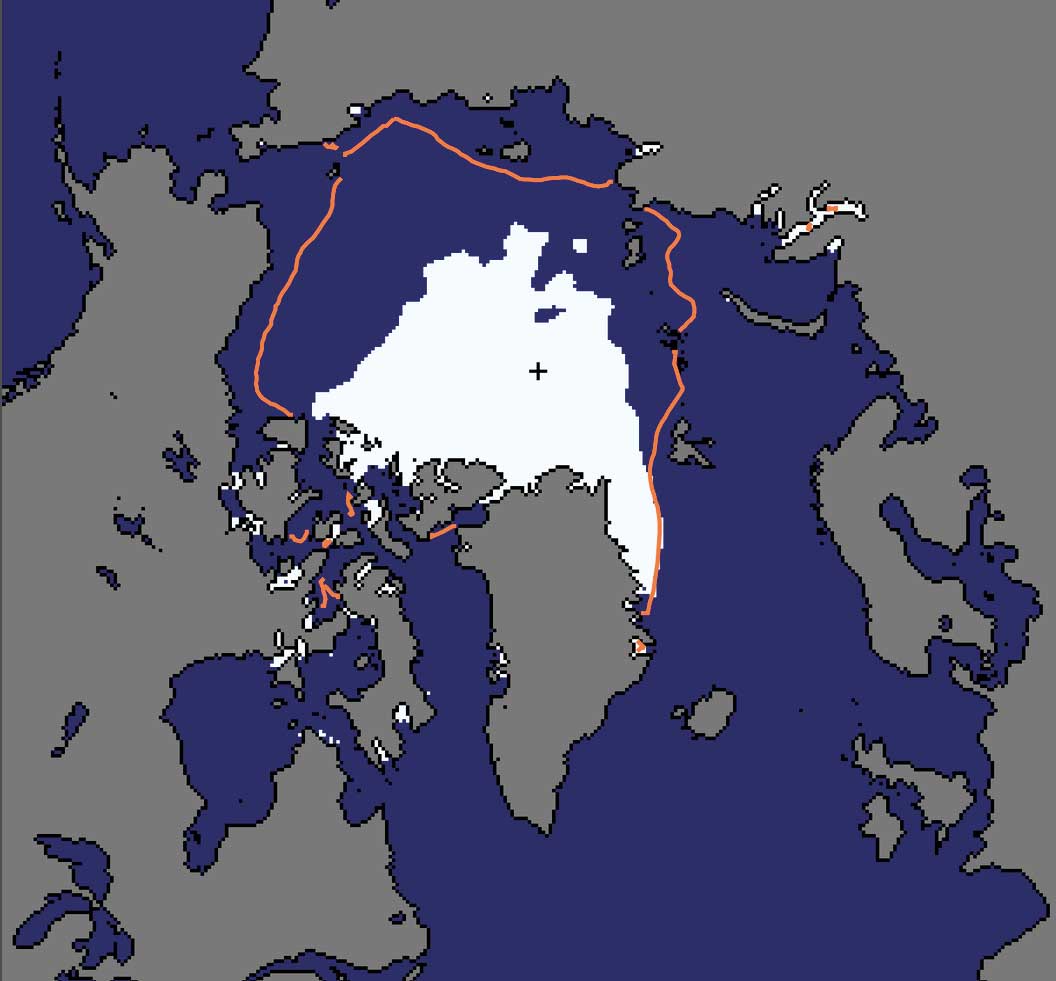
Sea ice in the Arctic has decreased dramatically since the late 1970s, particularly in summer and autumn. Since the satellite record began in 1978, the yearly minimum Arctic sea ice extent (which occurs in September) has decreased by about 40% [Figure 5]. Ice cover expands again each Arctic winter, but the ice is thinner than it used to be. Estimates of past sea ice extent suggest that this decline may be unprecedented in at least the past 1,450 years. Because sea ice is highly reflective, warming is amplified as the ice decreases and more sunshine is absorbed by the darker underlying ocean surface.
Sea ice in the Antarctic showed a slight increase in overall extent from 1979 to 2014, although some areas, such as that to the west of the Antarctic Peninsula experienced a decrease. Short-term trends in the Southern Ocean, such as those observed, can readily occur from natural variability of the atmosphere, ocean and sea ice system. Changes in surface wind patterns around the continent contributed to the Antarctic pattern of sea ice change; ocean factors such as the addition of cool fresh water from melting ice shelves may also have played a role. However, after 2014, Antarctic ice extent began to decline, reaching a record low (within the 40 years of satellite data) in 2017, and remaining low in the following two years.
How does climate change affect the strength and frequency of floods, droughts, hurricanes, and tornadoes?
How fast is sea level rising?
How does climate change affect the strength and frequency of floods, droughts, hurricanes, and tornadoes?
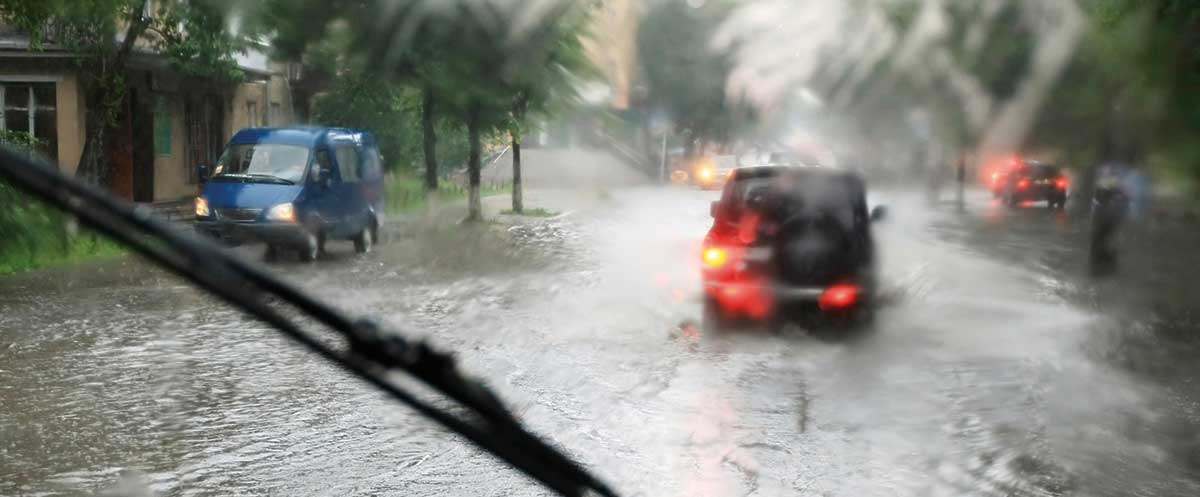
Earth’s lower atmosphere is becoming warmer and moister as a result of human-caused greenhouse gas emissions. This gives the potential for more energy for storms and certain extreme weather events. Consistent with theoretical expectations, the types of events most closely related to temperature, such as heatwaves and extremely hot days, are becoming more likely. Heavy rainfall and snowfall events (which increase the risk of flooding) are also generally becoming more frequent.
As Earth’s climate has warmed, more frequent and more intense weather events have both been observed around the world. Scientists typically identify these weather events as “extreme” if they are unlike 90% or 95% of similar weather events that happened before in the same region. Many factors contribute to any individual extreme weather event—including patterns of natural climate variability, such as El Niño and La Niña— making it challenging to attribute any particular extreme event to human-caused climate change. However, studies can show whether the warming climate made an event more severe or more likely to happen.
A warming climate can contribute to the intensity of heat waves by increasing the chances of very hot days and nights. Climate warming also increases evaporation on land, which can worsen drought and create conditions more prone to wildfire and a longer wildfire season. A warming atmosphere is also associated with heavier precipitation events (rain and snowstorms) through increases in the air’s capacity to hold moisture. El Niño events favour drought in many tropical and subtropical land areas, while La Niña events promote wetter conditions in many places. These short-term and regional variations are expected to become more extreme in a warming climate.
Earth’s warmer and moister atmosphere and warmer oceans make it likely that the strongest hurricanes will be more intense, produce more rainfall, affect new areas, and possibly be larger and longer-lived. This is supported by available observational evidence in the North Atlantic. In addition, sea level rise (see Question 14) increases the amount of seawater that is pushed on to shore during coastal storms, which, along with more rainfall produced by the storms, can result in more destructive storm surges and flooding. While global warming is likely making hurricanes more intense, the change in the number of hurricanes each year is quite uncertain. This remains a subject of ongoing research.
Some conditions favourable for strong thunderstorms that spawn tornadoes are expected to increase with warming, but uncertainty exists in other factors that affect tornado formation, such as changes in the vertical and horizontal variations of winds.
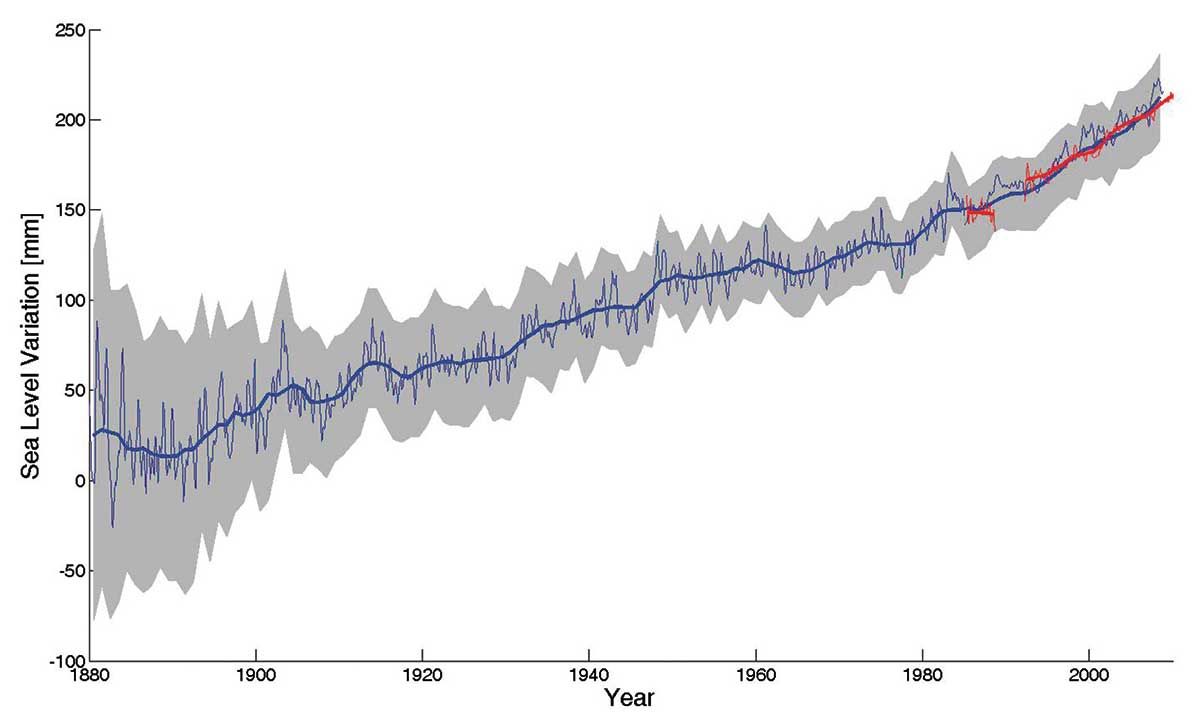
How fast is sea level rising?
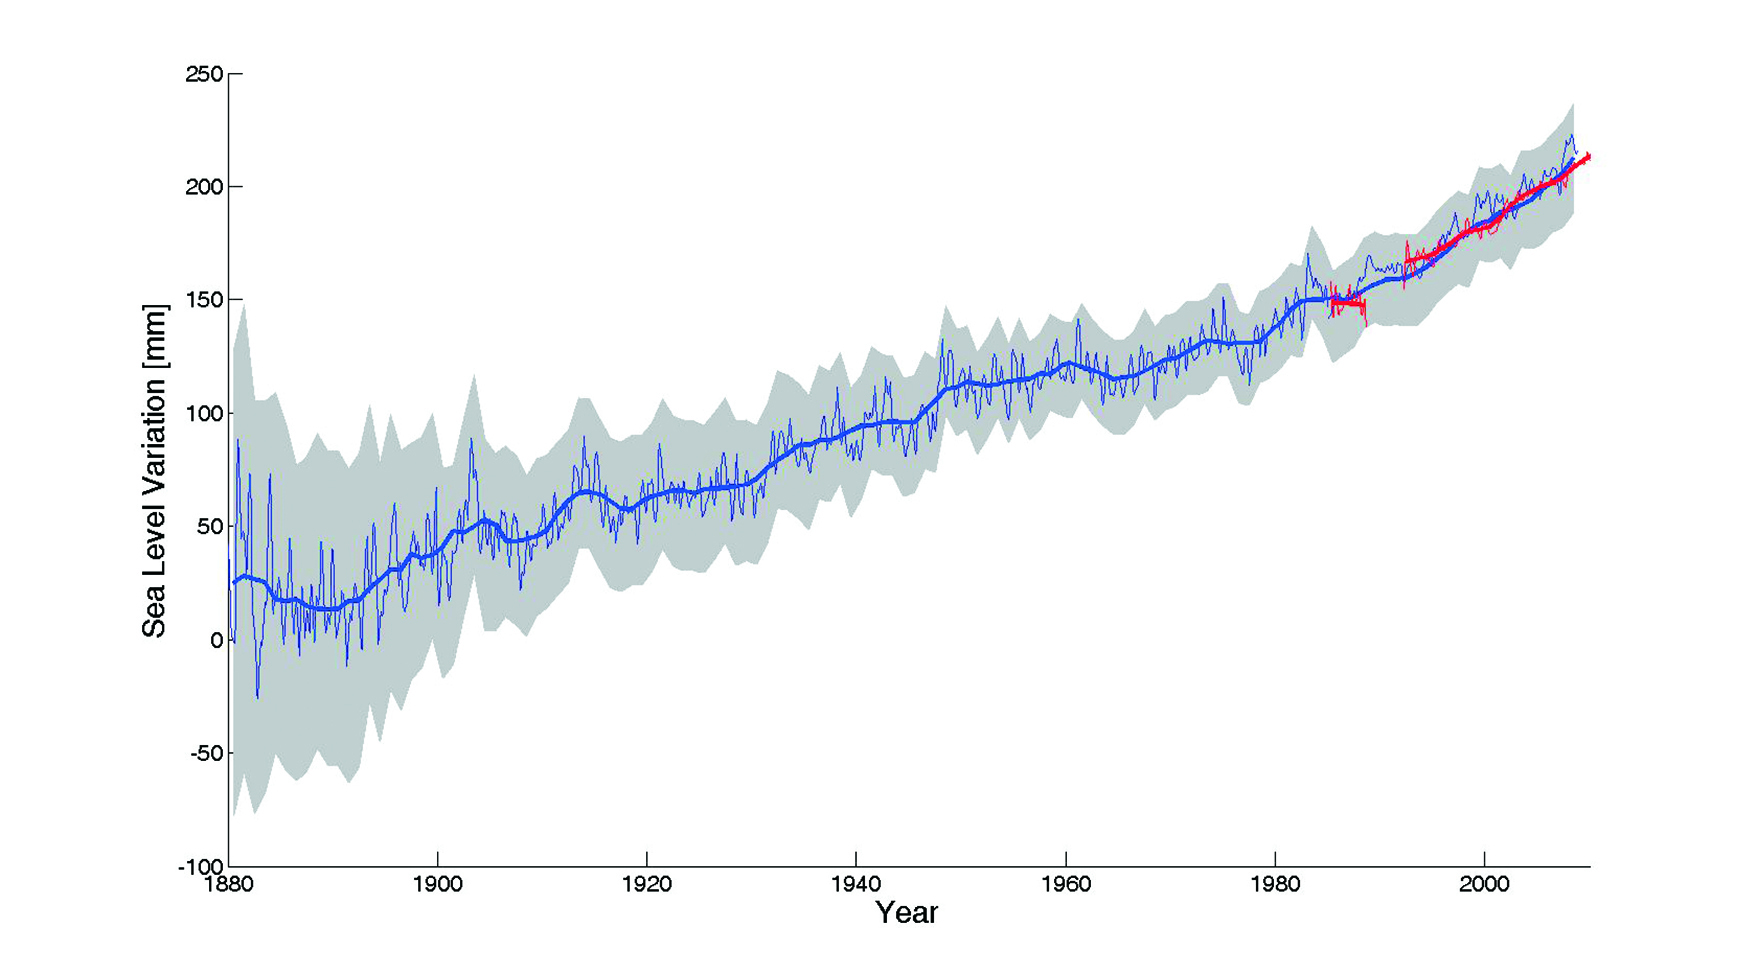
Long-term measurements of tide gauges and recent satellite data show that global sea level is rising, with the best estimate of the rate of global-average rise over the last decade being 3.6 mm per year (0.14 inches per year). The rate of sea level rise has increased since measurements using altimetry from space were started in 1992; the dominant factor in global-average sea level rise since 1970 is human-caused warming. The overall observed rise since 1902 is about 16 cm (6 inches) [Figure 6].
This sea level rise has been driven by expansion of water volume as the ocean warms, melting of mountain glaciers in all regions of the world, and mass losses from the Greenland and Antarctic ice sheets. All of these result from a warming climate. Fluctuations in sea level also occur due to changes in the amounts of water stored on land. The amount of sea level change experienced at any given location also depends on a variety of other factors, including whether regional geological processes and rebound of the land weighted down by previous ice sheets are causing the land itself to rise or sink, and whether changes in winds and currents are piling ocean water against some coasts or moving water away.
The effects of rising sea level are felt most acutely in the increased frequency and intensity of occasional storm surges. If CO2 and other greenhouse gases continue to increase on their current trajectories, it is projected that sea level may rise, at minimum, by a further 0.4 to 0.8 m (1.3 to 2.6 feet) by 2100, although future ice sheet melt could make these values considerably higher. Moreover, rising sea levels will not stop in 2100; sea levels will be much higher in the following centuries as the sea continues to take up heat and glaciers continue to retreat. It remains difficult to predict the details of how the Greenland and Antarctic Ice Sheets will respond to continued warming, but it is thought that Greenland and perhaps West Antarctica will continue to lose mass, whereas the colder parts of Antarctica could gain mass as they receive more snowfall from warmer air that contains more moisture. Sea level in the last interglacial (warm) period around 125,000 years ago peaked at probably 5 to 10 m above the present level. During this period, the polar regions were warmer than they are today. This suggests that, over millennia, long periods of increased warmth will lead to very significant loss of parts of the Greenland and Antarctic Ice Sheets and to consequent sea level rise.
What is ocean acidification and why does it matter?
How confident are scientists that Earth will warm further over the coming century?
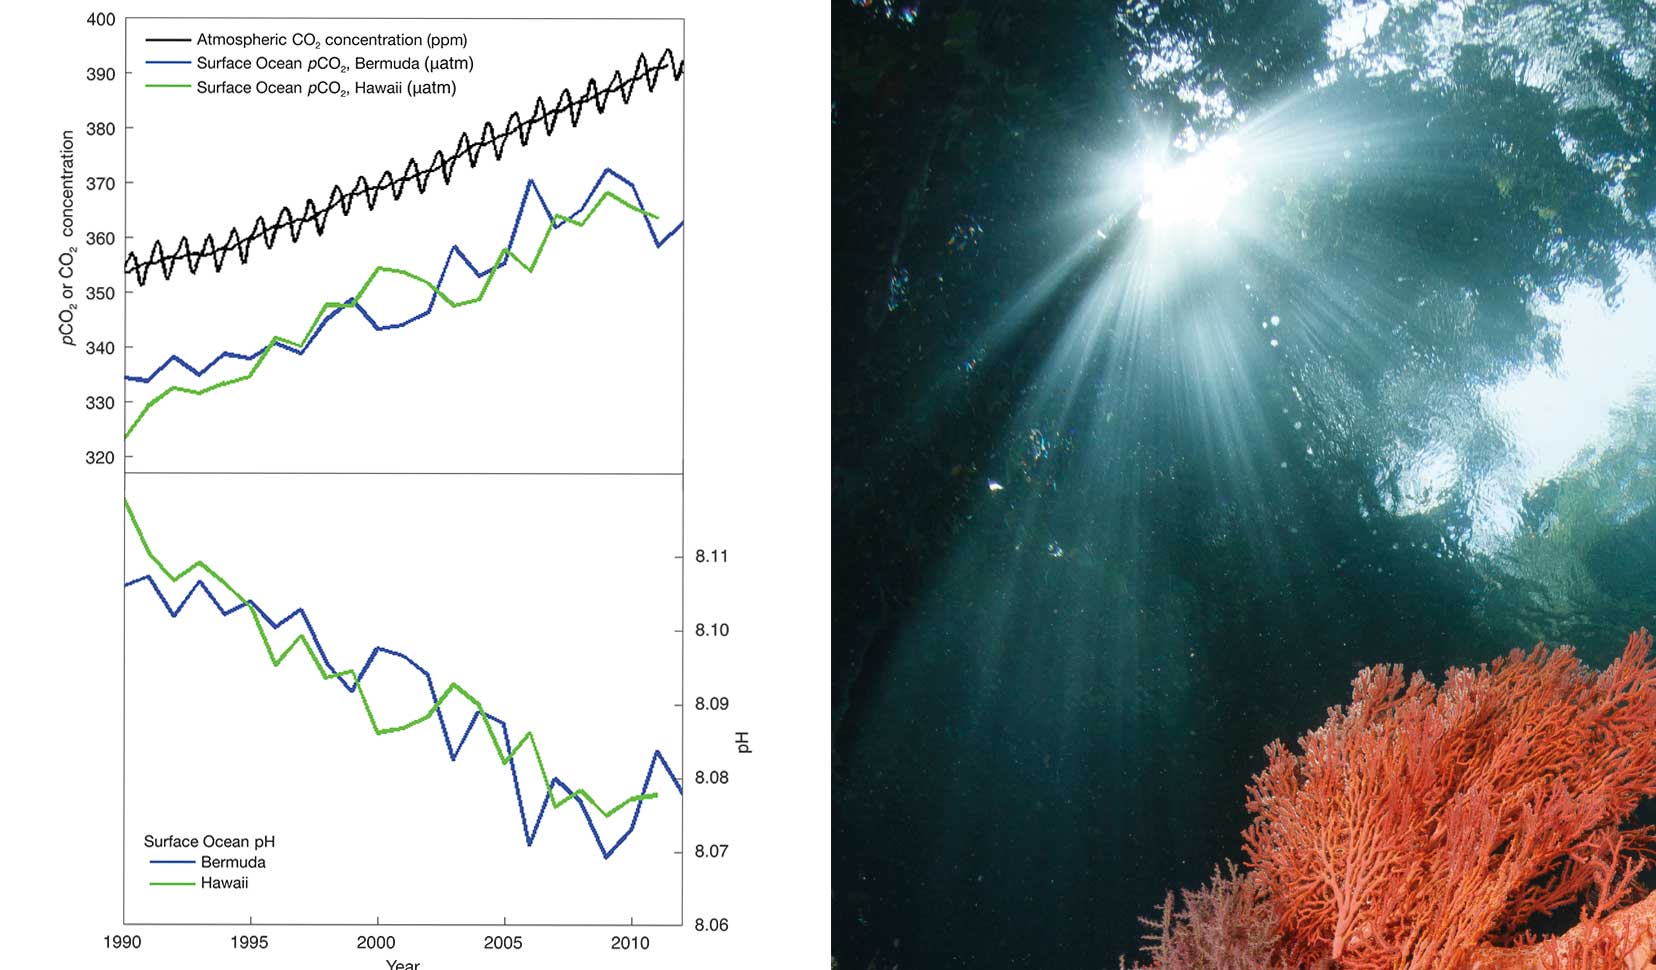
What is ocean acidification and why does it matter?
Direct observations of ocean chemistry have shown that the chemical balance of seawater has shifted to a more acidic state (lower pH) [Figure 7]. Some marine organisms (such as corals and some shellfish) have shells composed of calcium carbonate, which dissolves more readily in acid. As the acidity of sea water increases, it becomes more difficult for these organisms to form or maintain their shells.
CO2 dissolves in water to form a weak acid, and the oceans have absorbed about a third of the CO2 resulting from human activities, leading to a steady decrease in ocean pH levels. With increasing atmospheric CO2, this chemical balance will change even more during the next century. Laboratory and other experiments show that under high CO2 and in more acidic waters, some marine species have misshapen shells and lower growth rates, although the effect varies among species. Acidification also alters the cycling of nutrients and many other elements and compounds in the ocean, and it is likely to shift the competitive advantage among species, with as-yet-to-be-determined impacts on marine ecosystems and the food web.
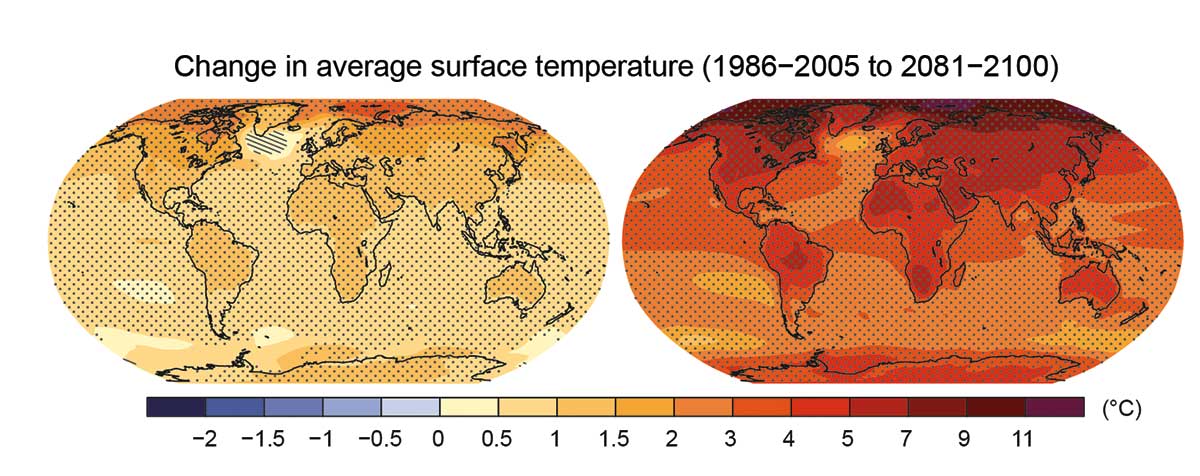
How confident are scientists that Earth will warm further over the coming century?
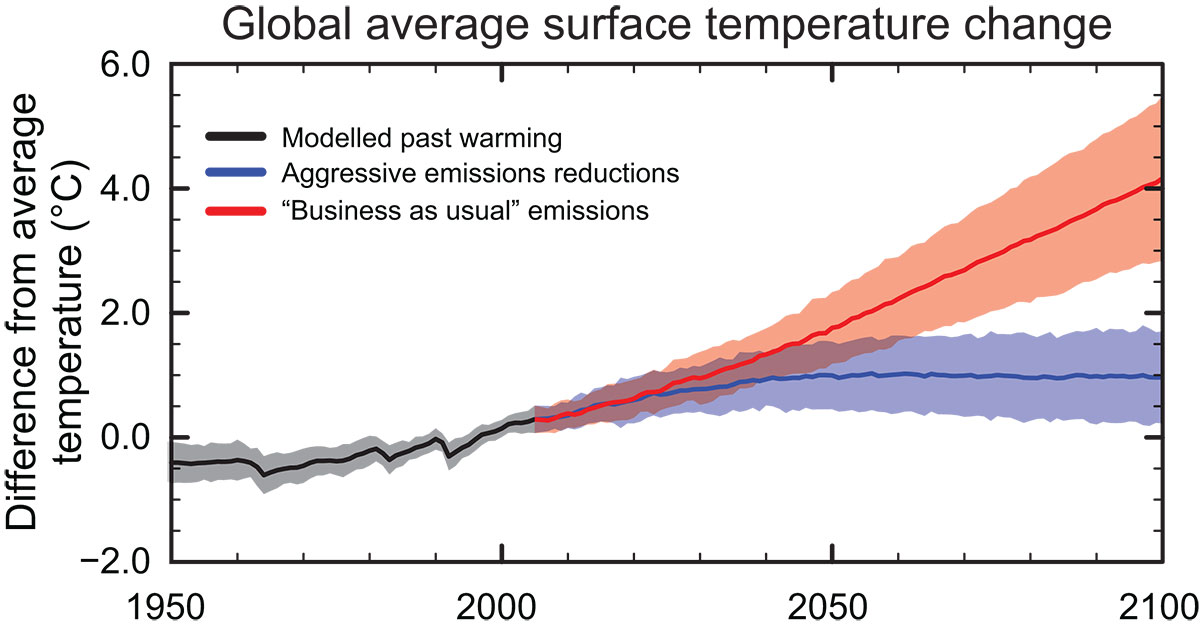
Very confident. If emissions continue on their present trajectory, without either technological or regulatory abatement, then warming of 2.6 to 4.8 °C (4.7 to 8.6 °F) in addition to that which has already occurred would be expected during the 21st century [Figure 8].
Warming due to the addition of large amounts of greenhouse gases to the atmosphere can be understood in terms of very basic properties of greenhouse gases. It will in turn lead to many changes in natural climate processes, with a net effect of amplifying the warming. The size of the warming that will be experienced depends largely on the amount of greenhouse gases accumulating in the atmosphere and hence on the trajectory of emissions. If the total cumulative emissions since 1875 are kept below about 900 gigatonnes (900 billion tonnes) of carbon, then there is a two-thirds chance of keeping the rise in global average temperature since the pre-industrial period below 2 °C (3.6 °F). However, two-thirds of this amount has already been emitted. A target of keeping global average temperature rise below 1.5 °C (2.7 °F) would allow for even less total cumulative emissions since 1875.
Based just on the established physics of the amount of heat CO2 absorbs and emits, a doubling of atmospheric CO2 concentration from preindustrial levels (up to about 560 ppm) would by itself, without amplification by any other effects, cause a global average temperature increase of about 1 °C (1.8 °F). However, the total amount of warming from a given amount of emissions depends on chains of effects (feedbacks) that can individually either amplify or diminish the initial warming.
The most important amplifying feedback is caused by water vapour, which is a potent greenhouse gas. As CO2 increases and warms the atmosphere, the warmer air can hold more moisture and trap more heat in the lower atmosphere. Also, as Arctic sea ice and glaciers melt, more sunlight is absorbed into the darker underlying land and ocean surfaces, causing further warming and further melting of ice and snow. The biggest uncertainty in our understanding of feedbacks relates to clouds (which can have both positive and negative feedbacks), and how the properties of clouds will change in response to climate change. Other important feedbacks involve the carbon cycle. Currently the land and oceans together absorb about half of the CO2 emitted from human activities, but the capacities of land and ocean to store additional carbon are expected to decrease with additional warming, leading to faster increases in atmospheric CO2 and faster warming. Models vary in their projections of how much additional warming to expect, but all such models agree that the overall net effect of feedbacks is to amplify the warming.
Are climate changes of a few degrees a cause for concern?
What are scientists doing to address key uncertainties in our understanding of the climate system?
What are scientists doing to address key uncertainties in our understanding of the climate system?
Science is a continual process of observation, understanding, modelling, testing, and prediction. The prediction of a long-term trend in global warming from increasing greenhouse gases is robust and has been confirmed by a growing body of evidence. Nevertheless, understanding of certain aspects of climate change remains incomplete. Examples include natural climate variations on decadal-to-centennial timescales and regional-to-local spatial scales and cloud responses to climate change, which are all areas of active research.
Why are computer models used to study climate change?
The future evolution of Earth’s climate as it responds to the present rapid rate of increasing atmospheric CO2 has no precise analogues in the past, nor can it be properly understood through laboratory experiments. As we are also unable to carry out deliberate controlled experiments on Earth itself, computer models are among the most important tools used to study Earth’s climate system.
Climate models are based on mathematical equations that represent the best understanding of the basic laws of physics, chemistry, and biology that govern the behaviour of the atmosphere, ocean, land surface, ice, and other parts of the climate system, as well as the interactions among them. The most comprehensive climate models, Earth-System Models, are designed to simulate Earth’s climate system with as much detail as is permitted by our understanding and by available supercomputers.
The capability of climate models has improved steadily since the 1960s. Using physics-based equations, the models can be tested and are successful in simulating a broad range of weather and climate variations, for example from individual storms, jet stream meanders, El Niño events, and the climate of the last century. Their projections of the most prominent features of the long-term human-induced climate change signal have remained robust, as generations of increasingly complex models yield richer details of the change. They are also used to perform experiments to isolate specific causes of climate change and to explore the consequences of different scenarios of future greenhouse gas emissions and other influences on climate.
Comparisons of model predictions with observations identify what is well-understood and, at the same time, reveal uncertainties or gaps in our understanding. This helps to set priorities for new research. Vigilant monitoring of the entire climate system—the atmosphere, oceans, land, and ice—is therefore critical, as the climate system may be full of surprises.
Together, field and laboratory data and theoretical understanding are used to advance models of Earth’s climate system and to improve representation of key processes in them, especially those associated with clouds, aerosols, and transport of heat into the oceans. This is critical for accurately simulating climate change and associated changes in severe weather, especially at the regional and local scales important for policy decisions.
Simulating how clouds will change with warming and in turn may affect warming remains one of the major challenges for global climate models, in part because different cloud types have different impacts on climate, and the many cloud processes occur on scales smaller than most current models can resolve. Greater computer power is already allowing for some of these processes to be resolved in the new generation of models.
Dozens of groups and research institutions work on climate models, and scientists are now able to analyse results from essentially all of the world’s major Earth-System Models and compare them with each other and with observations. Such opportunities are of tremendous benefit in bringing out the strengths and weaknesses of various models and diagnosing the causes of differences among models, so that research can focus on the relevant processes. Differences among models allow estimates to be made of the uncertainties in projections of future climate change. Additionally, large archives of results from many different models help scientists to identify aspects of climate change projections that are robust and that can be interpreted in terms of known physical mechanisms.
Studying how climate responded to major changes in the past is another way of checking that we understand how different processes work and that models are capable of performing reliably under a wide range of conditions.
Are disaster scenarios about tipping points like “turning off the Gulf Stream” and release of methane from the Arctic a cause for concern?
If emissions of greenhouse gases were stopped, would the climate return to the conditions of 200 years ago?
Are disaster scenarios about tipping points like “turning off the Gulf Stream” and release of methane from the Arctic a cause for concern?
Results from the best available climate models do not predict an abrupt change in (or collapse of) the Atlantic Meridional Overturning Circulation, which includes the Gulf Stream, in the near future. However, this and other potential high-risk abrupt changes, like the release of methane and carbon dioxide from thawing permafrost, remain active areas of scientific research. Some abrupt changes are already underway, such as the decrease in Arctic sea ice extent (see Question 12), and as warming increases, the possibility of other major abrupt changes cannot be ruled out.
The composition of the atmosphere is changing towards conditions that have not been experienced for millions of years, so we are headed for unknown territory, and uncertainty is large. The climate system involves many competing processes that could switch the climate into a different state once a threshold has been exceeded.
A well-known example is the south-north ocean overturning circulation, which is maintained by cold salty water sinking in the North Atlantic and involves the transport of extra heat to the North Atlantic via the Gulf Stream. During the last ice age, pulses of freshwater from the melting ice sheet over North America led to slowing down of this overturning circulation. This in turn caused widespread changes in climate around the Northern Hemisphere. Freshening of the North Atlantic from the melting of the Greenland ice sheet is gradual, however, and hence is not expected to cause abrupt changes.
Another concern relates to the Arctic, where substantial warming could destabilise methane (a greenhouse gas) trapped in ocean sediments and permafrost, potentially leading to a rapid release of a large amount of methane. If such a rapid release occurred, then major, fast climate changes would ensue. Such high-risk changes are considered unlikely in this century, but are by definition hard to predict. Scientists are therefore continuing to study the possibility of exceeding such tipping points, beyond which we risk large and abrupt changes.
In addition to abrupt changes in the climate system itself, steady climate change can cross thresholds that trigger abrupt changes in other systems. In human systems, for example, infrastructure has typically been built to accommodate the climate variability at the time of construction. Gradual climate changes can cause abrupt changes in the utility of the infrastructure—such as when rising sea levels suddenly surpass sea walls, or when thawing permafrost causes the sudden collapse of pipelines, buildings, or roads. In natural systems, as air and water temperatures rise, some species—such as the mountain pika and many ocean corals—will no longer be able to survive in their current habitats and will be forced to relocate (if possible) or rapidly adapt. Other species may fare better in the new conditions, causing abrupt shifts in the balance of ecosystems; for example, warmer temperatures have allowed more bark beetles to survive over winter in some regions, where beetle outbreaks have destroyed forests.

If emissions of greenhouse gases were stopped, would the climate return to the conditions of 200 years ago?
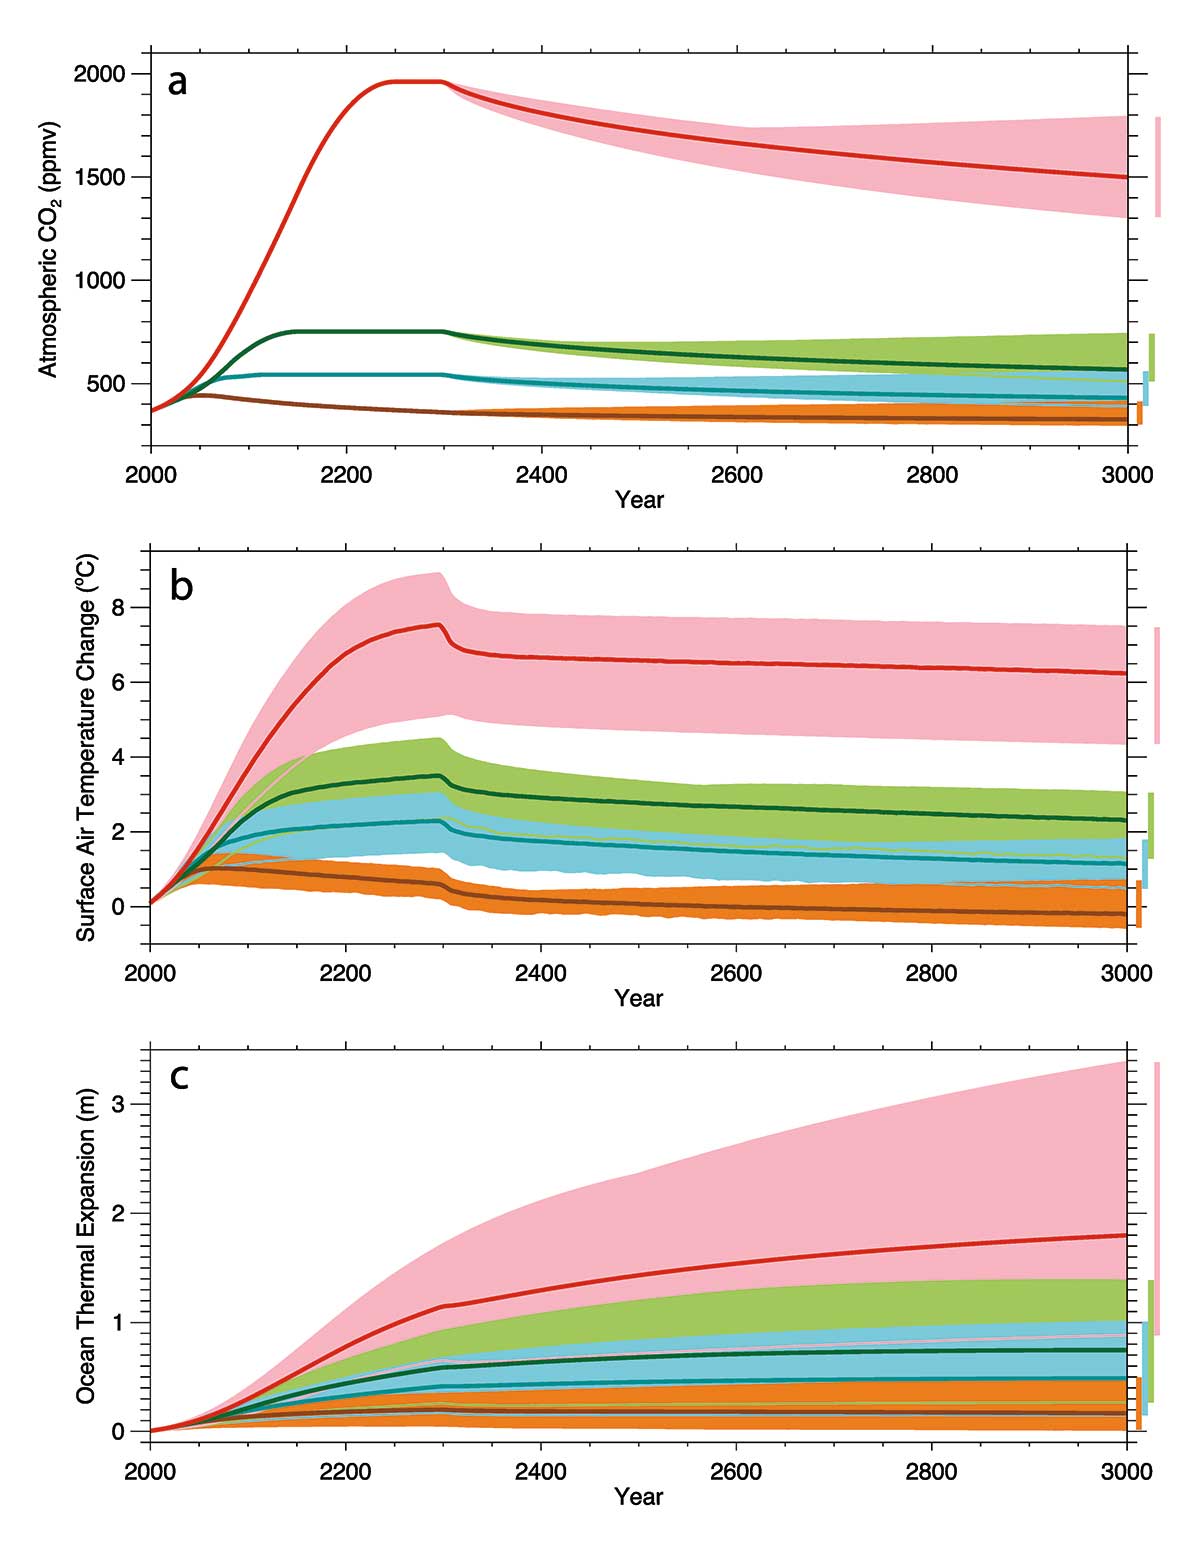
No. Even if emissions of greenhouse gases were to suddenly stop, Earth’s surface temperature would require thousands of years to cool and return to the level in the pre-industrial era.
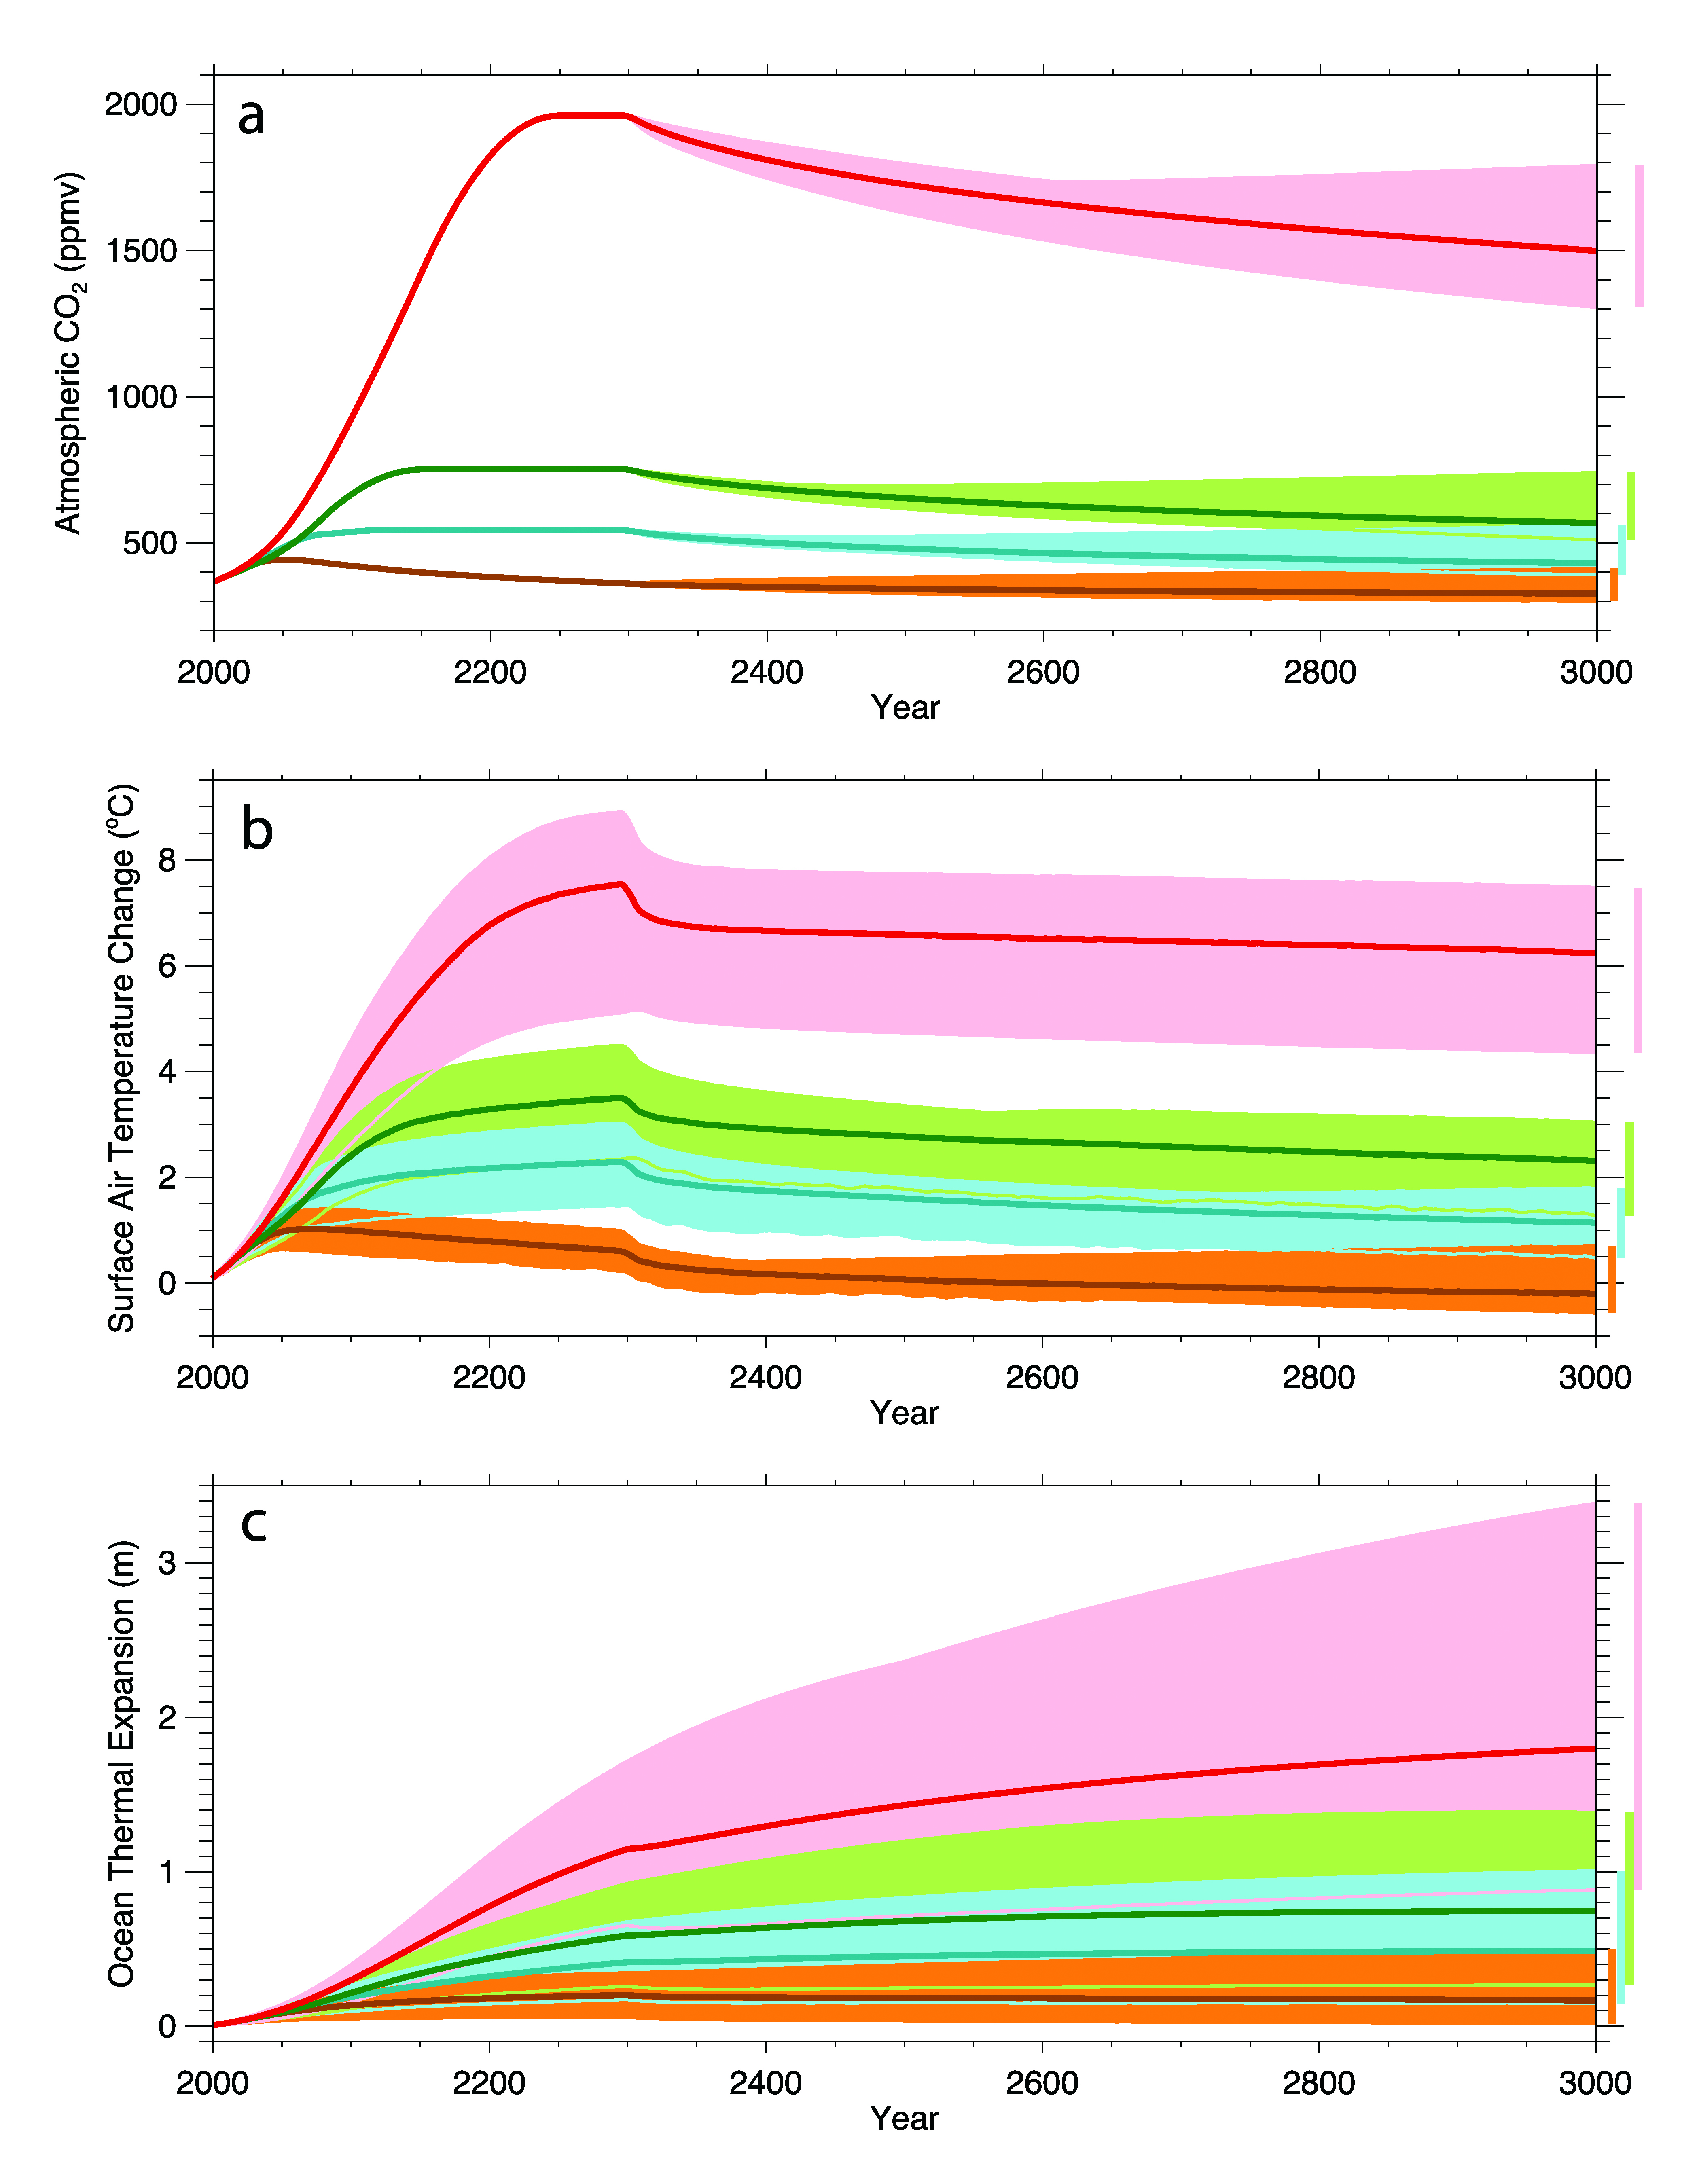
If emissions of CO2 stopped altogether, it would take many thousands of years for atmospheric CO2 to return to “pre-industrial” levels due to its very slow transfer to the deep ocean and ultimate burial in ocean sediments. Surface temperatures would stay elevated for at least a thousand years, implying a long-term commitment to a warmer planet due to past and current emissions. Sea level would likely continue to rise for many centuries even after temperature stopped increasing [Figure 9]. Significant cooling would be required to reverse melting of glaciers and the Greenland ice sheet, which formed during past cold climates. The current CO2-induced warming of Earth is therefore essentially irreversible on human timescales. The amount and rate of further warming will depend almost entirely on how much more CO2 humankind emits.
Scenarios of future climate change increasingly assume the use of technologies that can remove greenhouse gases from the atmosphere. In such “negative emissions” scenarios, it assumed that at some point in the future, widespread effort will be undertaken that utilises such technologies to remove CO2 from the atmosphere and lower its atmospheric concentration, thereby starting to reverse CO2-driven warming on longer timescales. Deployment of such technologies at scale would require large decreases in their costs. Even if such technological fixes were practical, substantial reductions in CO2 emissions would still be essential.


