
Suggested Citation:"Appendix C: Example of NASA's SERT Program Technology Roadmaps." National Research Council. 2001. Laying the Foundation for Space Solar Power: An Assessment of NASA's Space Solar Power Investment Strategy. Washington, DC: The National Academies Press. doi: 10.17226/10202.
×
C
Example of NASA’s SERT Program Technology Roadmaps
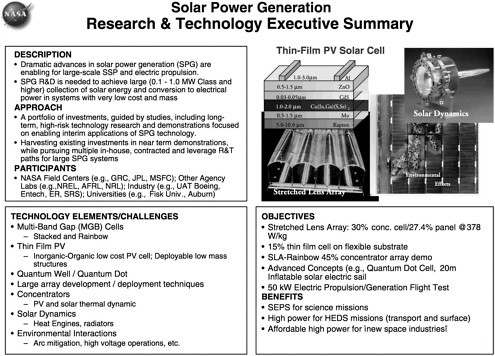
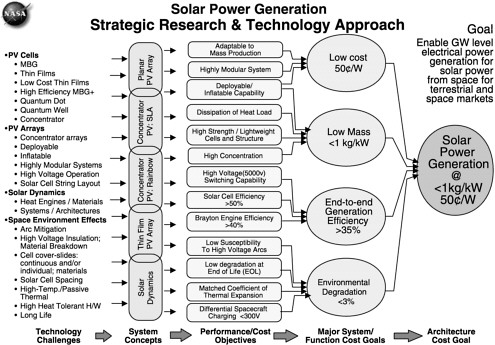
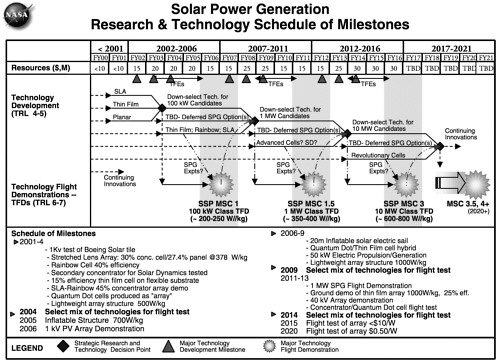
Figures C-1, C-2, and C-3 are examples of the roadmaps and programmatic charts for each individual technology area in NASA’s SERT program. The figures are presented in original, Unedited form.
REFERENCE
Mankins, John and Joe Howell. 2000. “Strategic Research and Technology RoadMap.” Briefing by John Mankins and Joe Howell, National Aeronautics and Space Administration, to the Committee for the Assessment of NASA’s Space Solar Power Investment Strategy, National Research Council, Washington, D.C., December 14.
Suggested Citation:"Appendix C: Example of NASA's SERT Program Technology Roadmaps." National Research Council. 2001. Laying the Foundation for Space Solar Power: An Assessment of NASA's Space Solar Power Investment Strategy. Washington, DC: The National Academies Press. doi: 10.17226/10202.
×
Suggested Citation:"Appendix C: Example of NASA's SERT Program Technology Roadmaps." National Research Council. 2001. Laying the Foundation for Space Solar Power: An Assessment of NASA's Space Solar Power Investment Strategy. Washington, DC: The National Academies Press. doi: 10.17226/10202.
×
Suggested Citation:"Appendix C: Example of NASA's SERT Program Technology Roadmaps." National Research Council. 2001. Laying the Foundation for Space Solar Power: An Assessment of NASA's Space Solar Power Investment Strategy. Washington, DC: The National Academies Press. doi: 10.17226/10202.
×
Suggested Citation:"Appendix C: Example of NASA's SERT Program Technology Roadmaps." National Research Council. 2001. Laying the Foundation for Space Solar Power: An Assessment of NASA's Space Solar Power Investment Strategy. Washington, DC: The National Academies Press. doi: 10.17226/10202.
×

Suggested Citation:"Appendix C: Example of NASA's SERT Program Technology Roadmaps." National Research Council. 2001. Laying the Foundation for Space Solar Power: An Assessment of NASA's Space Solar Power Investment Strategy. Washington, DC: The National Academies Press. doi: 10.17226/10202.
×

Suggested Citation:"Appendix C: Example of NASA's SERT Program Technology Roadmaps." National Research Council. 2001. Laying the Foundation for Space Solar Power: An Assessment of NASA's Space Solar Power Investment Strategy. Washington, DC: The National Academies Press. doi: 10.17226/10202.
×

Suggested Citation:"Appendix C: Example of NASA's SERT Program Technology Roadmaps." National Research Council. 2001. Laying the Foundation for Space Solar Power: An Assessment of NASA's Space Solar Power Investment Strategy. Washington, DC: The National Academies Press. doi: 10.17226/10202.
×

