
SEMATECH Revisited: Assessing Consortium Impacts on Semiconductor Industry R&D
Kenneth Flamm and Qifei Wang
University of Texas at Austin
Over 1987-1988, in the midst of a perceived crisis in the U.S. semiconductor industry, 14 U.S. semiconductor manufacturers formed the SEMATECH (for semiconductor manufacturing technology) R&D consortium with the support of the U.S. government.1 In terms of its size, visibility, and public policy impact SEMATECH has perhaps been the most significant private R&D consortium formed in the almost two decades that have passed since the passage by the U.S. Congress of the National Cooperative Research Act of 1984, which granted partial antitrust exemption to registered U.S. R&D consortia.
SEMATECH’s cooperative structure to some extent was stimulated by Japan’s VLSI projects of the late 1970s, which were perceived in the United States (and in Japan, for that matter) as having greatly advanced the technological competence of Japanese semiconductor producers.2 A 1987 Defense Science Board report pointing to deterioration in the relative position of U.S. semiconductor manufacturers as a possible national security issue played an important role in a U.S. government decision to have the Defense Department pay half of the cost of a consortium budgeted at $200 million annually. While the objective of improving U.S. semiconductor manufacturing technology was fairly clear, the spe
cific means by which SEMATECH was to do so were the subject of considerable debate, and SEMATECH’s focus zigged and zagged in its first few years of existence. It was restricted to U.S. companies; Japanese producer NEC, which had a U.S. production plant, was turned away when it sought to join in 1988.3
A number of U.S. semiconductor materials and equipment producers formed a complementary organization, SEMI/SEMATECH, in 1987 specifically for the purpose of cooperating with SEMATECH. SEMI/SEMATECH was granted SEMATECH membership and a seat on the SEMATECH board of directors, and became the official vehicle for the organization of SEMATECH development projects and the teaming of materials and equipment producers. In 2000 SEMI/ SEMATECH renamed itself the Semiconductor Industry Suppliers Association (SISA).
Given the relatively large theoretical literature on R&D cooperation that sprang up in the late 1980s and thereafter,4 there has been surprisingly little empirical analysis of the impacts of R&D cooperation on industrial R&D.5 The highest profile R&D consortium in the United States, SEMATECH, appears to have been the subject of precisely three studies with any claim to rigor. One study, undertaken by Link, Teece, and Finan, calculated an internal private rate of return for SEMATECH member companies on a sample of SEMATECH projects that
|
3 |
Good resources on the history of SEMATECH are SEMATECH’s own Web site at <www.SEMATECH.org> and the corporate chronology contained within; W.I. Spencer and P. Grindley, “SEMATECH After Five Years: High Technology Consortia and U.S. Competitiveness,” California Management Review, vol. 35, 1993; P. Grindley, D.C. Mowery, and B. Silverman, “SEMATECH and Collaborative Research: Lessons in the Design of a High-Technology Consortia,” Journal of Policy Analysis and Management, vol. 13, 1994; L.D. Browning and J.C. Shetler, SEMATECH, Saving the U.S. Semiconductor Industry, College Station: Texas A&M Press, 2000; John Brendan Horrigan, “Cooperation Among Competitors in Research Consortia,” unpublished doctoral dissertation, University of Texas at Austin, December 1996. For an overview of the consortium’s contributions and its relationship to other policies, see National Research Council, Conflict and Cooperation in National Competition for High-Technology Industry, Washington, D.C.: National Academy Press, 1996, especially p. 48 and supplements A and B. |
|
4 |
For example, M.L. Katz, “An Analysis of Cooperative Research and Development,” RAND Journal of Economics, vol. 17, 1986; C. D’Aspremont and A. Jacquemin, “Cooperative and Noncooperative R&D in Duopoly with Spillovers,” American Economic Review, vol. 78, 1988; M.L. Katz and J.A. Ordover, “R&D Cooperation and Competition,” Brookings Papers on Economic Activity: Microeconomics 1990; M.I. Kamien, E. Muller, and I. Zang, “Research Joint Ventures and R&D Cartels,” American Economic Review, vol. 82, 1992; R.D. Simpson and N.S. Vonortas, “Cournot Equilibrium with Imperfectly Appropriable R&D,” Journal of Industrial Economics, vol. 42, 1994. |
|
5 |
In addition to the SEMATECH studies mentioned here, see M. Sakakibara, “Evaluating Government-sponsored R&D Consortia in Japan: Who Benefits and How?” Research Policy, vol. 26, No. 4-5, December, 1997; L.G. Branstetter and M. Sakakibara, “Japanese Research Consortia: A Microeconometric Analysis of Industrial Policy,” Journal of Industrial Economics, vol. 46, June 1998; L.G. Branstetter and M. Sakakibara, “When Do Research Consortia Work Well and Why? Evidence from Japanese Panel Data,” NBER Working Paper No. W7972, October 2000, for empirical studies of Japanese R&D consortia. |
had been completed as of April 1993.6 No attempt was made in this study to specifically measure the impact of SEMATECH participation on internal company R&D spending or to estimate a social return to investments in these projects.7
A second study, by Irwin and Klenow,8 analyzes firm-specific R&D expenditures in a sample of semiconductor firms over the years 1971-1993 and attempts to estimate the impact of SEMATECH membership on the R&D-to-sales ratio of member firms. They find a small and marginally statistically significant negative impact on R&D spending by members, and interpret this to mean that SEMATECH’s impact on member R&D was primarily to reduce costs for R&D that would have been duplicated by individual member companies absent SEMATECH (as opposed to funding poorly appropriable R&D that would not have been undertaken at all without SEMATECH). Irwin and Klenow parenthetically assert that reduction of duplication through R&D cooperation “does not provide a rationale for government funding.” There are a number of conceptual, empirical, and econometric problems in the Irwin and Klenow study that we address below.
A third study, by Horrigan9, did not directly evaluate the impact of SEMATECH on member or industry R&D but did undertake so-called event studies of the impact of technical announcements from SEMATECH on the stock market valuation of consortium members and others. Horrigan found that technical announcements had a strong, positive impact on SEMATECH members who were both semiconductor producers and users (system manufacturers like IBM, DEC, Rockwell, Hewlett-Packard, and AT&T) but little impact on “pure play” semiconductor manufacturers (like Intel, TI, AMD). Interestingly, there was some evidence that firms that were not members of SEMATECH seemed to benefit somewhat from SEMATECH technical announcements, consistent with the notion that spillovers from SEMATECH to non-members were significant.
SEMATECH underwent significant changes in structure and research direction in the period shortly after the first two of these studies ended. Even in the early years there had been a growing emphasis on projects designed to improve the equipment and materials used by U.S. semiconductor makers but purchased
from upstream equipment and materials producers. In 1992, after a new CEO had been brought on board and an internal reorganization undertaken, a new long-range plan (SEMATECH II) was adopted.10 The new emphases were on a significant reduction in the elapsed time between introductions of new technologies, use of modeling and simulation in design of manufacturing processes and equipment, and greater systems integration of tools, processes, and operating systems within manufacturing plants.
Organizational changes also occurred. In 1992 for a variety of reasons three members withdrew, leaving 11 (of 13 original 1987 charter members, of 14 members in 1988). In 1995 a decision was made to partner with foreign companies in a project designed to accelerate the development of technology designed for use with 300-mm (12-inch) silicon wafers. In fiscal 1996, by mutual agreement, U.S. government funding for SEMATECH ended. In 1998 a separate organization, International SEMATECH, was formed as the umbrella for an increasing number of projects in which foreign chip producers were involved, and in 1999 the original SEMATECH restructured itself into International SEMATECH. Interestingly, International SEMATECH currently has 13 corporate members (8 U.S., 5 foreign), the same number as its parent SEMATECH when founded. The share of world semiconductor sales accounted for by the consortium’s membership is now substantially greater than was the case in 1987.11
With a few vocal exceptions SEMATECH is widely credited within the U.S. industry with some role in stimulating a resurgence among U.S. semiconductor producers in the 1990s. The revealed willingness of its corporate members to continue funding SEMATECH at levels exceeding earlier private contributions after public subsidies ended in 1996 suggests that it is viewed as a privately productive and worthwhile activity. It was also certainly perceived as a major force in Japan, where the SEMATECH model greatly influenced the formation of a new generation of semiconductor industry R&D consortia in the mid-1990s.12
Despite these major changes there has been no new research on the impact of SEMATECH since these two early studies and little discussion of the limitations in the Irwin and Klenow study, the only one to date to seek to measure the impact of SEMATECH on semiconductor industry R&D. This paper attempts to update this early analysis and remedy some of its problems. We first review the literature on R&D cooperation and its predictions about firm R&D decisions. We next describe the simple analytical framework that justifies our (and, for that matter, the Irwin and Klenow) approach. We point out how some conceptual problems in Irwin and Klenow are addressed within this framework. We then review empirical and econometric issues in the original Irwin and Klenow study, and discuss a
strategy for addressing them. Finally, we produce new econometric results based on an expanded sample of firms extended over time and discuss the implications of our results.
R&D COOPERATION
The economics literature on R&D cooperation makes a distinction between two distinct forms of cooperation. The first is coordination. R&D undertaken by a firm may have spillovers to other firms, externalities that benefit others. If firms take these benefits into account and coordinate their R&D spending with other firms, they can generally receive greater profits than would be the case had they not coordinated their spending levels with other firms. When firms jointly commit to undertaking specific amounts of R&D taking into account spillover effects, we have coordination.
The second motive for cooperation is information sharing. Firms can actually share the results of their R&D investments, thus eliminating the need for duplicative investments. R&D can be completely appropriable (no undesired spillovers), yet firms may still benefit by pooling some of their R&D effort and reducing costs.
One form of cooperation explored in the literature is the case of pure coordination. If we call parameter β a “spillover coefficient,” and assume R&D efforts among different firms are perfect substitutes, then Figure 1 shows an R&D cartel as the institutional realization of pure coordination. Without coordination firms 1
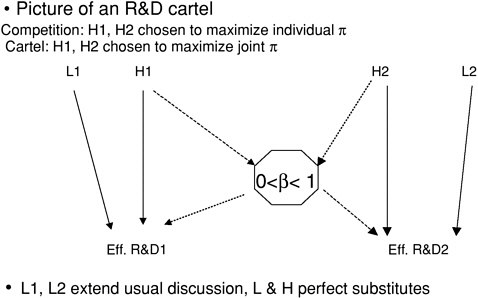
FIGURE 1 Pure coordination.
and 2 undertake levels H1 and H2 of “high spillover” R&D, with β dollars of R&D added on to firm 1’s “effective R&D” level for every dollar of R&D undertaken by firm 2, and vice versa. Spillover coefficient β must clearly range in value from 0 to 1, with 0 for no spillover and 1 for complete spillover (your R&D investment benefits me as much as yourself). In making their R&D investment decisions absent coordination, it is natural to characterize a competitive equilibrium as one in which each firm takes the other firm’s R&D level as a given. With the cartel the two firms commit to jointly fixing their R&D levels in order to maximize the sum of their joint profits.
The other form of cooperation that is well explored in the literature is an R&D joint venture. With this idealized story (shown in Figure 2) firms agree to perform all R&D through a joint venture that gives both firms access to all research results. Such an R&D joint venture could be organized in a competitive manner: Both firms could individually decide how much funding to give the joint venture in order to maximize their individual profits. Alternatively, the R&D joint venture could be organized as a cartel, with the two firms getting together and committing to R&D investments in order to maximize the sum of their individual profits jointly. In this latter case the story includes both coordination and information sharing, and the spillover coefficient β for another firm’s R&D investment is always 1, since it is performed by the joint venture and given to both firms. If the joint venture is somehow less efficient than individual-firm R&D efforts, then β can be less than 1 and the possible values for the spillover coefficient are not materially different than in the case of the pure R&D cartel.
Without loss of generality the impact of R&D is assumed to be a lowering of production cost. In both of these stories firms are assumed to take into account the effect of their R&D investments at some first stage on their competitors’ production costs at a second stage because of spillovers after all R&D is com
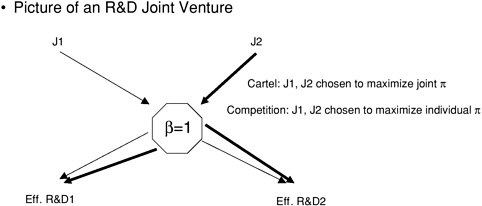
FIGURE 2 Coordination and information sharing.
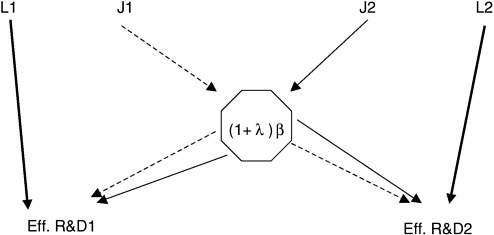
FIGURE 3 Picture of SEMATECH.
pleted and production is undertaken. Firms behave as Cournot competitors in the production stage, all firms are assumed to join a cartel when one is organized, and diminishing returns to R&D in reducing production costs are also assumed.
What then is the impact of cooperation? Although the precise details vary, the general result is that it depends on the magnitude of spillover parameter β. Without a joint venture (individual R&D efforts only) and very high spillovers (β large), R&D increases with a cartel. Without a joint venture and very low spillovers (β small), R&D decreases with a cartel. For any given degree of spillovers an R&D joint venture with uncoordinated funding (no commitment) gives the least “effective R&D” in any of the four possible cases, while the R&D joint venture with coordinated funding (commitment) yields the most “effective R&D.”13
In short, if we argue that SEMATECH is like an R&D joint venture in which firms sit down together and jointly figure out which R&D investments are worth making in order to maximize the entire industry’s profitability, then agree to fund those investments, then SEMATECH must increase the level of “effective R&D” being performed in the industry. Conversely, if SEMATECH were like an R&D joint venture in which members voluntarily decide how much to contribute, if they wish, with the ability to “free ride” on the contributions of others a real option, then SEMATECH would decrease the overall level of “effective R&D” performed in the industry.
Unfortunately, neither of these “pure” stories that have been explored in the theoretical literature is a good description of the real SEMATECH (see Figure 3).
SEMATECH members commit to R&D spending levels on some set of common projects deemed to benefit “the industry as a whole,” while competing on other R&D projects they undertake internally in an environment designed to minimize spillovers to others. The theoretical literature generally assumes everyone joins the cartel or the joint venture. Partial industry membership—as in the real-world SEMATECH—is generally not considered. In addition, the real-world SEMATECH received a government subsidy for the first eight years of its life, and none of these models explicitly considers the impact of a subsidy—or the way that a subsidy might increase β in an R&D joint venture (matching federal funds could even transform a low spillover coefficient to a post-subsidy β greater than 1, with effective R&D exceeding total private R&D investment in the joint venture). Finally, it may be that one of the possible impacts of an organization like SEMATECH (even without additional federal funding) is to increase the spillover rate for privately conducted R&D, in effect altering something these models all take as exogenously set.
CONCEPTUAL ISSUES IN THE IRWIN AND KLENOW ANALYSIS
The models do suggest, however, that one must be cautious in issuing policy advice. Irwin and Klenow argue, for example, that if firms are motivated to participate in SEMATECH by a desire to fund R&D with significant spillovers, one would expect SEMATECH participation to result in a net increase in R&D undertaken by members after this “commitment” to such projects. Their econometric estimate of a negative impact on R&D is then interpreted as suggesting that it is “sharing” of information and not commitment that must have been the main motivation for SEMATECH’s formation.14 But as we have just noted, even if one were to quickly make the heroic leap from a highly stylized theoretical model to the real-world SEMATECH, firms getting together and jointly committing to funding of R&D with spillovers can actually lower R&D rather than increase it if spillovers are not sufficiently great. Even heuristic reasoning by analogy does not permit drawing the conclusion Irwin and Klenow propose.
Even more tenuous is the Irwin and Klenow claim that a government subsidy is clearly justified in order to stimulate industry commitment to R&D if externalities are present and completely unjustified if information sharing is the exclusive motivation for cooperation.15 Kenneth Arrow in his seminal 1962 contribution
pointed out that even without any spillovers, if an invention were to be completely appropriable by the inventor (due, say, to a perfect patent system), the private return to invention could fall short of the social return (and therefore be a candidate for subsidy) if the inventor were unable to perfectly price-discriminate among users of the invention.16 Later investigators established that excessive R&D investment could be an alternative outcome if, for example, patent races resulted as would-be monopolists raced to be first to patent and reap monopoly rents. The key point is that even with no spillovers from R&D it is possible (though not at all inevitable) for social return to exceed private return and a subsidy to be justifiable. The same holds true in the models reviewed above.17 Theory seems only to suggest that it all depends on the specifics of the case and sweeping claims are best avoided.
Further, as Irwin and Klenow themselves acknowledge, their argument assumes that the projects undertaken by SEMATECH are perfect substitutes for the projects that companies fund internally. If this is not the case—if they are imperfect substitutes or even complements—the logic falls apart.
For example, Irwin and Klenow argue that if eliminating duplication in R&D—information sharing—is the sole motivation for cooperation, then a dollar of SEMATECH R&D simply replaces inframarginal investments in R&D within all member companies. Because the return to a marginal dollar invested in R&D in a company has not been changed, no additional R&D projects are
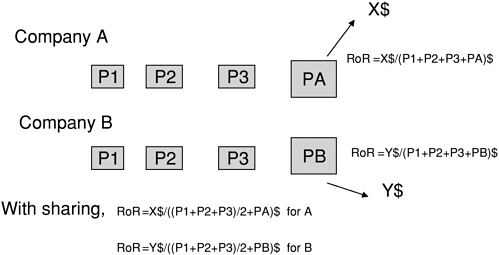
FIGURE 4 How information sharing through a consortium can stimulate R&D without spillovers.
started internally and the net impact of sharing of R&D is to reduce overall R&D spending.18
Suppose instead that the SEMATECH projects are complementary to internal company projects (and we maintain the assumption of no spillovers). It is then possible to construct entirely plausible scenarios where “sharing” of some projects is sufficient to increase the return on projects that would not otherwise have been undertaken to the point where they are. Figure 4 depicts such an example. Both companies have to step through three preliminary projects, costing P1, P2, and P3 dollars, before company A can spend PA in its own unique way, creating net revenues of X$, and company B can spend PB in its own unique way, with a subsequent revenue flow of Y$. Initially, doing all projects on their own, neither company can meet its hurdle rate of return. By combining their efforts on preliminary projects, however, each can halve its preliminary project spending to (P1 + P2 + P3)/2, perhaps increasing rates of return for the company-unique R&D projects to the point where they are now attractive investments.
In short, the assumption that internal-company and SEMATECH R&D are perfect substitutes is critical to claims that pure “sharing” must reduce overall industry R&D. There is no empirical evidence that this is the case, and one might even argue that the simple story told in Figure 4 is as plausible as any in describing the nature of R&D undertaken within SEMATECH.
Finally, Irwin and Klenow argue that if pure information sharing is what SEMATECH is about and SEMATECH R&D is a perfect substitute for internal R&D, the net impact of a SEMATECH effort of size S would be to cut every
company’s internal effort by S, since the many internal efforts of this size have now been replaced by a single common external effort.19 In this case, with a dollar of SEMATECH effort a perfect substitute for a dollar of internal R&D within N member companies, aggregate industry R&D declines N dollars for every one dollar of SEMATECH effort, for a net decline of N-1 in R&D spending for the industry as a whole with every dollar of SEMATECH R&D. Note moreover that even though aggregate spending on R&D might have declined by N-1 dollars, effective R&D would remain unchanged—it would simply be done more efficiently as firms “passed around” the results of the common SEMATECH R&D dollar rather than duplicate it N times internally. SEMATECH would be socially beneficial even if it led to a sharp decline in overall industry R&D.20
But, do matters really stop here, where the Irwin and Klenow argument stops? Firms would now be earning an additional profit, since the same revenues would now be generated with lower total costs for all firms. The benefits of information sharing would thus create a rent for incumbent members, and entry by new firms into the industry—and SEMATECH—would therefore be stimulated. In the long-run, therefore, a SEMATECH R&D effort of size S, even if it were a perfect substitute for internal efforts by N member companies, would not reduce aggregate industry R&D by (N-1) × S, since declines in incumbent member spending on R&D would be offset to some extent by R&D spending by new entrants into the industry. “Effective” R&D summed up over the entire industry could actually rise as new entrants added their efforts to the unchanged totals for incumbent firms.
Our conclusion, as before, is that sweeping claims that estimated coefficients draw sharp lines in the sand between competing hypotheses about SEMATECH and the nature of its R&D projects are ill-founded.
ANOTHER CONCEPTUAL FRAMEWORK
To motivate the empirical analysis described by Irwin and Klenow we can construct a simple model that leads in an analytical way to the model to be estimated econometrically. Our point of departure is a model of industry R&D first described by Dasgupta and Stiglitz extended to include a shared R&D effort.21 Appendix A to this paper gives details.
We take away from this model an analytical justification (see equation [8] in Appendix A) for a model with firm R&D share of sales a function of parameters related to the elasticity of cost reduction with respect to R&D (call this technological opportunity), industry concentration, and existence of and membership in an R&D consortium. Based purely on information-sharing motivations (assuming away spillovers between internal-firm R&D efforts) and assuming perfect substitution between consortium R&D and internal-firm R&D, we have seen that we would expect the formation of a “small” SEMATECH-like consortium to have a negative impact on R&D to sales ratios among members, but that would be a good thing, not a bad thing. “Effective R&D” within member firms could actually rise, costs and prices would decline, and society would be better off.
Heuristically we can further argue that if we allow spillovers between firms from internal R&D or consortium R&D to be a complement to rather than a substitute for internal efforts, the expected decline in firm R&D to sales ratios associated with pure information sharing might actually be reversed and a net positive effect on R&D to sales ratios observed. A positive impact of SEMATECH would show that the “coordination” effects more than counterbalanced an expected negative “sharing” effect. However, a negative impact would not disprove the existence of spillovers or imperfect substitution between SEMATECH and member company R&D but merely show that these impacts were not large enough to offset the expected negative impact of information sharing on R&D ratios.
MODELING ISSUES
We therefore will follow Irwin and Klenow in analyzing the impact of SEMATECH by estimating an equation where firm R&D ratios are taken to be a function of industry-wide factors (such as technological opportunity, industry concentration, factor prices) that are constant across firms but vary over time, and company-specific factors (product orientation, company technical capacity relative to the industry average, factor price differentials relative to others) that are assumed to be constant over time. We have motivated this analysis strategy somewhat differently than Irwin and Klenow, and propose different interpretations of the coefficients.
The basic equation to be estimated is
R&D/salesit = ci + ct + rsl * R&D/salesit-1 + sst * SEMATECHit
Where the c’s are company and time dummy variables and SEMATECH is a set of dummy variables for consortium membership that varies from year to year by companies, depending on whether they were members, and whose coefficients also will be allowed to vary over time. Coefficient “rsl” measures the impact of the previous year R&D/sales ratio on the current ratio, reflecting a partial adjustment of actual to desired R&D levels. We expand on this point below.
We also take a different approach on other points.
Data
Close scrutiny of the original Irwin and Klenow sample shows that many firms classified in the code corresponding to semiconductors are not actually semiconductor device producers at all. Accordingly we have divided up the original Irwin and Klenow sample into what we call “broad” (B) semiconductor makers, producers with a broad portfolio of products they manufacture; “narrow” (N) integrated circuit (IC) firms, with a more limited product portfolio of relatively specialized ICs; fabless (F) design firms that do not actually manufacture semiconductors; producers of discrete devices (not ICs) (D); equipment and materials (EM) companies that sell specialized inputs to semiconductor device producers; and other firms (O) that do none of the above. Additionally, we have sought to identify which equipment and materials firms joined SEMI/SEMATECH over some period and which did not, a distinction not drawn by Irwin and Klenow.
Appendix B shows the composition of the original Irwin and Klenow sample as distributed within these industry groups and which firms were members of SEMATECH for at least part of the 1971-1993 period their sample covered. Of the 71 firms in their sample 11 belonged in the B group. All 6 of the SEMATECH members in their sample belonged to this same group. The N group contained 27 firms and the F group 10 firms. Eleven firms only produced discrete semiconductors (like individual transistors and diodes, not integrated circuits), 2 firms were materials producers, 5 produced other electronic components, and 5 still other products and services. In short, of the 71 companies in the original Irwin and Klenow sample, 11 were broad-based IC manufacturers (the B group, of which 6 were at some point SEMATECH members), another 27 were more narrowly focused IC manufacturers, 10 firms designed but did not manufacture ICs, 11 firms manufactured simple discrete semiconductor devices, and the remaining 12 firms were not directly involved in semiconductor production.
We have also extended the original sample of firms used by Irwin and Klenow from 1993 through 1998 and have added to the sample additional firms classified by Compustat as semiconductor producers, increasing sample size significantly. Some 46 additional firms were added: 3 in B (1 of which was to become a SEMATECH member), 15 in N, 19 in F, 5 in D, and 4 in M (see Appendix C).
Econometric Methods
We include lagged R&D-to-sales ratio as an explanatory variable to capture a partial adjustment process. Irwin and Klenow examine only the short-run instantaneous impact of SEMATECH on R&D by looking only at the coefficient of the SEMATECH variables; we also examine the long-run impact by examining the long-run multiplier ss/(1-rsl).
It is well known that with a lagged dependent variable, coefficient estimates are not consistent when a fixed effects estimator is calculated with panel data, as
is the case in the original Irwin and Klenow paper. This is because consistency requires that the time dimension of the panel also become large, and typical time series of cross sections are quite short (often the number of observations per subject is a single digit). Irwin and Klenow have a relatively long data series (from 1971 to 1993) but only six years in which any of the SEMATECH membership variables are nonzero. By increasing our sample length to 1998, we almost double the time dimension of the SEMATECH membership variables and, we hope, also reduce bias issues coming from small sample size. In addition we have dealt with this problem by first differencing the model and then instrumenting the lagged R&D-to-sales ratio. R&D sales ratios lagged twice, and the value of company assets—current, lagged, and lagged twice—were used as instruments. These estimators, though not particularly efficient, are at least consistent.
Other Issues
Although we obtained some of the actual data from the authors, we were unable to reproduce many of their reported results when we ran their data and code in our version of the TSP econometric software package. Some of the results seemed to be clearly incorrect as published, or at least highly implausible; for example, their variable investment/sales has the same mean (to two significant reported digits) for a sample of 822 observations spanning 1971-1993 as for a subsample of 558 observations spanning 1980-1993.22
Our inability to reproduce their published results was somewhat less severe for the results we were concerned with (i.e., their analysis of R&D-to-sales ratios). (See Table 1, which shows both unweighted regression estimates and coefficients from regression weighting observations using a measure of real assets as weights.) Even there, however, there was a serious problem in their reported results. To begin, what they show as the regressions for R&D/Sales as the depen
TABLE 1 Unweighted Regression Estimate and Coefficients for Regression Weights Observations Using a Measure of Real Asset As Weights
|
|
IK Original Results Reported |
IK Original Re-Estimated |
||
|
|
Unweighted OLS |
IKAssets-WLS |
Unweighted OLS |
IKAssets-WLS |
|
RSL |
0.26(0.06) |
0.36(0.06) |
0.26(0.08) |
0.36(0.07) |
|
Age2 |
7.8(1.5) |
6.4(1.9) |
7.8(1.9) |
6.4(2.2) |
|
Age35 |
9.3(1.3) |
5.0(1.2) |
9.3(1.6) |
8.0(1.4) |
|
Age6 |
9.7(1.3) |
8.2(1.1) |
9.7(1.7) |
8.2(1.3) |
|
S88 |
-1.04(0.56) |
-1.53(0.45) |
-0.01(0.56) |
-1.53(0.52) |
|
22 |
See Irwin and Klenow, op. cit., Table 7. |
dent variable are actually the regressions for R&D/Assets and vice-versa.23 Even when we make the appropriate substitution, there are further issues. Irwin and Klenow report their coefficients for the SEMATECH dummy as a percentage (i.e., multiplied by 100) to simplify interpretation. What they report in the published article as a coefficient of –1.04 for their unweighted least squares regression should actually be a coefficient of –.0104. Rather than being a third less than the –1.53 weighted least squares estimate, it is an order of magnitude smaller and well outside a 95 percent confidence interval for the latter! We were unable to reproduce most of their reported standard errors, using either normal or heteroskedasticity-consistent estimators, even though we were using the same data and econometrics software (TSP, though we used a later version).
Other Results with the Original Irwin and Klenow Dataset
Next, we took the original Irwin and Klenow dataset and eliminated all firms other than the 12 “broad” IC producers. The results are shown in Table 2.
The point estimates of reductions in R&D-to-sales ratios due to SEMATECH membership (S88) are generally larger in this subsample, though standard errors are quite large (as might be expected, given the small sample size), and the estimated coefficients are not statistically significant. The differenced model with the lagged R&D-to-sales ratio instrumented produced even larger point and long-run multiplier estimates, though standard errors were even larger. Note that all SEMATECH members belong to this group of “broad” IC producers.
TABLE 2 Results of Irwin and Klenow Dataset with 12 Broad IC Producers
|
|
IK Original Broad Only |
||
|
|
Unweighted OLS |
IKAssets-WLS |
FW-Assets WLS |
|
RSL |
0.37(0.06)<0.15> |
0.36(0.07)<0.09> |
0.36(0.07)<0.09> |
|
Age35 |
1.75(1.48)<2.37> |
3.98(2.84)<3.78> |
4.12(3.04)<3.99> |
|
Age6 |
3.37(1.42)<2.55> |
4.65(2.74)<3.63> |
4.63(2.94)<3.84> |
|
S88 |
-0.21(0.90)<0.89> |
-1.29(1.14)<0.90> |
-1.35(1.08)<0.91> |
|
Std. Err. of Regression |
0.026 |
0.028 |
0.028 |
|
R2 |
0.860 |
0.840 |
0.839 |
|
LRMult |
-0.34(1.45)<1.44> |
-2.03(1.78)<1.43> |
-2.10(1.66)<1.41> |
|
|
Unweighted 1st Diff |
IK-weighted 1st Diff |
FW-Weighted 1st Diff |
|
RSLD2 |
0.59(0.63)<0.57> |
0.71(0.40)<0.43> |
0.64(0.36)<0.42> |
|
Age6D |
-1.28(1.31)<0.89> |
-0.86(1.85)<1.24> |
-0.69(1.87)<1.19> |
|
S88D |
-1.34(1.53)<1.21> |
-1.16(2.00)<1.11> |
-1.21(1.81)<1.01> |
|
LRS88D |
-3.26(5.08)<4.42> |
-3.99(8.15)<6.25> |
-3.40(5.72)<4.28> |
|
Std. Err. of Regression |
0.029 |
0.032 |
0.031 |
|
|
< >Robust SE’s |
||
|
23 |
We are referring here to Ibid., Table 3. |
“Narrow” producers were added to this sample and a Wald test was calculated for the hypothesis that both broad and narrow producers had identical coefficients for age dummies and lagged R&D to sales (none in the N group joined SEMATECH). We could not reject the hypothesis of homogeneity.
The top row of Table 3 shows the chi-squared values for the Wald test where, as before < > denotes the use of robust covariance estimates, and p-values are shown in parentheses. The remainder of Table 3 shows coefficient estimates and the estimated value of the long-run impact of SEMATECH membership.
Standard errors are now substantially lower, and with weighted least squares the R&D-saving effects of SEMATECH membership are now statistically significant. The differenced model, as before, has substantially larger standard errors.
Table 4 also shows that using current nominal assets (FW weights) as weights in lieu of real assets (asset weights deflated by an investment price index for the semiconductor industry, the original Irwin and Klenow procedure) makes little difference in estimated coefficients. When we extend the sample, we will use current-dollar nominal asset values since the semiconductor investment deflator is not available for recent years.
When fabless firms (F) were added to the sample, their inclusion could not be rejected when the weighted estimators were used (though unweighted least squares with non-robust covariance matrix estimates leads to rejecting homogeneity with a Wald test). It is worth noting that the pattern visible in this one case—with Wald tests leading to rejection of the homogeneity hypothesis using a non-robust covariance matrix estimate, but not being able to reject when robust estimates were used—was a pattern that was often repeated. Weighted least squares estimates suggest a long-run impact of SEMATECH in reducing member
TABLE 3 Coefficient Estimates and the Estimated Value of the Long-run Impact of Sematech Membership
|
ChiSq(all) |
27.5(0.28)<25.6(0.38)> |
9.23(1.00)<22.1(0.57)> |
8.16(1.00)<22.5(0.61)> |
|
|
IK Original B+N |
||
|
|
Unweighted OLS |
IKAssets-WLS |
FW-Assets WLS |
|
RSL |
0.29(0.03)<0.07> |
0.34(0.04)<0.08> |
0.34(0.04)<0.08> |
|
Age35 |
1.69(1.11)<1.44> |
2.74(1.70)<2.93> |
2.86(1.81)<3.07> |
|
Age6 |
1.69(1.10)<1.30> |
3.39(1.66)<2.84> |
3.39(1.77)<2.98> |
|
S88 |
-0.68(0.71)<0.62> |
-1.52(0.55)<0.59> |
-1.52(0.54)<0.60> |
|
Std. Err. of Regression |
0.027 |
0.029 |
0.029 |
|
R2 |
0.774 |
0.755 |
0.756 |
|
LRS88 |
-0.95(1.00)<0.87> |
-2.31(0.83)<0.87> |
-2.30(0.80)<0.89> |
|
|
Unweighted 1st Diff |
IK-weighted 1st Diff |
FW-Weighted 1st Diff |
|
RSLD2 |
0.62(0.26)<0.24> |
0.76(0.27)<0.43> |
0.70(0.25)<0.42> |
|
Age6D |
-0.53(0.83)<0.62> |
-0.47(1.10)<0.98> |
-0.32(1.11)<0.94> |
|
S88D |
-0.73(1.39)<1.04> |
0.05(1.15)<1.09> |
-0.13(1.07)<1.03> |
|
Std. Err. of Regression |
0.034 |
0.038 |
0.037 |
|
LRS88D |
-1.92(3.79)<2.90> |
0.19(4.64)<4.64> |
-0.44(3.49)<3.22> |
|
|
< > robust SE's |
||
TABLE 4 Current Nominal Assets as Weights in Lieu of Real Assets
|
ChiSq(all) |
44.5(0.00)<21.8(0.19)> |
4.54(1.00)<12.1(0.80)> |
5.05(1.00)<12.3(0.78)> |
|
|
IK Original B+N+F |
||
|
|
Unweighted OLS |
IKAssets-WLS |
FW-Assets WLS |
|
RSL |
0.25(0.03)<0.08> |
0.36(0.04)<0.07> |
0.35(0.04)<0.07> |
|
Age35 |
4.02(0.96)<1.29> |
3.40(1.40)<2.14> |
3.45(1.50)<2.23> |
|
Age6 |
4.79(0.92)<1.26> |
4.23(1.37)<2.08> |
4.25(1.46)<2.18> |
|
S88 |
0.07(0.80)<0.66> |
-1.21(0.52)<0.58> |
-1.20(0.51)<0.58> |
|
Std.Err. of Regression |
0.032 |
0.033 |
0.033 |
|
R2 |
0.751 |
0.732 |
0.733 |
|
LRMult |
0.09(1.06)<0.87> |
-1.88(0.80)<0.89> |
-1.87(0.77)<0.89> |
|
|
< > robust SE's |
||
R&D by around 2 percent of sales. While standard errors remain relatively large, we reject the hypothesis that there was no impact or a positive impact in our weighted regressions.
We note that we rejected the inclusion of discrete device producers and materials and equipment producers when appropriate Wald tests were run.
New Data
One strategy for improving these estimates is to extend and refine the original Irwin and Klenow sample. We do so by adding additional IC producers and extending the sample to cover the 1993-1998 period. Table 5 reproduces some of these estimates for samples that covered broad producers only and samples that included broad, narrow, and fabless IC producers.
Standard errors, unfortunately, are huge. Point estimates for weighted least squares regressions are somewhat larger than in the shorter, narrower Irwin and Klenow sample.
Time-varying SEMATECH Effects
The fact that a larger, longer, more populous sample actually raised standard errors highlights the question of whether it is really reasonable to assume that the impact of SEMATECH was constant over time. An extended sample twice as long as the original sample would most likely accentuate this problem. Because SEMATECH got off to a slow start in 1988-1989 and shifted its focus in response to changing events over the period 1989-1992, it seemed reasonable to expect that even over the 1988-1992 period there would have been a ramp-up of sorts in SEMATECH activity. We therefore decided to experiment by letting the impact of SEMATECH vary from year to year.
By running a series of Wald tests for homogeneity of distinct annual SEMATECH dummies over the 1988-1998 period we narrowed down to a plausible set of periods over which it seemed reasonable to propose that SEMATECH’s activities were relatively homogeneous. The Wald tests confirmed that the hypotheses
TABLE 5 Estimates of Samples Covering, Broad, Narrow, and Fabless IC Producers
|
|
FW 7198 Broad Only |
FW 7198 B+N |
FW 7198 B+N+F |
||||
|
|
Unweighted OLS |
FW-Assets WLS |
Unweighted OLS |
FW-Assets WLS |
Unweighted OLS |
FW-Assets WLS |
|
|
RSL |
0.47(0.05)<0.17> |
0.74(0.06)<0.14> |
0.32(0.04)<0.43> |
0.51(0.04)<0.13> |
-0.04(0.01)<0.07> |
0.08(0.02)<0.15> |
|
|
Age35 |
1.47(1.31)<2.42> |
-0.96(0.65)<1.11> |
9.14(7.26)<5.06> |
-0.49(0.56)<0.97> |
-2.17(9.25)<10.8> |
-0.06(1.13)<0.99> |
|
|
Age6 |
2.36(1.29)<2.76> |
0.31(1.72)<2.17> |
-4.61(7.28)<5.50> |
-0.20(1.27)<1.55> |
-17.9(9.35)<9.89> |
-2.86(2.33)<2.42> |
|
|
S88 |
1.24(0.74)<0.77> |
-2.28(0.92)<1.13> |
-3.96(5.04)<3.04> |
-2.25(0.69)<0.98> |
-6.53(8.47)<3.65> |
-3.70(1.37)<1.24> |
|
|
Std. Err. of Regression |
0.026 |
0.032 |
0.236 |
0.025 |
0.408 |
0.463 |
|
|
R2 |
0.845 |
0.789 |
0.441 |
0.780 |
0.625 |
0.526 |
|
|
LRMult |
2.34(1.43)<1.63> |
-8.74(3.68)<4.92> |
-5.84(7.43)<4.95> |
-4.58(1.41)<1.93> |
-6.28(8.16)<3.54> |
-4.00(1.48)<1.29> |
|
|
|
Unweighted 1st Diff |
FW-WLS 1st Diff |
Unweighted 1st Diff |
FW-WLS 1st Diff |
Unweighted 1st Diff |
FW-WLS 1st Diff |
|
|
RSLD2 |
0.82(0.47)<0.42> |
0.74(0.22)<0.28> |
0.88(0.08)<1.07> |
0.77(0.14)<0.39> |
0.75(0.08)<0.41> |
0.72(0.07)<0.30> |
|
|
Age6D |
1.53(1.31)<0.88> |
-0.75(2.43)<1.25> |
-15.1(0.05)<12.8> |
0.35(1.68)<1.17> |
-1.13(7.86)<10.7> |
4.47(3.28)<2.35> |
|
|
S88D |
1.02(1.47)<1.19> |
-1.13(1.58)<0.58> |
-0.55(9.43)<2.00> |
-0.71(1.23)<0.73> |
-6.55(17.1)<7.30> |
-1.02(2.60)<0.63> |
|
|
Std. Err. of Regression |
0.031 |
0.031 |
0.254 |
0.247 |
0.473 |
0.470 |
|
|
LRMs88D |
5.79(14.9)<12.6> |
-4.38(6.68)<4.24> |
-4.67(80.4)<45.8> |
-3.12(5.49)<4.55> |
-25.9(68.3)<61.9> |
-3.68(9.46)<4.21> |
|
|
|
|
ChiSq(all) |
13.11(1.00)<13.93(0.99)> |
65.9(0.00)<30.5(0.39)> |
60.9(0.00)<8.37(1.00)> |
57.3(0.00)<26.8(0.26)> |
|
|
|
< >Robust SE’s |
||||||
that these subperiods had a constant SEMATECH impact effect could not be rejected. The subperiods we ended up with using these procedures were 1988, 1989-1993, 1993-1997, and 1998. Estimates using these subperiods are shown in Table 6.
Once again, standard errors are still quite large. We cannot reject the hypothesis of a significant negative impact on member R&D over the 1989-1992 period in the weighted OLS estimates, but none of the SEMATECH variables is significant when we use the differenced model and an IV estimator, sadly, because our standard errors are so great. Interestingly, in all of the specifications and estimators 1998 stood out as significantly different from the 1993-1997 period. In industry R&D figures it is clear that, for the semiconductor industry overall, there was a major jump in R&D as a share of sales in 1998. It is interesting to speculate that the cumulative impact of investments in technology acceleration over the 1993-1997 period permitted SEMATECH members to “hang back” as other chip companies found themselves forced to invest major sums to catch up. The addition of some major global companies as international members in 1998 and the ongoing conversion of SEMATECH into International SEMATECH during this period may have brought in additional resources that allowed the incumbent U.S. members (the only ones in our sample prior to 1998) to not raise their R&D share of sales as much as the rest of the industry.
The Materials and Equipment Industry
Finally, we might ask if cooperation with SEMATECH had a discernable impact on companies supplying specialized materials and equipment to the semiconductor industry that were cooperating actively with SEMATECH. Given the discussion above and an evolving focus within SEMATECH on upgrading supplier industry technology, we might expect SEMATECH to have had some impact on supplier industry R&D.
We sampled U.S. semiconductor materials and equipment suppliers by adding selected firms from SIC code 3559 (a grab-bag category for semiconductor equipment suppliers) to the semiconductor equipment and materials suppliers included in the original Irwin and Klenow sample, and then coding a dummy variable to reflect participation in the SEMI/SEMATECH supplier consortium for a company in a given year. Results from fitting the model to this data are shown in Table 7.
As might perhaps be expected with such a highly diverse group of suppliers, the portion of the variance explained by an ordinary least square regression model is substantially less than for the more narrowly focused semiconductor producers analyzed earlier. The estimated impact of SEMI/SEMATECH membership on company R&D ratios is generally positive, but estimated standard errors are high, and we cannot reject the hypothesis of no (or even a negative) impact on R&D ratios within cooperating suppliers.
TABLE 6 Estimates using Subperiod for a Series of Wald Test for Homogeneity
|
|
FW7198 B+N+F SY-Estimated |
FW7198 B+N SY-Estimated |
|||
|
|
Unweighted OLS |
FW-Assets WLS |
Unweighted OLS |
FW-Assets WLS |
|
|
RSL |
-0.04(0.01)<0.07> |
0.08(0.02)<0.15> |
0.32(0.04)<0.43> |
0.52(0.04)<0.13> |
|
|
Age35 |
-2.00(9.26)<10.7> |
-0.14(1.13)<1.00> |
9.34(7.28)<5.20> |
-0.58(0.55)<0.98> |
|
|
Age6 |
-17.5(9.38)<9.75> |
-3.19(2.35)<2.46> |
-4.35(7.31)<5.33> |
-0.24(1.25)<1.57> |
|
|
SY88 |
0.17(19.0)<1.90> |
-2.13(3.47)<1.36> |
0.65(11.4)<1.76> |
-2.08(1.82)<1.16> |
|
|
SY8992 |
-14.1(10.8)<6.86> |
-4.75(1.90)<1.76> |
-8.49(6.49)<6.35> |
-2.29(0.97)<1.12> |
|
|
SY9397 |
-0.05(12.9)<2.30> |
-3.04(1.46)<1.29> |
0.13(7.25)<1.54> |
-1.57(0.72)<1.05> |
|
|
SY98 |
5.45(25.5)<6.59> |
-6.28(1.92)<2.92> |
-2.18(15.0)<4.68> |
-5.51(0.94)<1.86> |
|
|
Std. Err. of Regression |
0.408 |
0.464 |
0.236 |
0.251 |
|
|
R2 |
0.626 |
0.526 |
0.443 |
0.403 |
|
|
LRMultSY88 |
0.17(18.3)<18.3> |
-2.30(3.76)<1.52> |
0.95(16.8)<2.42> |
-4.32(3.79)<2.58> |
|
|
ChiSq(all) |
59.7(0.00)<8.64<1.00> |
58.6(0.00)<27.7(0.23)> |
11.9(1.00)<14.3(0.99)> |
75.6(0.00)<32.0(0.32)> |
|
|
|
Unweighted 1st Diff |
FW-Weighted 1st Diff |
Unweighted 1st Diff |
FW-Weighted 1st Diff |
|
|
RSLD2 |
0.75(0.08)<0.41> |
0.71(0.07)<0.29> |
0.88(0.07)<1.06> |
0.57(0.12)<0.35> |
|
|
Age6D |
-1.24(7.90)<10.8> |
4.28(3.28)<2.32> |
-15.3(5.21)<12.9> |
0.14(1.52)<1.16> |
|
|
SY88D |
-5.55(18.5)<5.83> |
-1.02(3.40)<0.99> |
-0.42(10.3)<2.72> |
-0.46(1.53)<0.96> |
|
|
SY8992D |
-9.38(21.0)<9.77> |
-0.86(3.12)<0.99> |
-4.71(11.5)<3.72> |
-1.40(1.32)<0.85> |
|
|
SY9397D |
-5.88(27.6)<10.5> |
-1.11(3.10)<0.90> |
6.90(15.0)<8.18> |
-0.97(1.30)<0.91> |
|
|
SY98D |
-0.18(39.5)<12.9> |
-5.14(3.53)<1.73> |
2.65(21.5)<7.96> |
-5.10(1.48)<1.73> |
|
|
Std. Err. of Regression |
0.474 |
0.467 |
0.254 |
0.227 |
|
|
LRSY88D |
-21.9(73.5)<51.9> |
-3.53(11.7)<5.02> |
-3.47(85.3)<41.0> |
-1.07(3.58)<2.22> |
|
|
|
< >Robust SE’s |
||||
TABLE 7 Results of Using Sample of SIC Code 3559 Firms with the Irwin and Klenow Model
|
|
EM3559 |
||
|
|
UnWeighted OLS |
FW-Assets WLS |
|
|
RSL |
0.26(0.04)<0.08> |
0.08(0.04)<0.08> |
|
|
Age2 |
23.0(6.31)<12.3> |
26.2(9.13)<7.57> |
|
|
Age35 |
29.8(5.49)<12.0> |
26.6(8.93)<7.43> |
|
|
Age6 |
28.6(5.50)<12.0> |
28.9(8.96)<7.49> |
|
|
SS88 |
0.44(2.29)<1.08> |
1.07(1.30)<1.16> |
|
|
Std.Err. of Regression |
0.103 |
0.119 |
|
|
R2 |
0.545 |
0.393 |
|
|
LRMult |
0.60(3.11)<1.46> |
1.16(1.41)<1.23> |
|
|
|
UnWeighted 1st Diff |
FW-Weighted 1st Diff |
|
|
RSLD2 |
0.48(0.08) |
0.27(0.09) |
|
|
Age6D |
4.04(1.82) |
5.03(2.43) |
|
|
SS88D |
0.10(3.36) |
-2.17(3.64) |
|
|
Std.Err. of Regression |
0.090 |
0.088 |
|
|
LRSS88D |
0.20(6.42) |
-2.97(5.02) |
|
|
|
< > robust SE's |
||
CONCLUSION
This paper has attempted to reexamine the impact of SEMATECH on semiconductor industry R&D by updating and improving the only published work on this issue. Unfortunately, the numbers in the original Irwin and Klenow study are marred by substantial errors in reporting results and a grab bag of econometric and data issues. When these problems were addressed and substantial volumes of additional data added to their sample, results of estimating the basic model being considered did not improve greatly. Estimated standard errors continued to be large, and parameter estimates were not particularly stable when different variants of the same basic estimators were run over different subsets of companies and periods.
Our conclusion is that the basic model specification used here is not capturing important aspects of the data well. Though we attempted as best we could to provide an analytical framework that justifies the model specification, we were forced to simply ignore the issues of the degree of substitutability or complementarity between consortium R&D and internal-company R&D (as does most of the theoretical literature), and to include in any analytical way the impacts of spillovers to internal-company R&D efforts. A model in which companies are assumed to have a constant R&D share relative to some industry-wide index that changes from year to year simply does not seem to work well. This is perhaps not surprising, since a casual perusal of National Science Foundation R&D data suggests that the Dasgupta-Stiglitz model—the only model we are aware of that can be manipulated to make a clear prediction of this sort—does not seem to fit real-
world industry cross section data particularly well. There just seem to be too many other things going on that are not addressed in these stylized stories.
To the extent that these exercises can be believed (and we already have expressed our reservations), the data seem to suggest that SEMATECH reduced the R&D expenditures of its membership somewhat, as might have been predicted. However, we have taken pains to point out this cannot be interpreted as showing anything about the nature of the effort going on within SEMATECH, or as proving whether the effort justified a government subsidy. Finally, the underlying models of R&D cooperation that ultimately must be the basis of a scientific effort to untangle the chains of causality are simply too simplified at this point to capture the complexity of the real world of SEMATECH: a real world in which companies committed to R&D carried out within a joint venture while at the same time competing through internal R&D efforts that also may have spilled over to competitors, a real world in which the menu of consortium activities changes over time with experimentation and learning. At the end of the day the only absolutely certain thing about SEMATECH is that a substantial portion of its member companies must have found it to be of net value, having actually run the experiment of ending public subsidy and finding that they—its consumers—continued to buy its output.
APPENDIX A A SIMPLE EXTENSION OF THE DASGUPTA-STIGLITZ MODEL OF R&D TO AN R&D CONSORTIUM
Assume companies invest in R&D to lower their unit costs of production, c. We assume that company attempts to protect proprietary information are successful and there are no spillovers between internal company R&D efforts. All companies belong to an organization called SEMATECH, with an exogenously set R&D budget of S. Company i invests xi in order to lower its unit costs to c(xi + βS), with c a decreasing function of its argument—effective R&D—with c´ < 0, c´´ > 0. S is SEMATECH R&D, assumed a perfect substitute for internal company R&D, and β is the contribution of a dollar of shared, privately funded SEMATECH R&D to member-company effective R&D. If SEMATECH is less efficient or effective than a private company, β < 1. If it is equally effective, β = 1, and if there are matching federal funds, it is possible that β > 1. We assume that the SEMATECH budget is shared equally among members, so if there are N members, each pays a fixed sum of S/N in dues to join SEMATECH. For firms to voluntarily join SEMATECH, therefore, it is necessary that member-company benefit exceeds membership cost (i.e., that β > 1/N, which we shall assume).
Because there are no spillovers between internal company R&D efforts (and one company’s internal R&D does not affect another’s production costs), there is no need to distinguish between a first-stage R&D decision and a second-stage production decision, and we can treat the two decisions as simultaneous in analyzing a Cournot-Nash equilibrium, with each firm choosing its R&D and output levels taking those of its competitors as given. The profit of company i is given by
(1)
where the X and q variables are company i’s chosen R&D and output levels and Q is homogeneous industry output (=∑qi). We assume a constant price elasticity for industry demand, so optimal q for company i is determined by the standard markup condition,
(2)
We also will assume a symmetric industry equilibrium, so qi = Q / N in equilibrium and (2) becomes
(3)
We define α, the elasticity of unit cost with respect to R&D, as the percentage change in unit cost per percentage increase in effective R&D
(4)
and assume it to be constant.
In addition to maximizing profit by choosing output a firm also chooses its optimal R&D Xi. The first-order maximization condition is
or taking into account (4) and the symmetric industry equilibrium,
(5)
Note that for given N (number of firms in industry) symmetric industry equilibrium conditions (3) and (5) give us
(6)
What happens then, if—given some N—we go from a no (non-trivial) SEMATECH (S = 0) equilibrium to an equilibrium with SEMATECH spending money on R&D projects (S > 0)? Inspection of first-order conditions (3) and (5) reveals that if company R&D spending Xi is cut by βS, the first-order conditions continue to hold. Thus, as Irwin and Klenow have argued, with pure information sharing (which is what is going on in this model) and SEMATECH effort a perfect substitute for internal R&D, the impact of a SEMATECH effort of size S will be to cut company effort by βS.
But do things stop here, where the Irwin and Klenow argument stops? Inspection of profit function (1) reveals that firms are now earning an additional
profit if β > 1/N, which will always be true if membership is voluntary. Thus, firms are now earning an additional rent due to the benefits of information sharing, stimulating entry by new firms if entry is possible.
Next, consider the implications of free entry and a zero-profit, long-run-symmetric equilibrium. Then we have an additional condition in the long run,
(7) NXi + S = (P – c)Q
(i.e., variable profits should just cover fixed R&D costs).
Substituting (3) into (7) we have an expression for total industry R&D expense as a percent of sales in the long run,
(8)
which is a familiar result from the Dasgupta-Stiglitz model (with S = 0). Overall industry R&D (including SEMATECH projects) as a share of sales declines with number of firms in the industry (N) and price elasticity of demand. Internal industry R&D as a share of sales (i.e., excluding S) is smaller than it would be without SEMATECH.
Combining equation (8) with equation (6) we have
(9) N(X + βS) = (NXi + S)α(1 + Nε)
With no SEMATECH (S = 0), this gives us the familiar Dasgupta and Stiglitz result that ![]() , or equivalently (using [8]), that the R&D-to-sales ratio is
, or equivalently (using [8]), that the R&D-to-sales ratio is ![]() .
.
APPENDIX B ORIGINAL IRWIN AND KLENOW SAMPLE MEMBERSHIP
|
COMPANY |
Broad |
Narrow |
Fabless |
Discrete |
Materials & Equipment |
Other Electronics |
Others |
SEMATECH |
|
DENSE-PAC MICROSYSTEMS INC |
√ |
|
||||||
|
LINEAR TECHNOLOGY CORP |
|
√ |
|
|||||
|
CYPRESS SEMICONDUCTOR CORP |
√ |
|
||||||
|
CHIPS&TECHNOLOGIES INC |
|
√ |
|
|||||
|
IMP INC |
|
√ |
|
|||||
|
OPTEK TECHNOLOGY INC |
|
√ |
|
|||||
|
DALLAS SEMICONDUCTOR CORP |
|
√ |
|
|||||
|
MAXIM INTEGRATED PRODUCTS |
|
√ |
|
|||||
|
LOGIC DEVICES INC |
|
√ |
|
|||||
|
AMERICAN MICROSYSTEMS |
|
√ |
|
|||||
|
APPLIED SOLAR ENERGY CORP |
|
√ |
|
|||||
|
TEXAS INSTRUMENTS INC |
|
√ |
|
√ |
||||
|
AVANTEK INC |
|
√ |
|
|||||
|
BURR-BROWN CORP |
|
√ |
|
|||||
|
CODI CORP |
|
√ |
|
|||||
|
INTL RECTIFIER CORP |
|
√ |
|
|||||
|
DIONICS INC |
|
√ |
|
|||||
|
ELECTRONIC ARRAYS INC |
|
√ |
|
|||||
|
JETRONIC INDUSTRIES INC |
|
√ |
|
|||||
|
GENERAL SEMICONDUCTOR INDS |
|
√ |
|
|||||
|
SOLITRON DEVICES INC |
|
√ |
|
|||||
|
HYTEK MICROSYSTEMS INC |
|
√ |
|
|||||
|
BOURNS INC |
|
√ |
|
|||||
|
INTECH INC |
|
√ |
|
|||||
|
INTEGRATED DEVICE TECH INC |
√ |
|
||||||
|
INTERSIL INC |
|
√ |
|
|||||
|
INTERSIL INC NEW |
|
√ |
|
|||||
|
ALPHA INDUSTRIES INC |
|
√ |
|
|||||
|
UNITRODE CORP |
|
√ |
|
|||||
|
LSI LOGIC CORP |
√ |
|
√ |
|||||
|
MSI ELECTRONICS INC |
|
√ |
|
|||||
|
SEMTECH CORP |
√ |
|
||||||
|
NATIONAL SEMICONDUCTOR CORP |
√ |
|
√ |
|||||
|
MICRON TECHNOLOGY INC |
√ |
|
√ |
|||||
|
MICROSEMI CORP |
|
√ |
|
|||||
|
MICROWAVE SEMICONDUCTOR CORP |
|
√ |
|
|||||
|
MONOLITHIC MEMORIES INC |
|
√ |
|
|||||
|
MOSTEK CORP |
√ |
|
||||||
|
INTEL CORP |
√ |
|
√ |
|||||
|
ANALOG DEVICES |
|
√ |
|
|||||
|
ADVANCED MICRO DEVICES |
√ |
|
√ |
|||||
|
KYOCERA CORP -ADR |
|
√ |
|
|||||
|
SOLID STATE SCIENTIFIC |
|
√ |
|
|||||
|
RIPLEY CO INC |
|
√ |
|
|||||
|
SEEQ TE |
|
√ |
|
|||||
|
SEMICON INC |
|
√ |
|
|||||
|
SILICON SYSTEMS INC |
|
√ |
|
|||||
|
SILICONIX INC |
|
√ |
|
|||||
|
SILTEC CORP |
|
√ |
|
|||||
|
SUPERTEX INC |
|
√ |
|
|||||
|
TECCOR ELECTRONICS |
|
√ |
|
|||||
|
ALTERA CORP |
|
√ |
|
|||||
|
LATTICE SEMICONDUCTOR CORP |
|
√ |
|
|||||
|
XILINX INC |
|
√ |
|
|||||
|
ZILOG INC |
|
√ |
|
|||||
|
ATMEL CORP |
|
√ |
|
|||||
|
BROOKTREE CORP |
|
√ |
|
|||||
|
PMC-SIERRA INC |
|
√ |
|
|||||
|
INTEGRATED CIRCUIT SYSTEMS |
|
√ |
|
|||||
|
ADVANCED PHOTONIX INC -CLA |
|
√ |
|
|||||
|
TRANSTECTOR SYSTEMS INC |
|
√ |
|
|||||
|
VITESSE SEMICONDUCTOR CORP |
|
√ |
|
|||||
|
BKC SEMICONDUCTORS INC |
|
√ |
|
|||||
|
MICROCHIP TECHNOLOGY INC |
|
√ |
|
|||||
|
VLSI TECHNOLOGY INC |
√ |
|
||||||
|
XICOR INC |
|
√ |
|
|||||
|
APPIAN TECHNOLOGY INC |
|
√ |
|
|||||
|
ZITEL CORP |
|
√ |
|
|||||
|
EXAR CORP |
|
√ |
|
|||||
|
ELECTRONIC DEVICES INC |
|
√ |
|
|||||
|
PRECISION MONOLITHICS INC |
|
√ |
|
|||||
APPENDIX C ADDITIONAL FIRMS ADDED TO SAMPLE IN THIS STUDY
|
COMPANY |
Broad |
Narrow |
Fabless |
Discrete |
Materials & Equipment |
Other Electronics |
Others |
SEMATECH |
|
ACTEL CORP |
|
√ |
|
|||||
|
AEROFLEX INC |
|
√ |
|
|||||
|
ALLIANCE SEMICONDUCTOR CORP |
|
√ |
|
|||||
|
ANADIGICS INC |
|
√ |
|
|||||
|
AUREAL INC |
|
√ |
|
|||||
|
BENCHMARQ MICROELECTRONICS |
|
√ |
|
|||||
|
CATALYST SEMICONDUCTOR INC |
|
√ |
|
|||||
|
CREE RESEARCH INC |
|
√ |
|
|||||
|
CYRIX CORP |
|
√ |
|
|||||
|
ELANTEC SEMICONDUCTOR INC |
|
√ |
|
|||||
|
ELECTRONIC DESIGNS INC |
|
√ |
|
|||||
|
ESS TECHNOLOGY INC |
|
√ |
|
|||||
|
GALILEO TECHNOLOGY LTD |
|
√ |
|
|||||
|
GATEFIELD CORP |
|
√ |
|
|||||
|
HEI INC |
|
√ |
|
|||||
|
IBIS TECHNOLOGY INC |
|
√ |
|
|||||
|
INFORMATION STORAGE DEVICES |
|
√ |
|
|||||
|
INTEGRATED SILICON SOLUTION |
|
√ |
|
|||||
|
LEVEL ONE COMMUNICATIONS INC |
|
√ |
|
|||||
|
MEMC ELECTRONIC MATRIALS INC |
|
√ |
|
|||||
|
MICREL INC |
√ |
|
||||||
|
MICRO LINEAR CORP |
|
√ |
|
|||||
|
MITSUBISHI ELEC CORP -ADR |
√ |
|
||||||
|
MRV COMMUNICATIONS INC |
|
√ |
|
|||||
|
OAK TECHNOLOGY INC |
|
√ |
|
|||||
|
OPTI INC |
|
√ |
|
|||||
|
QUALITY SEMICONDUCTOR INC |
|
√ |
|
|||||
|
RAMTRON INTERNATIONAL CORP |
|
√ |
|
|||||
|
REMEC INC |
|
√ |
|
|||||
|
SDL INC |
|
√ |
|
|||||
|
SIGMA DESIGNS INC |
|
√ |
|
|||||
|
SILICON STORAGE TECHNOLOGY |
|
√ |
|
|||||
|
SIMTEK CORP |
|
√ |
|
|||||
|
SIPEX CORP |
|
√ |
|
|||||
|
SMART MODULAR TECHNOLGS INC |
|
√ |
|
|||||
|
SPECTRUM SIGNAL PROCESSING |
|
√ |
|
|||||
|
STANDARD MICROSYSTEMS CORP |
|
√ |
|
|||||
|
STMICROELECTRONICS N V |
√ |
|
√ |
|
||||
|
TELCOM SEMICONDUCTOR INC |
|
√ |
|
|||||
|
TOWER SEMICONDUCTOR LTD |
|
√ |
|
|||||
|
TRANSWITCH CORP |
|
√ |
|
|||||
|
TRIDENT MICROSYSTEMS INC |
|
√ |
|
|||||
|
UNIVERSAL DISPLAY CORP |
|
√ |
|
|||||
|
WHITE ELECTRIC DESIGNS CORP |
|
√ |
|
|||||
|
ZING TECHNOLOGIES INC |
|
√ |
|
|||||
|
ZORAN CORP |
|
√ |
|
|||||
APPENDIX D EQUIPMENT COMPANIES
|
Company Name |
cusip |
SEMI/SEMATECH |
|
AG ASSOCIATES INC |
107310 |
√ |
|
AMISTAR CORP |
3153510 |
|
|
AMTECH SYSTEMS INC |
3233250 |
|
|
APPLIED MATERIALS INC |
3822210 |
√ |
|
APPLIED SCI & TECH |
3823610 |
|
|
ASM INTERNATIONAL N V |
N0704510 |
|
|
ASM LITHOGRAPHY HOLDING NV |
N0705911 |
|
|
ASYST TECHNOLOGIES INC |
04648X10 |
√ |
|
BE SEMICONDUCTOR INDUSTRIES |
7332010 |
|
|
BROOKS AUTOMATION INC |
11434A10 |
√ |
|
BTU INTERNATIONAL INC |
5603210 |
√ |
|
CFM TECHNOLOGIES INC |
12525K10 |
√ |
|
CHEMINEER INC |
16381810 |
|
|
CRYO-CELL INTERNATIONAL INC |
22889510 |
|
|
CVD EQUIPMENT CORP |
12660110 |
|
|
CYMER INC |
23257210 |
√ |
|
DT INDUSTRIES INC |
23333J10 |
|
|
DTM CORP |
23333L10 |
|
|
ELECTROGLAS INC |
28532410 |
√ |
|
EMCORE CORP |
29084610 |
√ |
|
ENGINEERED SYS & DEV CORP |
29286810 |
|
|
ETEC SYSTEMS INC |
26922C10 |
√ |
|
FSI INTL INC |
30263310 |
√ |
|
GASONICS INTERNATIONAL CORP |
36727810 |
√ |
|
GCA CORP |
36155620 |
|
|
GENERAL SCANNING INC |
37073710 |
|
|
GENUS INC |
37246110 |
√ |
|
GERBER SCIENTIFIC INC |
37373010 |
|
|
HELISYS INC |
42328210 |
|
|
HI-RISE RECYCLING SYS INC |
42839610 |
|
|
IBIS TECHNOLOGY INC |
45090910 |
|
|
ICOS VISION SYSTEMS CORP NV |
B4923310 |
|
|
INNOTECH INC |
45766M10 |
|
|
INTEGRATED PROCESS EQ |
45812K10 |
|
|
INTEVAC INC |
46114810 |
|
|
IONICS INC |
46221810 |
|
|
KULICKE & SOFFA INDUSTRIES |
50124210 |
√ |
|
LAM RESEARCH CORP |
51280710 |
√ |
|
MATERIALS RESEARCH |
57668010 |
|
|
MATTSON TECHNOLOGY INC |
57722310 |
|
|
MICRION CORP |
59479P10 |
|
|
MRS TECHNOLOGY INC |
55347610 |
|
|
NOVELLUS SYSTEMS INC |
67000810 |
√ |
|
ONTRAK SYSTEMS INC |
68337410 |
|
|
OPAL INC |
68347410 |
|
|
PHOTRONICS INC |
71940510 |
√ |
|
PLASMA-THERM INC |
72790010 |
√ |
|
PRI AUTOMATION INC |
69357H10 |
√ |
|
QC OPTICS INC |
74693410 |
√ |
|
QUAD SYSTEMS CORP |
74730Q10 |
|
|
RIMAGE CORP |
76672110 |
|
|
SEMITOOL INC |
81690910 |
√ |
|
SILICON VALLEY GROUP INC |
82706610 |
√ |
|
SONO-TEK CORP |
83548310 |
|
|
SPEEDFAM-IPEC INC |
84770510 |
√ |
|
SUBMICRON SYSTEMS CORP |
86431310 |
|
|
TEGAL CORP |
87900810 |
√ |
|
TOOLEX INTERNATIONAL NV |
N8715N10 |
|
|
TRIKON TECHNOLOGIES INC |
89618710 |
|
|
TURN TECHNOLOGY INC |
90021310 |
|
|
VARIAN SEMICONDUCTOR EQUIPMT |
92220710 |
√ |
|
VEECO INSTRUMENTS INC |
92241710 |
√ |
|
VITRONICS CORP |
92850310 |
|
|
WAVEMAT INC |
94356110 |
|
|
YIELDUP INTL CORP |
98583710 |
|


