
APPENDIX G
Magnitudes from C. Richter to Mwpand the W phase
The process of assigning a magnitude to a seismic event is far from simple, all the more so in the case of the large earthquakes that can generate tsunamis. Originally, Charles Richter1 used the concept of measuring the maximum ground motion amplitude recorded from local events on a standard Wood-Anderson seismograph. The determination is quite straightforward, involving the measurement of the largest amplitude of the pen during the earthquake in microns—for earthquakes this is generally the shear (or secondary [S]) wave. The amplitude is empirically corrected for distance in southern California, and the observations from several stations are averaged to increase the statistical stability of the measurement. Richter thus defined a regional magnitude scale for earthquakes, which is now referred to as a local magnitude ML. The definition of ML was very important because all the subsequent magnitude scales have been tied to this initial algorithm. The concept was soon extended worldwide using a combination of measurements on body and surface waves at teleseismic distances, leading to the definition of two standardized algorithms, a body-wave magnitude mb measured on short-period P-waves at a target frequency of 1 Hz, and a surface wave magnitude Ms measured at a period of 20 s. These early algorithms were a largely empirical endeavor because of the use of simple models of seismic sources and wave propagation.
In the late 1950s and early 1960s, the work of Vvendeskaya in Russia and Aki in Japan showed that earthquake sources could be described by a relatively complex system of forces, expressed in physical units of dyne*cm or N*m as a “seismic moment” M0, and directly related to the total amount of slip occurring on the fault plane, integrated over the full surface area of faulting. Unlike seismic magnitudes, seismic moments are directly related to the physical properties of the source. In order to facilitate comparisons with existing catalogues (and also in the process to facilitate communication with the general public), Kanamori2 and Hanks and Kanamori3 proposed to recast seismic moment values into a “moment magnitude” scale, Mw, using Mw = 2/3 (log10M0 - 9.1), where M0 is in N*m (or fault area times displacement times material rigidity).
The problem of assessing earthquake size in the context of tsunami warning is several-fold:
-
The most efficient algorithms for seismic moment inversion require the use of large datasets (in practice, tens to hundreds) of long-period (low-frequency) surface waves, which unfortunately travel slowly and thus delay the warning process.
-
The conventional magnitude scales, which target relatively short periods (1 and 20 s), are not representative of the low-frequency part of the source spectrum, which controls the excitation of the tsunami. Because of the frequency dependence of the seismic source, mb and
-
Ms are theoretically expected and experimentally observed to saturate (around 6.3 and 8.2, respectively) with increasing seismic moment and are essentially useless for estimating the size of the mega-earthquakes capable of producing tsunamis that cause damage in the far field.
-
If all earthquakes obeyed scaling laws, the measurement of one or another magnitude should in principle be equivalent, and an analyst should be able to predict the low-frequency value of the seismic moment by measuring the source in a different frequency band. However, earthquakes with similar moments produce widely scattered estimates of magnitude, and “tsunami earthquakes” feature anomalous source characteristics. The observational challenge is to somehow identify those in real time.
-
While the goal of tsunami warning is to quantify (e.g., hypocenter, magnitude, focal mechanism, and fault extent) the earthquake as quickly as possible upon detection, it is also imperative to record the source in its entirety in order to assess its full tsunamigenic potential. Bearing in mind, for example, that the source of the 2004 Sumatra earthquake lasted eight minutes, we realize that assessing its size within five minutes is at best a challenge and at worst an impossible task. Unfortunately, there is really no consensus among seismologists as to the deterministic nature of earthquake rupture, namely whether the early stages of nucleation of a large earthquake carry a fingerprint of the eventual true size of the event. Indeed, several examples of delayed sources (e.g., 2001 Peru and 2006 Kuril Islands, both having generated destructive tsunamis) reveal a sudden increase in seismic moment release as late as one or two minutes into their source process; they constitute another class of events violating scaling laws. In lay terms, at the initiation of a seismic rupture, does Mother Nature really know how large the final product will be? Yet it is that final product that will control the tsunami and that the watchstanders at the Tsunami Warning Centers (TWCs) are charged with estimating, as swiftly and as reliably as possible.
-
Seismic data and sophisticated processing are insufficient to determine the destructiveness of tsunamis. Guisiakov uses the Soloviev-Imamura tsunami intensity scale based on run-up data to show there is only a tendency of increased tsunamis with an increase in earthquake magnitude. The lack of direct correlation can be attributed in part to secondary mechanisms (submarine slumps and slides) in the generation of tsunamis. This is shown in the findings by Plafker where submarine landslides account for many large and destructive tsunamis.
THE MWPALGORITHM
The application of geometrical optics to seismology reveals that the earth’s ground motion resulting from the passage of P-waves in the far-field is related to the time derivative of the history of the deformation or physical slip at the source. In other words, if a permanent deformation (in the form of a step in displacement) is incurred at the epicenter, the far-field signal will register an impulse (or spike) of short duration, followed by a return to quiescence. Conversely, the deformation at the source should be obtainable by mathematically integrating the ground displacement over time in the far field, and by performing a number of theoretically justifiable corrections, which account, for example, for the path from epicenter to receiver. As most seis-
mic instruments are sensitive to the velocity of ground motion rather than to its displacement or acceleration, in practice a double integration is required. Generally, seismic instrumentation becomes increasingly insensitive at very low frequencies when the earth’s noise is increasing and integral estimates of displacement are, perforce, inaccurate.
This is the basis of the so-called Mwp algorithm4 by which initial estimates of the seismic moment of a large earthquake can be inferred from the earliest-arriving seismic signals recorded in the far field. Mwp has been implemented and currently constitutes the procedure in use at both the Pacific Tsunami Warning Center (PTWC) and the West Coast/Alaska Tsunami Warning Center (WC/ATWC) for the purpose of estimating earthquake sources for tsunami-genic potential.
SHORTCOMINGS OF THE MWPALGORITHM
As compelling as the Mwp concept may be, it suffers from having never been subjected to the necessary and independent exercise of being tested on synthetic seismograms (i.e., computational renditions of the wavetrains expected to be recorded on a given seismic instrument for a particular scenario of earthquake size, rupture parameters [including for example the case of “tsunami earthquakes”], and receiver geometry). Obviously, the number of great and mega-earthquakes is also highly limited, thereby reducing the opportunities for applications of statistics. The theoretical understanding of seismic sources has reached the point where a number of methods are available to produce these synthetic seismograms. To the best of the committee’s knowledge, vetting of the Mwp algorithm for tsunami inference was not done prior to its use at the TWCs.
Indeed, it would be expected that the use of Mwp will encounter significant and systematic problems both for very large events and for the tsunami earthquakes that demonstrably do not follow scaling laws; that is, precisely those earthquakes carrying enhanced tsunami potential given their size. Tsuboi et al.4 compared Mwp to Mw, but only to sources that had magnitudes less than 8.0 (neither great nor mega-earthquakes). An Mwp algorithm is described in the open source (source forge) website (http://seismic-toolkit.sourceforge.net/) with a comparison of Mwp to Mw. For events larger than Mw = 8.25, the Mwp magnitude significantly underestimates the magnitude and the moment-based Mw measure. As is the case for all other magnitude measures, Mwp also saturates as earthquake moment increases. In addition, the development of an efficient algorithm providing automated routine measurements of Mwp requires extending a number of its parameters in ways that lead to further problems for larger earthquakes.
There are two categories of problems with the Mwp method: systematic problems inherent in the theory underlying the method, and shortcomings of the particular modalities of implementation used at the TWCs. Among the former:
-
The domain of applicability of the theory, known as geometrical optics, requires in principle the use of wavelengths much shorter than the characteristic dimensions of the structures involved. This principle is violated for large sources such as the Sumatra earthquake whose
-
fault length (1,200 km) was more than a third of the thickness of the earth’s mantle and seismic wavelengths substantially larger than major structural features.
-
Similarly, the theory assumes a point source and neglects the significant interference effects between the individual elements of an extended fault such as those capable of generating significant tsunamis.
Among the latter:
-
A practical computation must be limited to a finite time window, the selection of which requires a very subtle compromise between the necessary exclusion of later arriving seismic phases and the use of an interval at least as long as the duration of the seismic rupture at the source.5 This compromise may not be possible for extremely long sources (eight minutes in the case of the 2004 Sumatra earthquake).
-
The algorithm implementing Mwp at the PTWC uses a distance correction adequate for an infinite homogeneous elastic space rather than a more realistic description.
-
Similarly, the operational algorithm elects to carry out the integrations in the time domain, which assumes that the response of the seismic sensors is perfectly flat to ground velocity. However, even the best seismic instrumentation (e.g., the Streckeisen STS-1) falls off rapidly in its response at periods greater than 360 s, which leads to a systematic and predictable underestimation of the largest earthquakes, whose true size is expressed only at the longest periods where the instrument begins to decline in response (see below in discussion of W phase).
Such limitations in the operational aspects of Mwp were actually recognized by the operators of the centers during the development of their algorithms, through a comparison of their results with published earthquake magnitudes obtained by the Harvard CMT project using geophysical inverse procedures.6 These authors documented that Mwp measurements become increasingly deficient when the magnitude of the earthquake increases, and they proposed to incorporate in the final algorithm (i.e., the one presently used at the TWCs) a linear correction for this effect, defined from an empirical regression of the misfit of the values from their initial dataset with respect to the published reference values.
In summary, the committee expresses concern that the TWCs rely on a single technique applied without sufficient attention to its limitations—both inherent in its concept and resulting from the particular algorithm chosen for its implementation. Furthermore, all magnitude measures will saturate as the seismic moment increases and will not be able to quantify potential tsunami heights for great and mega-earthquakes.
INCORPORATING THE W PHASE
In 1992 during the Nicaragua tsunami earthquake, H. Kanamori identified a “W” phase wave: very-long period energy traveling along the earth’s surface by multiple reflections in the mantle. Because of the ray-mode duality in wave propagation, the W phase is best thought
of as spheriodal models or Rayleigh waves (combinations of shear and compressional wave propagation) with a group velocity in the range of 4.5 km/s (mantle shear velocities) to 9 km/s (mantle compressional velocities) over a frequency range of 1-10 mHz. The wave comprises the fundamental as well as the first three overtones.
Figure G.1, reproduced from Kanamori and Rivera,7 shows a synthetic seismogram (red) from the supervision of spheroidal modes mentioned above. Kanamori and Rivera7 note that at a distance of 50º, the W phase energy is contained within 23 min of the origin time and in time to have a positive impact on tsunami warnings. The W phase arrives following the P-wave and before conventional surface waves, and can be regarded as a very low frequency, fast propagating group of waves. Following a number of investigations, the systematic use of the W phase has now been implemented at the National Earthquake Information Center (NEIC) of the U.S. Geological Survey (USGS) in Golden, Colorado, and it may constitute a significant improvement as a complement to the existing algorithms in use at the TWCs.
In practice, time domain deconvolutions are used to extract the W phase from the data from stations in the Global Seismic Network (GSN). The deconvolution seeks to flatten the velocity spectrum over the broad frequency range above (1-10m Hz) and integrate the result to get displacement. Unfortunately, this is an inherently noisy process, which has to deal with the 360 s (2.8m Hz) corner in the velocity response of the GSN-standard STS-1 seismometer (Figure G.2).
The mass in a seismometer, whether vertical or horizontal, is caused to move by an applied force, which may be associated with the motion of the seismometer frame, or changes in the force of gravity. The linear relationship between force and acceleration causes the mass to move with the applied acceleration. The force and acceleration, of course, disappear following an earthquake so the static acceleration is zero. Most seismometer responses, including the GSN STS-1, are shaped by a judicious choice of poles and zeroes in the feedback electronics to be flat to velocity over some frequency range.
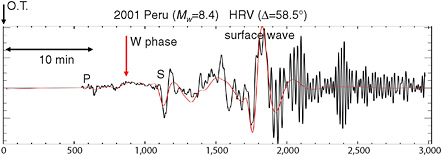
FIGURE G.1 Phase from the 2001 Peruvian earthquake (Mw = 8.4) recorded at Harvard University Seismic Station (HRV), and the synthetic W phase computed by mode summation using the Global Centroid-Moment Tensor (GCMT) solution. SOURCE: Kanamori and Rivera, 2008; with permission from John Wiley and Sons.
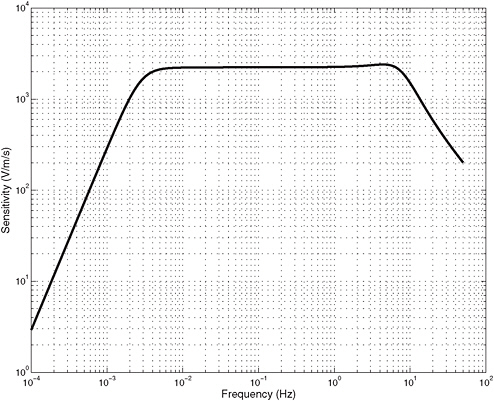
FIGURE G.2 The velocity response of the Streckheisen STS-1 seismometer including the feedback poles and zeroes used to shape the spectrum as discussed in the text. SOURCE: Derived from a standard model of the STS-1 velocity response; with permission from Pete Davis, IRIS/IDA Project.
The response of the GSN standard seismometer has been shaped to be nominally flat ato ground velocity between about 2.8 mHz and 5 Hz. For frequencies below 2.8 mHz, the seismometer’s output has been shaped so that at zero frequency its output is zero. In the W phase band (1-10 MHz) the response is critically dependent on the exact parameters of the seismometer’s feedback circuit.
In a very real sense, the GSN standard seismometer was not designed to support a simple deconvolution of velocity to displacement. Furthermore, many of the STS-1s in the GSN are now more than two decades old and, because the STS-1 is no longer manufactured, spares are not available. More details can be found at http://www.iris.edu/hq/gsn/quality, and a report “The IRIS/GSN Data Quality Initiative: Assessment of and proposed metrics for the GSN dataset” is in draft form. The USGS and the National Science Foundation (NSF) must seriously
consider the renovation of the GSN in future years including the requirements for W phase deconvolution.
A new seismometer has been developed and tested, which senses mass position through interferometry using fiber optics for light transmission. Unlike the STS-1 above, a force balance feedback is not used to reduce mass movement to maintain linearity in the displacement sensor. The resultant dynamic range is much greater than a conventional seismometer and is achieved by counting interference rings with a Mickelson interferometer. The output can be shaped computationally as needed and could be used to provide data with high fidelity at low frequencies for measuring the W phase.8 The optical seismometer has a response that is flat to ground acceleration between DC and about 1 Hz. There is, thus, no need to deconvolve the instrument response for W phase band measurements. Another of the benefits of the optical approach is that with good response at tidal frequencies, absolute calibration against earth tides on a continuous basis is straightforward. The optical seismometer remains under development for horizontal component testing and reducing noise levels at low frequencies—a borehole version is being tested.
To increase the longevity of the STS-1 seismometer, replacement feedback circuitry has been developed to replace the aging electronics (http://www.metrozet.com/). The corner frequency of the STS-1 remains at 1/360 Hz for the new electronics.
PTWC staff indicated that they are in the process of implementing a W phase algorithm, but a careful vetting of the algorithm before it can be reliably applied will be required.
Recommendation: Before implementing the W phase algorithm in TWC operations, the NOAA Tsunami Program should validate the W algorithm to both a sufficient dataset of synthetic seismograms and to waveforms from past great earthquakes, paying particular attention to its performance in “tsunami earthquakes” and to the assessment of a lower-magnitude bound for its domain of applicability.
REFERENCES
1. Richter, C.F. 1935. An instrumental earthquake-magnitude scale. Bulletin of the Seismological Society of America 25(1):1-32.
2. Kanamori, H. 1977. The energy release in great earthquakes. Journal of Geophysical Research 82(20):2981-2987.
3. Hanks, T.C. and H. Kanamori. 1979. A moment magnitude scale. Journal of Geophysical Research 84(B5):2348-2350.
4. Tsuboi, S., K. Abe, K. Takano, and Y. Yamanaka. 1995. Rapid determination of Mwp from broadband P waveforms. Bulletin of the Seismology Society of America 85(2):606-613.
5. Ishii, M., P.M. Shearer, H. Houston, and J.E. Vidale. 2006. Teleseismic P wave imaging of the 26 December 2004 Sumatra-Andaman and 28 March 2005 Sumatra earthquake ruptures using the Hi-net array. Journal Geophysical Research 112:B11307.
6. Whitmore, P.M., T.J. Sokolowski, S. Tsuboi, and B. Hirshorn. 2002. Magnitude-dependent correction for Mwp. Science of Tsunami Hazards 20(4):187-192.
7. Kanamori, H. and L. Rivera. 2008. Source inversion of W phase: Speeding up seismic tsunami warning. Geophysical Journal International 175(1):222-238.
8. Zumberge, M., J. Berger, J. Otero, and E. Weilandt. 2010. An optical seismometer without force feedback. Bulletin of the Seismological Society of America 100(2):598-605.


