
Conductivity Measurements in the Wake of Submerged Bodies in Density-Stratified Media
T.Sarpkaya, T.Massidda (Naval Postgraduate School, USA)
ABSTRACT
The variations of the relative conductivity in the wake of self-propelled, single-screw, submarine-shaped bodies in a continuously (linearly) stratified fluid were measured. The internal Froude-number scaling (Fr=Uo/ND) was used between the model and the prototype to select the buoyancy (Brunt-Väisälä) frequency N (=[gΔρ/ρoH]1/2) with ρo as the mean density at mid-depth, the model diameter (D) and speed (Uo) for representative environmental conditions. The model Froude number ranged from about 50 to 200 and the Reynolds number (UoD/v), from about 3×10⁴ to 6×10⁴. The boundary layer along the body was tripped to be turbulent. Furthermore, the size of the propeller was scaled with respect to the size of the wake and not the size of the body, by scaling wake diameter on the basis of Reynolds number, in a manner to that described by Schetz and Jakubowski [1]. Nevertheless, the scale effects (due to widely different model and prototype Reynolds numbers) cannot be assessed and have been left to prototype tests and some scientific speculation. The wake collapse (at a distance of about 400 diameters downstream) gave rise to large conductivity changes and to many modes of short internal waves of mean length D. The upstream conductivity field anticipated the arrival of the body (the upstream effect or blocking), for only impulsive starts and stops, to and from moderate speeds.
INTRODUCTION
Density stratification occurs naturally in many fluids, particularly in the ocean environment. The stratification can be due to thermal effects or results from salt or other impurities in the fluid. The study of the effects of various types of stratifications is important because even a mild stratification can radically alter the dynamic behavior of the interaction between the fluid and a body passing through it. In an homogeneous fluid, all portions of the wake are subjected to the same gravitational forces. This is not true for the wake of a body in a density stratified fluid because the turbulent mixing causes a disruption in the equilibrium density configuration resulting in gravity induced pressure gradients. These gradients generate secondary motions in the fluid that are not present in a homogeneous wake. The changes that occur in the flow due to these secondary motions (physical as well as turbulent collapse in the wake, internal waves) are important to the understanding of the interaction between a submerged body and its environment.
Examples of hydrodynamic phenomena, most likely to be encountered in various parts of a submerged body, include flow about the bow planes; three-dimensional flow at the body/bow-plane junction; three-dimensional, unsteady and severely-separated flow in the vicinity of torpedo-tube-ports; interaction of flow with devices and unconventional aft-body shapes (applied in recent times to bodies to improve the overall efficiency of the propulsion); interference of tip and junction vortices with the existing boundary layers and with the propulsor, and numerous other fluid-structure interactions. These phenomena give rise to complex wake structures, even for a relatively simple linear body motion in an homogeneous medium. The unsteady motions such as impulsive starts and stops, changes in course or depth give rise to additional wake widening in both the homogeneous and stratified media.
Hydrodynamic models, utilizing recently developed numerical techniques, attempt to predict the behavior of unsteady flow fields in the wakes of submerged bodies. However, the results are highly dependent on the turbulence model used and on the previous measurements for overall model verification.
Unfortunately, there are not any detailed measurements of the flow field resulting from the motion of a submarine-like body in a stratified medium. Most of the existing and relatively meager experiments do not deal with wake conductivity measurements at Froude numbers of practical significance. Also, the causes of the wake turbulence are seldom similar.
It is a well-known fact that electric currents generated in a fluid contribute to the total electromagnetic field, but in the absence of fluid motion these modifications of the applied field remain at a steady state. If a hydrodynamic disturbance, such as a wake in a stratified medium, sets part or all of the conducting fluid into motion, an additional electric field is generated in the fluid which is moving across the geomagnetic field. The change in current density then produces a magnetic anomaly which may be observable and thus important for stealthing purposes.
Wakes caused by bodies traveling in homogeneous fluids have been subjected to a large number of studies. A summary for the axisymmetric or circular wake is presented in Schlichting [2]. In this case, the wake width in a homogenous fluid increases as x1/3 vice x1/2 for the two-dimensional case. This relationship can be used for the initial wake growth in a stratified fluid because the effect of the turbulent mixing dominates the wake in that region. As a result, the wake expands in all directions in the same manner as the wake in a homogenous fluid. As the distance behind the body increases, the gravitational effects on the displaced fluid become more dominant. This results in a vertical collapse and a horizontal growth in the wake region. The horizontal spreading causes the vertical collapse to occur at a greater rate relative to the two-dimensional case. This is the source of the major difference between the two- and three-dimensional wakes.
The vertical collapse and the subsequent horizontal spreading also cause a horizontal displacement of the fluid surrounding the mixed region. This fluid then converges above and below the level at which the spreading is taking place resulting in the generation of random internal gravity waves in the bulk fluid. These waves then continue to travel away from the body at the level where the mixed fluid finds density equilibrium with the surrounding fluid. Most of these effects have been documented thirty years ago by Stockhausen, at al. [3] for a circular disk mounted on a self propelled body. Surveys on stratified flows may be found in the papers by Torobin and Gauvin [4], Lin and Pao [5], and Fernando [6]. Laboratory measurements of the evolution of wakes behind a sphere and a right circular cylinder, moving in a linearly stratified fluid at relatively low Froude and Reynolds numbers, were carried out, among others, by Lin et al. [7] and Xu et al. [8]. In both cases, the wake formation was primarily due to the shedding of vortices from the separation points.
In the present investigation, the conductivity measurements were made in the wake of self-propelled bodies (with momentumless wakes) through the use of numerous, temperature-compensated, high accuracy, microscale, conductivity probes [9]. Under normal conditions, i.e., for a submarine-like body in steady rectilinear motion, the characteristics of the wake are dictated primarily by the propeller and, to a lesser extend, by the necklace and sail-plane vortices. However, in transient motions (body undergoing time-dependent maneuvers), nonlinear waves, the unsteady three-dimensional cross-flow separations and body vortices play significant roles. Also, it must be emphasized that there are fundamental differences in the wakes of towed or dragged bodies and the self-propelled bodies. The wake of a towed body represents typical elementary shear flow profiles, where the velocity deficit spreads outward and decreases on the centerline as the flow proceeds downstream. The wake of a momentumless body exhibits a velocity-defect region near the axis and a velocity-excess region in the neighborhood of r/Ro=0.8, before leveling off beyond r/Ro=1.2 (here r is the radial distance and Ro=D/2, the maximum radius of models).
MODELS, FACILITIES, AND TECHNIQUES
Scaling of the Model
The parameters used in the current study were taken from the design specifications for a typical attack submarine. They provide an accurate representation of the conditions that would be encountered under normal operating conditions. Of special importance is the relative conductivity which we define here as the ratio of the time change in conductivity at a given point to that which existed prior to the motion of the body at the same point, i.e., RC(x,y,z)=(ΔC/C)xyz. The effect of the conductivity perturbations on the distortion of the prevailing magnetic field is of special importance and directly related to the ultimate purpose of the investigation.
A standard dimensional analysis shows that the relative conductivity depends on the internal Froude number Fr=Uo/ND (or its inverse ND/Uo, known as the stratification parameter), the Reynolds number Re =UoD/v, and Uot/D or Nt (here N is measured in rad/s, not in Hz). The foregoing is predicated on the assumptions that (i) the Schmidt number (v/ κ) is not important since the timescales for the salt diffusion are considerably larger than those for the occurrence of fluid-dynamical events of interest, (ii) the geometrical
confinement effects are negligible, i.e., the relative width W/D, length L/D, and depth H/D of the test tank are sufficiently large, (iii) the Boussinesq number (UoN/g or Uo2/gD) is sufficiently small (here in the order of 10–3, amply justifying the Boussinesq approximation for deeply-submerged submarine wakes), and (iv) the turbulence parameter (εD)1/3/Uo, with ε as the dissipation rate of turbulent kinetic energy, is negligible since the flow environment prior to the experiments was kept essentially free from disturbances (whenever a particular fill was used twice, it was done so only after a sufficiently long rest period, about 2–3 hours). Additional discussion of the various governing parameters for similar situations are discussed in Sarpkaya [10] and Sarpkaya and Daly [11].
The internal Froude-number (Fr=Uo/ND) was used to establish the model/prototype relationship. This resulted in model speeds from 0.3 m/s to 1.5 m/s and model stratifications from 0.05 to 0.20 rad/s. The model speed is intended to cover the prototype speed range from 1/3 bell to a full bell. The range provided by the stratification system represents from a weak stratification (N=0.005 rad/s) to a strong stratification (N=0.02 rad/s) that would be expected under normal operational conditions. The stratification profile can be changed at will, however, the current runs were limited to linear profiles in order to gain a further understanding of the effects of the most dominant parameters in this highly complex, multi-parameter, phenomenon. No attempt has been made to assess the scale effects due to the mismatch of the model and prototype Reynolds numbers. This is left to judiciously conducted prototype tests.
Fig. 1 Schematic of the test model
Three similar models were used in the experiments (see Fig.1). The selection of the model size was driven partly by the model-to-prototype scaling factor and partly by the width of the tank. The basic model was constructed from plexiglas tubing with removable sections to allow for future modifications. It had a base length of 0.45 m and a main body diameter of 63 mm. It provided a large enough interior space to allow for the installation of a four-bladed propeller shaft, propeller motor, and batteries and was small enough to minimize the potential interference with tank walls. The second model was identical to the first except that it had a sail and two adjustable sail planes.
The motion of the self-propelled model was guided by two extremely thin and taut wires going through the body. Both models were made slightly buoyant to compensate for the small sag of the cables and capable of speeds up to 1 m/s. The propeller system consisted of a variable speed motor and a set of Ni-Cd batteries, all embedded inside the model. The propulsion system was controlled remotely.
Test Tank
It is 15 m long, 1.2 m wide, and 1.8 m deep and contained linearly stratified salt water to a depth of 1.65 m. Its interior is coated with marine epoxy to minimize corrosion. The entire front wall is fitted with one inch thick Plexiglas windows to allow for flow visualization. The fill system and the inlet piping are located at the bottom of the tank under a turbulence management system. The latter consists of one inch thick polyurethane foam sandwiched between two perforated aluminum plates.
Stratification System
It had two constant head tanks (one for fresh water, one for brine) and a large reservoir. The brine was prepared in the reservoir, four to five days prior to the day of experiment, before being pumped into the brine head tank. The purpose of this was to assure that the fluid was suitably degassed. The two head tanks supplied a three way mixing valve, driven by a direct current motor. The strength of the stratification is determined by the amount of salt premixed in the reservoir. Effluent from the two head tanks is gravity fed to the inlet of the three way mixing valve. It is this mixing action that ensures a smooth stratification profile in the tank. The mixing valve is constructed from two one-inch PVC ball valves that are mounted 90 degrees out of phase. The handles of these valves are attached to a motorized drive system that consists of a set of four reduction gears driven by a 3/4 Hp direct current motor.
The valves are cycled starting with full-open fresh water valve and fully-shut brine valve, and ending with full-open brine valve and fully-shut fresh water valve. This provided a linear stratification profile as the tank was filled from the bottom. The inlet to the tank consisted of a set of 50-mm diameter PVC pipes, perforated along their entire length with 1.5-mm diameter holes. This relatively simple but novel system provided a consistent linear stratification in about five hours. The density gradients were verified twice. First, during the fill process using a profile conductivity probe, mounted near the bottom of the
tank. The output of the probe was continuously recorded for viewing and verification during the entire filling period. Second, the density profile was measured before each run through the use of two vertically traversing conductivity probes.
Conductivity Measurements
They were made through the use of numerous, temperature-compensated, high accuracy, microscale, conductivity probes [9], manufactured by the Precision Measurement Engineering. They were calibrated before and after each run. They had an output voltage of ±5 volts, a linear conductivity range of 5E-3 to 800E-3 mSiemens/cm, a time response of –3db at 800 Hz, a spatial response of –3db at 4 cycle/cm, and a noise level less than 1 mV rms in the range of 10 Hz to 1 kHz. In addition to the initial calibration, each probe is checked during the tank fill and prior to the data acquisition. This is critical as each tank fill takes about five hours. In addition to the conductivity data, the speed of the model is monitored with a Linear-Variable-Velocity transducer and the output signal is fed to the data acquisition system.
The probes were mounted along the tank centerline at regular intervals (x/D=20) and along the width of the tank at strategic locations in a horizontal plane that is located at r/Ro=1.1. The vertical separation distance between the top of the model and the tip of the probe was 0.10Ro. Output from these probes was sent to a preamplifier, a low gain DC amplifier, and, finally, to a computer. The input signals are managed by a Data Acquisition Control Unit with a 40 channel digital multiplexer and a high speed voltmeter. The program allowed data rates from 5 to 200 Hz. The data rates are based on the observed frequency content of the early test runs and the duration of an experiment is based on the rate of decay observed in the mean conductivity change long after the passage of the model. Finally, the conductivity data and the speed of the model (obtained from the velocity transducer) are provided to the computer for further analysis.
Test Procedures
Each experiment required about three days to accomplish and was repeated at different weeks. This was due to setup operations, long tank fill times, and clean up procedures to minimize corrosion. After the fill was completed, the tank was allowed to settle for at least an hour to ensure that the stratification profile was smooth and linear. This was verified prior to each run by recording the output of a slowly submerging conductivity probe. Experience has shown that at least two tests could be done with the same tank fill without significant deviations from the initial stratification profile if sufficient time is allowed between the two runs (2–3 hours).
In contrast to its preparation, the actual test was indeed rather short. First, the computer system was initialized for the run to be made. This required input of the probes to be recorded, data rate, and data run duration. The model was either (i) started impulsively to a given speed and stopped smoothly at the end of the run, or (ii) accelerated smoothly to a desired speed over a reasonable distance and allowed to run along the tank, until it was stopped smoothly by decelerating it first, or (iii) started smoothly to a constant velocity and then stopped suddenly, or (iv) subjected to a series of impulsive starts and stops along the tank. Impulsive starts and stops were accomplished smoothly with the help of a spring activated launcher and an arresting cable. For the impulsive start, the Froude number was defined as Fr=Uo/ND=ΔU/ND. For the case of smooth acceleration, Fr is based on the steady velocity Uo. The effect of the variations of D(dU/dt)o/Uo2 and (D2/v)(1/Uo)(dU/dt)o (or UoD/v) has not been investigated. In any case, the maximum initial acceleration (dU/dt)o in the experiments did not exceed 1.5 ft/s2.
PRESENTATION OF RESULTS
Impulsive Start and Wake Collapse
Examples of the ensemble-averaged relative conductivity records for the central probes, for an impulsively-started clean body (no sails), are presented in Figs.2 and 3 as a function of the normalized time Nt (the upper limit depends on the particular run and may be smaller or greater than 30)..
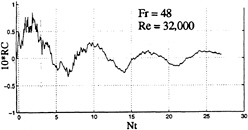
Fig. 2 Relative conductivity versus Nt for an impulsively-started clean model (N=0.15 rad/s, U =0.46 m/s)
Normally, the time is measured from the start of the experiment, but during the post-processing of the data the clock times for each probe are reset to perform ensemble averaging for several reasons. First, it removes random anomalies, if any, from the record of
any one probe. Second, it enables one to compare the ensemble-averaged data with those of each of the contributing probes, and it increases the credibility of conclusions based on a broader spectrum of the data.
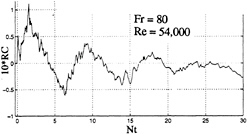
Fig. 3 Relative conductivity versus Nt for an impulsively-started clean model (N=0.15 rad/s, U =0.76 m/s)
In Figs.2 and 3, and in all other plots belonging to the same family, the relative conductivity (henceforth referred to as RC) is multiplied by 10 in order to deal with relative conductivity values near unity. Thus, a value of 1.0 on the vertical scale corresponds to a 10% change in conductivity. Figures 2 and 3 show that the overall character of the relative conductivity is like that of a damped harmonic wave. Noting that Nt=0 is slightly to the right of the coordinate origin and that Nt=0 corresponds to the instant at which the nose of the model arrives at the probe, it is clear that a probe anticipates the arrival of the body or “sees” it before it is actually seen (the first sharp rise in the figures). This phenomenon is referred to as the “upstream effect” and will be discussed in more detail later.
As the model continues to move, RC decreases at first (when the probe is over the axisymmetric cylindrical part of the body) and then increases again sharply when the probe enters the wake and reaches a maximum at about Nt=2 (ΔNt=1 corresponds to Δt=6.67s or to about 50 body diameters for this particular case). Immediately afterwards, the wake begins to collapse. The wake collapse is virtually complete at about Nt=7, i.e., after about 47s or about 340 body diameters. At later times (Nt>7), RC rises and falls at an ever decreasing amplitude due to internal waves generated by the wake collapse. In other words, the mixing of the fluid in the wake is never complete and the collapse as well as the recovery of the wake occurs with an ever decreasing overshoot in either direction towards the equilibrium. Thus, the events associated with the collapse follow the model at a certain speed. For the conditions of Figs. 2 and 3, the wave period, is about ΔNt=7 or T =47 s. To be sure, there are additional oscillations in the wake-conductivity due to smaller eddy motions and internal waves, but the wake collapse is the phenomenon most likely to give rise to measurable periodic waves and geomagnetic perturbations. It must also be emphasized that the intensity of the wake collapse depends on the Froude number and the configuration of the body. Large density gradients increase the stability of the density profiles and the collapse takes place much sooner. A streamlined body (as in the present case) is likely to generate a less severe wake collapse than the one undergoing maneuvers or sharp velocity changes, i.e., the bluffer the body and larger the density gradient, the faster the collapse. Inversely, the more streamlined the body and milder the density gradient, slower is the occurrence of the collapse, as in the foregoing example. The wake phenomena associated with unsteady maneuvers (turns, dives, and porpoising, etc.) were not part of the present investigation.
An equally important feature of Figs.2 and 3 is the magnitude of RC. At its peak, RC reaches values from about 8% to 12%, at a distance of about 100 body diameters (at t=13s). The subsequent two peaks occur at distances x/D=480 (Nt=10, t=67s), and x/D=815 (Nt=17, t=113 s), after the passage of the body. Figure 4 is an expanded version of the earlier times of Fig.2 for clarification of the various regions. Similar conductivity changes across the three-dimensional momentumless wake of a self-propelled body are seen in the isochlor maps of Stockhausen et al. [3].
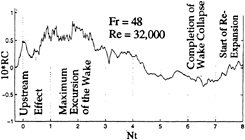
Fig. 4 An expanded version of the earlier times of Fig.2 (N=0.15 rad/s, U=0.76 m/s)
Figure 5 shows the output of three probes, situated in the lateral direction near the mid-length of the tank. The probe C is directly above the axis of the model at r/Ro=1.1 Probes B and A are, respectively, at 75 mm and 375 mm to the left of the axis of the 63 mm model (all three probes are at the same level). It is clear that the signals B and C are significantly larger than A, as expected. Figure 5 and many others like it have conclusively shown that the wall interference on the response of the central probe is indeed
negligible. The probes on the other side of the axis yielded nearly identical outputs except that the traces were somewhat smoother. This was due to the direction of the rotation of the propeller.
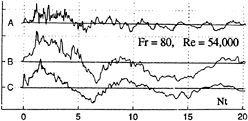
Fig. 5 Spanwise variation of RC (N=0.15 rad/s, U=0.76 m/s)
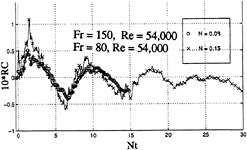
Fig. 6 Relative conductivity versus Nt for an impulsively-started clean model (o, N=0.08 rad/s; x, N=0.15 rad/s), U=0.76 m/s for both
The effect of halving N (from 0.15 to 0.08 rad/s) is shown in Fig. 6 for U=0.76 m/s. It seems that only the very early stages of the motion and the maximum value of RC are affected by the change in N. The remainder of the data, such as the period of oscillation and its decay, remain largely unaffected. Comparisons at other velocities yielded similar results.
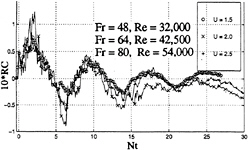
Fig. 7 RC versus Nt for various U (N=0.15 rad/s)
Figure 7 shows the effect of the variation of U from 0.46 m/s to 0.76 m/s for N=0.15, again for an impulsively-started clean body (no sails). Within the range of velocities encountered, the variation of RC is practically independent of the velocity. Only the amplitude of RC during the period of wake growth and collapse seems to be affected.
Non-Impulsive Start and Wake Collapse
Examples of the ensemble-averaged relative conductivity records for the central probes, for a clean body (no sails) smoothly-accelerated to a constant velocity, are presented in Figs.8 and 9 as a function of the normalized time Nt. They are similar to Figs. 2 and 3 with two exceptions: (i) the extrema of the output are slightly shifted to the right (see also Fig. 10), as would be expected; and (ii) the initial sharp rise in RC near Nt=0 is essentially absent. Figure 9 also shows that at higher speeds (nearly 1 m/s), the signal is somewhat noisier. Figure 11 shows a comparison of the RC values for two N values for U=0.6 m/s. As expected on the basis of earlier observations, the larger the N, the higher the output and sooner the collapse.
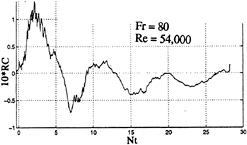
Fig. 8 RC versus Nt for N=0.15 rad/s and U=0.76 m/s (non-impulsive start of a clean model)
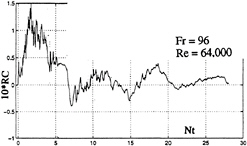
Fig. 9 RC versus Nt for N=0.15 rad/s and U=0.92 m/s (non-impulsive start of a clean model)
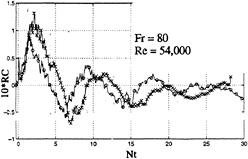
Fig. 10 Comparison of the impulsive (o) and non-impulsive (x) starts (N=0.15 Rad/s, U=0.76 m/s)
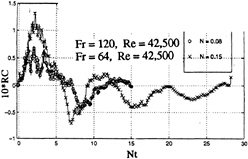
Fig. 11 Comparison of the RC values for non-impulsive starts for two N values (U=0.6 m/s)
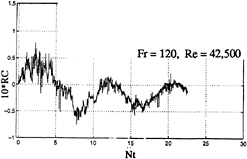
Fig. 12 RC for a non-impulsively-started model with sail and sail planes (N=0.08 rad/s, U=0.6 m/s)
Figure 12 shows a sample output of a probe for a non-impulsively-started model with sail and sail planes. Aside from its noisy character, the signal cannot be directly compared with the non-impulsively-started clean-body case because the probe had to be placed at a suitable point (r/R o=1.1, θ=60 deg. to avoid the sail planes. Nevertheless, the collapse and recovery times and the fundamental period of oscillations are essentially the same as the smooth-body case. Figure 13 shows the output of three different runs for N=0.08. It seems that the increase of velocity from 0.6 m/s to 0.92 m/s does not materially affect either the form or the magnitude of the relative conductivity. The noisy nature of the signals is obviously due to the trailing and necklace vortices emanating from the sail planes and the sail/body juncture.
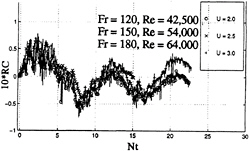
Fig. 13 RC values for a non-impulsively-started model with sail and sail planes at three different velocities (N=0.08 rad/s)
Upstream Effect
The “blocking” phenomenon or the “upstream effect” is quite well known for two-dimensional bodies and has been studied extensively (see, e.g., Lin and Pao [5]). Whenever the buoyant force is not sufficient to overcome the inertial force, the fluid particles are trapped in the upstream side of the body and this gives rise to an upstream wake. For an axisymmetric body, however, the question is far more complex since the fluid is free to move around the body in all directions rather than being forced to move only from the top and bottom, as in the case of a cylinder moving parallel to its axis between two walls. Nevertheless, the question is not whether there are upstream effects for axisymmetric bodies, but rather how does some measure of the magnitude of this effect vary with distance upstream from the body and whether this magnitude is of potential technological importance. The fact that there is an upstream effect for all bodies in all fluids, stratified or unstratified, is clear from the fact that a body generated by a suitable combination of hydrodynamic singularities (sources, sinks, doublets) and uniform flow gives rise to upstream effects, albeit small, at relatively short distances. Thus, a more appropriate question is whether there are stratification-excited mechanisms (solitons, non-linear waves) which lead to significantly larger signals at significantly larger distances, i.e., to larger signal-amplitude to
upstream-distance ratio above the threshold noise level. One may consider linear internal waves as a possible cause of upstream effect but quickly realize that they travel at speeds slower than the prototype. According to Miles [12], internal waves generated by a horizontally moving source appear only in the lee of the source. However, unsteady motions, including impulsive starts and stops, can give rise to unsteady internal waves which propagate upstream of the generating body. Graham [13] investigated theoretically transient internal waves produced by a moving body in a stratified fluid and presented examples showing how well or how poorly the quasi-steady state is defined relative to the magnitude of fluctuations. Graham did not, however, consider the effect of a collapsing wake.
Rehm and Radt [14] calculated the internal-wave system excited by a translating and periodically heaving body in a constant Brunt-Väisälä frequency fluid. They have shown that the surfaces of constant phase change character as the ratio ω/N varies through unity. Along preferred directions, the amplitude of the internal waves decay inversely with distance to the 5/6 power, whereas, for uniform translation, the amplitude of the internal waves falls off inversely with distance from the body. The conditions corresponding to ω/N =1 are not of prototypical importance for the stratification range (N=0.005 rad/s to N=0.02 rad/s) in the ocean environment, even if the stratification was horizontally coherent. However, this does not imply that other types of unsteady motions such as practical maneuvers, including sudden starts and stops, are not capable of giving rise to measurable conductivity changes far upstream of a submarine-like body.
It is against this background and much unsubstantiated speculation that a series of sudden-start-stop experiments were undertaken with the clear understanding that the demonstration of an upstream effect under laboratory conditions does not necessarily imply that it will be equally observable in the ocean environment. It is quite probable that the highest speed of nonlinear internal waves or solitons, though exceeding the model speed, may fall far short of the prototype speeds even under ideal conditions.
Figure 14 shows the initial instants of the variation of conductivity at a sample probe due to a slowly- or non-impulsively-started model (N=0.15 rad/s, U=0.46 m/s). Noting that the time for each probe is measured from the time the stagnation point of the model arrives at the particular probe, it is clear that there is no notable upstream effect. Figure 15 shows similar data for three different velocities. Again, the presence of the model is felt only when the model arrives at the probe, not before.
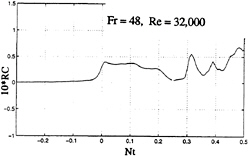
Fig. 14 RC versus Nt during the initial stages of a non-impulsively-started motion (N=0.15 rad/s, U=0.46 m/s)
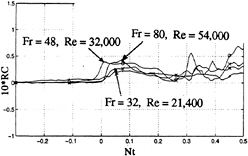
Fig. 15 Same as Fig.14 for three different velocities
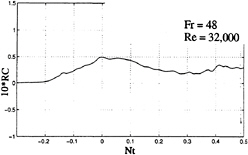
Fig. 16 RC versus Nt during the initial stages of an impulsively-started motion (N=0.15 rad/s, U=0.46 m/s)
Figure 16, obtained with an impulsively-started model (N=0.15 rad/s, U=0.46 m/s) shows that the probe anticipates the arrival of the model by about ΔNt=0.2 (or by about 1.35 s or 1.35 body lengths). However, the larger the speed the shorter is the time of anticipation. For example, for U=0.76
m/s, ΔNt from the start of the model to its arrival at the probe was reduced to 0.05. For U=0.90 m/s, there was no noticeable upstream effect. Apparently, the nonlinear waves generated by the model are traveling at speeds larger than 0.46 m/s but not much larger than about 0.90 m/s. Figure 17 shows a comparison of the impulsively and non-impulsively started runs. It must be emphasized that experiments with impulsive starts have been repeated a number of times at different initial accelerations with different mechanisms and with or without a small uniform current in order to ascertain that the observed upstream effect was not due to some anomalous phenomenon. The addition of sail planes did not materially affect the results. The individual probe data differed very little from the ensemble averaged data and the upstream effect decreased at higher speeds. These are clear indications of the fact that the observed upstream effect is a genuine hydrodynamic phenomenon, at least, in model tests. As noted earlier, however, its prototypical significance remains unclear and should be the subject of a number of judiciously conducted large scale experiments.
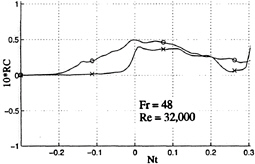
Fig. 17 Comparison of the upstream effects of impulsively (o) and non-impulsively (x) started models (N=0.15 rad/s, U=0.46 m/s)
CONCLUSIONS
Variations of the relative conductivity in the wake of self-propelled, single-screw, submarine-shaped bodies in a linearly stratified fluid were measured. The model Froude number ranged from about 50 to 200 and the Reynolds number, from about 3×10⁴ to 6×10⁴.
The results have shown that the wake collapse (at a distance of about 400 diameters downstream) gives rise to large conductivity changes and to many modes of short internal waves [15]. The relative conductivity is sufficiently large to cause measurable changes in the geomagnetic field. The conductivity field ahead of the body anticipates the arrival of the body for relatively short distances and then only for impulsively-started or impulsively-stopped motions at relatively moderate speeds.
As in the case of many other studies in stratified fluids, the range of the governing parameters is dictated not by technological needs but by what is achievable under the laboratory conditions. Even though the Froude numbers encountered in this investigation are the largest we have ever seen, and certainly closest to the prototypical conditions, the scale effects (due to widely different model and prototype Reynolds numbers) cannot be assessed and must be evaluated through prototype tests. As noted earlier, trip wires were used to render the boundary layer turbulent and, furthermore, the size of the propeller was scaled with respect to the size of the wake, and not the size of the body, by scaling wake diameter on the basis of Reynolds number. The validity of such common practices in laboratory experiments needs to be assessed through sea tests, particularly when the Reynolds numbers of the model and prototype differ by several orders of magnitude.
ACKNOWLEDGMENTS
Support for this investigation was provided by Naval Research Program Office. The authors would like to thank Mr. Thomas H.McCord and Mr. Charles E.Crow for their assistance with the construction and smooth operation of the test facilities.
REFERENCES
1. Schetz, J.A., and Jakubowski, A.K., “Experimental Studies of the Turbulent Wake behind Self-Propelled Slender Bodies,” American Institute of Aeronautics and Astronautics Journal, Vol. 13, 1975, pp. 1568–1575.
2. Schlichting, H., Boundary-Layer Theory, 7th ed., McGraw-Hill, New York, 1987, pp. 729–755.
3. Stockhausen, P.J., Clark, C.B., and Kennedy, J.F., “Three-Dimensional Momentumless Wakes in Density Stratified Fluids, ” Massachusetts Institute of Technology Hydrodynamics Laboratory Report Number 93, 1966, Massachusetts Institute of Technology, Cambridge, Mass.
4. Torobin, L.B., and Gauvin, W.H., “Fundamental Aspects of Solids-Gas Flow. Part 1: Introductory Concepts and Idealized Sphere Motion in
Viscous Regime,” Canadian Journal of Chemical Engineering, Vol. 37, 1959, pp. 224–236.
5. Lin, J.T., and Pau, Y.H., “Wakes in Stratified Fluids,” Annual Review of Fluid Mechanics, Vol. 11, 1979, pp. 317–338.
6. Fernando, J.S.H., “Turbulent Mixing in Stratified Fluids,” Annual Reviews of Fluid Mechanics, Vol. 23, 1991, pp. 455–491.
7. Lin, Q., Lindberg, W.R., Boyer, D.L., and Fernando, H.J.S., “Stratified Flow Past a Sphere,” Journal of Fluid Mechanics, Vol. 240, 1992, pp. 315–354.
8. Xu, Y., Fernando, H.J.S., and Boyer, D.L., “Turbulent Wakes of Stratified Flow Past a Cylinder,” Physics of Fluids, Vol. 7(9), 1995, pp. 2243–2255.
9. Head, M.J., “The Use of Miniature Four-Electrode Conductivity Probes for High Resolution Measurement of Turbulent Density or Temperature Variations in Salt-Stratified Water Flows,” Ph. D. Thesis, University of California, San Diego, CA, 1983.
10. Sarpkaya, T., “Trailing Vortices in Homogeneous and Density Stratified Media,” Journal of Fluid Mechanics, Vol. 136, 1983, pp. 85–109.
11. Sarpkaya, T., and Daly, J.J., “Effect of Ambient Turbulence on Trailing Vortices,” Journal of Aircraft , Vol. 24, No. 6, 1987, pp. 399–404.
12. Miles, J.W., “Internal Waves Generated by a Horizontally Moving Source,” Geophysical Fluid Dynamics, Vol. 2, 1971, pp. 63–87.
13. Graham, E.W., “Transient Internal Waves Produced by a Moving Body in a Tank of Density-Stratified Fluid,” Journal of Fluid Mechanics, Vol. 61, 1973, pp. 465–480.
14. Rehm, R.G., and Radt, H.S., “Internal Waves Generated by a Translating Oscillating Body,” Journal of Fluid Mechanics, Vol. 68, 1975, pp. 235– 258.
15. Gilreath, H.E., and Brandt, A., “Experiments on the Generation of Internal Waves in a Stratified Fluid, ” American Institute of Aeronautics and Astronautics Journal, Vol. 23, No. 5, 1985, pp. 693–700.
DISCUSSION
H.J.S.Fernando
Arizona State University, USA
This is an interesting study dealing with conductivity fluctuations in a stratified media generated by traveling disturbances. The aim is to study whether internal waves and turbulence generated by underwater vehicles, such as submarines, can be detected by using Magnetic Anomaly Detection (MAD) devices that sense changes in background magnetic induction. Using models of attack submarines, both with and without sail planes, it is shown that the variation of average RC can be as high as 12%. Also, it is argued that the upstream influence can be pronounced for impulsively started and stopped bodies at moderate speeds, but the upstream influence is notably absent for non-impulsively started bodies indicating the possible role played by “unsteady” external parameters such as ![]() in addition to conventionally used RE and Fr.
in addition to conventionally used RE and Fr.
Inspection of conductivity records presented indicate that large amplitude variations of RC can be attributed to the isopycnal displacements around the body, rather than to wake signatures as proposed. In the far field, however, the conductivity variations are due to the wake, but the signal at this stage is in a decaying state and is weak. Above a certain height of the body, known as the level of the dividing streamline, the flow passes over rather than flowing around the body, and, at large Fr, the dividing streamline height becomes independent of FR (Lin et al. [7]). If the conductivity changes are due to a kindred isopycnal displacements, it is possible to expect the maximum conductivity change to be Δ C ∝ N2D, which is corroborated by the observation that RC is independent of U (Figure 7). This scaling may provide a better normalization for RC, and the authors may want to check whether RC/N2D performs better in their plots. The above estimates, however, were made by assuming that the body-generated disturbances are dominant over the propeller-generated disturbances, and scrutiny of this assumption is also in order.
Another question is whether the observed increase of conductivity before the arrival of the body is really due to the upstream influence or due to the finite amplitude perturbations of isopycnals in a limited area around the body. In a classical sense, the upstream influence is defined as the initiation of upstream motions due to the pushing forward of a slug of fluid ahead of the body at the neutrally buoyant level of the slug. At slow obstacle speeds and large stratifications, the fluid particles do not have enough kinetic energy to rise and flow over/under the body, and as a result a column of fluid upstream will be pushed ahead. This influence is markedly weak for three-dimensional bodies, as the fluid particles can shunt around (rather than over) the body. Because the upstream influence is pronounced only at small FR and only for two-dimensional bodies, it is appropriate to re-evaluate the authors' claim of upstream influence in large Fr experiments. Another important aspect that warrants attention is the generation of upstream-propagating shear waves (or zero-frequency internal waves) and their reflection from the end walls. These waves can also influence conductivity variations (Manins[16]).
It seems appropriate to define the term “collapse of the wake.” The wakes can have two types of collapse, physical and turbulent. In addition, the wakes can oscillate thus leading to sharp conductivity changes behind the body. The authors state that the wakes collapse at Nt ~ 7, which is coincident with the lowest point of RC. This minimum, however, can also be interpreted as a consequence of the dipping of isopycnals behind the body.
Most of the plots presented by the authors are ensemble averaged over several runs, concurrent with the standard practice of analyzing random signals. For practical pur-poses, however, it is also instructive to devise methods to recognize signals using single realizations. After all, in submarine detection, one has to work with a single record rather than an ensemble average! To this end, it would be worthwhile to define the variable (ΔC)max/n2D, where (ΔC)max is the maximum conductivity of a given realization, and investigate how it varies among identical runs and how its r.m.s. value varies with external governing parameters.
ADDITIONAL REFERENCE
16. Manins, P.C. “Intrusion into a Stratified Fluid,” J. Fluid Mech., Vol. 74, 1976, pp. 547–560.
AUTHORS' REPLY
The discussor has attempted to interpret our results in light of his experiments with right circular cylinders and spheres dragged in a linearly-stratified fluid at Reynolds and Froude numbers of little or no practical significance. There are funda-mental differences in the wakes of towed and self-propelled bodies as clearly noted in the paper. The topology of the wakes of towed bodies of special geometries used by the discussor does not generalize to slender self-propelled body shapes. Our experiments with slender self-propelled bodies at realistic Froude numbers are the first ever reported in the literature.
As far as the effect of isopycnal displacements are concerned, the model completes its passage under a probe in about 0.13 seconds or Nt= 0.02 for N=0.15 during which the largest isopycnal displacements occur. This, however, is a very small fraction of the time that the probes respond to the changes in the wake created by the body and the propeller. Our experiments have confirmed from plunging conductivity probes at Nt=0.1 (x/D=5), Nt= 0.2 (x/D=10), Nt=0.4 (x/D=20), and Nt=1 (x/D=50) through the use of Thorpe reordering that the wake was well mixed, i.e., the propeller has provided excellent molelcular mixing. The fact that the passage of a slender self-propelled body causes large conductivity changes in an otherwise undisturbed region of a stratified medium and that these changes have a decaying harmonic character is all that is needed for the understanding and interpretation of the corresponding geomagnetic anomalies. This has not been demonstrated before. As to the normalization of the relative conductivity RC by N2D, as suggested by the discussor, it is easy to see that RC/N2D does not provide a better correlation because for a constant D (as in our experiments). RC does not vary with N2 as evidenced from Fig.6 for two different N values. If the discussor's suggestion were to be adopted, the two conductivity traces in Fig.6 would have yielded amplitudes differing by a magnitude of 3.5, i.e., according to Fig.6, RC is independent of N for a given Re. Contrary to the discussor 's assumption, Fig.7 shows that RC varies with U (even in the small range of U values) with U for a given N. These two facts show that the conductivity changes are not primarily due to “kindred isopycnal displacements ” and that the propeller-generated
disturbances are dominant (as in model as well as prototype scales) over the body-generated disturbances.
The definition of the upstream effect does not need repetition. It is a well-known fact that there are stratification-excited mechanisms (solitons, nonlinear waves), which lead to significantly larger signal-amplitude to up-stream-distance ratios above the threshold noise level. The end-wall reflections have nothing to do with the issue because the upstream effect under unsteady circumstances (impulsive starts, turns, dives, porpoising, etc.) manifests itself almost immediately after the passage of the bow and certainly long before the waves reach the end wall and return to the probe.
The discussor has incorrectly stated that the wakes collapse at Nt=7. What we have written is this, “As the model continues to move, RC decreases at first (when the probe is over the axisymmetric cylindrical part of the body) and then increases again sharply when the probe enters the wake and reaches a maximum at about Nt=2 (ΔNt=1 corresponds to Δt=6.67s or to about 50 body diameter for this particular case). ” Immediately afterwards, the wake begins to collapse. The wake collapse is virtually complete at about Nt=7, i.e., after about 47s or about 340 body diameters.”
As to the nature of the plots, the discussor did not read the paper carefully. They are not “ensemble averaged over several runs….” The plots are ensemble averages of the data obtained simultaneously during a single run with numerous probes positioned along the axis of the body. No two runs have ever been ensemble averaged. Our data have shown that the ensemble-average of n-number of probe signals resulting from a single run is indistinguishable from the individual probe data for that same run. As noted earlier (ΔC)max/N2D is not a meaningful parameter.
In summary, it appears that the discussor read the paper rather hastily. The topology of the wakes of towed bodies of such special geometries as right circular cylinders and spheres does not generalize to slender self-propelled bodies and to more general problems of the evolution of isolated turbulent patches in stratified fluids. Our work presents, for the first time, body geometries and measurements on both fundamental and applied levels. It is hoped that future studies in stratified flows will move toward high Re and F experiments with slender self-propelled bodies. After all, spheres and right circular cylinders do not make good submarines at any speed.
The comments of the discussor gave us the opportunity to expand on several topics of scientific and practical interest and are appreciated.


