
3
Famine, Mortality, and Migration: A Study of North Korean Migrants in China
W. Courtland Robinson, Myung Ken Lee, Kenneth Hill, and Gilbert Burnham
This is a famine in slow motion. People cope year after year and probably a lot drop off. But the totality is very hard to gauge.
—Official, UN World Food Program (November 1998).
INTRODUCTION
It would be a profound understatement to say that accurate, up-to-date information on the Democratic People's Republic of Korea (DPRK) is limited. The latest census, conducted in 1993, recorded a population of 21,213,378, of whom males numbered 10,329,699 and females 10,883,679 (United Nations Department of Economic and Social Affairs, 1998). The estimated midyear population for 1996 was 22,466,000, assuming an annual growth rate of 1.6 percent. The United Nations (UN) estimate of the crude birth rate for 1990-1995 was 21.8 per 1,000 and the estimated crude death rate (CDR) was 5.5 per 1,000; therefore, the crude rate of natural increase was 16.3. Infant mortality was estimated at 24.4 deaths of children under one year old per 1,000 live births. Eberstadt and Banister (1992), factoring in uncounted males in the military, estimated the 1996 midyear population of North Korea at 23,906,122 and the 1998 midyear population at 24,721,312.
Given the country's hardships in recent years, however, the question of how many people are living—or have died—in North Korea is shrouded in greater mystery than ever. The deterioration of the North Korean economy since 1990, a disastrous combination of flooding in 1995
and 1996, and drought in 1997 have brought on a severe food crisis in the reclusive, communist nation that has placed millions of people at risk of starvation. Infusions of international food aid since 1996 are believed to have helped stabilize the situation, at least in certain areas and among targeted populations, but the crisis does not seem to have passed. Efforts to gauge the effects of this crisis, however, have been hampered by the North Korean government's reluctance to permit randomized surveys of morbidity and mortality.
A nutritional assessment mission to the DPRK undertaken by the World Food Program (WFP) in August 1997 found a 16.5 percent prevalence of wasting (<-2 Z-scores weight-for-height) and a 38.2 percent prevalence of stunting (<-2 Z-scores height-for-age) in a nonrandom sample of 3,695 children under 7 years of age in 42 selected nurseries and kindergartens from 19 counties in 5 provinces. The WFP assessment noted that “a prevalence of wasting greater than 15 percent is considered a serious situation and suggests that mortality rates have already increased” (Katona-Apte and Mokdad, 1998). In September 1998, WFP collaborated with the United Nations Children's Fund (UNICEF) and the European Union to conduct a randomized survey of 1,762 children in 3,600 households in 30 North Korean counties. This survey found 15.6 percent of children aged 6 months to 7 years to be wasted, 62.3 percent stunted, and 60.6 percent moderately or severely underweight (European Union et al., 1998). The authors of the 1997 WFP study concluded that
The chronic and cumulative shortage of food, the shortages of basic medicine and fuel, the damage to the infrastructure from floods, and the difficult economic circumstances of the DPRK pose substantial challenges to improving the nutritional status of its children. On the other hand, the presence of the PDS [Public Distribution System], the evident order and discipline in DPRK society, the universal access to health care, the dedication of the care providers and the high literacy rate augur well for the likelihood of successful resolution of the crisis if adequate food, medication and training can be made available (Katona-Apte and Mokdad, 1998).
Other assessments were not so sanguine. Frustrated by the DPRK's unwillingness to permit random sample surveys or independent interviewing of the population, some organizations began to look to the Chinese border where North Koreans had been crossing in search of food. In July 1997, World Vision interviewed 33 individuals at the China/North Korea border (19 of whom were North Korean and 14 of whom were from either China or Russia) and concluded that mortality averaged 15 percent in the northern provinces. “This famine,” said the World Vision report, “may well be much more severe than any news reports have indicated ” (World Vision, 1997).
In June 1998, a private South Korean organization called the Korean
Buddhist Sharing Movement (KBSM) released a report on the North Korean food crisis based on interviews with North Korean migrants in China. Summarizing results from five phases of interviews conducted between September 1997 and May 1998, the KBSM study reported that “the [cumulative] mortality rate over the last 2 years and 9 months (August 1995-April 1998) has reached 27.0 percent...The mortality rate for 1996 was at 8.86 percent [88.6 per 1,000] and for 1997, 19.60 percent [196 per 1,000].” The survey also found that the birth rate to sample families was 0.93 percent [9.3 per 1,000] in 1996 and 0.86 percent [8.6 per 1,000] in 1997. “We have determined,” the report stated, “that the worst famine in human history is now transpiring in North Korea” (Korean Buddhist Sharing Movement, 1998).
Concerned by these accounts but unable to assess the reliability of their findings, a U.S. nongovernmental organization (NGO) active in North Korean humanitarian relief, Mercy Corps International, invited the Johns Hopkins School of Public Health to undertake its own study of North Korean migrants in China. In the past five years, significant numbers of North Koreans have been moving across the Chinese border in search of food for themselves and their families. It is estimated that between 50,000 and 150,000 North Koreans are staying temporarily in China, principally in Yanbian Korean Autonomous Prefecture, which is home to nearly 1 million Korean-Chinese. Bound by ties of kinship and ethnicity, Korean-Chinese families along the border and throughout the prefecture have tried to help their relatives with food, shelter, cash, and clothing.
STUDY DESIGN
The Hopkins study had two specific research objectives, one substantive and the other methodological. The first was to develop a demographic profile of North Korean migrants in order to understand better the phenomenon of migration in the context of food crisis. The second objective was to explore the use of indirect estimation techniques in calculating mortality and other vital rates. In March 1998, we distributed a self-administered questionnaire to approximately 200 local aid networks in Yanbian, asking them about their assistance to North Koreans. Of the 102 networks that responded, just over half (n=57) reported that they assisted North Korean migrants. From the list of 57 active sites, we drew a stratified sample of 18 sites, selecting at least one site from each of the eight counties of Yanbian Prefecture: Yanji, Hunchun, Yungjung, Tumen, Hwaryong, Ando, Wangchung, and Donwha. The border counties of Yanji, Hunchun, Yungjung, Tumen, and Hwaryong received multiple random picks proportional to the number of active sites in the county.
In May 1998, one Korean-Chinese interviewer was selected for each site and provided with several days of individual training, including such topics as survey methodology, techniques for good interviewing, and questionnaire formats. We also employed three field supervisors to provide ongoing monitoring of the interviews and checking of the questionnaires. In June, each interviewer conducted at least 10 practice interviews using a pretest form of the questionnaire. Based on feedback from the interviewers, the questionnaire was revised and training was provided for the new forms. Surveying began in early July and concluded at the end of September 1998, covering a three-month period. Results from that study were published in the July 24, 1999 issue of The Lancet (Robinson et al., 1999).
From July to September 1999, interviews were conducted with an additional 381 North Korean arrivals at eight sites along the border. These sites, all of which had participated in the 1998 study, were selected based on: their willingness to participate for another year, and the presence of at least moderate levels of cross-border arrivals. All North Korean respondents were assured that the interview was voluntary and confidential. We interviewed only migrants who were 18 or older and only one member of a family travelling together. No incentives were given to respondents, although interviewers received a small monthly stipend. It is estimated that between 80 and 90 percent of all arrivals at the 8 sites were interviewed during the 3-month period with a nonresponse rate of less than 5 percent.
Respondents were asked to provide a list of all household members who were alive as of January 1995 (we defined a household as people who normally live together and share the same cooking facility) and to report births, deaths, in-migrations (>1 month), and out-migrations (>1 month) between the beginning of 1995 and the end of 1998. Respondents were asked about their migration experience and their household food situation in North Korea; they also were measured for Middle Upper-Arm Circumference (MUAC). Data were entered and analyzed with SPSS 8.0. Institutional review boards at Johns Hopkins School of Public Health and in Yanbian Korean Autonomous Prefecture approved the study.
STUDY RESULTS
Mortality, Fertility, and Migration Rates
Between July and September 1999, a total of 381 North Korean migrants were interviewed at 8 sites along the China/DPRK border. Overall, in the 381 households of migrant respondents interviewed in 1999, household size averaged 4.0 persons at the beginning of 1995 and de-
clined to 3.4 persons by the end of 1998. According to 1993 census data released by the DPRK Bureau of Statistics, North Korean households averaged 4.2 members at the end of 1993 and 4.1 in North Hamkyong province where most of our sample originated (Democratic People' s Republic of Korea Central Bureau for Statistics, 1997). The average age of people living in the sample households was 30.1 years. The estimated mean age of the North Korean population at the end of 1993 was 27 years. The age structure of the sample population differed from the national population in that 0-9 year olds comprised 19.3 percent of the national population but only 14.6 percent of the sample population and persons aged 60 and over comprised 9.2 percent of the national population compared to 3.7 percent of the sample population. Roughly 57 percent of the sample population were between the ages of 20-59, compared to 44.4 percent in the national population.
Household Mortality
In terms of crude mortality, we observed a death rate of 37.3 per 1,000 averaged over the four-year period, 1995-1998 (see Table 3-1). Standardizing this rate on the age distribution of the 1993 census population would raise it to 41.8 per 1,000.
Figure 3-1 shows age-specific death rates for the sample population, using a four-year average of death rates during the period, 1995-1998. For comparative purposes, we have included the age-specific death rates (ASDRs) from the 1993 census of the DPRK population, which indicated a crude mortality rate of 5.6 per 1000 in 1993. Life expectancy in North Korea was estimated at 66 for males and 73 for females in 1991 (Savada, 1994). We have also included the ASDRs from a model life table, specifically “West” Level 4, which reflects a life expectancy of 25.3 for males and 27.5 for females (Coale and Demeny, 1983). The life expectancy of the sample population was 27.4. Crude mortality among males was 41.1/ 1000 during the four-year period, compared to 33.8/1000 for females.
TABLE 3-1 Crude Death Rates in Respondent Households (n=381)
|
Year |
Number of Deaths |
Midyear Population |
Death Rate (per 1,000) |
|
1995 |
33 |
1,496 |
22.1 |
|
1996 |
74 |
1,429 |
51.8 |
|
1997 |
68 |
1,363 |
49.9 |
|
1998 |
35 |
1,296 |
27.0 |
|
4-Year Average |
210 |
1,407 (end 1996) |
37.3 |
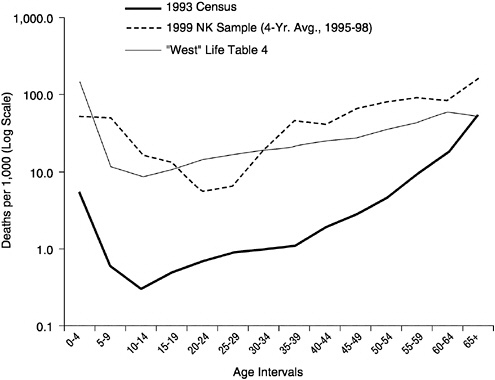
FIGURE 3-1 Age-specific death rates: 1993 Census of North Korea, 1999 sample and “West” Life Table Level 4. Source: Democratic People's Republic of Korea Central Bureau for Statistics (1997); Coale and Demeny (1983).
Overall, crude mortality rates in the 381 North Korean households included in our sample rose from 22.1/1000 in 1995 to 51.8/1000 in 1996 and 49.9/1000 in 1997. The death rate in 1998, however, declined to 27.0/ 1000. This does not show a return to baseline rates of 5.6/1000 in 1993, but it does suggest that the situation may be improving with stronger harvests and sustained international food aid. It is also possible that mortality is falling because many of the more vulnerable members of the population died off in 1996 and 1997 and the survivors are a hardier group.
We also asked respondents to identify cause of death. Out of 208 who listed a cause of death, 95 deaths (45.7 percent) were attributed to lack of food/malnutrition, and 89 deaths (42.8 percent) were attributed to illness/disease. Accidents were the cause of 12 deaths (5.8 percent) and suicide accounted for 6 deaths (2.9 percent).
TABLE 3-2 Crude Birth Rates in Respondent Households (n=381)
|
Year |
Number of Births |
Midyear Population |
Birth Rate (per 1,000) |
|
1995 |
20 |
1,496 |
13.4 |
|
1996 |
23 |
1,429 |
16.1 |
|
1997 |
22 |
1,363 |
16.1 |
|
1998 |
13 |
1,296 |
10.0 |
|
4-Year Average |
78 |
1,407 (end 1996) |
13.9 |
Household Fertility
Looking at household births during the four-year period, no clear trends emerge except perhaps that fertility in 1998 declined significantly from previous years and that the four-year average, 13.9/1000, is well below the UN estimate of 21.8/1000 for 1990 to 1995 (See Table 3-2 ).
In- and Out-Migration
Respondents were asked to identify anyone who had moved into or out of the household for more than one month during the four-year recall period. While it is clear from Table 3-3 that net migration rates rose substantially from 1995 to 1997, the data also suggest that cumulative movements in and out of households may have declined from 1997 to 1998. While the net-migration rates for these two years are quite similar, a total of 72 people moved into or out of these households in 1997, while only 50 people did so in 1998.
TABLE 3-3 Net Migration Rates in Respondent Households (n=381)
|
Year |
Number of In-Migrants (>1 Month) |
Number of Out-Migrants (>1 Month) |
Net Migration |
Midyear Population |
Net-Migration Rate (per 1,000) |
|
1995 |
4 |
10 |
6 |
1,496 |
4.0 |
|
1996 |
5 |
30 |
25 |
1,429 |
17.5 |
|
1997 |
17 |
55 |
38 |
1,363 |
27.9 |
|
1998 |
7 |
43 |
36 |
1,296 |
27.8 |
|
Total |
33 |
138 |
105 |
1,407 (end 1996) |
18.7 |
TABLE 3-4 Province and Household Mortality
|
Household Mortality, 1995-1998 |
|||
|
Province |
No |
Yes |
Total |
|
North Hamkyong |
159 |
120 |
279 |
|
South Hamkyong |
25 |
15 |
40 |
|
Ryanggang |
17 |
8 |
25 |
|
Other |
32 |
5 |
37 |
|
Total |
233 |
148 |
381 |
|
P = 0.006 |
|||
Mortality and Household Characteristics
In the following discussion, our unit of analysis is the household and the dependent variable is dichotomous: 0=no deaths in the household, 1995-1998; 1=any deaths in the household, 1995-1998. The 210 deaths reported during the interval occurred in 148 out of 381 households (38.8 percent) in the sample. Except where indicated, we used a chi-square test for significance.
Provincial Address
As shown in Table 3-4 , among the 1999 sample, the household address of a large majority (73.2 percent) was in North Hamkyong with South Hamkyong (10.5 percent) a distant second, followed by Ryanggang with 6.6 percent. Only a handful came from other, more distant provinces. Cross-tabulating province of origin with household mortality, we found not only that the association had clear statistical significance (p=0.006), but that the proportion of households with mortality declined with distance of household residence from the China/North Korea border. We had expected to see something of the opposite trend, namely that selectivity for distress as measured by household mortality would be stronger the greater the distance traveled. It is possible, of course, that differential household mortality in the provinces does not reflect migrant selectivity but rather reflects different underlying mortality rates within the provinces.
Residential Area
Just under half (48.8 percent) of respondents described their residential area as urban, while 31.2 percent came from rural/agricultural areas
and 20 percent came from mining communities. The mining industry has suffered a virtual shutdown in the northeast, according to many reports, and workers are no longer getting paid. In many of the bigger cities in North and South Hamkyong, reports from migrants suggest that food is no longer available regularly through the government rationing program known as the Public Distribution System (PDS). As one 52-year-old man said, “There are some places that are comparatively better than other places. Along the seacoast, you can catch fish. The steel factories have something to trade with other countries so those workers still are getting paid. Pyongyang is the capital so most of those people get rice. In most big cities, however, the situation is the worst because there is no place to forage or to grow anything.” Contrary to expectation, household mortality among migrants coming from urban areas did not differ significantly from that for other areas. Again, it is not possible to tell whether this reflects a more general reality or migration selection.
Family Class Background
All families in North Korea are categorized based on their class background and/or personal characteristics. The ten categories we employed in our study range from worst to best in terms of political standing. The five bad categories include political prisoners and their families, those who collaborated with the Japanese or other enemies of the state, those whose family members went south (into the Republic of Korea), those who have been sent into internal exile, and the families of former rich peasants. All of these categories are grouped into the “hostile” classes in terms of political orientation (Asia Watch and Minnesota Lawyers International Human Rights Committee, 1988). The middle peasant and poor peasant categories are largely neutral although poor peasant status is helpful in obtaining membership in the Korean Workers Party. Three categories comprise the “loyal ” classes: families of war victims, veterans, and revolutionary heroes. It is interesting to note that from 1995 to 1998, the political standing among these migrant households went categorically downward (see Table 3-5 ). The number of households with a “hostile” class designation increased by nearly 60 percent, from 29 to 46, during the four years. What this suggests, among other things, is that declining political status may provide a strong incentive to leave North Korea.
Running a cross-tabulation of household mortality by political class, we found no significant association, which suggests either that recent mortality is not correlated with a household's political status or that, among the “loyal” class categories, migration to China may be more selective for higher mortality.
TABLE 3-5 Family Class Background of North Korean Households (n=380)
|
Category 1995 |
Number in 1995 |
Percent in 1995 |
Number in 1998 |
Percent in 1998 |
|
“Hostile” Class |
29 |
7.6 |
46 |
12.1 |
|
“Wavering” Class |
285 |
75.2 |
284 |
74.7 |
|
“Loyal” Class |
65 |
17.2 |
50 |
13.2 |
|
Total |
379 |
100.0 |
380 |
100.0 |
Source of Food
Historically, nearly three-quarters of the North Korean population have been entitled to purchase heavily subsidized food rations through the government's Public Distribution System (PDS). Under this 10-tiered structure based on age and occupational status, a working adult was entitled to 700 grams of food-grain per day, with children receiving 500 grams and the elderly 600 grams per day. By 1997, according to UN estimates, PDS allocations were averaging only about 100 grams per person per day (World Food Programme, 1997). Respondents in the 1999 survey reported that their per capita daily food ration was 81 grams in 1997. As Table 3-6 indicates, while a majority of respondents (50.7 percent) relied on government rations as their household's primary source of food in 1995, by 1997 only 3.9 percent did so. Instead, nearly 44 percent of
TABLE 3-6 Household's Primary Source of Food by Year, Total Number of Respondents (Percentage of Total Number of Respondents)
|
Year |
Govt. Ration |
Buy |
Barter |
Forage |
Gift |
Grow |
Other |
Total |
|
1995 |
193 (50.7%) |
44 (11.5) |
46 (12.1) |
55 (14.4) |
2 (0.5) |
35 (9.2) |
6 (1.6) |
381 (100.0) |
|
1996 |
82 (21.5) |
62 (16.3) |
58 (15.2) |
113 (29.7) |
2 (0.5) |
57 (15.0) |
7 (1.8) |
381 (100.0) |
|
1997 |
15 (3.9) |
43 (11.3) |
83 (21.8) |
166 (43.6) |
5 (1.3) |
61 (16.0) |
8 (2.1) |
381 (100.0) |
|
1998 |
30 (7.9) |
40 (10.5) |
72 (18.9) |
167 (43.8) |
4 (1.0) |
58 (15.2) |
10 (2.6) |
381 (100.0) |
TABLE 3-7 Primary Food Source (1998) and Household Mortality
|
Household Mortality, 1995-1998 |
|||
|
Food Source |
No |
Yes |
Total |
|
Govt. Ration |
19 |
11 |
30 |
|
Buy |
28 |
12 |
40 |
|
Barter |
56 |
16 |
72 |
|
Forage |
79 |
88 |
167 |
|
Gift |
4 |
0 |
4 |
|
Grow |
40 |
18 |
58 |
|
Other |
7 |
3 |
10 |
|
Total |
232 |
147 |
379 |
|
P = 0.000 |
|||
households in 1997 and 1998 relied on foraging as their principal source of food. A slight improvement in the situation might be seen in the increased percentage of households relying on government rations in 1998 (7.9 percent) compared to 3.9 percent during the previous year.
As Table 3-7 indicates, fully 60 percent of all households reporting mortality from 1995-1998 relied on foraging as their primary source of food for at least two years. Of the 167 households who primarily foraged for their food supply in 1998 (and in 1997 as well), 88 of 167 (53 percent) reported at least one death in the household, a proportion substantially higher than those households relying on any other food source. We are not necessarily suggesting a direct causal relationship between foraging and household mortality, but the association is clearly a strong one.
Mortality and Migrant Characteristics
The mean age of respondents was 33.3 and nearly 80 percent were under the age of 40. More than 95 percent had completed at least a middle-school education and nearly 45 percent had completed at least a high-school education. Factory workers comprised the single most common occupation (40.6 percent), followed by farmers (19.5 percent) and unemployed (9.8 percent). More than 55 percent of the 1999 survey respondents said that their principal reason for coming to China was to get food, while another 36 percent said they wanted to work or make money. More than 80 percent were visiting China for the first time since 1995. Of those who had come previously, the average length of stay was 52 days, although the great majority (60 percent) stayed less than one month. Respondents reported
that they had traveled an average of 143 kilometers from their home to the border and another 127 kilometers from the border to the site where they were interviewed. The second figure, if accurate, reflects a significant amount of local movement within China. It is probably not a measurement “as the crow flies” from the border to the site. Asked if they planned to return to North Korea, 56 percent responded yes.
Sex
Among the 1999 sample, 53 percent of respondents were male and 47 percent were female. As Table 3-8 demonstrates, 44 percent of households represented by a male migrant respondent in China had at least one death during 1995-1998 while 33 percent of households represented by a female migrant experienced a death in the recall period. This difference, which is statistically significant (p=0.027), cannot be explained by the fact that overall male mortality rates within migrant households (39.6/1000) was higher than female mortality rates (34.9/1000). In fact, males reported only slightly higher death rates for males in their households (41.1/ 1000) than female respondents reported for males in their households (37.5/1000). The real difference was in female mortality, with male respondents reporting much higher female mortality (47.5/1000) in their households than female respondents reported (18.1/1000) in theirs.
Marital Status
While household mortality does seem to be associated with marital status (p=0.002), it should be noted that the difference between married and single persons appears negligible (see Table 3-9 ). Divorced and widowed persons, however, have a much greater likelihood of household
TABLE 3-8 Sex of Respondent and Household Mortality
|
Household Mortality, 1995-1998 |
|||
|
Sex |
No |
Yes |
Total |
|
Male |
113 |
89 |
202 |
|
Female |
120 |
59 |
179 |
|
Total |
233 |
148 |
381 |
|
P = 0.027 |
|||
TABLE 3-9 Marital Status of Respondent and Household Mortality
|
Household Mortality, 1995-1998 |
|||
|
Marital Status |
No |
Yes |
Total |
|
Married |
115 |
67 |
182 |
|
Single |
100 |
53 |
153 |
|
Divorced |
3 |
12 |
15 |
|
Widowed |
5 |
13 |
18 |
|
Separated |
9 |
3 |
12 |
|
Total |
232 |
148 |
380 |
|
P = 0.002 |
|||
mortality (widows were already widowed as of January 1995 and all mortality was subsequent to that).
Disaggregating for gender of respondents, however, we find that while household mortality did not differ between male and female married respondents, significant differences existed between male and female single respondents. Among single male respondents, deaths were reported in 50 percent of all households (35 of 70) while among single female respondents, deaths in the recall period were reported in only 22 percent (18 of 83) of households. Another difference we found when disaggregating for gender of respondents is that all of the mortality in households of divorced respondents occurred in households of male respondents; no divorced females were even present in the survey. Conversely, all of the mortality in households of widowed respondents occurred in households of female respondents; only one widowed male was present in the survey and he reported no deaths in his household from 1995-1998.
Middle-Upper Arm Circumference (MUAC)
Respondents in the 1998 survey were measured for middle upperarm circumference as a rough measure of adult nutritional status. We employed a cut-point of less than 200 millimeters for males and less than 190 millimeters for females as an indicator of Grade 4 malnutrition or severe wasting and less than 230 millimeters for males and less than 220 millimeters for females as an indicator of undernourishment (Ferro-Luzzi and James, 1996). Adjusting for rounding, we found that 5.2 percent (10/ 194) of male respondents were severely wasted and 28.9 percent (56/194) were undernourished. Among females, 3.4 percent (5/146) were severely
wasted and 32.8 percent (48/146) were undernourished. Total MUAC scores ranged from a low of 165 millimeters (female) to a high of 298 millimeters (2 males). Running a logistic regression of all MUAC scores on household mortality, we found a slight negative correlation with no statistical significance (p=0.134). Disaggregating for gender, however, we found that among male migrant respondents, MUAC scores had a strong negative correlation with household mortality (p=0.009) while among female respondents, there was no such correlation (p=0.676).
ANALYSIS AND CONCLUSIONS
The crude death rates among the North Korean households that include a migrant to China reflect a pattern of mortality that is well in excess of normal and that climaxes in the years 1996 and 1997, when most accounts suggest that the famine was at its peak. Although we have no way of measuring the extent to which these rates reflect a broader reality, we did undertake to assess death rates among households that did not include a migrant to China. We did this by asking the migrant respondent to describe the separate household of a sibling and then asking if anyone in that sibling household had visited China during the recall period. Out of 381 migrants interviewed, 142 provided basic demographic information on a sibling, nonmigrant household. Within these sibling households, mortality rates during 1995-1998 averaged 59.1/1000, with rates peaking in 1996 and 1997 and then declining in 1998. Although we stress that this is not an independent sample, these data suggest that elevated mortality may affect more than those households that have sent a migrant into China.
In addition to excess mortality, the sample of North Korean households demonstrates two other trends that are consistent with a response to famine: declining fertility and rising levels of migration. The drop in birth rates in 1998 would suggest that many families began to control their fertility in 1997, allowing a nine-month lag for gestation. As noted earlier, the migration patterns (which largely are measures of internal, not international, migration) also support the view that more people were moving in and out of households when the famine was at its peak in 1997.
The survey found three ways in which household food security was associated with mortality in migrant households. First, the highest proportion of households experiencing at least one death in the recall period was found among those that had relied on foraging as their primary source of food for at least two years. Second, more than 45 percent of all deaths reported by migrant respondents were attributed to malnutrition or insufficient food. Third, among male migrant respondents at least, middle upper arm circumference was negatively associated (p=0.009) with
household mortality. The fact that no such association existed with female respondents suggests either some physiological cause or, perhaps more likely, that male and female migrants may differ from one another in the extent to which food insecurity and household mortality motivate their movements into, and back from, China.
As we have tried to suggest throughout this paper, without solid data on recent household mortality in North Korea, it is next to impossible to know if a correlation observed in the migrant household sample is representative of a broader trend or merely indicative of a selection factor for migration. Looking at mortality differentials within the sample, however, it is possible to conclude that male and female migrants may be playing somewhat different roles in terms of household coping strategies. As noted earlier, male migrants are associated with higher proportions of households with mortality than female migrants (44 percent compared to 33 percent, p=0.027). A higher percentage of males than females have visited China more than once since 1995 (22 percent compared to 15.3 percent, p=0.064), and more males than females report having relatives in China (20.1 percent compared to 11.8 percent, p=0.029). Males also have a greater likelihood of returning to North Korea than females (65.8 percent compared to 44.9 percent, p<0.001).
One difference between male and female migrants that may help to explain these patterns is that female migrants are more likely than males to be single (46.6 percent compared to 34.6 percent, p=0.018) or widowed (9.5 percent to 0.5 percent, p<0.001). Although male and female migrants do not differ significantly in age or household size, the difference in marital status may partly explain why married and divorced males appear more likely to respond to distress in the household by going into China and returning with food or other assistance. Single or widowed females, on the other hand, may be more likely to respond to distress by leaving the household, thus reducing the number of mouths left to feed. Particularly for single North Korean females, the prospects for remaining more permanently in China are enhanced by the active “bride-trade” along the border.
When using small, selective samples to estimate the dimensions of a possibly much larger phenomenon, the limitations are obvious. Surveys of migrant populations cannot take the place of random sample surveys in the population at large, especially if one is interested in estimating national trends in mortality, fertility, or migration. Refugee and migrant surveys, however, may be necessary in situations of political or military crisis, natural disaster, severe government restrictions, or any combination of the above, if that is the only way of deriving needed indicators for an otherwise inaccessible population.
In the case of North Korea, the findings from our survey have several implications for the humanitarian community. First, our sample provides
evidence of significantly elevated mortality among at least some North Korean households, especially in North Hamkyong province. This excess mortality, moreover, was associated with food insecurity. The age-specific death rates in our sample population indicated that excess mortality was found not only in the youngest and oldest segments of the population—although these showed the highest absolute increases —but also among older children and younger to middle-aged adults. The consolidated UN inter-agency appeal for the DPRK in 2000 targeted 8,044,000 beneficiaries, 75 percent of whom were children and another 5 percent of whom were elderly (aged 60 and above) (United Nations Office for the Coordination of Humanitarian Affairs, 1999). Nearly two-thirds (63 percent) of all deaths reported in our survey, however, occurred to people between the ages of 20 and 59, suggesting that not all high-risk groups will benefit from UN-supported feeding programs. A majority of beneficiaries, moreover, are targeted through government institutions (kindergartens, primary and secondary schools, orphanages, hospitals, factories, and collective farms). Children who are not in school, adults who are unemployed, and people of any age who are away from their registered residence or place of work are unlikely to be reached either by UN or government-sponsored food distributions.
Migrant surveys are important for their own sake, even when migrants do not represent the broader picture. First, simply because they exist, forced migrants may be signals of crisis and distress that otherwise might be hidden from the international community. Second, forced migrants—both international and internal—may be among the most vulnerable populations in any complex humanitarian emergency. And third, questions and issues that emerge from these surveys may help to shape a broader response to crisis. International refugees and migrants too often are treated as a separate and distinct problem from the crisis they have supposedly left behind. Migrant surveys may help us see not only that these problems are of a piece but also how better to solve them in a more comprehensive manner.
ACKNOWLEDGMENTS
Support for this study came from the Center of Excellence in Disaster Management and Humanitarian Assistance and the Andrew W. Mellon Foundation. Fieldwork was carried out in collaboration with Mercy Corps International.
REFERENCES
Asia Watch and Minnesota Lawyers International Human Rights Committee 1988 Human Rights in the Democratic People's Republic of Korea (North Korea) . Minneapolis and Washington, D.C. : Asia Watch and Minnesota Lawyers International Human Rights Committee .
Coale, A.J. , and P. Demeny 1983 Regional Model Life Tables and Stable Populations . New York : Academic Press .
Democratic People's Republic of Korea Central Bureau for Statistics 1997 Population by Location and Households, December 31, 1993 . World Food Programme Mimeograph .
Eberstadt, N. , and J. Banister 1992 The Population of North Korea . Berkeley : University of California, Institute of East Asian Studies .
European Union, United Nations Children's Fund, and World Food Programme 1998 Nutrition Survey of the Democratic People's Republic of Korea . New York : UNICEF .
Ferro-Luzzi, A. , and W. James 1996 Adult malnutrition: Simple assessment techniques for use in emergencies . British Journal of Nutrition 753 : 10 .
Katona-Apte, J. , and A. Mokdad 1998 Malnutrition of children in the Democratic People's Republic of North Korea . Journal of Nutrition 128(8) : 1315-1319 .
Korean Buddhist Sharing Movement 1998 The Food Crisis of North Korea Witnessed by 1,019 Food Refugees . Seoul : Korean Buddhist Sharing Movement .
Robinson, W.C. , M. Lee , K. Hill , and G. Burnham 1999 Mortality in North Korean migrant households . Lancet 3542 : 91-95 .
Savada, A.M. 1994 North Korea: A Country Study . Washington, D.C. : Federal Research Division, Library of Congress .
United Nations Department of Economic and Social Affairs 1998 1996 Demographic Yearbook . New York : United Nations, Department of Economic and Social Affairs .
United Nations Office for the Coordination of Humanitarian Affairs 1999 UN Consolidated Interagency Appeal for Democratic People's Republic of Korea, January-December 2000 . Geneva : United Nations .
World Food Programme 1997 On the Knife Edge of a Famine . Rome : World Food Programme .
World Vision 1997 North Korea Food Questionnaire . Federal Way, Washington : World Vision .


