
3.
Format and Content of Technical Support Documents
The technical support document (TSD) is the compilation of all relevant data and information from all key studies and references and the most important supporting studies and references for both human exposures and laboratory animal exposures. Additionally, this support document addresses all the methodologies used in the derivation of the AEGL values and presents the rationale and justification for the use of certain data in the derivation and for the elimination of certain studies or data. The TSD addresses why specific methodologies and adjustment factors were or were not used, the scientific evidence supporting the rationale and justification, and the appropriate references to the published scientific literature or sources of unpublished information.
Major components of the TSD are (1) a summary section that includes a concise summary of toxicity information on the chemical, rationales used for time scaling and selection of uncertainty factors, and a table of AEGL values for the three tiers as well as key references; (2) a detailed discussion of the items listed in 1; and (3) a derivation summary table that includes a list and discussion of the key data elements and the rationale used to derive the AEGL values.
EDITORIAL CONVENTIONS
-
Concentrations will be expressed in the units used in the original publication. If the data in the publication or other data sources are
-
expressed in parts per million (ppm), enter only ppm values. If the data are expressed in milligrams per cubic meter (mg/m3) or other units, then state the concentrations as expressed in the data source and add the ppm values in parentheses.
-
References to footnotes should be superscript and lower case.
3.1 FORMAT AND CONTENT OF TECHNICAL SUPPORT DOCUMENTS
Preface
The AEGL tiers are defined in the Preface of each TSD. See Section 2.1 for definitions of AEGLs 1, 2, and 3.
Table of Contents
Major headings in the text, tables, and figures should be marked with the word processor indexing tool so that the Table of Contents can be generated by the computer. A sample Table of Contents is presented in Appendix D.
Summary
The Summary should include the following:
-
The name and CAS number of the chemical being reviewed.
-
A brief description of the substance, its physical properties, and uses.
-
A brief statement or overview of the toxicology, including the extent of the data and information retrieved and reviewed, highlights of the most important research and strengths and weaknesses of the database. Discuss data on human exposures and data on laboratory animals.
-
A brief summary (one paragraph for each AEGL tier) of the key study (with references), the data used, and the derivation of the AEGL values. Each summary will include the following:
-
Information on the endpoints of concern and exposure levels used as the basis for deriving the AEGL values.
-
-
Exposure level (If the data in the publication are expressed in ppm, enter only ppm values. If the data are expressed in mg/m3 or other units, state the concentrations as expressed in the publication and add the ppm values in parentheses.).
-
Exposure period.
-
Why the time-concentration point was selected (include effects observed or not observed, relate to the AEGL level, etc.).
-
The species and number of animals used.
-
Consistency with human data as appropriate.
-
The reference to the key study.
-
Uncertainty factors and modifying factors used or not used and why a specific value was chosen.
-
The time-scaling method used and why it was selected (include the rationale for the value of n in the time-scaling equation).
-
A brief statement regarding carcinogenicity, if appropriate.
-
A brief statement on the adequacy of the data (see Section 2.3.3 of this SOP manual).
-
A summary table of draft/proposed AEGL values with
-
Values presented in ppm with mg/m3 values in parentheses.
-
A rationale and reference for AEGL-1, -2, and -3.
-
Reasons for no AEGL value.
-
-
References.
A sample Summary is presented in Appendix E.
Outline of the Main Body of the Technical Support Document
1. Introduction
-
General information regarding occurrence, production and use, and physical-chemical data (table for physical-chemical data)
2. Human Toxicity Data
|
2.1 |
Acute Lethality (include anecdotal case reports if pertinent) |
|
|
2.2 |
Nonlethal Toxicity |
|
|
|
2.2.1 |
Acute Studies (include anecdotal case reports if pertinent) |
|
|
2.2.2 |
Epidemiologic Studies |
|
2.3 |
Developmental and Reproductive Toxicity |
|
|
2.4 |
Genotoxicity |
|
|
2.5 |
Carcinogenicity (include EPA and IARC classifications) |
|
|
2.6 |
Summary (weight-of-evidence approach) |
|
-
Tabulation of data as appropriate within sections and/or in summary
3. Animal Toxicity Data
|
3.1 |
Acute Lethality (include species and strain, number of animals, exposure concentrations and durations, mortality rates and ratios, time to death) (To maintain a standardized format, the order of animals shown below should be used.) |
|
|
|
3.1.1 |
Nonhuman Primates |
|
|
3.1.2 |
Dogs |
|
|
3.1.3 |
Rats |
|
|
3.1.4 |
Mice |
|
|
3.1.5 |
Guinea Pigs |
|
|
3.1.6 |
Rabbits |
|
|
3.1.7 |
Other Species |
-
Sections to include relevant studies (potential key studies and supporting data) or provide overall picture of toxicity data as appropriate
-
Third-level headers to vary, depending upon available data; exclusion of header to mean no relevant data available
|
3.2 |
Nonlethal Toxicity (include species and strain, number of animals, exposure concentrations and durations, critical effects, time-course data) (The order of animals shown should be used. If no data are available for a species, the number should be used for the next species discussed.) |
|
|
|
3.2.1 |
Nonhuman Primates |
|
|
3.2.2 |
Dogs |
|
|
3.2.3 |
Rats |
|
|
3.2.4 |
Mice |
|
|
3.2.5 |
Guinea Pigs |
|
|
3.2.6 |
Rabbits |
|
|
3.2.7 |
Other Species |
-
Sections to include relevant studies (potential key studies and supporting data) or provide overall picture of toxicity data as appropriate
-
Third-level headers to vary, depending upon available data; exclusion of header to mean no relevant data available
|
3.3 |
Developmental and Reproductive Toxicity |
|
|
3.4 |
Genotoxicity |
|
|
3.5 |
Carcinogenicity |
|
|
3.6 |
Summary (weight-of-evidence approach) |
|
-
Tabulation of data as appropriate within sections and/or in summary
4. Special Considerations
|
4.1 |
Metabolism and Disposition (general background; interspecies and individual variabilities, especially as they pertain to AEGL derivation) |
|
|
4.2 |
Mechanism of Toxicity (general background; interspecies and individual variabilities, especially as they pertain to AEGL derivation) |
|
|
4.3 |
Structure-Activity Relationships (data relevant to filling data gaps on the chemical) |
|
|
4.4 |
Other Relevant Information |
|
|
|
4.4.1 |
Species Variability |
|
|
4.4.2 |
Concurrent Exposure Issues (e.g., potentiation) |
-
Third-level headers to vary, depending upon available data; exclusion of header to mean no relevant data available
5. Data Analysis for Proposed AEGL-1
|
5.1 |
Summary of Human Data Relevant to AEGL-1 (general summary description of selected key and supporting study or studies if available) |
|
5.2 |
Summary of Animal Data Relevant to AEGL-1 (general summary description of selected key and supporting study or studies if available) |
|
5.3 |
Derivation of AEGL-1 (key study, critical effect, dose-exposure concentration, uncertainty factor application and justification, temporal extrapolation, assumptions, confidence, consistency with human data if appropriate) |
6. Data Analysis for Proposed AEGL-2
|
6.1 |
Summary of Human Data Relevant to AEGL-2 (general summary description of selected key and supporting study or studies if available) |
|
6.2 |
Summary of Animal Data Relevant to AEGL-2 (general summary description of selected key and supporting study or studies if available) |
|
6.3 |
Derivation of AEGL-2 (key study, critical effect, dose-exposure concentration, uncertainty factor application and justification, temporal extrapolation, assumptions, confidence, consistency with human data if appropriate) |
7. Data Analysis for Proposed AEGL-3
|
7.1 |
Summary of Human Data Relevant to AEGL-3 (general summary description of selected key and supporting study or studies if available) |
|
7.2 |
Summary of Animal Data Relevant to AEGL-3 (general summary description of selected key and supporting study or studies if available) |
|
7.3 |
Derivation of AEGL-3 (key study, critical effect, dose-exposure concentration, uncertainty factor application and justification, temporal extrapolation, assumptions, confidence, consistency with human data if appropriate) |
8. Summary of Proposed AEGLs
|
8.1 |
AEGL Values and Toxicity Endpoints |
|
8.2 |
Comparison with Other Standards and Criteria (summarized in text and presented in a table; see SOP Appendix J for an example) |
|
8.3 |
Data Adequacy and Research Needs (for content, see Section 2.3.3 of this manual) |
9. References
-
List of references cited in document.
10. Appendixes
|
APPENDIX A |
(Derivation of AEGL Values) (see SOP Appendix F for an example) |
|
APPENDIX B |
(Time-Scaling Calculations) (see SOP Appendix G for an example) |
|
APPENDIX C |
(Carcinogenicity Assessment) (see SOP Appendix H for an example) |
|
APPENDIX D |
(Derivation Summary) (see SOP Appendix I for specific format and an example) Format for Derivation Summary: |
DERIVATION SUMMARY (CHEMICAL NAME)
(CAS No.)
|
AEGL-1 (OR -2 OR -3) Values |
||||
|
10 min |
30 min |
1 h |
4 h |
8 h |
|
ppm |
ppm |
ppm |
ppm |
ppm |
|
Reference: |
||||
|
Test Species/Strain/Number: |
||||
|
Exposure Route/Concentrations/Durations: |
||||
|
Effects: |
||||
|
Endpoint/Concentration/Rationale: |
||||
|
Uncertainty Factors/Rationale: |
||||
|
Modifying Factor: |
||||
|
Animal to Human Dosimetric Adjustment: |
||||
|
Time Scaling: |
||||
|
Data Adequacy:a |
||||
|
a Elements that should be included in the Data Adequacy entry are discussed in Section 2.3.3 of this SOP manual. If an AEGL-1 value is not recommended, there should be a short discussion of the rationale for that choice. The rationale should include, as appropriate, a discussion that numeric values for AEGL-1 are not recommended because (1) relevant data are lacking, (2) the margin of safety between the derived AEGL-1 and AEGL-2 values is inadequate, or (3) the derived AEGL-1 is greater than the AEGL-2. Absence of an AEGL-1 does not imply that exposure below the AEGL-2 is without adverse effects. |
||||
3.2 GRAPHIC DESCRIPTION OF DATA
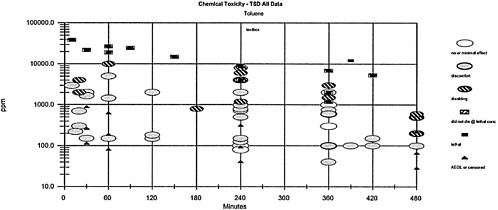
Graphic descriptions of relevant data can be helpful in identifying, understanding, and comparing similarities and differences, degree of variation, and trends among the values cited. Well-prepared graphs provide the reader with an overview of dose-response relationships in terms of both airborne concentrations and exposure periods in various studies and various species. The graphs should supplement the data tables but cannot replace tabular summaries. The graphs can be placed in the body of the document or in an appendix. Below are examples of presentations of graphic data.
Comparisons between different times and the toxicity values are difficult because the values vary according to the time. A particularly useful way to present the data (Table 3–1 and Figure 3–1) is based on the concept of placing the toxic response into severity categories (Hertzberg and Miller, 1985; Hertzberg and Wymer, 1991; Guth et al., 1991). In Table 3–1, the severity categories fit into definitions of the AEGL health effects. The category severity definitions for the column headings are 0=no effect; 1=discomfort; 2=disabling; 3=lethal; NL=did not die at a lethal concentration (at an experimental concentration in which some of the animals died and some did not, the NL label refers to the animals that did not die); AEGL or C=AEGL or censored (severity category could not be established). The effects that place an experimental result into a particular category vary according to the spectrum of data available on a specific chemical and the effects from exposure to that chemical. When the exposure concentration is placed into the appropriate column, the graph in Figure 3–1 is generated. The doses often span a number of orders of magnitude, especially when human data exist. Therefore, the concentration is placed on a log scale. Note that the AEGL values are designated as a triangle without an indication to their level. The AEGL-3 is higher than the AEGL-2, which is higher than the AEGL-1.
This type of plot is useful for a number of reasons and can be used to address the following questions:
-
Are the AEGL values protective?
-
Are the AEGL-3 values below the concentration causing death in experimental animals? If the answer is no, then the question should be raised about the appropriateness of the AEGL-3 value. Is the AEGL-3 value appropriate and the data point anomalous, or should the AEGL-3 value be lowered?
-
Similar questions should be asked about the AEGL-1 and AEGL-2 values.
-
TABLE 3–1 Grouping Data into Categories for Plotting
|
Reference |
Species |
Sex |
# Exposures |
ppm |
Min |
ppm |
ppm |
ppm |
ppm |
ppm |
ppm |
Category |
Gp Size |
Incidence |
Comments |
|
Toluene |
|
0 |
1 |
2 |
NL |
3 |
AEGL |
|
Category 0=no effect 1=discomfort 2=disabling 3=lethal ND=did not die at lethal concentration AEGL or C=AEGL or censored |
||||||
|
NAC/AEGL-1 |
|
115 |
30 |
|
115 |
AEGL |
|
||||||||
|
NAC/AEGL-1 |
82 |
60 |
82 |
AEGL |
|||||||||||
|
NAC/AEGL-1 |
41 |
240 |
41 |
AEGL |
|||||||||||
|
NAC/AEGL-1 |
29 |
480 |
29 |
AEGL |
|||||||||||
|
NAC/AEGL-2 |
267 |
30 |
267 |
AEGL |
|||||||||||
|
NAC/AEGL-2 |
189 |
60 |
189 |
AEGL |
|||||||||||
|
NAC/AEGL-2 |
94 |
240 |
94 |
AEGL |
|
||||||||||
|
NAC/AEGL-2 |
67 |
480 |
67 |
AEGL |
|||||||||||
|
NAC/AEGL-3 |
897 |
30 |
897 |
AEGL |
|||||||||||
|
NAC/AEGL-3 |
634 |
60 |
634 |
AEGL |
|||||||||||
|
NAC/AEGL-3 |
317 |
240 |
317 |
AEGL |
|||||||||||
|
NAC/AEGL-3 |
224 |
480 |
224 |
AEGL |
|||||||||||
|
Baelum et al. 1985 |
hu |
|
1 |
100 |
390 |
|
100 |
|
1 |
|
sensory irritation, sleepiness, intoxication, decreased manual dexterity and color discrimination |
||||
|
Wilson 1943 |
hu |
many |
200 |
480 |
200 |
1 |
headache, lassitude, anorexia |
||||||||
|
Wilson 1943 |
hu |
many |
200 |
480 |
|
|
200 |
|
2 |
headache, nausea, incoordination, increased reaction time |
|||||
|
Wilson 1943 |
hu |
|
many |
500 |
480 |
|
|
500 |
|
2 |
|
headache, nausea, incoordination, increased reaction time |
|||
|
Wilson 1943 |
hu |
many |
500 |
480 |
500 |
|
1 |
headache, nausea, incoordination, decreased reaction time and palpitation, extreme weakness |
|||||||
|
Ukai et al. 1993 |
hu |
many |
100 |
480 |
100 |
1 |
weight loss, dizziness, headache, tightness in chest, dimmed vision |
||||||||
|
Lee et al. 1988 |
hu |
many |
100 |
480 |
100 |
1 |
weight loss, dizziness, headache |
||||||||
|
Gamberale & Hultengren 1972 |
hu |
1 |
300 |
20 |
300 |
1 |
reaction time affected |
||||||||
|
Gamberale & Hultengren 1972 |
hu |
1 |
700 |
20 |
700 |
1 |
decrease in perceptual speed |
||||||||
|
von Oettingen et al. 1942 |
hu |
1 |
200 |
480 |
|
200 |
2 |
muscular weakness, confusion, impaired coordination, dilated pupils |
|||||||
|
von Oettingen et al. 1942 |
hu |
1 |
200 |
480 |
200 |
2 |
severe incoordination, confusion, dilated pupils, nausea, extreme fatigue |
||||||||
|
von Oettingen et al. 1942 |
hu |
1 |
600 |
480 |
600 |
2 |
severe incoordination, confusion, dilated pupils, nausea, extreme fatigue |
||||||||
|
von Oettingen et al. 1942 |
hu |
1 |
800 |
180 |
800 |
2 |
loss of self-control, muscular weakness, extreme fatigue, nausea, bone marrow suppression |
||||||||
|
Reference |
Species |
Sex |
# Exposures |
ppm |
Min |
ppm |
ppm |
ppm |
ppm |
ppm |
ppm |
Category |
Gp Size |
Incidence |
Comments |
|
Toluene |
|
0 |
1 |
2 |
NL |
3 |
AEGL |
|
Category |
||||||
|
Baelum et al. 1990 |
hu |
|
1 |
100 |
420 |
|
100 |
|
1 |
|
sensory irritation, altered temp, perception, headache, dizziness |
||||
|
Echeverria et al. 1991 |
hu |
1 |
150 |
420 |
150 |
1 |
decreased performance on spatial and neurobehavioral tasks, headache, eye irritation |
||||||||
|
Andersen et al. 1983 |
hu |
1 |
40 |
360 |
40 |
1 |
no effect/sensory irritation, increase in odor level |
||||||||
|
Andersen et al. 1983 |
hu |
1 |
100 |
360 |
100 |
1 |
no effect/sensory irritation, increase in odor level |
||||||||
|
Rahill et al. 1996 |
hu |
1 |
100 |
360 |
100 |
|
0 |
increased latency on a neurobehavioral task (not a biologically relevant neurobehavioral deficit) |
|||||||
|
Dick et al. 1984 |
hu |
1 |
100 |
240 |
100 |
0 |
decreased accuracy on visual-vigilance test (not a biologically relevant neurobehavioral deficit) |
||||||||
|
Cherry et al. 1983 |
hu |
1 |
80 |
240 |
80 |
0 |
no impairment on neurobehavioral tasks |
||||||||
|
Carpenter et al. 1976 |
hu |
1 |
220 |
15 |
|
220 |
1 |
sensory threshold for eye irritation |
|||||||
|
Pryor et al. 1978 |
rat |
|
1 |
26,700 |
60 |
|
26,700 |
|
|
NL |
|
LC50 |
|||
|
Pryor et al. 1978 |
rat |
1 |
26,700 |
60 |
|
26,700 |
3 |
LC50 |
|||||||
|
Cameron et al. 1938 |
rat |
1 |
24,400 |
90 |
24,400 |
|
NL |
60% mortality |
|||||||
|
Cameron et al. 1938 |
rat |
1 |
24,400 |
90 |
|
24,400 |
3 |
60% mortality |
|||||||
|
Kojima and Kobayashi 1973 |
rat |
1 |
15,000 |
150 |
15,000 |
|
NL |
80% mortality |
|||||||
|
Kojima and Kobayashi 1973 |
rat |
1 |
15,000 |
150 |
|
15,000 |
3 |
80% mortality |
|||||||
|
Cameron et al. 1938 |
rat |
1 |
12,200 |
390 |
12,200 |
3 |
100% mortality |
||||||||
|
Carpenter et al. 1976 |
rat |
1 |
8,800 |
240 |
8,800 |
|
NL |
LC50 |
|||||||
|
Carpenter et al. 1976 |
rat |
1 |
8,800 |
240 |
|
8,800 |
3 |
LC50 |
|||||||
|
Smyth et al. 1969 |
rat |
1 |
4,000 |
240 |
4,000 |
|
NL |
16% mortality |
|||||||
|
Smyth et al. 1969 |
rat |
1 |
4,000 |
240 |
|
4,000 |
3 |
16% mortality |
|||||||
|
Bonnet et al. 1979 |
mouse |
1 |
6,940 |
360 |
6,940 |
|
NL |
LC50 |
|||||||
|
Bonnet et al. 1979 |
mouse |
1 |
6,940 |
360 |
|
6,940 |
3 |
LC50 |
|||||||
|
Svirbely et al. 1943 |
mouse |
1 |
5,320 |
420 |
5,320 |
|
NL |
LC50 |
|||||||
|
Reference |
Species |
Sex |
# Exposures |
ppm |
Min |
ppm |
ppm |
ppm |
ppm |
ppm |
ppm |
Category |
Gp Size |
Incidence |
Comments |
|
Toluene |
|
0 |
1 |
2 |
NL |
3 |
AEGL |
|
|
Category |
|||||
|
Svirbely et al. 1943 |
mouse |
|
1 |
5,320 |
420 |
|
|
5,320 |
|
3 |
LC50 |
||||
|
Moser and Balster 1985 |
mouse |
1 |
38,465 |
10 |
38,465 |
|
NL |
LC50 |
|||||||
|
Moser and Balster 1985 |
mouse |
1 |
38,465 |
10 |
|
38,465 |
3 |
LC50 |
|||||||
|
Moser and Balster 1985 |
mouse |
1 |
21,872 |
30 |
21,872 |
|
NL |
LC50 |
|||||||
|
Moser and Balster 1985 |
mouse |
1 |
21,872 |
30 |
|
21,872 |
3 |
LC50 |
|||||||
|
Moser and Balster 1985 |
mouse |
1 |
19,018 |
60 |
19018 |
|
NL |
LC50 |
|||||||
|
Moser and Balster 1985 |
mouse |
1 |
19,018 |
60 |
|
19,018 |
3 |
LC50 |
|||||||
-
Are there data points that appear to be statistical outliers? Why are they outliers? Should they be considered in the development of AEGL values or discarded because of faulty experimental technique?
-
Does the spread of data points for a particular severity category indicate major differences between species or are the results from different species congruent?
-
Is the time-scaling algorithm reasonable and consistent with the data? For example, using the derived or chosen value of n in the equation Cn×t=k, does the plot of the AEGL-3 values parallel the slope of the lethality data? Similar questions can be asked about the AEGL-1 and AEGL-2 plots.
-
Is there evidence that a different time-scaling factor should be used for the AEGL-2?
-
What are the most appropriate data points to use for the time scaling?


