
APPENDIX D
INTERVIEW GUIDE AND SITE VISIT RESULTS
INTERVIEW GUIDE
Introductory Questions
Please describe in general terms your involvement with the CMAQ program and how that involvement may have changed over time.
Note: Please provide contextual information on the nonattainment area, including population, employment growth, travel trends (VMT growth), nature of the air quality problem (i.e., nonattainment or maintenance area for which criteria pollutants).
CMAQ Program Process and Decision-Making Procedures
-
Who has the primary responsibility for the CMAQ program in your area?
-
What role do the following entities play in project initiation, selection, or evaluation—state transportation department? MPO? state or local transit agency? state or local air agency? local interest groups? FHWA regional/divisional office? EPA divisional office? FHWA headquarters? FTA headquarters? EPA headquarters?
-
How are projects nominated as candidates for CMAQ funding? Is guidance provided regarding project initiation? Where do CMAQ projects come from (e.g., previously programmed but unfunded, especially designed to meet CMAQ program goals)?
-
How are projects selected for CMAQ funding? Is there a formal project selection process? If so, please describe. How is public input obtained? (Please provide written documentation if available.)
-
To what extent does conformity (the need for projects that provide conformity credits) have a bearing on CMAQ project selection? Please elaborate.
-
How are projects evaluated and who conducts the evaluation?
-
Are project-level data collected on changes in travel behavior (e.g., trips, VMT, congestion effects, such as travel time
-
-
delays)? Who collects these data? (Please provide written documentation if available.)
-
Are models and modeling techniques used to estimate travel effects and emission reductions for CMAQ projects? Is this true for all project categories? If not, what other methods are being used? Please describe. Who performs these analyses? (Please provide written documentation if available.)
-
To what extent are secondary project outcomes considered in project selection and evaluation [e.g., factors such as effects on greenhouse gases, ecology, economic development, equity (welfare-to-work initiatives), community livability]? How are these effects measured? Who does the analysis? (Please provide written documentation if available.)
-
How are project costs determined? Who determines them?
-
Who uses the project evaluation information? Have changes been made—for example, in project design or selection—as a result of project evaluations?
-
Reporting requirements
-
Which agency is responsible for reporting information on CMAQ projects to FHWA?
-
What role does your agency play, if any, in collecting this information?
-
What information, if any, is gathered in addition to the reporting data required by FHWA?
-
Should additional information be gathered? reported to FHWA?
-
Would you recommend any changes in the FHWA reporting process? If so, please elaborate.
-
-
Are ex-post project evaluations undertaken to determine whether desired travel changes and emission reductions and other project outcomes have been achieved? (Please provide copies of any such studies or analyses.)
CMAQ Program Objectives
-
What do you see as the primary goal of the CMAQ program?
-
Are there other objectives addressed by the program (e.g., mobility enhancement, community livability)? Please describe.
-
What role does the CMAQ program play in the area’s air quality planning process and conformity requirements for meeting regional air quality goals?
-
How does the CMAQ program fit into local transportation plans and objectives?
-
If CMAQ program funding were not available, would these types of projects be undertaken?
-
If so, what funding sources would be used?
-
Would project delays be likely?
-
If not, why not?
-
Are there particular types of projects that would not likely be funded without the CMAQ program? What would be the impact on regional air quality or other program objectives if these projects were not undertaken? Please explain.
-
-
In your opinion, which types of CMAQ projects come closest to achieving program goals of reducing mobile source emissions and improving air quality? Why?
-
In your opinion, which projects are most effective in reducing congestion? Why?
-
Is cost-effectiveness a criterion in selecting CMAQ projects for funding? How important a criterion relative to the others?
-
In your opinion, which types of CMAQ projects are most cost-effective? Why?
-
Please comment on the cost-effectiveness of CMAQ projects relative to other control strategies for reducing pollution (e.g., vehicle technology improvements).
CMAQ Program Evaluation
-
What do you see as the main strengths of the CMAQ program?
-
What do you see as the main program weaknesses?
-
What effects, if any, has the program had on agency or interagency decision making? What changes, if any, should be made in program implementation? Please elaborate.
-
Do you think the CMAQ program should be continued in the next reauthorization of TEA-21? If so, please elaborate on the reasons.
-
Do you think the scope of the program should be broadened to include additional types of projects? additional pollutants of concern
-
(e.g., air toxics)? If so, please elaborate. If CMAQ funding were to remain constant at current levels, would you still support broadening the program scope? Please explain.
-
If you could change the program, what are the two or three key changes you would make?
ALBANY SITE VISIT
Introduction
The Capital District area includes the metropolitan areas of Albany, Rensselaer, Saratoga, and Schenectady Counties. The region is designated a marginal nonattainment area for ozone, although it has not been in violation of the ozone standard for several years now. Formal redesignation as a maintenance area will be sought, but contingency measures to include in a maintenance plan have not yet been identified.
The Capital District area is a midsized metropolitan area, with a current population of approximately 800,000 according to the Capital District Regional Planning Commission (CDTC 2000, 8). Population, number of households, and employment are estimated to increase by approximately 4, 7, and 2 percent, respectively, between 2000 and 2015, indicating a slow-growth area (CDTC 2000, 8). Travel growth is expected to increase somewhat more rapidly, with average daily vehicle miles traveled (VMT) and peak-hour VMT both rising by 17 percent between 2000 and 2015 (CDTC 2000, 17). Transit accounts for 2 percent of total travel and 4 percent of work travel in the region. Transit ridership increased 4 percent in 1999, reversing a history of declining ridership. It is too early to tell whether the upswing in ridership will continue.
CMAQ Program Process and Decision-Making Procedures
The Capital District Transportation Committee (CDTC)—the metropolitan planning organization (MPO)—has the primary responsibility for programming CMAQ funds in the Albany area. New York State (NYS) has a decentralized process for managing the CMAQ program. The NYS Department of Transportation (NYSDOT) allocates funds to eligible nonattainment and maintenance areas by NYSDOT region using the same formula by which national-level
CMAQ funds are allocated to the state. By this metric, the Capital District Area typically receives about 4 percent of NYS’s annual CMAQ allocation—between $4 million and $5 million each year.1
CDTC does not have a separate process for identifying, selecting, and programming CMAQ projects. CMAQ is one funding source among several [e.g., National Highway System funds, Surface Transportation Program (STP) flexible and urban funds] that are used to fund projects included in the area’s 5-year Transportation Improvement Program (TIP). That being said, the area has a rigorous process for identifying programming priorities and selecting individual projects for inclusion in the TIP—the outgrowth of an exhaustive long-range planning process that resulted in the adoption of a long-range Regional Transportation Plan (RTP) in March 1997 (CDTC 1999, 21–25). The “New Visions Plan,” as it is known, calls for a balanced transportation system that emphasizes preservation over new capacity, links transportation with land use, and provides for modes other than cars. Budgets for some 17 project categories are defined, and individual projects are selected within categories for inclusion in the TIP on the basis of merit (with a heavy emphasis on cost–benefit analyses), adjusted by other considerations, such as essentiality of facilities and geographic balance (CDTC 1999, 27). CMAQ eligibility and emission reduction estimates are noted for relevant projects, but air quality is not an explicit project selection criterion. That being said, projects that are eligible for and use CMAQ funds must demonstrate emission reduction potential.
The CDTC Policy Board, composed of the chief elected officials of each of the region’s eight cities and four counties, at-large members of the area’s towns and villages, representatives of NYSDOT, the Capital District Transportation Authority (CDTA), the Capital District Regional Planning Commission, the New York State Thruway Authority, the Albany County Airport Authority, the Albany Port District Commission, and advisory members from the Federal Highway Administration (FHWA) and the Federal Transit
Administration (FTA), selects projects for inclusion in the TIP by unanimous consent. In addition to CDTC, the major players involved in proposing and programming CMAQ projects are NYSDOT (Region 1 Office) and CDTA.
CDTC conducts the analytical work for all projects, including CMAQ-eligible projects. In the latter case, for projects that can be modeled, travel forecasts are made on the basis of the CDTC travel demand model [Systematic Traffic Evaluation and Planning (STEP) Model]. Emission reductions for hydrocarbons and nitrogen oxides are then estimated using a postprocessor, which links emission rates from the Environmental Protection Agency (EPA) MOBILE model to the travel model output.2 NYSDOT and CDTA often provide the raw data or preliminary estimates for the travel analysis. NYSDOT collects the project information, including the emission estimates, from all CMAQ-eligible areas in the state and prepares a summary for FHWA.
CMAQ Program Objectives
The primary role of the CMAQ program in the Capital District area, according to those interviewed, is to provide a flexible funding source that enables more projects to be funded in categories that match New Visions priorities. Without CMAQ, the TIP would be even more heavily weighted toward infrastructure renewal projects. Another and related role of CMAQ funds is to enable more experimental projects to be funded (e.g., the on-demand shuttle bus service).
Conformity appears to play a less direct role in programming CMAQ funds, largely because the Capital District area does not have a severe air quality problem. In addition, the New Visions goals, which many CMAQ projects support, are largely compatible with clean air goals.
CDTC has programmed three major types of CMAQ projects between federal fiscal years (FFY) 1995 and 1999, the most recent years of data available (Table D-1). Traffic flow improvements are the major spending category, specifically Intelligent Transportation System (ITS) projects such as the Traffic Management Center and supporting operations (e.g., highway loop detectors, police support for incident management). Shared-ride projects are the next-largest spending category, including park-and-ride lots and a regionwide guaranteed ride home program to support carpool, vanpool, and transit riders. Transit projects are the other major spending category, supporting new on-demand shuttle bus services on major corridors, a transit pass subsidy program, and a bus signal preemption system on a major corridor (Route 5). Bicycle paths, pedestrian improvements (e.g., side-walks), and support for employer rideshare programs are among the other types of projects funded by CMAQ in the last 5 years.
If CMAQ funds had not been available during this period, many projects would not have gone forward, in the judgment of those interviewed. For example, ITS projects would not likely have been funded or would have been significantly delayed; the priority given to area infrastructure renewal would have dominated highway programming decisions had only traditional funding sources been available. More traditional transit projects might have been funded from other funding sources or delayed, but experimental projects like the on-demand
TABLE D-1 CMAQ Program Obligations by Project Category, Capital District Area, Albany, New York, FFY 1995–1999
|
Project Category |
CMAQ Obligations ($) |
Percent of Total Obligations |
|
Traffic flow improvements |
5,652,000 |
53.0 |
|
Shared ride |
3,123,000 |
29.3 |
|
Transit |
1,249,000 |
11.7 |
|
Pedestrian/bicycle |
366,000 |
3.4 |
|
I&M and other |
240,000 |
2.2 |
|
Demand management |
40,000 |
0.4 |
|
Total |
10,670,000 |
100.0 |
|
Source: NYSDOT (1996–2000). |
||
shuttle bus service and new suburban ridership projects would probably not have gone forward in the absence of funding for equipment and operations. Stand-alone bicycle and pedestrian projects probably would not have been undertaken without CMAQ funds, but some could have been funded as part of larger projects using STP funds.
When asked which types of projects were most effective in achieving CMAQ program goals of emission reductions and air quality improvement, traffic operations projects that reduced travel delays, transit projects that supported new ridership, and transportation demand management projects that included pricing incentives were mentioned. Bicycle and pedestrian projects were not as strong from an emission reduction perspective, but they served other goals, such as improved community livability. ITS projects that reduced delays on the system were rated highly from a congestion mitigation perspective, but transit projects were not. From a cost-effectiveness perspective, traffic improvements on congested corridors again ranked highly, but transit projects did not, mainly because of the expense of providing transit service (traditional transit service costs about $3 per passenger trip, shuttle service about $5 per trip, and paratransit service about $16 per trip). In making these judgments, all of the respondents noted the uncertainty of emission estimates, particularly for smaller projects, and the absence of postproject evaluations to determine whether emission forecasts had been realized.3
NYSDOT believes that the most cost-effective strategies for reducing emissions are those that affect large numbers of highway vehicles, such as vehicle technology improvements, inspection and maintenance programs, and changes in fuel composition.
CMAQ Program Evaluation
The main strengths of the CMAQ program are its flexibility and its innovative focus. The availability of flexible funds has enabled the Capital District to achieve its planning goals for a balanced transportation system with small shifts in spending priorities. The extra
funding and the specific focus areas of CMAQ, which do not compete with infrastructure renewal and maintenance projects that tend to dominate older areas like the Capital District, have enabled the area to experiment and undertake innovative projects.
One of the primary weaknesses of the CMAQ program is the uncertainty regarding the effects of projects, particularly small projects, on area emissions and air quality. This problem is magnified in an ozone nonattainment area, because the nature of the ozone problem and hence its solutions tend to be regional rather than local. More follow-up and evaluation of projects are needed. Given the methodological complexity and expense of such evaluations, however, the respondents recommended that FHWA take a more proactive role in determining project effectiveness and cost-effectiveness. On the basis of national experience, FHWA could even predetermine categories of projects from the perspective of their emission reduction potential and cost-effectiveness rather than require local justification for every project.
All those interviewed thought that the CMAQ program should be continued, and funding increased if possible, when the Transportation Equity Act for the 21st Century (TEA-21) is reauthorized. The scope of the program should be broadened to include whatever pollutants are regulated at the time. With regard to project eligibility, NYSDOT staff believed that all projects that can demonstrate emission reductions should be eligible for CMAQ funding. CDTA supported keeping current eligibility requirements and only expanding them if a clear air quality benefit is evident.
In summary, the respondents’ major suggestion for change, in addition to more program funding, was increased guidance from FHWA, drawing on national experience concerning which projects are most effective and most cost-effective. One process-related change was mentioned—electronic reporting—to ease data collection by the state and summary reporting to FHWA.
Organizations and Persons Interviewed—July 10, 2000
Capital District Transportation Commission
John Poorman, Staff Director
Chris O’Neill, Senior Transportation Planner
New York State Department of Transportation
John Zamurs, Head, Air Quality Section, Environmental Analysis Bureau
New York State Department of Transportation, Region 1 Office
Jeffrey Marko, P.E., Associate Transportation Analyst
Robert Hansen, P.E., Regional Capital Program Coordinator
Robert Falcone, Senior Transportation Analyst
Capital District Transportation Authority
Kristina Younger, Manager for Planning
CHICAGO SITE VISIT
Introduction
The Chicago Area Transportation Study (CATS) is the designated MPO responsible for transportation planning in Northeastern Illinois. The counties served by CATS include Cook, DuPage, Kane, Lake, McHenry, Will, and parts of Kendall. According to the 1990 census, 7.3 million people reside in the region, 3.8 million of whom are employed, and 33 Fortune 500 companies have located their headquarters there. By 2020, the region’s population is expected to grow by nearly 25 percent to 9.0 million; 1.5 million additional people will be employed in the region; and the number of households is expected to increase by 31 percent to 3.4 million (CATS 2000a). Most of this growth is expected to occur in suburban areas, though the city of Chicago is slowly reversing a declining population trend.
The transportation system in the region comprises 23,903 miles of streets and highways, including 4,264 miles of Interstates, freeways, and principal and minor arterials. The region houses the second-largest transit system in the country and the third-largest bus system. CATS estimates that 22 million trips are made every day in the region and that 1,100 freight trains and 36,000 rail cars move 2.5 million tons of freight through the area on a daily basis (CATS 2000a). Automobile person trips are expected to increase by about 46 percent between 1996 and 2020, while transit trips are expected to increase by nearly 15 percent. Total network VMT is projected to increase by more than 26 percent between 1999 and 2020.
The Northeastern Illinois region is classified as a severe nonattainment area for ozone and receives approximately $70 million annually
in CMAQ funding under TEA-21. In FY 2001, CATS considered 170 project proposals for a projected total cost of nearly $200 million.
CMAQ Program Process and Decision-Making Procedures
The first step in the CMAQ programming process in Illinois is for the Illinois Department of Transportation (IDOT) to allocate CMAQ funding to the designated MPOs in the state. The state allocates CMAQ funding to the MPOs in nonattainment areas by using the same apportionment formula that FHWA uses to apportion CMAQ funds to the states, that is, on the basis of population and severity of the air quality problem. Approximately 97 percent of the allocated funding is provided to CATS in the Northeastern Illinois region, with the remaining funds allocated to the East-West Gateway Coordinating Council in the East St. Louis area.
There is one exception to the process. Under the Intermodal Surface Transportation Efficiency Act (ISTEA) and TEA-21, prior to the distribution of CMAQ funds to the MPOs, IDOT had reserved funds to finance an inspection and maintenance (I&M) program in the state’s nonattainment areas. Under ISTEA, IDOT programmed $45 million in CMAQ funds for development of the Illinois Environmental Protection Agency’s (IEPA) enhanced I&M program. Under TEA-21, it programmed an additional $80 million for operation of the enhanced I&M program.4
CATS has primary responsibility for programming CMAQ projects in the Northeastern Illinois area.5 IDOT administers the implementation of programmed projects. The staff of CATS begins the CMAQ process in January of each year by issuing a call for projects. Between
7,000 and 8,000 mailings are distributed to all relevant constituencies, private citizens, and all pertinent governmental bodies. The primary governmental operating agencies that participate in the CMAQ process and propose projects are IDOT, IEPA, the Chicago Transit Authority (CTA), Metra (commuter rail), Pace (suburban bus), the city of Chicago, counties, and 270 municipalities. CATS has made a concerted effort to ensure that all eligible parties are able to participate in the process. For example, CATS routinely provides staff support to 11 subregional councils in an effort to assist local governments in project development.
Nongovernmental entities are also encouraged to participate in the process, although they are required to obtain a government sponsor for their project before submitting a proposal to CATS. Neither CATS nor the interest groups interviewed for this case study felt that this provision inhibited project submittals. In fact, the Chicagoland Bicycle Federation has made partnering with government agencies a key tenet of its organizational strategy.
The most common types of CMAQ projects implemented over the years in the Northeastern Illinois region include transit improvements (commuter rail, rapid transit, and bus projects), commuter parking, traffic flow improvements, signal interconnects, and the enhanced I&M program. (Table D-2 shows CMAQ obligations since the inception of the program, and Table D-3 shows CMAQ obligations for the most recent 5 years.) All federally eligible projects, including transit improvements, commuter parking, traffic flow improvements, signal interconnects, bike and pedestrian facility projects, bike parking and bike encouragement projects, and other projects designed to meet regional congestion and air quality goals, are considered by the CMAQ Project Selection Committee.
The CMAQ Project Selection Committee has also approved a number of demonstration projects (CATS 2000b). Demonstration projects are typically characterized as innovative projects for which the data are unavailable to estimate emission reductions. As a requirement for approving a demonstration project, CATS typically requires that a study be conducted in conjunction with the project to help ascertain emission reductions in the future. The car-sharing project, sponsored
TABLE D-2 CMAQ Program Obligations, Northeastern Illinois, FFY 1992–2000
|
Program Category |
Federal ($) |
Total ($) |
Program (%) |
|
Signals/congestion improvements |
42,766,369 |
56,405,103 |
11.59 |
|
Transit improvements (total) |
193,045,686 |
244,818,067 |
50.28 |
|
Rapid transit improvements |
70,150,400 |
87,188,000 |
17.91 |
|
Rapid transit expansion |
5,360,000 |
6,700,000 |
1.38 |
|
Bus route improvements |
9,663,560 |
12,079,500 |
2.48 |
|
Bus replacements |
26,499,033 |
33,123,791 |
6.80 |
|
Transit transfer improvements |
2,392,845 |
2,991,056 |
0.61 |
|
Commuter rail/parking |
49,723,848 |
66,165,720 |
13.59 |
|
Metra/North Central service |
29,256,000 |
36,570,000 |
7.51 |
|
Vanpools |
12,300,000 |
12,425,000 |
2.55 |
|
Intermodal improvements |
2,100,000 |
5,201,500 |
1.07 |
|
Demonstrations |
8,168,379 |
11,304,873 |
2.32 |
|
Bike/pedway improvements |
16,627,821 |
21,085,786 |
4.33 |
|
Enhanced I&M |
102,126,000 |
127,657,500 |
26.22 |
|
Regional programs |
6,345,400 |
7,892,750 |
1.62 |
|
Total |
383,479,655 |
486,790,579 |
100.00 |
|
Source: Data compiled by CATS. |
|||
TABLE D-3 CMAQ Program Obligations, Northeastern Illinois, FFY 1996–2000
|
Program Category |
Federal ($) |
Total ($) |
Program (%) |
|
Signals/congestion improvements |
29,624,656 |
39,166,784 |
13.82 |
|
Transit improvements (total) |
101,232,953 |
130,606,215 |
46.09 |
|
Rapid transit improvements |
57,083,200 |
71,354,000 |
25.18 |
|
Bus route improvements |
6,448,100 |
8,050,150 |
2.84 |
|
Transit transfer improvements |
140,845 |
176,056 |
0.06 |
|
Commuter rail/parking |
37,560,808 |
51,026,009 |
18.01 |
|
Vanpools |
8,300,000 |
8,425,000 |
2.97 |
|
Bike/pedway improvements |
4,270,910 |
5,193,861 |
1.83 |
|
Enhanced I&M |
72,126,000 |
90,157,500 |
31.82 |
|
Demonstrations |
2,050,000 |
3,089,000 |
1.09 |
|
Regional programs |
5,398,400 |
6,709,000 |
2.37 |
|
Total |
223,002,919 |
283,347,360 |
100.00 |
|
Source: Data compiled by CATS. |
|||
by the city of Chicago and the Center for Neighborhood Technology, is an example of such a demonstration project.6
Completed project proposals are submitted to CATS in March of the same year. Before finalizing proposals, all applicants are encouraged to scope the project thoroughly (i.e., engineer the project in accordance with federal design standards). In addition, all project submittals (except demonstrations) must include data on anticipated changes in travel conditions or traveler behavior (e.g., changes in intersection delay, or expected trips eliminated or diverted to nonhighway modes). All project submittals must include project costs; detailed estimates are requested. The cost estimates of local agencies submitting project proposals are reviewed by IDOT engineers for reasonableness. A mechanism has been established to assist projects that require additional funding in subsequent years. However, to be eligible for these funds and to discourage deliberate “low-balling,” a project will be reranked and selected for additional funding only if the project ranks (at the new cost level) higher than the projects not previously selected. Finally, a local match of 20 percent of the project total is required for most projects. Some sponsors provide more than the required match.
Between March and August, the staff of CATS reviews and ranks all projects. Sponsors are contacted as needed for additional information. Projects are ranked by dollars per ton of volatile organic compounds (VOCs) reduced, dollars per 1,000 VMT reduced, dollars per 1,000 single-occupant vehicle (SOV) trips eliminated, and dollars per ton of nitrogen oxides (NOx) eliminated. Project Selection Committee members and staff agreed that the primary factor in ranking CMAQ projects is and should be the ability of a project to reduce VOCs.7
|
6 |
Car-sharing originated in Europe and has quickly spread to Canada and several cities in the United States. Essentially, individuals forgo automobile ownership in favor of paying a nominal fee for the right to use an automobile as necessary. A study by the Swiss Office for Energy Affairs indicates that car owners who switch to car-sharing reduce their driving by more than 70 percent. (See website—http://www/carsharing/net—for more information.) |
|
7 |
The Chicagoland Bicycle Federation suggested that in the future both dollars per ton of VOCs reduced and dollars per 1,000 SOV trips eliminated be the primary criteria for evaluating CMAQ projects. |
Projects are ranked within their project category; projects are not ranked across categories. All interviewed felt that this was a fair and acceptable method for ranking projects. This method does not ensure that the most cost-effective projects will be implemented; rather it ensures that the most cost-effective projects within a particular category will be implemented. CATS staff holds that it is not possible to compare the results of different methodologies employed for different project categories to arrive at a valid cost-effectiveness ranking across all projects.
Project evaluation methodologies are reviewed and approved by the CMAQ Project Selection Committee. CATS has received considerable input on methodology development, particularly from area interest groups, who formed an environmental coalition to help shape the development of the CMAQ program in the Northeastern Illinois region.8 The Chicagoland Bicycle Federation noted that evaluation methodologies used to rank projects in other states frequently are biased against bicycle and pedestrian projects and recommended that the U.S. Department of Transportation provide guidance on appropriate and equitable methodologies for quantifying emission reductions for this project category.
After the staff of CATS has reviewed and ranked the proposals, this information is submitted to the CMAQ Project Selection Committee, which reviews the package. Six organizations are represented on the CMAQ Project Selection Committee: IDOT, IEPA, the Council of Mayors, the Regional Transportation Authority (RTA),9 the counties (the seven counties select one representative), and the Chicago Department of Transportation. CATS serves as the chair of the committee, voting only to break a tie vote (to date, CATS’s vote has not been required since the committee operates on a consensus basis). At this point in the process, additional factors such as geography, mix of projects, and project
readiness are considered as the committee develops a list of recommended projects.
Using the rankings and the other information available, the staff develops a recommended program in consultation with the CMAQ Project Selection Committee. The CATS Work Program Committee then releases the program for a public comment period, typically extending 30 days. In addition to soliciting input on the current year’s package, the release serves as a public education tool for the next year’s submittals.
After comments are considered, the package is forwarded to the CATS Work Program Committee, which, together with the CATS Policy Committee, must approve the recommended CMAQ program. The Work Program Committee is composed of a representative from each of the 20 agencies on the Policy Committee and six additional members. It is charged with resolving any disputes and formulating funding recommendations before review of the proposed package by the Policy Committee.
The Policy Committee is officially vested by the governor of Illinois and local elected officials with authority for all decisions concerning regional transportation plans and programs for Northeastern Illinois. Generally, the Policy Committee approves the proposed program in December. FHWA must then find programmed projects eligible for CMAQ funding. The process from start to finish is completed on a 12-month calendar year cycle.
While it is the policy of CATS not to predetermine a quota of projects for each category, many participants interviewed for the case study noted that the process works because everyone is assured a “slice of the pie.” The CMAQ Project Selection Committee attempts to balance the program by type of project and geography. All eligible projects with a governmental sponsor are considered. However, the year-to-year program has varied widely by geography and project type. Bicycle and pedestrian projects, for example, have historically received approximately 7 percent of the allocated funding, but have varied from having only cost increases approved for previously funded projects to making up more than 10 percent of the program. Although interest groups are not formally represented on the CMAQ Project Selection or CATS Work Program or Policy Committees, they are
actively involved in the various task forces. The coalition of interest groups, for example, strongly advocated and were successful in ensuring that dollars per ton of VOCs eliminated, dollars per 1,000 trips eliminated, and dollars per 1,000 VMT eliminated be considered as the CMAQ project evaluation criteria. The coalition also encouraged the inclusion of IEPA in the membership of the CMAQ Project Selection Committee. In sum, those interviewed generally found the CMAQ project selection process inclusive and the results satisfactory, despite annual variations in project selection.
Conformity requirements drive the project selection process, insofar as high-ranking projects are more likely to be selected than low-ranking projects, taking into account project readiness, feasibility, and coordination requirements. In addition, the CMAQ program has provided funding critical to meeting mobile source emission budgets through the enhanced I&M program. The CMAQ-funded I&M program allowed approximately a 30 ton per day credit for the region’s 1999 Rate of Progress State Implementation Plan (SIP) mobile source emissions budget of 200 tons per day. Other transportation control measures (TCMs), largely CMAQ-funded, provided another 2 tons per day in credits. As more CMAQ-funded projects are added to the SIP, the TCM contribution will grow.10 However, during the project selection process, there are few projects—the I&M program being the major exception—that can be regarded individually as critical to conformity. Thus, the impact of the CMAQ program as a whole on conformity is important, but the impact of individual TCM projects is usually minimal.
Secondary criteria, such as community livability and economic development, generally receive only cursory consideration in the project selection process. In fact, several of the representatives interviewed questioned whether a project’s ability to serve as a catalyst for economic development should weigh positively or negatively in ranking the project. In some cases secondary effects are important in building stakeholder support for particular projects.
However, the overarching theme emerging from those interviewed is that the region’s primary criterion for CMAQ project selection remains elimination of VOCs.
Postproject evaluations are conducted for certain categories of projects, and the information obtained is factored into the decision-making process for selecting and evaluating the merits of projects in subsequent years. Postproject evaluations are the weakest area of the process, however, because attributing reductions in emissions to a particular source or project is difficult. The methods sometimes require complex statistical analyses and often must accommodate rapidly changing travel patterns.
IDOT is responsible for reporting the results of the CMAQ program to FHWA. All information reported by the state is received directly from CATS. Neither CATS nor IDOT thought that the current reporting requirements should be modified.
CMAQ Program Objectives
When asked whether congestion mitigation or air quality was the primary goal of the CMAQ program, there was a slight divergence in the respondent’s answers. The representatives from the American Lung Association, the Chicagoland Bicycle Federation, and IEPA all stated that the objective of the program is to improve air quality, whereas the representatives from RTA tended to focus on congestion mitigation. Staff from CATS, IDOT, the city of Chicago, and the Council of Mayors’ Executive Committee noted that while the goal of the program is to reduce emissions, the most viable means for achieving air quality is through congestion mitigation. Participants also agreed that an indirect benefit of the CMAQ program is the ability to heighten the public’s awareness regarding air quality through education and focused campaigns.
As with many areas, the availability of CMAQ funds provides the region with the ability to enhance its transportation system and to develop alternatives to SOV travel. It was the general consensus of those interviewed that if CMAQ funding were no longer available, some projects would be maintained and funded via alternative sources of funding, others would be substantially delayed in implementation, and still others would be terminated (e.g., marketing/education cam-
paigns). It should be noted that in cases where alternative funding sources exist, particularly for transit and traffic flow improvements, the demands for rehabilitation needs in the area are and will continue to be significant, making it unlikely that many of the improvement projects would be funded. Projects that use CMAQ funding as leverage to obtain additional sources of funding could also be jeopardized. For example, CMAQ funding was a critical component of the Metra North-Central rail line, a new commuter rail line serving Chicago’s northern suburbs; many have questioned the viability of this project if CMAQ funding had not been available. It is also worth noting that the majority of participants interviewed believed that bicycle and pedestrian projects would be maintained, albeit slightly reduced in number, if CMAQ funding were not available. However, the Chicagoland Bicycle Federation representative reiterated that CMAQ funding was and is crucial to the development and implementation of bicycle and pedestrian projects.
CMAQ Program Evaluation
Interestingly, the two primary strengths of the CMAQ program identified by case study participants appear also to contribute significantly to the program’s chief weaknesses. Specifically, case study participants lauded the consensus process used by CATS in selecting projects and the ability to implement diverse and innovative projects using CMAQ funding as the primary benefits of the program. On the other hand, the most frequent complaint cited by case study participants was the resulting “scattering of projects” and seeming lack of a central plan or long-term vision for the Northeastern Illinois region. Several implementing agency representatives also cited the desire to have the opportunity to fund larger, long-term projects, while representatives from interest groups argued that for the region to be truly effective in achieving air quality goals, land use considerations must be incorporated into the CMAQ process. All participants, however, agreed that the process created and used by CATs was effective in fostering interagency partnerships, bringing “new players to the table,” and ensuring an equitable distribution of funds. In addition, the city of Chicago noted that CMAQ served as a catalyst for improving cooperation between
the city and the suburbs in what formerly was often characterized as a divisive relationship.
In conclusion, it is apparent that all participants in the CMAQ process in Northeastern Illinois remain cognizant of the region’s designation as a severe nonattainment area for ozone and consequently are focused and fairly united in using CMAQ funds to help achieve the region’s air quality goals. All participants endorsed the inclusion of the CMAQ program in the reauthorization of TEA-21, and most responded with skepticism to the notion of broadening the scope of the program to include new projects or additional pollutants of concern. As one participant stated, “We barely understand VOCs; we need to stay focused.”
Several of the case study participants did, however, have suggestions for improving and refining the current CMAQ program. While additional funding topped everyone’s list, other suggestions ranged from expanding the ability to fund operating expenditures from 3 years to 6 years, particularly for the I&M program, to barring the state’s ability to use CMAQ funding for the I&M program. Some participants wished to insert additional flexibility into the program to allow for the funding of bottleneck relief projects that could result in slight increases in capacity (e.g., auxiliary lanes), while others suggested making these improvements ineligible for CMAQ funds. RTA recommended strengthening the role of FTA in the program so that CMAQ-funded highway and transit projects would complement rather than compete with each other. They recommended structuring the program along the lines of the ITS program, that is, having FHWA and FTA jointly administer the program in a cooperative manner. The city of Chicago expressed a desire for Congress to reconsider the need for nonprofits and private entities to obtain government sponsors to be eligible to apply for CMAQ funds. Specifically, the city has experienced a significant administrative burden associated with overseeing nongovernmental agency projects and has questioned whether the current process was cost-effective.11
Organizations and Persons Interviewed August 16–17, 2000
Members of the CMAQ Project Selection Committee are indicated with asterisks.
Chicago Area Transportation Study
Martin Johnson, Associate Executive Director*
Donald Kopec, Deputy for Programming
Patricia Berry, Director of the Transportation Improvement Program
Tom Murtha, Chief of the CMAQ Program
Regional Transportation Authority
Richard Bacigalupo, Executive Director
John DeLaurentiis, Director of Planning
Mark Pitstick, Manager, Program Support*
Sidney Weseman, Manager, Systems Planning
Illinois Department of Transportation
Carla Berroyer, Chief, Bureau of Urban Program Planning*
Illinois Environmental Protection Agency
Mike Rogers, Environmental Specialist (by telephone)
American Lung Association
Brian Urbaszewski, Director, Environmental Health Programs
Chicagoland Bicycle Federation
Randy Neufeld, Executive Director
Organizations and Persons Interviewed Via Conference Call August 21–22, 2000
Members of the CMAQ Project Selection Committee are indicated with asterisks.
Council of Mayors Executive Committee
The Honorable Jeffery Schielke, Mayor of the City of Batavia*
City of Chicago
John Tomczyk, Director of Planning and Programming Division
Luann Hamilton, Director of Transportation Planning*
WASHINGTON, D.C., SITE VISIT
Introduction
The Washington metropolitan nonattainment area is a complex group of jurisdictions, including several cities, 10 counties, 2 states—
Virginia and Maryland—and the District of Columbia (the District).12 The region is currently designated a serious nonattainment area for ozone, with mobile source emission budgets for both VOCs and NOx. The 2000 update to the area’s long-range plan and the FY 2001–2006 TIP conform to the requirements of the 1990 Clean Air Act Amendments (CAAA). The attainment year is 2005.13 However, recent updates in the vehicle data inputs to the conformity determination indicate that area NOx emissions will exceed emission budgets in 2005. Amendments to the long-range plan and the FY 2002–2007 TIP have been put on hold as the area attempts to identify measures to close the gap.
The Washington metropolitan area is experiencing rapid growth. From 2001 to 2025, population is expected to increase by 31 percent from its current level of 4.2 million, and the number of households is expected to increase by 31 percent, on the basis of forecasts developed through a Cooperative Forecasting Program administered by the Metropolitan Washington Council of Governments (COG) (COG 2000b).14 By 2025 regional employment is expected to grow by 41 percent from the 2000 employment base of 2.7 million, with the greatest growth during the 2000 to 2005 period, when 55,000 new jobs per year on the average are anticipated (COG 2000b). Travel projections to 2025 indicate that travel will increase much more rapidly. Vehicle trips are estimated to increase by 38 percent, VMT by 46 percent, number of vehicles by 38 percent, and transit work trips by 18 percent (COG 2000a).
CMAQ Program Process and Decision-Making Procedures
CMAQ funds come to the Washington metropolitan area from Virginia, Maryland, and the District. Virginia suballocates its CMAQ funds to in-state nonattainment and maintenance areas using the same formula by which national-level CMAQ funds are allocated to the state. Maryland does not suballocate its CMAQ funds by any specific formula. Rather, statewide project needs are reviewed annually before any CMAQ funding allocation. The District, which operates as a state with respect to the CMAQ program, retains all the funds it receives. Currently, the Washington metropolitan area receives $20 million to $25 million annually in CMAQ funds.
There is no regional CMAQ program or process as such in the Washington metropolitan area in the sense that CMAQ funds are pooled and projects identified, selected, and programmed regionwide for CMAQ funding. In fact, each of the three jurisdictions that receive CMAQ funding—Virginia, Maryland, and the District—has its own process for deciding which projects to fund with CMAQ dollars. Virginia has the most decentralized process. In 1992 the state created the Transportation Coordinating Council (TCC) of Northern Virginia to program CMAQ and Regional STP funds.15 TCC of Northern Virginia, which programs CMAQ funds, has an annual solicitation for the CMAQ program. A technical committee reviews project proposals, and public input is sought through a Citizens Advisory Committee before the annual program is finalized.
In comparison, Maryland has a very centralized approach, mirroring the strong state role in funding and programming both highway and transit projects. The state has adopted a unified trust fund approach, whereby all federal funds are pooled in a trust fund; CMAQ is one of many funding sources. The Maryland Department of Transportation (MDOT) has the primary responsibility for the CMAQ program. The
state’s selection process for CMAQ projects is the same as that for all other transportation projects. MDOT in conjunction with its modal agencies, the State Highway Administration and the State Mass Transit Administration, selects projects for CMAQ funding after two reviews—the first with the county staff and the second with elected officials and the public—before final project programming. After review of the input of county staff and elected officials, MDOT makes the final project selection. The District determines its funding priorities for CMAQ largely in-house through the Department of Public Works, District Division of Transportation.
The three jurisdictions forward their recommended lists of CMAQ and other transportation projects to the MPO for the Washington metropolitan area—the National Capital Region Transportation Planning Board (TPB). Designated by the governors of Maryland and Virginia and the mayor of the District of Columbia as the area MPO, TPB is staffed by the Department of Transportation Planning of COG.16 TPB programs the recommended projects for inclusion in the TIP.
A major exception to this general process is the treatment of a group of largely CMAQ-funded projects called Transportation Emission Reduction Measures (TERMS). In the 1990s the major jurisdictions and interest groups in the Washington metropolitan area embarked on a collaborative process to identify and fund projects to help the area meet the conformity requirements of the CAAA. A technical committee conducted a rigorous review of possible regional TCMs from the perspective of VMT and trip reduction potential, related emission reduction potential, and cost-effectiveness (FHWA 1995). A funding mechanism was also established. When TERMS are needed to meet conformity requirements for the area to stay within SIP budgets, projects are selected that rank highest on the list on the basis of their emission reduction potential and cost-effectiveness, and each state commits the necessary funds. Virginia and the
District have chosen to use CMAQ funds to finance their share; Maryland uses state funds, because its CMAQ funds typically are already programmed for other purposes.
The area jurisdictions do not have formal ranking systems for selecting among and evaluating projects for CMAQ funding, with the exception of the TERMS. For example, the technical staff of the TCC of Northern Virginia considers such criteria as emission reduction potential, project continuations, and the seven ISTEA planning factors (e.g., intermodalism) in evaluating projects, but the criteria are not used to rank individual projects. The District considers emission reduction potential and project readiness in its selection and evaluation of CMAQ projects, but there is no formal rating scheme. Maryland considers project acceptability by elected officials and the public and emission reduction potential in selecting and evaluating projects for CMAQ funding, but there is no formal project ranking system. The Washington Metropolitan Area Transit Authority (WMATA), the major transit provider in the region, also has an informal process for recommending projects for CMAQ funding. Its primary concerns are capital needs identified in its own capital budget and service amenities, which may be CMAQ-eligible, that support transit ridership in the region. WMATA is involved in the process of project selection only through TCC in Northern Virginia; it has little or no contact with the District or MDOT concerning their selection and evaluation of transit projects for CMAQ funding.
Conformity plays a major role in selecting projects for CMAQ funding. When additional mobile source measures are needed to keep the area in conformity, the highest-ranking TERMS are selected from a candidate list and, as preagreed in Virginia and the District, CMAQ is used to fund these projects. Maryland finances its TERMS using state funds.17
Air quality improvement is the primary criterion for selecting among TERMS and other TCMs, but secondary considerations are also taken into account, at least in an informal way. For example, the
District examines how projects fit into the long-range transportation vision developed for the Washington metropolitan area (COG 1999).18 Northern Virginia takes into account quality-of-life issues in its project selection. Maryland considers social and economic as well as environmental aspects of CMAQ projects, as it does for any transportation project the state is developing. The state also looks at the benefits of CMAQ projects in reducing congestion. Finally, WMATA considers economic development, access, and affordable transit as important factors in evaluating projects for CMAQ funding.
Generally, the jurisdictions that recommend projects for CMAQ funding provide the initial information to TPB on projected effects on trips and VMT, project costs, and emission reductions.19 With regard to the latter, the jurisdictions use a consistent methodology, developed at COG/TPB, to evaluate the pollution reduction potential of the TERMS. COG/TPB handles both the travel and emission estimates for the evaluation of the TERMS. A regional demand model is used to estimate travel effects and emission factors from the MOBILE model (employing postprocessing techniques) to project pollutant reductions. Each of the jurisdictions is responsible for providing FHWA with the required annual information on CMAQ-funded projects, including estimates of emission reductions. The survey respondents did not recommend any changes in the reporting process, with the exception of Maryland, which recommended that project emission reductions be reported in tons per day rather than in kilograms per day, as is now required.
Some ex-post evaluations of CMAQ-funded projects have been conducted by COG/TPB. These are typically the large TERMS, such as the Regional Commuter Connection program, which involves employer outreach, guaranteed ride home, telework resource centers, integrated rideshare, and a commuter operations center. WMATA is planning to conduct an evaluation of a bus signalization project on
Columbia Pike; ITS funds will be used to fund the evaluation. The small scale of many CMAQ projects (with emission reductions on the order of 0.001 tons per day), however, raises concerns about the cost-effectiveness of conducting extensive ex-post project evaluations.
CMAQ Program Objectives
Those interviewed saw the CMAQ program mainly as an air quality program. Its primary role is to help the Washington metropolitan area stay in conformity and, by so doing, help improve regional air quality. The respondents differed, however, in terms of how this could be accomplished. Some viewed congestion mitigation and highway projects that remove bottlenecks or improve the efficiency of traffic flow [e.g., traffic signalization projects, high-occupancy vehicle (HOV) lanes to reduce SOV travel] as effective ways of reducing pollution. Others thought that the benefits of such projects are short term; freer-flowing highways will simply fill up again with traffic. They saw the goal of the program as providing alternatives to highway travel, such as better transit. Their perception was that the CMAQ program should not be used for highways and congestion relief. Most of those interviewed sought more federal guidance on what is an appropriate program balance between highway and nonhighway projects.
Over the past 5 years (FY 1995–1999), the Washington metropolitan area has used its CMAQ funds primarily to support transit projects (e.g., bus replacements) and traffic flow improvements (e.g., traffic signalization projects, HOV lanes) (see Table D-4). Priorities, however, differ by jurisdiction. The District spends the largest share of its CMAQ funding on transit (69 percent), followed by demand management projects (10 percent) and the I&M program and other projects (11 percent). Virginia spreads its funds among several different project categories with the largest expenditures for transit (64 percent) followed by traffic flow improvements (e.g., signalization projects) (23 percent). Maryland has concentrated its CMAQ spending in three main project categories. Traffic flow improvements (e.g., signalization projects, HOV lanes, and ITS projects) and transit accounted for 46 percent and 42 percent of spending, respectively, over the past 5 years. Shared-ride projects accounted for another 12 percent.
TABLE D-4 CMAQ Program Obligations in the Washington Metropolitan Area by Jurisdiction and Spending Category, FY 1995–1999
|
Project Category |
Jurisdiction (%) |
Regional Total (%) |
||
|
District |
Maryland |
Virginia |
||
|
Traffic flow improvement |
0 |
46 |
23 |
26 |
|
Transit |
69 |
42 |
64 |
59 |
|
Shared ride |
7 |
12 |
3 |
6 |
|
Demand management |
10 |
0 |
5 |
4 |
|
Pedestrian/bike |
3 |
0 |
4 |
3 |
|
Other |
11 |
0 |
1 |
2 |
|
Total |
100 |
100 |
100 |
100 |
|
Sources: Data provided by the District of Columbia Department of Public Works, the TCC of Northern Virginia, and MDOT. |
||||
According to those interviewed, if CMAQ funds had not been available during this period, projects that were necessary to meet conformity requirements would have gone forward using other funding sources. However, this could have delayed other highway and transit projects.20 Other projects that were required by the CAAA, such as the District’s I&M program, and certain bicycle and pedestrian projects that had strong public interest group and community support, also would probably have gone forward using other funds. In the judgment of many of those interviewed, projects without obvious alternative funding sources, such as the Commuter Connections program and regional integrated ridesharing, probably would not have been undertaken.21
When asked which types of projects were most effective in achieving CMAQ program goals of emission reductions and air quality
improvement, the following types of projects were mentioned: the TERMS, the District’s I&M program, the telecommuting project,22 projects that reduce SOV travel or get people out of their cars entirely, clean vehicle purchases, new buses and rail cars, park-and-ride lots, and traffic signalization projects (with the exception of increases in NOx emissions from increased vehicle speeds). Projects that would get high-emitting vehicles off the road, such as vehicle scrappage programs, were also viewed as having high emission reduction potential but are not currently eligible for CMAQ funding.
The best projects for congestion relief were telecommuting, traffic signalization projects, projects that use ITS technologies to improve highway efficiency, and projects that encourage use of transit or reduce SOV travel. The Greater Washington Board of Trade also mentioned improving suburb-to-suburb connectivity in the Washington metropolitan area as a key to congestion relief and recommended that CMAQ restrictions on capacity enhancements be lifted to finance such connectors, supported by tolls and buffered by parklands and limited interchanges to reduce public expenditures and potential for sprawl. The Coalition for Smarter Growth, however, feared that such capacity enhancements would lead to sprawl and questioned the longer-term value of projects that improve the capacity of existing roadways from both a congestion and an air quality perspective.
Cost-effectiveness is only considered as a formal selection criterion for the TERMS. However, area jurisdictions do consider cost as one factor in selecting projects for CMAQ funding. In the opinion of those interviewed, the most cost-effective projects were the I&M program, demand management measures such as telecommuting and ridesharing, park-and-ride lots, clean vehicle and clean fuel technologies, and ITS technologies.23 Transit projects were perceived by the staff of the TCC of Northern Virginia to be among the least cost-effective from an air quality perspective but cost-effective from a
congestion mitigation perspective. Of course, when compared with other strategies for reducing pollution, improvements in vehicle technology and fuels were thought to yield the greatest benefits and to be the most cost-effective because all vehicles are affected.
CMAQ Program Evaluation
The main strength of the CMAQ program lies in its provision of a dedicated funding source for transportation projects that improve air quality. Without such a restriction, CMAQ funds would probably be used to finance the region’s large infrastructure preservation needs. Flexibility was also noted as a program strength, and several respondents recommended areas in which the program could be made even more flexible (see below for more details). Some thought that the CMAQ program has encouraged innovative projects. Others, however, did not see CMAQ as a mechanism for stimulating innovation, mainly because the area has so many traditional needs that are CMAQ-eligible.
In the opinion of several of those interviewed, Maryland being a key exception, a critical weakness of the CMAQ program is the significant state role in the program. There is no assurance, for example, that funds will be suballocated to the Washington metropolitan area on the basis of the same criteria—population and air quality status—that were used to allocate the funds to the states in the region. This lack of a regional funding approach is magnified by the lack of a regional process for identifying CMAQ project priorities that uses regional criteria for emission reductions and congestion relief. Finally, Maryland noted as a weakness that there is not enough emphasis on the congestion management part of the CMAQ program.
Because there is no regional CMAQ program as such, many of those interviewed did not think that the program has had much effect on interagency decision making. The exception is the TCC of Northern Virginia, where the state has delegated decision making to the local area. Most of the respondents thought that the federal government should mandate a regional cooperative process as a CMAQ program requirement. The perception is that the CMAQ program can provide a forum for broader involvement of groups, such as air agencies and bicycle and pedestrian interests, in making area transportation
choices. However, this has not happened in the Washington area. The interest groups indicated that opportunities for input into the CMAQ decision-making process come too late for them to make any meaningful contribution. Maryland strongly disagreed with both the characterization of the current process and the recommendation for a federal mandate. According to MDOT, the state reviews and receives input directly on CMAQ and other transportation projects from local government staff and elected officials as well as transit agencies during the programming process. Maryland believes that states should be allowed to self-certify their coordination process with local governments.
All of those interviewed thought that the CMAQ program should be continued when TEA-21 is reauthorized and that the funding should continue to be protected, that is, the focus should continue to be on transportation projects that improve air quality. In fact some of the respondents (COG/TPB, the Coalition for Smarter Growth) thought that the program should be more targeted at projects that reduce VMT and emissions. Others, like WMATA, thought that the regulations should allow projects, such as new station improvements, that may not show new emission reductions but help maintain transit ridership. Restrictions on highway capacity improvements should be kept. The Greater Washington Board of Trade disagreed on the latter point and recommended expanding project eligibility to include capacity enhancement projects, such as the suburban connectors previously discussed.
The majority thought that the program should not be broadened to cover other pollutants, with the possible exception of PM2.5, and then only if funding were increased.24 Maryland thought that other types of pollutants should not qualify for CMAQ funding until the current 1-hour ozone attainment standard is met, but the state supports CMAQ eligibility for any project that measurably reduces ozone precursor emissions. The consensus was that the focus should
be on making the current program better. COG/TPB suggested that, rather than earmarking CMAQ funds for a broad range of pollutants, the federal government ought to be looking at individual pollutant sources and the most cost-effective ways of obtaining emission reductions.
The respondents made several suggestions for changing the program, although not all of the respondents agreed with all of the suggestions. First, many recommended that CMAQ funds be suballocated to nonattainment and maintenance areas within states using the same federal formula that determined the state allocation. Second, many recommended that the federal government require a cooperative regional process for identifying, selecting, and evaluating projects for CMAQ funding. The process should enable air agencies and interest groups to have a greater role in the program.25 Third, program flexibility should be increased. For example, staff of the Northern Virginia TCC thought that limits on the use of CMAQ funds for transit operations should be relaxed.26 Use of funds to support a CMAQ grants manager at the state level should also be considered (a suggestion of the District). Fourth, greater flexibility should come with more extensive and intensive project evaluations to make sure that the funds are being well spent, presumably with federal guidance and funding to prevent burdensome new requirements on local governments. Finally, the federal role in managing the program could be strengthened in the following areas: sharing of information on best practices, ex-post evaluation of projects, guidance on program balance issues (i.e., to what extent the program is an air quality program versus a congestion mitigation program), clear statement of project matching ratios, and an up-to-date national database.
Organizations and Persons Interviewed—September 7–8, 2000
Metropolitan Washington Council of Governments
Ronald Kirby, Director, Transportation Planning
Gerald Miller, Chief, Program Coordination
Mark Pfoutz, Transportation Planner
Government of the District of Columbia, Department of Public Works
Ken Laden, Administrator, Intermodal Planning
Michelle Pourciau, Chief of Transportation and Public Space Planning
Maurice Keyes, Environmental Program Coordinator
Virginia Department of Transportation
Kanathur Srikanth, Senior Transportation Engineer
Maryland Department of Transportation (written response)
Marsha J. Kaiser, Director, Office of Planning and Capital Programming
Washington Metropolitan Area Transit Authority
Richard Stevens, Director, Office of Business Planning and Development
Kathleen Donodeo, Associate Director, Office of Business Planning and Development
Greater Washington Board of Trade
Robert Grow, Staff Director, Transportation and Environmental Committee
Coalition for Smarter Growth
Stewart Schwartz, Executive Director
James Clarke, Consultant, Environment and Transportation Policy
HOUSTON SITE VISIT
Introduction
The Houston-Galveston metropolitan area is designated a Severe-II nonattainment area for ozone, with mobile source emission budgets both for VOCs and NOx. In December 2000, the state air agency, the Texas Natural Resource Conservation Commission, approved the Houston-Galveston SIP, which is designed to bring the eight-county nonattainment area into compliance by 2007. The plan was approved by EPA in October 2001. The area’s long-range Metropolitan Transportation Plan (MTP) and current 2000–2002 TIP conform with the SIP’s rate-of-progress requirements for the region.
The Houston-Galveston metropolitan area is experiencing rapid growth, with substantial projected population and employment increases. From 2000 to 2022, population is expected to grow by 36 percent from its current level of 4.5 million and employment by 29 percent from its current level of 2.4 million, according to forecasts of the Houston-Galveston Area Council (H-GAC) (H-GAC 2000b, 6).27 This projected growth will affect transportation use in the region. Vehicle trips are expected to increase by nearly 40 percent and VMT by nearly 47 percent between 2000 and 2022 (H-GAC 2000b, 11, 14). The major transit provider in the region, the Metropolitan Transit Authority of Harris County (METRO), carries about 5 percent of work trips in the region (METRO 2000b, ES-9). Current estimates show that the mode share is closer to 10 percent of work trips in Harris County, where METRO provides the majority of its service. Transit ridership levels have been increasing since 1997 (H-GAC 2000b, 13).
CMAQ Program Process and Decision-Making Procedures
The Texas Department of Transportation (TxDOT) suballocates CMAQ funds to nonattainment and maintenance areas in the state using the same formula by which national-level CMAQ funds are allocated to Texas. Currently, the Houston-Galveston nonattainment area receives about $32.5 million in CMAQ funds annually,28 which represents about 2 percent of the $1.6 billion annual TIP.29
The H-GAC Transportation Policy Council, the designated MPO for the eight-county Houston-Galveston Transportation Management Area,30 is responsible for the selection and programming of CMAQ projects as well as other transportation projects in the region.
TxDOT also nominates projects for CMAQ funding and is a major user of CMAQ funds in the Houston-Galveston area. In addition, TxDOT plays a major role in the management and administration of CMAQ funds in Houston and other nonattainment areas in the state—a role it has taken on because the agency is ultimately accountable to the U.S. Department of Transportation for the use of CMAQ program funds. More specifically, once projects have been selected and programmed for CMAQ funding in the TIP, TxDOT allocates the funds to the Houston District Office of TxDOT, which then lets the contracts for individual projects and administers the program locally.31 METRO is an exception to this process. For most of METRO’s CMAQ-funded transit projects, the funds are transferred from FHWA to FTA for inclusion in METRO’s annual formula fund grant.32 METRO is responsible for managing and administering its own CMAQ-funded projects.
CMAQ-eligible projects must first be incorporated into H-GAC’s regional transportation plan. This may occur when projects are nominated for inclusion in the regional plan every 2 to 3 years or through staff analysis of transportation needs during plan reevaluation. Except for the initial introduction of the CMAQ funding category with the passage of ISTEA, H-GAC has not conducted a separate solicitation for nominating projects for CMAQ funding. The vast majority of projects are recommended by TxDOT and METRO, and to a lesser extent, by the city of Houston and Harris County. However, projects have been successfully sponsored by several other groups.33 Involvement of
public interest groups in the identification of projects as candidates for CMAQ funding is limited.
A separate process has been established for the evaluation and ranking of CMAQ-eligible projects in the RTP that may be candidates for inclusion in the TIP. This process has resulted in a broader range of agency and public involvement in project review. In the mid-1990s, desired categories of CMAQ-eligible projects were identified, and target levels of funding were established, to ensure that regional goals identified in the MTP were not lost in the process of individual project evaluation, comparison, and selection (H-GAC 2000a, B-1–B-5). The six categories identified and their targeted percentages of CMAQ funding are as follows: bicycle/pedestrian, 7 percent; air quality/ environmental (e.g., engine replacements), 7 percent; travel demand management (e.g., rideshare/vanpool), 9 percent; transit, 26 percent; intermodal, 6 percent; and transportation system management/traffic operations, 44 percent.34 Within each category, projects are rated on two criteria: (a) cost-effectiveness [i.e., cost (net of local contributions) per expected total annual pounds reduction of VOCs and NOx] and (b) readiness.35 This system allows CMAQ funds to be allocated to a relatively wide range of projects, reflecting locally agreed-upon priorities. It also enables like projects to be compared and ranked within each category. The targeting system has not been used for the FY 2002–2004 TIP currently in development because the reduction in CMAQ funding to the area has created a substantial backlog of projects. In addition, $35 million of CMAQ funding has been set aside for CMAQ-eligible projects that support a major freeway reconstruction project, the Katy Freeway.36
Once candidate projects for CMAQ funding have been identified for a particular TIP, they are reviewed by the Technical Advisory Committee (TAC) of H-GAC. TAC membership is broad. It includes
member governments and citizen interest groups with expertise in transportation planning who are appointed by the Transportation Policy Council (TPC) to assist in the coordination of the TIP, MTP, and other transportation planning activities. Because of the size of the TIP, TAC is assisted by a standing subcommittee that reviews and recommends project readiness, ranking, and programming. Membership in the TIP subcommittee is open to all TAC members. Several of the nongovernmental members of TAC, however, noted that they had little understanding of the CMAQ project evaluation and ranking process and limited opportunity to discuss individual CMAQ projects at the TAC meetings. TPC, which consists of 3 at-large members appointed by the H-GAC Board of Directors and 24 members who represent cities and counties, TxDOT, and METRO, provides overall policy guidance and approves the final TIPs and MTPs.
H-GAC has assumed the primary role of preparing the information needed to evaluate CMAQ projects. Typically, project sponsors provide activity-level data (i.e., project inputs such as vehicle speeds, trip, and VMT data) and project costs. H-GAC then determines whether the project is eligible for CMAQ funding, whether it is compatible with the MTP, and how it ranks on the basis of cost-effectiveness and readiness. Emission evaluations are conducted using methodologies developed by H-GAC (H-GAC 2000b, Appendix B).37 The exception again is METRO, which prepares its own emission estimates in consultation with H-GAC for the projects it sponsors. Secondary factors, such as safety, are not directly considered in evaluating CMAQ projects, but they can play a role in determining the final project ranking within project categories.38
Conformity requirements have become an increasingly important factor in the selection of CMAQ projects. For example, in prior years CMAQ funds were used to finance grade separation projects, which
were found to be beneficial for VOC reduction. However, as the area has had to pay increasing attention to the issue of reducing NOx (previously the region received a NOx waiver), many grade separation projects, which increase vehicle speed and thus NOx emissions, are no longer desirable from an air quality perspective.
Many CMAQ projects as well as other TCMs are included in the area SIP for emission credit. Such projects include regional computerized traffic signal systems, arterial traffic management systems, intersection improvements, park-and-ride lots, HOV lanes, and transit service projects (H-GAC 2000b, 23). Other mobile emission programs (e.g., employer-sponsored commute programs, alternative-fueled railroad vehicles) are included in the SIP as voluntary programs rather than TCM commitments. They are evaluated for credit in the conformity analysis, and off-model credits are taken as appropriate. Although the contribution of these projects is small relative to estimates of area emission levels, they help demonstrate the region’s commitment to achieving SIP targets.39
The TxDOT Houston District Office is responsible for reporting information on CMAQ-funded projects to TxDOT’s state planning office, which, in turn, provides the required data to FHWA. H-GAC helps coordinate the collection of this information from the relevant local agencies. The survey respondents did not recommend any changes in the reporting process, although some questioned the level of detail required and wondered whether the information was useful to program sponsors for program design and modification.
A few ex-post evaluations of CMAQ-funded projects have been conducted. METRO has conducted an evaluation of a 3-year, CMAQ-funded transit subsidy program during the high-ozone month of August, known as Clean Air Month. The evaluation found that 13 per-
cent of the 36 percent increase in boardings from August 1996 to August 1999 could be attributed to the program, although the evaluation showed diminishing returns in the third year (METRO 2000a). Two other evaluation efforts are under way. H-GAC is conducting a “before and after” study of the regional bicycle plan, which is being funded in part by the CMAQ program. In addition, H-GAC is collecting traffic data to capture “before” conditions for subsequent analysis and evaluation of regional computerized traffic signalization projects that will soon be implemented, also using CMAQ funds.
H-GAC staff suggested that more comprehensive evaluations of CMAQ-funded activities are needed. Currently each project is expected to contribute to reductions in congestion and emissions. The focus should be on the combined systems effects of individual projects rather than on project-by-project evaluations. H-GAC, at least, would be sympathetic to using some CMAQ funds for such comprehensive evaluations. TxDOT, however, does not think that funding for evaluation should come from project funds.
CMAQ Program Objectives
The majority of those interviewed supported the dual goals of the CMAQ program—air quality improvement and congestion mitigation—and saw no major conflict between them. Representatives from the Houston Area Bicycle Alliance and the Gulf Coast Institute, however, did not agree with this perspective. In their view, congestion mitigation measures that improve highway travel are at odds with the program goal of pollution reduction.
The area’s strong focus on congestion mitigation can perhaps be explained by the high level of congestion in Houston,40 by the major role played by TxDOT in the CMAQ program, and by METRO’s role in improving regional mobility, not just operating transit services. Whatever the reasons, the area spent nearly 60 percent of its CMAQ funds in the last 5 years (FY 1996–2000) on traffic flow improvements for such projects as a regional computerized traffic signalization
TABLE D-5 CMAQ Projects Let to Contract, Houston Metropolitan Area, FY 1996–2000
system, a traffic incident and management facility,41 and HOV lanes (Table D-5).42 The next-largest spending categories are shared ride (e.g., regional commute programs, vanpool programs), which accounted for 13 percent of contracts let in this period, and transit (e.g., fare subsidy program, new shuttle and bus service), which accounted for 12 percent of contracts let (Table D-5). Bicycle and pedestrian projects accounted for another 6 percent. Of the remainder,
the largest project is the CMAQ-funded intermodal project involving the Port of Houston categorized under “other.”43
According to many of those interviewed, if CMAQ funds had not been available during this period, certain projects, such as vanpooling, telecommuting, technology projects (e.g., bus engine replacements with cleaner engines), and clean air educational initiatives for which there are no obvious alternative funding sources, probably would not have been undertaken. In addition, there probably would have been fewer bicycle and pedestrian projects, and there probably would have been delays in implementation of new transit services and traffic signalization improvement projects if these projects had to rely on other funding sources. TxDOT thought that most projects probably would be undertaken even if CMAQ funds were not available, but implementation schedules would slip considerably. Moreover, in TxDOT’s judgment, if CMAQ funds were unavailable, more projects would have been focused on infrastructure and operations than on air quality improvement. Finally, according to H-GAC, one important role of CMAQ has been to “buy down the risk of pilot projects,” such as transit services focused on suburban employment centers and METRO’s Clean Air Month.
When asked which types of projects were most effective in achieving CMAQ program goals of emission reductions and air quality improvement, the following types of projects were mentioned: traffic signalization and ITS projects, transit (transit service start-up and expansion and vehicle engine replacements), and projects that help reduce the number of SOV trips or eliminate vehicle trips entirely, such as the intermodal port project, vanpooling projects, park-and-ride, HOV lanes, and bicycle, teleworking, and pedestrian projects.
The best projects for congestion relief fell into the category of traffic flow improvements—projects such as intersection improvements, grade separations, computerized traffic signalization and coordination, and bottleneck reductions. The most cost-effective projects included many of the same projects that were mentioned as
effective for emission reductions—traffic signalization and bottleneck removal projects (although the benefits are relatively short term), HOV lanes (mainly because they are built on existing state facilities and thus require no right-of-way costs), park-and-ride lots and vanpool programs, and engine replacements.
Of course, when CMAQ projects are compared with other strategies for reducing pollution, improvements in vehicle technology and fuels were thought to be the most cost-effective strategies because they are applied fleetwide.
CMAQ Program Evaluation
Viewed in the context of other transportation programs, the main strengths of the CMAQ program are its focus on air quality (the only transportation program that is so focused), its multimodal scope, and its encouragement of some nontraditional demonstration projects (e.g., METRO’s Clean Air Month Program). As a funded mandate, the CMAQ program is an effective tool for leveraging other funds. Its availability also helps accelerate certain projects, which might have been delayed had CMAQ funding not been available.
Not all who were interviewed saw the CMAQ program as innovative, at least not with respect to how the program has been implemented in the Houston area. In the view of the Gulf Coast Institute staff, for example, it appeared that the majority of CMAQ funding has supported traditional highway and transit projects in the region. Even when more innovative projects have been funded, others noted that the program encourages short-term solutions. CMAQ provides start-up funds but leaves local governments with the burden of financing equipment replacement and operating expenses because of CMAQ program limits on operating funding and its focus on investments in new facilities, equipment, and services. Finally, inadequate evaluation of CMAQ projects, particularly evaluations that are focused at the system rather than the individual project level, was noted as a program weakness.
Agencies with a major role in the CMAQ program—H-GAC, TxDOT—believe that the program has improved interagency cooperation and increased agency awareness of air quality problems. The program has also leveraged the participation of new players (e.g., the
Port of Houston) and broadened the activities handled by H-GAC (e.g., its involvement through the CMAQ program in transportation management organizations). However, with the exception of the bicycle interests, CMAQ is not viewed by public interest groups as having increased their involvement in area transportation planning and decision making.
Despite these differences of opinion, all of those interviewed thought that the CMAQ program should be continued when TEA-21 is reauthorized. When new air quality regulations are implemented (e.g., the 8-hour ozone standard) or standards are established for other pollutants (e.g., air toxics), CMAQ eligibility should be expanded accordingly, but only if more program funding is provided; otherwise, the current program will be diluted.44 Others, like the Houston Area Bicycle Alliance and the Gulf Coast Institute, thought that CMAQ eligibility should be expanded to include more “Smart Growth” and land use projects (e.g., sidewalks). Concern was expressed, however, about implementation of more nontraditional projects, particularly if TxDOT continues its current program management role.
Several suggestions were made for changing the program, although not all of those interviewed agreed with all the suggestions. First, more CMAQ funding should be available for project planning and development as well as for operations. Second, nearly all agreed on the need for better evaluation of the benefits of CMAQ projects. However, the focus should not be on individual project assessments so much as on how groups of similar projects affect the system. H-GAC and TxDOT differed on whether existing CMAQ funds should be used to sponsor such evaluations (H-GAC was in favor of and TxDOT against taking some project funds for this purpose). Third, METRO thought that more CMAQ funds should be spent on demonstration projects selected on the basis of their benefits for air quality. Several of the interest groups—Gulf Coast Institute, the Houston Area Bicycle Association—would also like to see more innovation in
CMAQ projects. Finally, several recommendations were made for improvements in program implementation that may only be applicable to the way the CMAQ program is handled in Texas. In the opinion of TxDOT and the city of Houston, some of the funding should be passed through directly to local governments in a small block grant, along with the responsibility and accountability for how the money is spent. In addition, the process needs to be streamlined, particularly for those projects that are suggested by a local government but implemented by TxDOT.
Organizations and Persons Interviewed—January 31–February 1, 2001
Houston-Galveston Area Council
Alan Clark, MPO Director, Transportation Department
Rick Beverlin, Senior Transportation Planner
Cynthia Adamson, Senior Planner
Metropolitan Transit Authority
Edith L. Lowery, Director, Grant Programs, Finance
Larry Badon, Transportation Systems Planner, Planning, Engineering and Construction
Lynda C. Mifsud, Manager of Environmental Planning, Planning, Engineering and Construction
Texas Department of Transportation, Houston District
Gabriel Y. Johnson, P.E., Director of Transportation Planning and Development
Carol W. Nixon, P.E., Director of District Transportation Planning
Texas Department of Transportation, Headquarters (by telephone)
Timothy Juarez, Metropolitan Planning Supervisor, Transportation Planning and Programming Division, Transportation Systems Planning Section
City of Houston
Douglas Wiersig, Senior Assistant Director, Traffic Management
Houston TranStar
John R. Whaley, P.E., Director
Houston Area Bicycle Alliance
Dan Lundeen, President
Gulf Coast Institute
David Crossley, President
Bayou Preservation Association
Mary Ellen Whitworth, P.E., Executive Director
Texas Natural Resource Conservation Commission (by conference call)
Michael Magee, Program Specialist, Office of Environmental Policy, Analysis, and Assessment
Kim Herndon, Program Specialist, Technical Analysis Division
Roland Castaneda, Planner 1, Office of Environmental Policy, Analysis, and Assessment
Bay Area Transportation Partnership (by telephone)
Connie Elston, President
LOS ANGELES SITE VISIT
Introduction
The Southern California region, which contains 13 nonattainment and maintenance areas, 4 air basins, 5 local air districts, and 6 counties (Los Angeles, Orange, Riverside, San Bernardino, Ventura, and Imperial), has some of the most serious air quality problems in the nation. The South Coast Air Basin (SCAB), which includes the urbanized portions of Los Angeles, San Bernardino, and Riverside Counties, and all of Orange County, is designated “extreme” for ozone—the only such area in the nation; “serious” for carbon monoxide (CO)—the only such area in California and the largest in the nation; and “serious” for particulates (PM10). SCAB must reach attainment by 2010 for ozone and by 2006 for PM10; it has already passed its attainment year, 2000, for CO. Portions of the three other air basins are also in nonattainment for ozone and PM10, with differing designations and attainment deadlines.45 The Southern California region is nearing completion of a new RTP (2001 RTP Update) for 2001–2025, including
its conformity findings.46 The 2001 RTP Update shows positive conformity findings relative to emission budgets and timely implementation of TCMs. The regional emission budgets and TCMs are contained in the applicable SIPs approved by EPA.
The six-county region, which includes nearly half the population of California and a gross national product equivalent of 12th-highest in the world, is expected to continue its rapid growth during the first quarter of the 21st century, according to the Southern California Association of Governments (SCAG), the MPO for the region (SCAG 2000, 29).47 From 2000 to 2025, population is expected to grow by 34 percent to 22.6 million; households, by 37 percent to 7.4 million; and employment, by 7 percent to 10 million jobs (SCAG 2000, 29). This high level of projected growth will put further pressure on a transportation system that has been rated the most congested in America (Schrank and Lomax 2001, 38).48 Person trips are expected to increase by nearly 40 percent and VMT by nearly 41 percent between the 1997 base projection year and 2025, with a projected doubling in vehicle hours of delay (SCAG 2000, Appendix J, J-7).49 Nearly constant levels of drive-alone and carpool person trips and slight increases in transit person trips (from 2 percent in 1997 to 2.1 percent in 2025) and nonmotorized person trips (9.4 percent in 1997 to 9.6 percent in 2025) are assumed in the projections (SCAG 2000, Appendix J, J-8).
CMAQ Program Process and Decision-Making Procedures
The California Department of Transportation (Caltrans) suballocates CMAQ funds to nonattainment and maintenance areas in the state using the same formula by which national-level CMAQ funds
are allocated to California. State legislation and the federal government require that CMAQ and other federal transportation funds be obligated within 3 years in a “use it or lose it” provision designed to help the state retain federal funds.
Because of the severity of its air quality problems, the six-county region receives nearly 60 percent of the statewide CMAQ apportionment.50 In FY 2000–2001, the apportionment was nearly $220 million for the region, with about 62 percent going to Los Angeles County, 34 percent to Orange, Riverside, and San Bernardino Counties, and the remaining 4 percent to Ventura County. Imperial County, which is thinly populated, does not receive CMAQ funds (Keynejad 2001, 8).
Although the Southern California region receives the major share of CMAQ funds in the state, the FY 2000–2001 apportionment represents only 5.5 percent of the region’s federal transportation funds and 2.3 percent of the region’s transportation funds from all sources.51 The region receives substantial assistance in addition to CMAQ to fund projects that help improve air quality, such as funding from the California Motor Vehicle Registration Fee Program. For example, the Southern California region receives about $10 million to $13 million annually from motor vehicle registration fees to support the Clean Fuels Fund that finances transit and other fleet engine replacements. Moreover, Los Angeles, Orange, Riverside, and San Bernardino Counties have a local sales tax, which is often reserved for investments in transit and HOV lanes that may help reduce vehicle emissions.
In contrast to other regions in California, the primary responsibility for programming CMAQ and other transportation funds within the Southern California region rests at the county and subcounty level.52 Each county in the region is a designated council of governments, and each has a transportation commission or authority
charged with countywide transportation planning, allocation of locally generated revenues, and in some cases, operation of transit services (SCAG 2000, 25).53 SCAG’s role is to integrate the county and subregional TIPs of the councils of government, ensuring consistency and brokering disagreements, into the RTP and the associated short-range Regional Transportation Improvement Program (RTIP). SCAG is also responsible for the associated conformity analyses and findings and has veto power over any project that does not meet conformity requirements (Giuliano 2001). This highly decentralized decision-making structure, enacted by state law after passage of ISTEA, has meant that there is no regional process for the selection and evaluation of CMAQ projects. Each county has its own process.54
The Los Angeles County Metropolitan Transportation Authority (MTA), the largest user of CMAQ funds in the region, does not have a separate call for projects for CMAQ. All transportation projects are handled through a call for projects for the TIP, which is sent to Los Angeles County, Caltrans, 88 cities including the city of Los Angeles, and numerous transit and paratransit operators. Through the use of evaluation criteria, which are weighted to achieve a potentially perfect score of 100 percent, all proposed projects are evaluated against others in the same category.55 The most weight is given to “regional significance, project benefit, and intermodal integration,” although
“land use and environmental compatibility” are also considered for certain project categories (MTA 2000, 11).56 The objective of the process is to identify the best regionally significant projects without regard to funding sources (MTA 2000, 14). MTA staff work with Transportation Advisory Committee subcommittees to rank projects for each modal category, which are then scheduled for review and adoption by the MTA board. Once projects are approved for funding, specific funds such as CMAQ are assigned to each project on the basis of eligibility requirements and availability of funds. Project commitments are made for several years into the future. For example, the most recent call for projects in 1999 has committed CMAQ funds for the county through FY 2004. From time to time, the MTA board has earmarked CMAQ funds directly, outside the call process, primarily to fund transit projects, such as an all compressed natural gas (CNG) bus fleet, which the board has deemed to be critical for the county and for the basin’s air quality.
Like MTA, the Orange County Transportation Authority (OCTA) does not have a separate call for projects for CMAQ funds. Appropriate projects are drawn from the county’s long-range plan—entitled FastForward—and are approved by the OCTA Board of Directors. The choice of projects for CMAQ funding is also influenced by project readiness. Currently, the board of directors has earmarked all of the CMAQ funds remaining under TEA-21 for a single project, the urban rail Centerline project, which serves central Orange County. Weak support from the cities in Orange County, however, has stalled the Centerline project and may require reprogramming CMAQ funds to a different use.
In contrast to the process in Los Angeles and Orange Counties, the San Bernardino Associated Governments (SANBAG), the Riverside County Transportation Commission (RCTC), and the Ventura County Transportation Commission (VCTC) have separate calls for projects for CMAQ in San Bernardino, Riverside, and Ventura Counties, respectively. Since TEA-21 was enacted, SANBAG has had three
calls for projects for CMAQ. The first allocated funds through board-approved set-asides for a truck climbing lane, transit capital, rideshare, and HOV projects. The second and most recent calls were directed to SANBAG’s member agencies in a request for proposal–like format, and a scoring process was developed to rank proposed projects that places a priority on a project’s cost-effectiveness in reducing emissions and travel delay. A board-approved subcommittee, consisting of representatives of SANBAG staff, a technical consultant, SCAG, the relevant air district, and Caltrans, reviews and scores each project proposal, making recommendations for final approval by the SANBAG board. CMAQ funds, however, continue to be set aside outside this process. For example, in the most recent call for projects, approximately 30 percent of the available CMAQ funds for San Bernardino County were earmarked for ready-to-obligate HOV projects to ensure meeting the state and federal use-it-or-lose-it requirement. Some transit projects that have not ranked high on cost-effectiveness ratings have also been funded outside the ranking process.
RCTC also had three calls for projects under TEA-21 that were sent to its member agencies.57 The first call covered the first 2 years of CMAQ funding under TEA-21; the second call covered the remaining 4 years; and the third call was directed toward programming a $2 million set-aside for clean fuels projects. Project selection criteria were established, and the Transportation Advisory Committee evaluated all proposals using the criteria, with the assistance of a consultant who helped estimate project emission reductions and prepare other technical calculations.58 A prioritized list of projects was developed
for consideration by the Budget and Implementation Committee. Following its review, a recommended list of projects was forwarded for final approval by RCTC. RCTC, like SANBAG, has used CMAQ funds for ready-to-obligate HOV projects—nearly three-fifths of the second call for projects were recommended for this purpose. Funds have also been earmarked outside the process (e.g., the $2 million Clean Fuels Opportunity Fund).
VCTC also has a separate call for projects for the CMAQ program and the STP. Following passage of TEA-21, a call for projects programmed CMAQ (and STP) funds for the 6-year authorization period.59 VCTC has identified a priority list of project categories for CMAQ funding, which was developed in conjunction with its air district—the Ventura County Air Pollution Control District—when the CMAQ program was first authorized.60 There are no target percentages by category, but criteria and weights have been established for ranking project submittals within each project category.61 VCTC project staff perform the initial project scoring, with the assistance of the Air Pollution Control District for air quality benefit assessments. Then the projects are reviewed by a subcommittee of the Transportation Advisory Committee consisting of representatives from the Transportation Technical Advisory Committee, the Transit Operators Committee, the Citizens Transportation Advisory Committee/Social Services Transportation Advisory Council, and the Air Pollution Control District. The Managers Policy Advisory Committee also reviews the recommended list for final action by VCTC.
Caltrans, primarily through its local district office, also recommends projects for CMAQ funding. With some counties experiencing difficulty in meeting funding obligation deadlines, ready-to-fund state projects, such as HOV lanes, are often selected for CMAQ funding. Caltrans has no formal project ranking procedures; projects are simply screened to make sure they meet CMAQ eligibility requirements.
According to the Coalition for Clean Air (CCA) and other public interest and advocacy groups in the region, neither the air agencies nor the public interest and advocacy groups have been heavily involved in identifying or evaluating CMAQ projects. A combination of long programming time frames and poorly organized interest groups in some areas contributes to the limited level of participation. Counties with smaller CMAQ programs and separate calls for projects for CMAQ tend to provide more opportunities for public interest group involvement early in the process.
In San Bernardino, Riverside, and Ventura Counties, the private sector has been involved in a few small CMAQ projects funded through public-private partnerships. SANBAG has a partnership arrangement with a private utility in a pilot project to convert forklifts to clean fuel operation. RCTC was also engaged in a project with a utility, California Edison, to electrify truck stops to eliminate idling emissions, but the utility had to cancel the project because of the current energy crisis in California. Finally, Ventura County has a partnership arrangement with a private company to provide CNG infrastructure support for the county’s CNG-fueled transit buses.
Because of the severity of the Southern California region’s air quality problems, the transportation policies, programs, and projects contained in the RTP and the RTIP are primarily focused on pollution reduction and compliance with federal transportation conformity requirements. In addition, the California Air Resources Board and the local air agencies have developed emission control strategies, incorporated into local air basin air quality management plans and SIPs, to help meet air quality attainment deadlines. CMAQ funds have been used extensively to fund TCMs and other emission control strategies, such as replacement of diesel with alternative fuel buses. For example, a significant portion of projects in the SCAG RTIP are TCMs. They
are included in the Air Quality Management Plan of SCAB, listed by category rather than individual project (MTA 2000, 17).62
Each county is responsible for pulling together needed information from project sponsors to evaluate CMAQ project proposals. In Los Angeles County, MTA uses its own transportation and emission models to estimate the travel and emission effects of large projects. Many of the counties use the methodology developed by the California Air Resources Board to estimate emission reductions of projects, and some use it to estimate travel effects as well.63 Staff prepare the estimates in Los Angeles, Orange, and Ventura Counties—in the latter, with the assistance of the Air Pollution Control District. Consultants help prepare the technical assessments in Riverside and San Bernardino Counties, in the latter case in conjunction with SANBAG staff, Caltrans, the relevant air district, and SCAG. Several of the counties, such as Los Angeles, Riverside, and Ventura, explicitly take into account secondary factors, such as economic development, multi-modal and multijurisdictional effects, geographic balance, and project readiness, in evaluating CMAQ projects. However, because of the area’s problems, improvement of air quality and congestion mitigation are generally the primary considerations in selecting among projects; according to many, CMAQ funding is insufficient for meeting these primary goals.
The counties are also responsible for annual reporting to Caltrans on projects funded by the CMAQ program and their projected emission reductions. Caltrans, in turn, is responsible for reporting this information to FHWA. Some survey respondents suggested that more time was needed to prepare the information. SCAG recommended a biennial report. Others questioned how the report is being used and by whom.
|
62 |
For many TCMs, credit is not taken separately in the SIP. Rather, the emission reduction effects of these projects are modeled and credit taken when conformity analyses are conducted. Credit for TCMs not covered by modeling can be taken via “off-model” emission calculations. |
|
63 |
The California Air Resources Board has prepared a methods handbook in cooperation with Caltrans for evaluating the cost-effectiveness of the most widely implemented transportation-related air quality projects funded by the CMAQ and Motor Vehicle Registration Fee Programs. The most recent (1999) edition can be accessed on the Air Resources Board website at www.arb.ca.gov. |
Few ex-post evaluations of CMAQ projects are conducted, although the Southern California region must continually monitor and report on its progress in meeting air quality requirements. For example, SCAG must redetermine the conformity of the RTP and the RTIP at least every 3 years. Similarly, the air agencies must report on the rate of progress toward meeting attainment, also at least every 3 years. In addition, the counties must report to SCAG every 2 years on timely implementation of TCMs, including CMAQ-funded projects. Staff of VCTC suggested that there was little incentive for local agencies to monitor and evaluate CMAQ projects, particularly if it would take away from project funding. SANBAG staff suggested that ex-post evaluation is not necessary for straightforward projects, like vehicle engine replacements, for which the emission reduction benefits are clear. Nevertheless, CCA recommended a program set-aside for CMAQ project evaluation.
CMAQ Program Objectives
The majority of those interviewed believe that the primary goal of the CMAQ program is air quality improvement. In view of the air quality problems of the region, a high priority is given to funding CMAQ projects that have the potential for reducing emissions. That said, many view congestion mitigation as another important program goal and see no major conflict between the twin goals of the program. Transportation agency staff of SCAG, several of the county transportation commissions, and the city of Los Angeles believe that the region must accommodate growth and that congestion relief projects appropriately attempt to address the reality that most Los Angeles residents drive. If properly structured, such projects should help reduce emissions as well as congestion. Not surprisingly, this view is not held by the South Coast Air Quality Management District or CCA, who believe that more emphasis should be placed on projects with air quality benefits and that, with the possible exception of some HOV projects, congestion mitigation projects are not likely to have this outcome.
A review of CMAQ obligations in the Southern California region for the last 5 years, FY 1996–2000, shows that more than 60 percent of the funds have gone for transit, including many projects to replace
buses and bus engines with nondiesel alternatives—a requirement of the air districts in Southern California (Table D-6). The next-largest spending category—nearly one-quarter of the total—is for traffic flow improvements, including HOV projects. The third-largest category is “all other,” a catchall category that represents nearly 10 percent of total spending. Shared-ride, bicycle and pedestrian, and demand management projects represent a small fraction (i.e., between 1 and 2 percent) of areawide spending.
CMAQ obligations for the region are dominated by the priorities of Los Angeles County, which accounted for nearly 70 percent of area CMAQ obligations in the past 5 years. The priorities of the four other counties that receive CMAQ funds differ widely (Figure D-1). For example, San Bernardino and Riverside Counties have obligated large amounts of CMAQ funds for traffic flow improvements, including HOV projects. Orange County has focused heavily on transit in recent years,64 and Ventura County has obligated nearly three-fourths of its CMAQ funds for transit improvements (Figure D-1).
According to many of those interviewed, if CMAQ funds were not available or were folded into existing transportation programs, the area would lose funding generally because the CMAQ apportionment formula targets areas with serious air quality problems, like Los Angeles. Moreover, spending priorities would likely change, with less emphasis on projects that improve air quality. The shift in priorities could be greater in suburban areas, where, without CMAQ, more highway projects would probably be undertaken. Many acknowledged that the area would have no choice but to find alternative funding sources for many projects to meet conformity requirements if the CMAQ program were ended. In their view, the projects for which this would be most difficult or for which delays would be likely include new transit services and operations, transit fleet conversions to alternative fuels and supporting infrastructure (e.g., refueling stations), and some HOV and bicycle projects.
When asked which types of projects were most effective in achieving CMAQ program goals of emission reductions and air quality
TABLE D-6 CMAQ Program Obligations, Greater Los Angeles Area, FFY 1996–2000
|
Project Category |
Total Cost ($) |
CMAQ Share ($) |
Percentage of CMAQ Total |
|
Five-County Total |
|||
|
Traffic flow improvements |
180,641,170 |
139,224,012 |
23.9 |
|
Shared ride |
17,559,561 |
11,353,295 |
1.9 |
|
Transit |
455,042,865 |
368,832,984 |
63.3 |
|
Bicycle/pedestrian |
8,521,636 |
7,526,601 |
1.3 |
|
Demand management |
2,304,799 |
2,076,729 |
0.4 |
|
Other |
79,179,782 |
53,994,452 |
9.2 |
|
Total |
743,249,813 |
583,008,073 |
100.0 |
|
Los Angeles County |
|||
|
Traffic flow improvements |
67,755,489 |
57,051,954 |
14.6 |
|
Shared ride |
10,660,830 |
5,142,621 |
1.3 |
|
Transit |
385,013,257 |
307,680,926 |
78.6 |
|
Bicycle/pedestrian |
768,119 |
673,642 |
0.2 |
|
Demand management |
345,896 |
342,512 |
0.1 |
|
Other |
22,738,033 |
20,302,595 |
5.2 |
|
Subtotal |
487,281,624 |
391,194,250 |
100.0 |
|
Riverside County |
|||
|
Traffic flow improvements |
50,795,887 |
41,288,526 |
54.0 |
|
Shared ride |
1,630,976 |
1,443,902 |
1.9 |
|
Transit |
21,305,778 |
18,861,438 |
24.7 |
|
Bicycle/pedestrian |
3,800,000 |
3,364,000 |
4.4 |
|
Demand management |
54,000 |
47,806 |
0.1 |
|
Other |
21,901,958 |
11,431,713 |
14.9 |
|
Subtotal |
99,488,599 |
76,437,385 |
100.0 |
|
San Bernardino County |
|||
|
Traffic flow improvements |
61,134,339 |
40,037,668 |
73.3 |
|
Shared ride |
3,362,562 |
2,976,875 |
5.5 |
|
Transit |
7,789,216 |
6,051,208 |
11.1 |
|
Bicycle/pedestrian |
158,000 |
128,788 |
0.2 |
|
Demand management |
– |
– |
– |
|
Other |
6,279,673 |
5,396,843 |
9.9 |
|
Subtotal |
78,723,790 |
54,591,382 |
100.0 |
|
Orange County |
|||
|
Traffic flow improvements |
– |
– |
– |
|
Shared ride |
900,000 |
900,000 |
2.8 |
|
Transit |
17,600,179 |
15,581,437 |
47.7 |
|
Bicycle/pedestrian |
– |
– |
– |
|
Demand management |
– |
– |
– |
|
Other |
27,454,997 |
16,150,527 |
49.5 |
|
Subtotal |
45,955,176 |
32,631,964 |
100.0 |
|
Project Category |
Total Cost ($) |
CMAQ Share ($) |
Percentage of CMAQ Total |
|
Ventura County |
|||
|
Traffic flow improvements |
955,455 |
845,864 |
3.0 |
|
Shared ride |
1,005,193 |
889,897 |
3.2 |
|
Transit |
23,334,435 |
20,657,975 |
73.4 |
|
Bicycle/pedestrian |
3,795,517 |
3,360,171 |
11.9 |
|
Demand management |
1,904,903 |
1,686,411 |
6.0 |
|
Other |
805,121 |
712,774 |
2.5 |
|
Subtotal |
31,800,624 |
28,153,092 |
100.0 |
|
Source: Caltrans Office of Local Programs. |
|||
improvement, nearly all of the respondents mentioned technology-oriented projects, particularly transit vehicle and engine replacements with clean fuel alternatives. Other transit projects as well as ridesharing and HOV projects, which are focused on reducing vehicle trips and the numbers of vehicles on the road, were also mentioned as the most effective from an emission reduction perspective.
The best strategies for congestion relief include projects that fall under the category of traffic flow improvements—signal system synchronization, intersection improvements, and HOV projects. To the extent that transit services, including shuttles, move riders in high-capacity vehicles or remove vehicles from the highway entirely, these projects were also viewed as being effective for congestion relief.
When asked which projects are most cost-effective, several respondents noted that cost-effectiveness is only one of several criteria that should be taken into account in determining CMAQ spending priorities. Only a few agencies, such as SANBAG, focus on cost-effectiveness as a primary CMAQ project selection criterion. When asked which projects are most cost-effective, SANBAG staff mentioned replacement of bus engines with clean fuel–burning engines.65
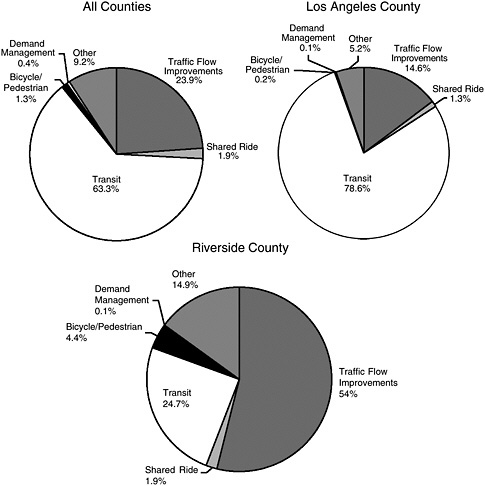
FIGURE D-1 CMAQ program obligations by project category, Greater Los Angeles area, FFY 1996–2000 (data from Caltrans Office of Local Programs). (continued)
Some ridesharing projects are low in cost and have tangible benefits. Finally, paving of dirt roads—projects directed toward PM10 emission reductions—is also thought to be cost-effective, although FHWA and Caltrans view many of these projects as capacity enhancing and thus ineligible for CMAQ funding. The California Air Resources Board provides guidance on assessing project cost-effectiveness, but some agen-
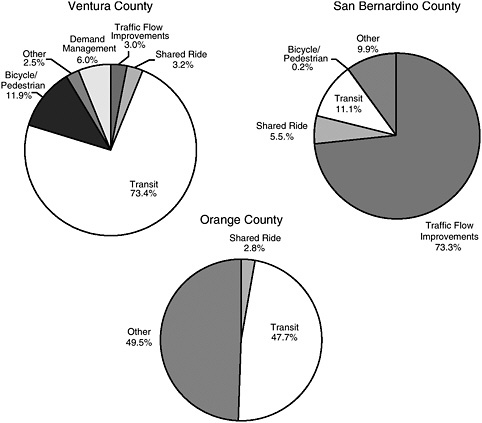
CMAQ program obligations by project category, Greater Los Angeles area, FFY 1996–2000 (data from Caltrans Office of Local Programs).
cies use this methodology after the fact to justify project selection rather than before the fact as a project selection tool.66
CMAQ Program Evaluation
The key strength of the CMAQ program, according to those interviewed, is its role as a dedicated source of federal transportation
funds for air quality improvement targeting the areas of greatest need (i.e., nonattainment and maintenance areas) to help meet mandated federal air quality requirements. Many of the restrictions on the program are considered to be its greatest benefits. For example, the CMAQ program requires agencies to consider transportation strategies that reduce emissions and provide alternatives to SOV highway travel, hence encouraging a more multimodal focus. It also requires spending on new facilities and operations, which can enable local agencies to experiment with new services. The extent of innovation, however, was questioned by RCTC staff and CCA, who noted that there were “not that many innovative CMAQ projects,” although they deemed spending on more traditional projects “worthwhile.”
Some program restrictions were viewed as weaknesses. For example, MTA staff believe that restricting funds to new services and operations, particularly for transit projects, can bias the program in favor of suburban areas; in their view, CMAQ funds should be eligible for use in projects that support existing transit services and ridership in urban areas. In addition, more attention should be paid to providing a transition period lengthier than the current 3 years for local governments that use CMAQ funds to support operations so that alternative funding sources can be found to continue newly started-up services. Others (RCTC staff and CCA) thought that the program is not restrictive enough in terms of its focus on air quality; within this objective, however, some (OCTA staff, in particular) thought that any project that reduces emissions should be eligible for CMAQ funding. Others (primarily the South Coast Air Quality Management District) noted that there is insufficient accountability about where program funds are going and how program funds are being spent.
Most of those interviewed did not see much change in interagency cooperation and decision making that could be attributed specifically to the CMAQ program, an unsurprising outcome in view of the lack of a regional approach to the program. With some notable exceptions (e.g., Ventura and San Bernardino Counties), the air agencies are viewed as having an arms-length role in the program; MTA staff suggested that the program could be better coordinated with the air agencies. Public interest groups in the Los Angeles area also have limited involvement, particularly early in the process of determining appro-
priate projects for CMAQ funding. The highly decentralized decision-making structure has also resulted in program funds being spread widely among a large number of local jurisdictions in many counties. With some notable exceptions (e.g., clean fuels projects, HOV projects), the current structure provides few incentives for focusing CMAQ funds on regional strategies for improving air quality.
All of those interviewed thought that the CMAQ program should be continued when TEA-21 is reauthorized. Some (i.e., SCAG, city of Los Angeles, Caltrans) were hesitant about expanding the scope of the program unless funding was increased accordingly. Present levels of funding are insufficient, in their view, to meet the current air quality standards. Others (MTA, OCTA, SANBAG, RCTC) strongly urged that the program be extended to cover other pollutants (e.g., fine particulate matter, air toxics). If these other pollutants were included in the CMAQ apportionment formula, the area would likely receive even more funds. Some (RCTC, CCA) recommended broadening project eligibility to include strategies that address these new pollutants, such as projects focused on heavy vehicles and off-road vehicles. Others (SANBAG, in particular) thought there was sufficient flexibility within current eligibility requirements to address most of these problems now.
Several suggestions were made for changing the program, although not all of those interviewed agreed with all the suggestions. First, more incentives should be provided for a regional program focus to encourage more coordinated strategies for pollution reduction in the region (Caltrans, CCA), but local differences within the region should also be recognized (RCTC). Second, state and local air agencies should have an ex officio or advisory role in programming CMAQ funds at the county level (RCTC). Greater public participation would also be desirable, particularly early in the project selection and evaluation process. Third, 3-year restrictions on the use of CMAQ funds for operations should be lengthened if it can be demonstrated that the project continues to provide new emission reductions. Fourth, more project evaluation would be desirable, including restricted funds for this purpose (city of Los Angeles), but these funds should not come at the expense of project funds (South Coast Air Quality Management District). Finally, looking ahead, the pollutants
covered under the CMAQ program should be expanded to include fine particulate matter and air toxics, particularly diesel, and added to the CMAQ apportionment formula as a basis for future funds allocation (SANBAG).
Organizations and Persons Interviewed—March 5–7, 2001
Southern California Association of Governments
Charles Keynejad, Senior Transportation Analyst
Sylvia Patsaouras, Regional Planner
Los Angeles County Metropolitan Transportation Authority
Keith L. Killough, Deputy Executive Officer, Countywide Planning
Frank Flores, Deputy Executive Officer, Capital Development and Programming
David E. Yale, Director, Regional Programming and Policy Analysis
Ronald L. Smith, Transportation Funding Manager, Capital Planning
Douglas Kim, Program Manager, Regional Planning—Air Quality Programs
Herman S. J. Cheng, Manager, Transportation Improvement Programming
John Asuncion, Transportation Planner
State of California, Department of Transportation, District 7—Office of Local Programs
Satish Chander, P.E., Chief, Office of Local Programs and Alameda Corridor
Norma Ortega, Chief, Office of Resource Management, Local Assistance Division (by telephone)
City of Los Angeles
Jaime De La Vega, Assistant Deputy Mayor, Office of the Mayor
Orange County Transportation Authority
James Ortner, Manager, Transit Technical Services
Dean Delgado, Principal Transportation Analyst
William J. Dineen, Manager, Financial Plans, Financial Planning and Analysis
Ventura County Transportation Commission
Ginger Gherardi, Executive Director (by telephone)
Christopher Stephens, Deputy Director
Peter De Haan, Director of Transportation Programming, Legislation, and Grants
San Bernardino Associated Governments (by conference call)
Norman King, Executive Director
Ty Schuiling, Director of Planning and Programming
Deborah Barmack, Director of Management Services
Riverside County Transportation Commission (by conference call)
Eric Haley, Executive Director
Cathy Bechtel, Director of Planning and Programming
South Coast Air Quality Management District
Connie Day, Program Supervisor
Eyvonne V. Sells, Regional Transportation Programs, Transportation Specialist
Coalition for Clean Air
Tim Carmichael, Executive Director
REFERENCES
Abbreviations
CATS Chicago Area Transportation Study
CDTC Capital District Transportation Committee
COG Metropolitan Washington Council of Governments
FHWA Federal Highway Administration
H-GAC Houston-Galveston Area Council
METRO Metropolitan Transit Authority of Harris County
MTA Los Angeles County Metropolitan Transportation Authority
NYSDOT New York State Department of Transportation
SCAG Southern California Association of Governments
TPB National Capital Region Transportation Planning Board
CATS. 2000a. 2000 Regional Profile. http://www.catsmpo.com/region/more. htm. Aug. 20.
CATS. 2000b. Congestion Mitigation and Air Quality (CMAQ). http://www.catsmpo.com/progs/cmaq.htm. Aug. 20.
CDTC. 1999. Transportation Improvement Program 1999–2004. May.
CDTC. 2000. New Visions 2030, Phase 1 Travel Task Force Report. Draft. July 5.
COG. 1999. The Region, The Vision: Goals, Objectives, and Strategies for Our Transportation Future. Vol. 38, TPB.
COG. 2000a. An Air Quality Determination of the 2000 Constrained Long Range Plan and the FY2001–2006 Transportation Improvement Program for the Washington Metropolitan Region.
COG. 2000b. Growth Trends to 2025: Cooperative Forecasting in the Washington Region. Publication 20802. Summer.
FHWA. 1995. Transportation Control Measure Analysis: Transportation Control Measures Analyzed for the Washington Region’s 15 Percent Rate of Progress Plan, Metropolitan Washington Council of Governments. Metropolitan Planning Technical Report 5. U.S. Department of Transportation, Feb.
Giuliano, G. 2001. Where is the “Region” in Regional Transportation Planning? In Regional Futures: Public Policy and The Making of 21st Century Los Angeles (J. Wolch, M. Pastor, and P. Dreier, eds.), University of Minnesota Press, Minneapolis, forthcoming.
H-GAC. 2000a. 2022 Metropolitan Transportation Plan, Appendix B. Feb. 25.
H-GAC. 2000b. Conformity Determinations for Vision 2022—The Metropolitan Transportation Plan and the 2000–2002 Transportation Improvement Program for the Houston-Galveston Transportation Management Area. Jan. 24.
Keynejad, C. 2001. Congestion Mitigation and Air Quality Improvement (CMAQ) Program: Current Practice in SCAG Region. March.
METRO. 2000a. 1999 Clean Air Month Transit Fare Subsidy Evaluation.
METRO. 2000b. Downtown to Astrodome Light Rail Project, Final Environmental Assessment, Executive Summary. Oct.
MTA. 2000. Call for Projects. 2001 Transportation Improvement Program, Application Package.
NYSDOT. 1996–2000. Annual CMAQ Program Accomplishment Reports, Federal Fiscal Years 1995–1999.
SCAG. 2000. 2001 Regional Transportation Plan Update. Dec. 14.
Schrank, D., and T. Lomax. 2001. The 2001 Urban Mobility Report. Texas Transportation Institute, Texas A&M University System, May.


