
APPENDIX E
COST-EFFECTIVENESS OF CONGESTION MITIGATION AND AIR QUALITY STRATEGIES
J. Richard Kuzmyak, Transportation Consultant, LLC
INTRODUCTION AND BACKGROUND
Purpose
The results of a commissioned review of the cost-effectiveness of transportation-related strategies as funded under the Congestion Mitigation and Air Quality Improvement (CMAQ) program are summarized in this paper. The review was performed under contract to the Transportation Research Board’s Committee for Evaluation of the CMAQ Improvement Program to support its deliberations and development of recommendations to Congress as to whether and how the CMAQ program should be continued when the federal transportation funding act is reauthorized in 2003.
At issue in this review is whether the types of strategies funded under CMAQ represent cost-effective approaches for achieving the objectives of the program to reduce emissions from mobile sources through congestion relief or other methods of improving transportation efficiency. This raises questions as to the effectiveness of individual types of projects and strategies funded, as well as the overall effectiveness of the body and mix of projects and strategies that CMAQ funds have purchased to date. Comparisons of the cost-effectiveness of the types of strategies eligible for CMAQ funding with the cost-effectiveness of strategies that have not been eligible for CMAQ funding, such as the construction of new highway capacity, roadway or other travel pricing schemes, new vehicle/fuel technology, and emission controls for nonmobile sources, were also made. The highway capacity, travel pricing, and selected (mainly transit-oriented) technology approaches are addressed in this paper, but the detailed investigation of vehicle standards, fuels, and non–mobile source approaches are explored in a second commissioned paper authored
by Michael Wang of Argonne National Laboratories. Both papers have been produced under the guidance of the CMAQ committee, and efforts have been made to coordinate methodologies and assumptions to maximize the comparability of findings.
Overview of CMAQ Program and Eligible Strategies
The CMAQ program is a special funding provision established under the 1991 Intermodal Surface Transportation Efficiency Act (ISTEA) that earmarks resources to help states and local areas achieve compliance with National Ambient Air Quality Standards (NAAQS). Over the first 6 years of the program, beginning in 1992, $6 billion was authorized under the program, and funding levels were subsequently continued under the 1998 reauthorization (the Transportation Equity Act for the 21st Century). The original purpose of the CMAQ program was to fund transportation programs or projects that would contribute to attainment of standards for ozone [hydrocarbon (HC) and oxides of nitrogen (NOx) precursors] and carbon monoxide (CO) in nonattainment areas. However, provisions were subsequently modified to permit use of the funds by areas that had reached attainment (transforming to “maintenance areas”) and in mitigating particulate matter (PM10) pollution under certain circumstances.
Title 21, Section 149 of ISTEA stipulates in detail the types of strategies that are eligible for CMAQ funding.1 These include the following:
-
Improvements to public transit service, including new and replacement vehicles (but not operating costs that do not arise out of new or expanded service, nor transit-oriented private development);
-
New transit stations, terminals, transit centers or malls, intermodal transfer facilities, and park-and-ride facilities;
-
Short-term promotional subsidies of transit/paratransit fares;
-
Construction or designation of roads or lanes for exclusive use of buses or high-occupancy vehicles (HOVs);
|
1 |
Congestion Mitigation and Air Quality Improvement Program (CMAQ) Guidance Update, FHWA website: http://www.fhwa.dot.gov/environment/cmaqguid.htm (Sept. 2000). |
-
Employer-based transportation management plans, including incentives (but excluding employer-sponsored flexible work schedules);
-
Telecommuting programs, including studies, training, coordination, and promotion (but excluding capital equipment and facilities);
-
Trip reduction ordinances or programs to facilitate nonautomobile travel or reduce the need for single-occupant vehicle travel, including programs or ordinances applicable to new shopping centers, special events, and other centers of vehicle activity;
-
Traffic flow improvements, such as signal improvements and freeway management systems (provided they can be demonstrated to improve air quality), traveler information programs, and electronic toll/fare payment systems;
-
Fringe and corridor parking facilities serving transit or multi-occupant vehicle use;
-
Peak-period or area-specific vehicle use restrictions;
-
Programs for provision of ridesharing services;
-
Construction or redesignation of facilities for exclusive use by nonmotorized vehicles or pedestrians, and bicycle storage/protective facilities;
-
Nonconstruction projects related to safe bicycle use, establishment of bike/pedestrian coordinators, and public education programs;
-
Project planning or development activities that lead directly to construction of facilities or new services with air quality benefits (i.e., the projects themselves have air quality benefits);
-
Alternative-fuel vehicle (AFV) conversions or on-site fueling facilities/infrastructure, provided the fleet is publicly owned or leased and centrally fueled and the primary motivation is air quality attainment; and
-
Intermodal freight facilities/improvements (provided air quality benefits can be demonstrated and facilities are not solely owned/operated/managed by private interests).
In the language of the act, CMAQ funds are specifically not authorized for highway or transit maintenance or reconstruction projects or for new single-occupant vehicle capacity projects.
Organization of Paper
This paper is structured into the following sections:
-
In this Introduction and Background section, the purpose and scope of the study are described, a brief background description of the CMAQ program and its objectives is given, and strategies that are eligible for funding are listed.
-
In the next section, Methodology, an overview of the general approach used to conduct the study, the literature identification and review process, and templates used to store and compile data is given. All analytic approaches and assumptions used to address key methodological issues are described, including the following:
-
Parameters and considerations in compiling transportation and travel impact data;
-
Emission criteria, including pollutants considered, baseline assumptions, computational assumptions and factors, weighting and summation, and emission discounting; and
-
Cost and cost-effectiveness calculation procedures, detailing assumptions regarding capital versus operating costs, cost annual-ization, public versus private costs, consumer versus manufacturer costs, societal and external costs, and transfer payments.
-
-
The Cost-Effectiveness Findings section is the most substantial section of the report, given its purpose of presenting and describing the nature and range of impacts for each strategy category and subcategory:
-
Traffic flow improvements, including subcategories of traffic signalization, freeway management, and HOV lanes;
-
Ridesharing programs, including general regional outreach and matching programs, vanpool and buspool programs, and park-and-ride lots;
-
Travel demand management, including regional or areawide approaches and employer trip reduction programs;
-
Telecommute/telework programs, including employer-based, nonworksite, and nonwork approaches;
-
Bicycle/pedestrian facilities and programs, either site-based or areawide;
-
Transit improvements, including new shuttle or feeder services, new rail transit services or equipment, and conventional transit service improvements;
-
-
Technology and fuel programs, including conventional bus replacements, alternative-fuel buses, and AFV fueling facilities; and
-
Vehicle inspection and maintenance programs. The section also provides limited cost-effectiveness information on two non-CMAQ-eligible strategies:
-
Pricing strategies, including subsidies and discounts and charges and fees, and
-
New roadway capacity.
-
An Analysis of Findings section follows the individual strategy review. In that section, the cost-effectiveness performance of the 19 separate strategy groups is ranked and compared. The importance of various assumptions is discussed, in particular the pollutant weighting ratios that were used. The important differences between strategies in the same group are explored, and finally an estimate of the overall effectiveness of the CMAQ program with respect to strategy performance and how funds have been allocated across strategies is offered.
-
In a Final Thoughts and Closing section, the author’s views of the key findings from the research are provided.
-
An Annotated Bibliography is provided at the end of the paper, citing (along with the source) the strategies that are addressed and giving a general assessment of the quality, value, and eventual use (or reasons for nonuse) of the source in the review.
-
An annex contains analysis tables, which summarize the travel impacts, emissions, and cost-effectiveness for each individual strategy included in the analysis, organized by major category (as listed above).
METHODOLOGY
Overview of Study Approach
The findings in this paper are primarily the result of an extensive literature review and synthesis. Original modeling approaches were not used. Rather, the CMAQ committee desired as broad a sampling of findings from existing experience as possible, with emphasis on measured empirical results as opposed to synthetic results derived through forecasts. Estimates of cost or emission reductions associated with CMAQ funding applications were avoided, by direction of the committee, since these data were earlier found to be variable in
quality and supporting analysis. Also, the purpose of the review was to obtain an objective assessment of CMAQ effectiveness independent of the program.
Various mathematical procedures were used to process and adjust information from the sources that were selected. However, these procedures were strictly for the purpose of filling in blanks (where such an estimate could be reliably made from other information supplied), placing costs and benefits on a common lifetime basis, or updating emissions or costs to current/common levels. As will be discussed later, however, even with some flexibility to control for missing information, the majority of the original source studies reviewed were rejected for critical weaknesses of one type or another.
Once a candidate example was identified in the research phase, the information on that case was transcribed into an individual project “profile.” Physically, this profile took the form of a one-page template (computer spreadsheet), which was designed to compile all critical facts related to the example in one place to facilitate subsequent review, screening on particular criteria, and ultimately acceptance or rejection from the analysis. As illustrated in Figure E-1, information recorded in the profile included the following (the file of these individual profiles is too voluminous to include with this paper):
-
Source information: title, author, and date of the study;
-
Description of critical characteristics and scope (corridor, site, areawide);
-
Impacts on travel: change in vehicle trips, vehicle miles traveled (VMT), transit trips, and congestion (speed and delay);
-
Emission reductions: change in emissions of HC [including volatile organic compounds (VOC) and reactive organic gases (ROG)], NOx, CO, and PM10, measured in tons per day; and
-
Costs and cost-effectiveness: capital (annualized) and operating costs, from CMAQ and non-CMAQ sources (where known), as well as direct private costs.
The profiles were designed to record critical supporting information concerning the methodologies employed in any of the steps (travel, emissions, costs), critical assumptions, time frames, service
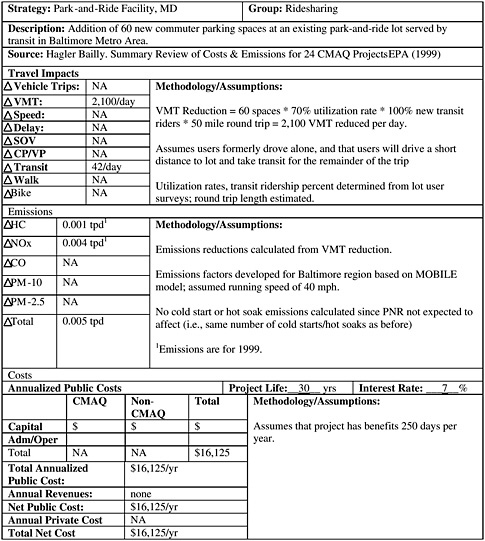
FIGURE E-1 Sample CMAQ project profile summary sheet.
lives, discount rates, and the like. Comments were also entered to document the general quality of the study as appraised by the reviewer, for use in later evaluation and selection of cases.
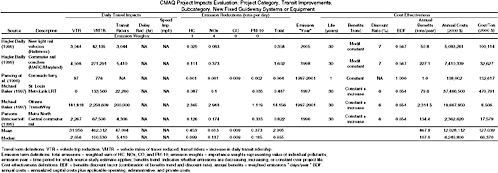
Profiled examples that were found of sufficient quality to be included in the analysis were posted to a summary table, which
displayed key summary information on travel, emissions, and costs for each strategy. A separate table was prepared for each category and subcategory to permit comparison among similar strategies (sharing the same table) and to facilitate computation of “group” statistics (range, median) for comparison with other strategy groups. An example of a summary table is provided in Figure E-2, and the complete set of tables used to support the analysis in the body of the paper is provided in the annex.
Literature Review
As earlier stated, the general approach used to prepare estimates of the impact of CMAQ (and related “control”) strategies was through a literature review and synthesis. More than 80 source documents were consulted for potentially usable information on travel and air quality effects of the identified strategies. The following characterizes the range of sources consulted for the review:
-
State and metropolitan planning organization (MPO) studies of transportation control measures for air quality attainment and state implementation plans (SIPs);
-
Modeling and simulation studies where major travel changes and air quality effects were key study parameters;
-
Guidance and procedure manuals developed by the Environmental Protection Administration (EPA), the California Air Resources Board (CARB), and various National Cooperative Highway Research Program projects or special studies;
-
Formal evaluation studies of actual CMAQ transportation demand management (TDM) and other innovative project implementations;
-
Transportation and air quality model guides and applications test results;
-
Synthesis documents on transportation and air quality impacts;
-
A wide variety of published research papers and reports by individuals or university research departments; and
-
More fundamental research documents or guides on travel behavior changes.
The following particular qualities and minimum requirements were desired in searching for the most useful sources:
-
Time frame: In general, the sources reviewed for this study and the most likely to be selected were among the most recently prepared. The chief reason for this was that emission impacts are quite particular to the time in which they were estimated. In the early 1990s, following passage of the 1990 Clean Air Act Amendments, much of the focus in SIP attainment plans was on achieving VOC and CO reductions. As a result, most of the emphasis in studies of that period was on VOC and CO reduction, which was reflected in the types of strategies emphasized, types of analytic technique used, and types of emissions reported on. NOx (as well as PM) was almost always absent from studies of this era. Maybe as important, steady and significant improvement of fuels and technology through this period, coupled with turnover in the light-duty vehicle fleet, resulted in major reductions in VOC and CO production. Changes in emission rates reflecting this transformation of the fleet mean that relationships between travel changes and emission impacts would be quite different if taken from a study done in the early 1990s as opposed to one done today.
-
Type of analysis: In general, the preferred source of impact information would be from an empirical assessment (i.e., where a project had been implemented and its before-and-after effects carefully documented). Not surprisingly, these types of studies were not plentiful, and an even smaller percentage had provided all of the relevant information needed to prepare a cost-effectiveness assessment. Modeling studies, in which impacts were forecast with the aid of analytic tools, were generally less preferable because of their whole or partial reliance on simulation versus actual events. However, for certain types of applications, particularly corridor- or system-level actions that would have complex impacts on network travel and speeds, model approaches were deemed acceptable and even necessary to determine what particular strategies would accomplish.
-
Diversity: An effort was made to uncover information on all types of strategies and to represent as many types of settings and locations as possible. This may have resulted in being more lenient with the selection criteria for certain studies, given their uniqueness, and more stringent with others, given that they were heavily studied.
-
CMAQ files not to be used: A clear working rule issued by the CMAQ committee was that project examples should not be taken from the CMAQ project application files at the Federal Highway Administration (FHWA). An earlier independent review (Cohen 2000, included as Appendix C), determined that the documentation to support the impacts for many of these project submissions was too limited to support an acceptable evaluation of the project. For purposes of this review, an independent assessment of CMAQ project effectiveness was expected, without drawing on these internal results, potentially biasing the findings.
For these and other reasons, only a modest number of the reviewed studies were ultimately found to be usable as sources. Recurring problems that caused many of the studies to be rejected were as follows:
-
Inappropriate study content: Many of the researched studies were not helpful in providing data on strategy impacts. These studies may have been informative on some particular aspect of the given strategy, such as how to determine its impacts, but provided no directly usable information for the assessment.
-
Missing emission information: Information was sought on VOCs (hydrocarbons), NOx, CO, and PM. A minimum requirement was for VOC and NOx information, given the continued struggles of many areas to attain or maintain ozone standards. In this regard, and for its contribution to fine particulate matter (PM2.5), NOx emissions were seen as critical. If NOx estimates were not provided, it was essential that sufficient supporting data be provided to allow their calculation, in which case the study might be retained.
-
Indefensible analysis: Very few studies were ultimately rejected for this criterion, since generally there would have been other failings (missing data) that would have rendered the study unusable. In fact, the review was generally liberal in accepting methodology unless there were clearly missing steps or insupportable logic, since this helped capture the range of estimates and perceptions being applied in the field.
-
Dated emission information: Studies in which the underlying analysis was acceptable but whose emissions were from a different
-
period were retained if sufficient background information was available to update the estimates.
-
Missing cost information: A surprising number of otherwise good studies had to be disqualified because there was no accompanying information on costs. Since the ultimate measure of effectiveness for the review was cost per ton of emissions reduced, lack of cost information made it impossible to compare the strategy with others. Findings from some studies that had solid and unique information on travel (especially effects on congestion) or emission effects were retained to illustrate the range of potential impacts, though these studies could not be used in the ultimate cost-effectiveness comparisons.
-
Use of percentages: Another group of otherwise solid studies could not be used because their format was to present their findings in terms of percentage changes in travel or emissions related to some baseline (which was not sufficiently apparent that necessary calculations could be made, nor could the changes be related to costs). Some of these studies presented estimates of emission cost-effectiveness, but the estimates were not used because they could not be substantiated from the other data provided.
-
Emission time frame: Some studies were not useful because the time frame for which their emissions were to apply was not specified. Since the methodology in this review involves a conscious effort to discount both costs and benefits to a common basis, failure to include this information might eliminate a study from further use.
The unfortunate result of the application of these criteria was that a number of studies that might have served as valid examples had to be eliminated. The effects of this selection process on the overall results and conclusions of this paper obviously cannot be estimated. However, every possible effort was made to keep a good or unique study in the analysis, and most of the strategy groups have the advantage of a respectable sample size from which to draw conclusions about the category.
The following abbreviated list of studies was eventually relied on to form much of the basis for this review and synthesis:
-
Hagler Bailly Services, Inc. 1999. Summary Review of Costs and Emissions Information for 24 Congestion Mitigation and Air Quality Improvement Program Projects. Prepared for Office of Policy, U.S. Environmental Protection Agency, Sept.
-
Delaware Valley Regional Planning Commission. 1994. Transportation Control Measures: An Analysis of Potential TCMs for Implementation in the Pennsylvania Portion of the Philadelphia Region. Philadelphia, Pa., May.
-
California Air Resources Board. 1999. Methods to Find the Cost-Effectiveness of Funding Air Quality Projects (for Evaluating Motor Vehicle Registration Fee Projects and CMAQ Projects). California Environmental Protection Agency, Aug.
-
COMSIS Corporation et al. MTA TDM Demonstration Program Third Party Evaluation. 1996. Final report, prepared for Los Angeles County Metropolitan Transportation Authority, Feb.
-
Zarifi, S. 1996. Transportation Demand Management: Second Tier Evaluation. Final report, Los Angeles County Metropolitan Transportation Authority, July.
-
COMSIS Corporation and Cynthia Pansing, Transportation Consultant. 1997. MTA Transportation Demand Management Evaluation. Final report, prepared for Los Angeles County Metropolitan Transportation Authority, April.
-
Pansing, C., E. N. Schreffler, and M. A. Sillings. 1998. Comparative Evaluation of the Cost-Effectiveness of 58 Transportation Control Measures. In Transportation Research Record 1641, TRB, National Research Council, Washington, D.C., pp. 97–104.
-
Michael Baker Corporation et al. 1997. The Potential of Public Transit as a Transportation Control Measure: Case Studies and Innovations. For National Association of Regional Councils, Oct.
-
Parsons Brinckerhoff et al. 1999. CMAQ Analysis: North Central Service Impact Evaluation—Phase II. Prepared for Metra, Chicago, Ill., June.
-
Federal Highway Administration. 1995. Transportation Control Measure Analysis for the Washington Region’s 15% Rate of Progress Plan. Metropolitan Planning Technical Report 5, Feb.
-
Lachance, L. C., and E. Mierzejewski. 1998. Analysis of the Cost-Effectiveness of Motor Vehicle Inspection Programs for Reducing Air
-
Pollution. In Transportation Research Record 1641, TRB, National Research Council, Washington, D.C., pp. 105–111.
The manner in which each of these studies was used in the analyses in this paper may be seen in the Annotated Bibliography. The bibliography provides an abstract of the content of each study, as well as an assessment of why it was or was not used in the review. Source documents are generally also identified in conjunction with discussion of the respective strategies as they are presented later in the paper.
Comparability Across Examples
As noted, original analysis or technique development was not within the scope of this commissioned research. However, various adjustments were made to results taken from the studies to “fill in” for missing items where the component information permitted a reasonable estimate, to strip out superfluous information, or to ensure greater comparability across cases and studies (e.g., if emissions were from different periods). The assumptions and procedures that have been used in preparing the strategy impacts that will be presented later are described in this section.
It is also important to note that a second paper was commissioned by the CMAQ committee, dealing with the effectiveness of non-CMAQ-eligible emission control strategies, in particular, advances in vehicle technology and fuels (see Appendix F of this Special Report). These technology-based measures have been analyzed to provide a comparison of the level of impact and cost-effectiveness of strategies eligible for funding under CMAQ with other potential methods for reducing emissions. To ensure the maximum comparability between the results of the two papers, a concerted effort has been made to coordinate the methodological assumptions between the two studies. Because of inherent differences between the two types of strategies and types of studies from which their impacts have been derived, a perfect correspondence in methodologies is not possible. However, for practical purposes, they are as comparable as possible given the circumstances.
Key issues addressed in the interest of methodological parity include the following:
-
Establishment of baseline emissions from which individual strategy emission reductions are measured;
-
Totaling of emission reductions across multiple pollutants, particularly when individual pollutants may carry more or different weight or importance in addressing a given area’s attainment needs;
-
Emission benefit discounting;
-
Program versus component cost-effectiveness;
-
Emissions in attainment versus nonattainment areas;
-
Annual versus seasonal emission adjustments;
-
User costs versus societal costs;
-
Manufacturer versus consumer costs;
-
Estimated versus actual on-road emissions; and
-
Adjustment of costs to constant dollars.
The eventual treatment or disposition of each of these issues is discussed below, either in the context of the specific methodological procedure where it was relevant, or separately where it presented a unique (or inapplicable) circumstance for this paper.
Transportation and Travel Impacts
The primary way in which CMAQ-type strategies effect emission reductions is through changes in travel: either by reducing vehicle trips or travel (VMT) through alternative modes or travel substitution, or through more efficient operation via less congested operating conditions. All CMAQ strategies, even if they are directed at managing congestion, are required to demonstrate tangible emission benefits and to contribute to attainment or maintenance of air quality standards.
Specific travel information sought for each strategy included
-
Change in vehicle trips (absolute, not percentage),
-
Change in VMT (absolute, not percentage),
-
Change in transit trips (absolute, not percentage), and
-
Change in average speed or delay (for congestion purposes).
Almost universally, information on nonmotorized trips or other modal split impacts was not found in the source literature. Transit
trips were estimated by most (though not all) of the better studies, and speed/delay measures were rarely reported, even in the case of traffic flow improvements where they are critical to determining emissions.
Emissions
For a study to be included as an example, it was critical that estimates were provided for each major pollutant. Reductions of hydrocarbons (HC/ROG/VOCs), NOx, CO, and PM10 were recorded. HC and NOx emissions were regarded as most critical for the cost-effectiveness assessment given their role in the formation of ozone, which is the most compelling standard among the NAAQS that most states and regions must achieve. CO is also a regulated pollutant, but it has been largely controlled in most areas through technological advancements. Because CMAQ funds may have been expended for CO-specific strategies (various traffic flow improvements) in past years, an effort was made to document CO reductions where available. Particulate matter presents a different situation from the others. Particulate matter is classified in two primary size categories, “coarse” (PM10, with particle sizes of up to 10 microns) and “fine” (PM2.5, with particle sizes of 2.5 microns or less). Regulatory standards presently exist only for PM10, although its relation to vehicular activity is incidental (i.e., it is less the result of fossil fuel combustion and more the result of road dust raised from unpaved roads). PM2.5, because of its finer particle size, is regarded as the more serious health hazard and is much more closely linked to fuel combustion, although national standards have not yet been established for various reasons. Hence, virtually no estimates of PM2.5 reductions are presented in the literature, and while sporadic reporting of PM10 is found, its importance as a vehicle “emission” is less than the others. However, estimates of PM10 reductions were documented where they exist.
Emission Baseline
A practical concern in comparing emission estimates from different studies relates to the assumptions on which the estimates are based, and in particular, what starting conditions are reflected in the baseline. For example, emission studies performed prior to 1995 were heavily focused on reduction of hydrocarbons (VOCs), given NAAQS
attainment timetables for VOCs. In large part this was attributable to high rates of emissions of VOCs from mobile sources based on technology at that time. Federal engine and fuel standards have since greatly reduced these emissions, and these improvements are reflected in lower fleet emission rates for gasoline-powered vehicles. Thus, were one to use emission estimates from these earlier studies, comparability concerns would arise in that the same travel change would probably elicit a greater absolute or percentage change in VOC emissions than a study performed using current fleet emission factors.
To a large extent, this issue has been minimized by using literature sources that are fairly recent and hence of comparable time frame. In particular, a series of evaluation studies performed by or for the Los Angeles County Metropolitan Transportation Authority (MTA) (COMSIS et. al 1996; COMSIS et al. 1997; Zarifi 1996; Pansing et. al 1998), in conjunction with MTA’s regional TDM demonstration program, provided a large number of project examples for this paper. Those evaluation studies employed common methodological procedures for travel, emissions, and cost reporting. Comparability in emission estimates for these diverse projects was achieved through use of the CARB emission calculation procedures detailed in its 1999 guidance manual. The manual provides methods with examples for determining emissions for the following types of strategies:
-
On-road and off-road cleaner vehicle purchases and repowering,
-
Operation of new bus service,
-
Vanpools and shuttles,
-
Suburban vanpool/carpool park-and-ride lots,
-
Signal coordination,
-
Bicycle facilities,
-
Telecommunications, and
-
Ridesharing and pedestrian facilities.
For studies that applied these methods, emissions correspond to baseline characteristics reflecting 1997–2001 conditions. Studies dating from the same or later time period that did not use the CARB methodology were assumed to reflect comparable baseline conditions in terms of emission factors used in the analysis. The principal
caveat in using the CARB procedure is that it embodies emission factors derived from California’s EMFAC emission model, which are somewhat lower than those found in EPA’s MOBILE models, given the more stringent emission standards for California vehicles. However, this feature does result in a somewhat more conservative projection of the emission savings.
For studies whose emission estimates predated the 1997–2001 period, the CARB methods were used to calculate VOCs, NOx, and PM10 to allow estimates to better reflect a common baseline. Emissions for most of the Washington, D.C., Council of Governments’ (1995) strategies, for example, were developed in this fashion. Whereas the strategies as reported had emissions estimated, the VOC estimates were from 1996 emission factors, and the NOx emissions were not reported at all. Since all necessary travel inputs were available, it was possible to calculate revised emissions using the CARB relationships, thus putting the emission estimates on more common ground.
The CARB procedures are not intended for calculation of CO emissions. While CARB acknowledges that FHWA requests CO reductions for CMAQ projects, its own Motor Vehicle Fee program does not request CO information, since CO is seen as a localized and not a regional problem. Most of the CMAQ and Motor Vehicle Fee projects funded are primarily to reduce regional ozone, and they have little impact on localized CO hot spots. From a more technical perspective, computation of CO emissions relies heavily on detailed speed and delay data, which are generally not provided in the source studies, thereby making after-the-fact calculation difficult. The CARB guidance manual does not even provide emission factors for CO.
For most strategies, use of the CARB procedure for calculating emissions requires knowledge of the projected change in annual vehicle trips and VMT. Annual emissions for each pollutant are then calculated through the following formulation:
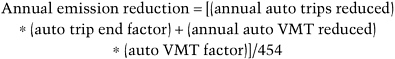
The emission factors are supplied in the following table. Different factors are provided on the basis of the analysis period that is applicable,
so for strategies involving major capital investments where costs are amortized over longer time periods, the method allows for emission rates to be used that reflect gradual improvement in rates over time through technology advances. It should be noted, however, that rates exclusively for the 1–5 year analysis period have been used in this paper, since a discounting procedure is employed in the cost-effectiveness analysis (see section on emission discounting below). This procedure is assumed to reflect the gradual improvement of emission rates over time.
Average Automobile Emission Factors
Note that the vehicle trip end factors, representing the emissions associated with starts and stops, are differentiated into “commute trip” and “average trip” categories. The commute trip factors are higher, since they incorporate start emissions for a commute-type prestart soak distribution plus hot soak emissions divided by daily trips, with the distribution determined from 1991 travel survey data. The factor for average trips was determined from statewide start emissions plus hot soak emissions divided by daily trips. It should be noted that the PM10 factors relate exclusively to VMT and not
trips, since the factor is made up of 0.422 g/mi entrained road dust, 0.008 g/mi tire wear, 0.013 g/mi brake dust, and only 0.006 g/mi exhaust emissions.
Use of these factors in the equation shown results in estimates of grams per year reduced. CARB divides the result by 454 to arrive at pounds per year. All estimates in this paper have been placed in the more universal metric of tons per day, assuming 250 days per year for strategies affecting commute travel unless otherwise specified.
For strategies involving changes to elements of travel beyond simply vehicle trips and VMT, the CARB procedure provides additional guidance and factors as follows:
-
For signalization or other flow improvement strategies, emission reductions are primarily linked to changes in average speeds. Hence, emission factors are provided for different speed ranges, and guidance is provided to account for peak and off-peak travel VMT distribution.
-
For bicycle, carpool, and vanpool strategies, guidelines are provided to take average trip length into account (1.8 miles for bicycle trips, 16 miles for ridesharing trips).
-
For transit or carpool/vanpool strategies, allowance is made for some percentage of trips to involve automobile access at the beginning (emission reductions multiplied by 0.7 in areas with average transit use; by 0.6 in areas with high transit use).
-
Clean fuel vehicle strategies are supported with emission rates for transitional low-emission, low-emission, ultra-low-emission, and zero-emission light-duty and medium-duty vehicles, as well as baseline (Tier 1) vehicles. Factors and guidelines are also provided for baseline and new or compressed natural gas (CNG) buses.
Emission Weighting
Evaluating the effectiveness of a given CMAQ strategy generally amounts to comparing the emissions reduced with the cost to implement and operate the strategy. An accounting dilemma is raised, however, in determining whether to allocate credit to reductions of individual pollutants or simply to determine the cost-effectiveness in terms of the total reduction of all pollutants. While individual pollutant cost-effectiveness is appealing, particularly when certain
strategies are more effective in reducing a given pollutant (e.g., NOx), unfortunately it is generally not possible to allocate costs to individual pollutants.
The alternative is to associate the cost of the strategy with the total net2 reduction of all pollutants. However, this approach raises a new question as to whether reduction of each pollutant should be valued equally. An example of how this could yield misleading results is the combination of reductions of VOCs, NOx, and CO (all considered ozone precursors) into an arithmetic sum: because quantities of CO are an order of magnitude greater than VOC or NOx, CO reductions would dominate the cost-effectiveness determination. In this case, air quality agencies have typically directed that CO emissions be weighted at one-seventh the value of the other pollutants when assessing strategy impacts on total emissions.
In this evaluation, the CMAQ committee has considered various weighting strategies for combining individual pollutant emissions into an overall total. These deliberations considered the health impacts of particular pollutants, which pollutants are currently most crucial in attaining ozone standards, and even secondary effects, in which one pollutant contributes to the level of another that may not be well estimated. An important example of the latter is the relationship between NOx and fine particulates (PM2.5). PM2.5 is generally regarded as the pollutant with the most pernicious health consequences, though to date standards have not been promulgated for its regulation for both measurement and economic reasons. PM2.5 is a complex mixture of both directly emitted particles from the fuel combustion process and secondary particles formed through atmospheric transformation of precursor gases, primarily NOx and oxides of sulfur. Because PM2.5 is not regulated, its levels are not estimated in air quality studies, nor are strategies evaluated for their effects in reducing it. However, given its surrogate relationship with NOx, its importance in emission determinations can be approximated by assigning a higher weight to NOx emissions when computing a total.
A higher weight for NOx than, say, HC or PM10 is further justified by its importance in many areas’ efforts to attain or maintain ozone standards. While technology and fuel advancements have made major progress in reducing HC and CO emissions, NOx has been much more difficult to control. Diesel engines are particularly high emitters of NOx (and PM2.5), control of which threatens to affect the freight industry (trucks, locomotives) and urban transit systems, which rely on diesel buses. Hence, strategies that reduce NOx are often given greater priority in planning exercises.
For these reasons, the committee decided to apply the following weighting scheme in calculating emission reductions from CMAQ and comparative strategies:
The weights of 1:4:0:0 have been used for developing the cost-effectiveness estimates in the impact tables and discussion of strategy effectiveness that follow in the later sections. However, for the purpose of seeing how important the weighting assumptions are to the overall conclusions from this review, the strategies have also been examined under weights of HC = 1, NOx = 1; and HC = 1, NOx = 8. Implications of these different weighting assumptions are discussed in the Analysis of Findings section.
Emission Discounting
Best practice in economic investment analysis calls for comparing project alternatives on the basis of total net benefits. This means looking at the delivery of benefits over the lifetime of the investment and transforming that benefit stream to a net present value through use of a social discount rate. This is then compared with the net present value of the life-cycle costs for the investment, as amortized over the service life of the investment.
Emission cost-effectiveness analyses are typically not done in this rigorous fashion, however. For emission strategies whose service lives are greater than 1 year [i.e., where a capital investment is being made (such as a rail transit line or a traffic signal system)], the significant capital and operating costs are normally “annualized” by
spreading the costs evenly over the life of the project and then applying a discount rate (also referred to as “social” rate of interest) that reflects the opportunity cost of taxpayer resources were they to be invested elsewhere and earn a market rate of return. This annualized cost is then compared with the estimated annual emission reduction for the strategy to ascertain cost-effectiveness. However, standard practice does not recognize that the emission “benefits” may also follow a time stream of delivery. In general, an estimate is made of the emission reduction expected in some “target” year (typically when a conformity demonstration is needed), and this is simply regarded as the “average” emissions for the life of the strategy.
In reality, emissions also follow a life cycle. Seldom does a strategy elicit its anticipated performance in the first year of operation, nor does it maintain a constant level of performance over its lifetime. For example, the effects of strategies that attempt to influence travel behavior (such as transit, ridesharing, employer commute management programs) are likely to increase over time. In contrast, strategies that attempt to improve traffic flow conditions (such as signal management or freeway incident management systems) would be expected to have a fairly powerful (if not maximum) effect shortly after implementation, but those effects are likely to diminish over time as the area and its traffic volumes grow, or as traffic is diverted from other facilities or modes to make use of a comparative advantage in capacity. In such cases, failing to compare the “lifetime” of emission benefits with the discounted lifetime of costs amounts to an “apples-and-oranges” comparison.
To maximize comparability with the non-CMAQ-eligible strategies (see Appendix F) where benefits discounting has been applied, the CMAQ project committee determined that emission estimates for CMAQ strategies—if those strategies have service lives greater than 1 or 2 years—should be treated in a fashion similar to annualized costs. This implies (a) forecasting the lifetime stream of benefits and (b) discounting the benefits to present value using a social rate of interest comparable with that used for the costs. Consequently, a procedure and a set of assumptions has been developed to accomplish the discounting, since (unlike the costs)
annualized benefits are not provided by the source studies for these types of strategies.
Projecting the stream of benefits for individual strategies is the aspect of the discounting procedure requiring the most significant assumptions. None of the reviewed cases presented any indication of having forecast travel and emission impacts over the service life of the strategy. Thus, it was entirely incumbent upon this researcher to profile what those impact lifetimes would look like. As a result, simple rules of thumb were adopted to at least ensure standardized treatment across all strategies.
On the basis of the reasoning introduced previously, three generic categories of benefit lifetimes were presumed:
-
Increasing: Travel and emission impacts would start off near zero and grow to full maturity by the end of the service life. Strategies assumed to fit this pattern include
-
New transit system elements or expansions,
-
Vanpool programs,
-
Ridesharing and travel demand management programs,
-
Employer trip reduction programs,
-
Telecommuting/telework programs,
-
Park-and-ride lots serving bus transit or as rideshare staging locations,
-
Bike/pedestrian facilities, and
-
Pricing (subsidies or fees).
-
-
Constant: Because of either the nature of the strategy or the lack of information from which to judge a particular trend, strategies in this category were presumed to deliver a uniform stream of benefits over the course of the service life. Strategies whose service lives were only 1 to 2 years generally would also fall into this category. Strategies fitting this pattern include
-
Park-and-ride lots serving fixed-guideway transit service;
-
HOV lanes;
-
Transit shuttle services, feeder, or existing service improvements;
-
AFVs; and
-
Vehicle inspection and maintenance.
-
-
Decreasing: Strategies in this category would start out delivering the maximum (or near maximum) impact and benefit and then gradually decline to zero by the end of the service life. Strategies treated in this manner include
-
Arterial signalization projects,
-
Freeway incident management, and
-
New highway capacity.
-
Of course, this is a very naïve simplification of the complex processes that shape the benefit streams of strategies in reality. Whereas it is necessary to assume that the benefits lifetime is defined by the physical project’s service life and that the trend in benefits (increase or decrease) is linear between these end points, one would expect the actual pattern of benefits to be highly nonlinear, rising or falling at different rates as innumerable intervening factors influence the final result. Later, in the actual analysis, the definitions were amended somewhat when it was felt that a strictly increasing, decreasing, or constant benefit stream was incorrect and distorted the strategy’s actual behavior.
To explain these modifications, it is necessary to describe the associated discounting procedure. As illustrated in the diagrams on the next page, the process of discounting involves reducing the benefit produced in a given year by the respective interest rate. Because of compounding, the discount rate increases at a nonlinear rate. Of course, the highest rates of discount occur in the later years of the project; hence the benefits in these out years have the least value in present time. As illustrated by the drawings, this characteristic causes discounting to have the greatest devaluing effect on strategies whose benefit streams are “increasing” (i.e., involve a long-term adaptive process before full effects are realized). In contrast, strategies with decreasing benefit streams are only modestly affected by discounting.
This result raises some interesting philosophical questions to challenge the inherent economic logic present in discounting benefits, specifically as to whether near-term rewards are always superior to long-term rewards. It suggests, for example, that traffic flow improvements, which deliver fairly immediate benefits, are more
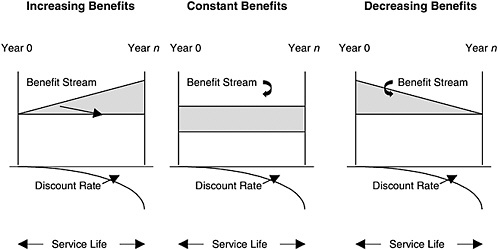
favorable investments than, say, expansion of a transit line, which will likely not be fully utilized for several years. The former strategy offers instant relief but inevitable deterioration as traffic builds (either from secular growth or from diversion from other facilities or modes), while the latter may prove its greatest value in helping to shape long-term growth patterns and provide travel alternatives for future years when it may be more difficult to build new infrastructure. However, since the former strategy front-loads its benefits while spreading its costs over years when it ceases to provide benefits, it may appear to be a better investment than the second strategy, whose benefits are more aggressively devalued because they appear in later years.
Because of these concerns, the appropriateness of simply casting strategies into one of the above three categories was examined closely. For some strategies, such as HOV lanes, where it was not clear that the benefits would increase or decrease over time, it was assumed that the benefit stream would be constant. For other strategies, nominally classified as “increasing” but that would clearly produce benefits in early years, it seemed inappropriate to start the benefit stream at zero. For these strategies, a hybrid case was formed to combine a “constant” delivery of base year benefits with a stream of “increasing” benefits to represent the maturation of the strategy to its ultimate impact. In still another case, it was clear that whereas the costs associated with the implementation would begin in year 0, the project would not be opened for service until some subsequent year; for these, the costs and benefits were discounted in relation to their respective service lives.
To put these discounting procedures into practical use, given the large number of projects with a wide range of service lives and benefit stream characteristics, a system of discounting factors was developed. This amounted to developing tables of discount factors to reflect each encountered combination of interest rate and service life, and for each type of benefit stream (increasing, constant, and decreasing). This was done via spreadsheet to simplify the calculations given simultaneously varying benefit levels and interest rates in each year of the life of the project. The factors are shown in the table on the next page.
Benefit Discount Factors
|
Year |
Interest Rate (%) |
||
|
5 |
6 |
7 |
|
|
Declining Benefits |
|||
|
4 |
0.596 |
0.591 |
0.585 |
|
5 |
0.563 |
0.557 |
0.550 |
|
10 |
0.478 |
0.466 |
0.455 |
|
12 |
0.457 |
0.444 |
0.431 |
|
20 |
0.396 |
0.377 |
0.359 |
|
30 |
0.341 |
0.319 |
0.299 |
|
Constant Benefits |
|||
|
4 |
0.931 |
0.918 |
0.906 |
|
5 |
0.909 |
0.893 |
0.877 |
|
10 |
0.811 |
0.780 |
0.752 |
|
12 |
0.776 |
0.741 |
0.708 |
|
20 |
0.654 |
0.608 |
0.567 |
|
30 |
0.538 |
0.486 |
0.443 |
|
Increasing Benefits |
|||
|
4 |
0.541 |
0.526 |
0.511 |
|
5 |
0.528 |
0.515 |
0.503 |
|
10 |
0.332 |
0.314 |
0.297 |
|
12 |
0.318 |
0.297 |
0.278 |
|
20 |
0.259 |
0.231 |
0.207 |
|
30 |
0.197 |
0.168 |
0.144 |
Time frame or interest combinations not shown in the table were calculated on a case-specific basis. Generally, however, the service lives and interest rates shown in the table covered most of the cases analyzed in the study.
Other Emission Adjustments
In the parallel paper on non-CMAQ-eligible control strategies (Appendix F), Wang also raised issues with the following types of adjustments to emissions, which were considered but not used as a factor in this assessment of CMAQ strategies:
-
Emissions in attainment versus nonattainment areas: Wang indicates that certain emission studies attempt to control for whether the emission reductions actually occur in air quality nonattainment
-
areas. Some analysts argue that emissions reduced in areas that already have acceptable air quality should not be included in the overall determination of cost-effectiveness, because they are less important or unimportant in those areas. Clearly, one can envision how claims of cost-effectiveness for a strategy as universal as a change in vehicle technology, under which consumers in all areas would face the cost and perhaps performance limitations of a new fuel or technology, could come under criticism as to proper definition of costs and benefits. Wang has attempted to incorporate such adjustments where possible in his review. However, in the case of CMAQ strategies, it is difficult to envision a situation where these concerns would be raised, particularly given the restriction of CMAQ funding to nonattainment or maintenance areas anyway. Hence, these adjustments have not been attempted for the CMAQ strategies.
-
Seasonal adjustments: On the basis of similar arguments, some emission studies restrict or weight emissions to the season of the year when air quality conditions actually take advantage of the strategy’s reductions. For example, peak ozone season falls in the summer months, calling into question the claiming of benefits that are delivered during noncritical times of year. This is often an issue in vehicle technology and fuel strategies (e.g., using more highly priced oxygenated fuels to reduce CO emissions during the winter season), and Wang has attempted to control for differences among studies by reporting all reductions on an annual, not seasonal, basis. This approach has been followed for CMAQ strategies, because all the estimates furnished from the literature are on an annual basis.
Costs and Cost-Effectiveness
Types of Costs Considered and Not Considered
Costs included in this evaluation of CMAQ strategies have been limited to the following categories:
-
Annualized capital costs: These include the capital costs to construct and implement the project, reduced to an average annual dollar value based on service life and the presumed social rate of interest (generally between 5 and 7 percent). Costs include but are not limited to CMAQ-derived funding, nor have estimates been made of
-
the effectiveness of only the CMAQ funds where there are multiple funding sources.
Capital costs have been annualized through the use of capital recovery factors (CRFs). A CRF associated with the service life and discount rate for the given strategy is multiplied by the total capital cost of the project to estimate the average annual cost. The table below shows typical project lifetimes for CMAQ-type strategies for use in cost annualization along with the respective CRFs.
Project Lifetimes for Use in Cost Annualization and Capital Recovery Factors
|
Service Lifespan |
Types of Strategies or Facilities |
CRFs at Indicated Interest Rate |
||
|
5% |
6% |
7% |
||
|
1–2 years |
Existing transit service improvements |
0.538 (2 years) |
0.545 (2 years) |
0.553 (2 years) |
|
|
Travel demand management programs Ridesharing programs Vanpool programs Pricing or fare strategies |
|
||
|
4–5 years |
Telecommunications/telework programs |
0.231 (5 years) |
0.237 (5 years) |
0.244 (5 years) |
|
|
Paratransit vehicles |
|
||
|
10–12 years |
Roadway signal systems |
0.130 (10 years) |
0.136 (10 years) |
0.142 (10 years) |
|
|
Freeway management systems (ITS) New buses or alternative-fuel buses |
|
||
|
|
Sidewalk or bike facilities |
0.113 (12 years) |
0.119 (12 years) |
0.126 (12 years) |
|
|
Park-and-ride lots |
|
||
|
20 years |
Roadway improvements, including HOV |
0.080 (20 years) |
0.087 (20 years) |
0.094 (20 years) |
|
|
Rail signalization systems |
|
||
|
30–35 years |
Rail transit systems |
0.065 (30 years) |
0.073 (30 years) |
0.081 (30 years) |
|
|
Parking structures Locomotives or rail cars Pavements and bridges |
|
||
-
Operating and administration costs: These are included where they either constitute the strategy for which CMAQ funds are being expended or are an inextricable part of implementing, maintaining, or enforcing the strategy. These costs are almost universally reported on an average annual basis, so they were simply added to the annualized capital costs to arrive at total annual cost.
-
Private costs: The above costs are typically treated as public costs, being financed from taxpayer revenues through expenditures by public agencies. However, some strategies (e.g., employer trip reduction programs or telecommuting) may require direct outlays of private resources to implement or operate the strategy. Where these costs exist and are separate from the public costs, they have been included in the total.
The following costs or cost items have not been included in the analysis:
-
Incidental costs: Certain strategies, depending on their success level, may lead to associated needs for system expansion, or conversely, may reduce the level of demand for existing services or facilities. A key example would be programs, such as a fare subsidy or parking fee, that would likely increase transit ridership. Since most large city transit systems are already operating at close to capacity during peak periods, the concern is whether the increase in ridership would require additional transit vehicles and service. Similarly, if an employer were to implement a parking cash-out program that resulted in a reduction in the need for employer-provided parking spaces, the employer might be able to divest itself of some of its parking and recoup these resources. For the purposes of this analysis, however, no attempt has been made to account for these associated costs or revenues.
-
Transfer payments: Certain strategies involve the exchange of resources between one societal group and another. For example, an employer implementing a trip reduction program might institute a charge for employee parking. Whereas the parking fee would furnish revenues back to the employer that could be used to defray other costs of the program (or even to provide transit subsidies to other employees), this exchange of revenues between one group and another has not been incorporated in the analysis. Similarly, revenues collected from new transit passengers or proceeds from a roadway congestion pricing project have not been factored into the analysis. This assumption should be carefully weighed when looking at the effectiveness of strategies that involve major exchanges of revenues between groups, since (a) many of the strategies would actually operate with net revenue (or could at least be structured to be self-
-
financing), (b) the revenues could be used to purchase additional service or capacity or turned back in productive ways to users, and (c) perception of cost-bearing by consumers can have major implications for political acceptability.
-
Consumer versus manufacturer costs: Wang notes that pressure on manufacturers to meet new technology standards can have a multiplicative effect on consumers, since manufacturers may not only pass these costs on to consumers through higher prices, but in fact “mark-up” the price of the product to 20 to 40 percent greater than their actual production costs. Wang cites this as an important issue in judging the cost-effectiveness of a given strategy to society when consumers are obliged to shoulder an inappropriate share of the cost burden. While this concern was noted, it has not emerged as an issue in this review of CMAQ strategies.
-
Societal or external costs: Interest has been increasing in finding ways to incorporate the broader costs to society of traffic congestion and air quality impacts when performing transportation planning or policy studies. Examples of these types of costs include congestion time losses, personal and property losses from accidents, noise impacts on communities, and air quality health costs. The CMAQ committee decided not to extend the current analysis to include these types of costs, given uncertainties in their valuation and general absence in the empirical literature.
Constant Dollars
All dollar costs for projects were converted to a 2000 base by using a Consumer Price Index from the U.S. Statistical Abstract. CPI values for respective years in relation to 2000 are shown below, along with the corresponding adjustment factor. The CPI for 2000 is 145.0.
|
Year |
CPI |
Factor |
|
1987 |
105.4 |
1.376 |
|
1988 |
108.7 |
1.334 |
|
1989 |
114.1 |
1.271 |
|
1990 |
120.5 |
1.203 |
|
1991 |
123.8 |
1.171 |
|
1992 |
126.5 |
1.146 |
|
1993 |
130.4 |
1.112 |
|
1994 |
134.3 |
1.080 |
|
1995 |
139.1 |
1.042 |
|
1996 |
143.0 |
1.014 |
|
1997 |
144.3 |
1.005 |
|
1998 |
141.6 |
1.024 |
|
1999 |
144.3 |
1.005 |
COST-EFFECTIVENESS FINDINGS
In this portion of the paper, findings from the review and synthesis of CMAQ and suggested non-CMAQ control strategies are presented on a category and subcategory basis, to the extent permitted by the number of valid studies supporting the area. A summary table has been prepared for each separate category/subcategory, presenting the following information on each strategy where available:
-
Name and description of strategy and location, date, and author of source study
-
Travel impacts
-
Daily vehicle trip reduction
-
Daily VMT reduction
-
Increase in daily transit riders
-
Change in average speed (mph) or hours of delay associated with congestion measures, or both
-
-
Emission impacts
-
Daily reduction in emissions by pollutant (HC, NOx, CO, and PM10)
-
Weighted sum of daily tons of emissions reduced for all pollutants
-
Year or period for which emissions have been calculated
-
-
Cost-effectiveness
-
Service lifetime of strategy
-
Assumed trend in emission benefits over time
-
Compound interest rate used for annualization of costs and discounting of emission benefits
-
Average annual (discounted) emission benefits
-
Average annual costs
-
Cost per ton for emissions reduced
-
Because of the number of tables (19 tables for each of the three weighting schemes), they have been treated as an annex and not incorporated in the text discussion. They are, however, referenced by table number in the text discussion for the aid of reviewers who wish to examine individual cases or details when appraising the reported findings.
An overall summary of the findings with respect to individual strategies is given in Table E-1. The table indicates the number of cases in each category/subcategory. The range of cost-effectiveness (low and high value) and the median value for each are given in the table for the selected pollutant weighting scheme (HC = 1, NOx = 4) in the first group of columns and are given for the alternative weighting schemes (1:1 and 1:8) in the second and third groups of columns. From this information the reader can assess the importance of the weighting assumption on the overall and relative performance of each strategy group.
Traffic Flow Improvements
Traffic flow improvements reduce emissions not through reduction of vehicular travel demand, but through improved efficiency that effectively increases capacity and thus allows vehicles to travel more smoothly and at higher speeds. On arterial street systems, these improvements usually take the form of new or synchronized signal systems, potentially coupled with physical intersection improvements. On freeway/limited-access highways, improved flow is usually accomplished through management of traffic on the system versus traffic entering the system (e.g., through ramp metering) or through management of incidents.
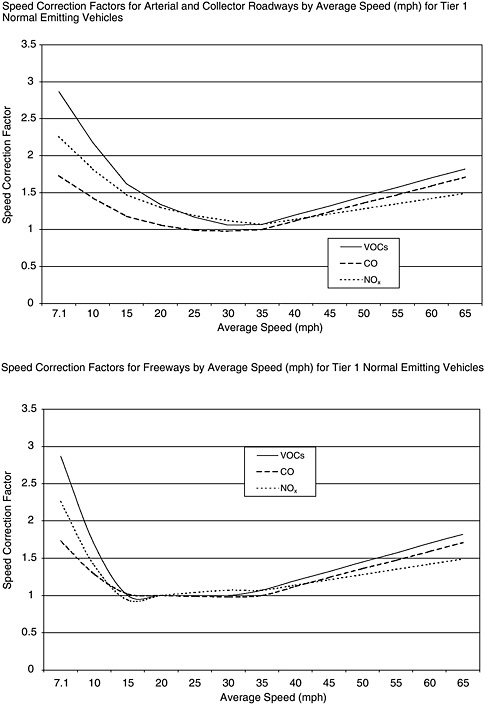
While one would expect that traffic moving under free-flow conditions will perform more efficiently and emit less pollution, standard emission factor models do not explicitly account for the effects of stop-and-go driving. Emission factors used in the models are derived from composite drive cycles, so these uneven flow characteristics must be approximated through changes in average speed as represented in “speed correction factors.” On the average, this probably underestimates the emission savings from certain flow improvements, such as signalization or incident management. However, for other types of strategies, like ramp metering, claimed emission savings may be overstated by this gap in the methodology, since vehicles accelerating rapidly from stop on a ramp into free-flowing traffic emit a substantial percentage of their total trip emissions during that single event (at high acceleration, termed “enrichment,” catalytic converters may be bypassed to avoid damage and premature wear).
TABLE E-1 Cost-Effectiveness of Strategies Under Selected (1:4) and Alternative Weighting Schemes
A related concern in depending exclusively on speed changes for emission reduction is that not all speed improvements reduce emissions. As shown in the diagrams of Figure E-3, this is because emission rates do not change linearly with speed, but rather are high at low speeds, fall to a minimum somewhere in the middle of the speed range, and then increase again as speeds increase. Moreover, this relationship is different for each pollutant and for different settings. Pictured in Figure E-3 are speed/emission relationships for arterial/ collector and freeway conditions.3 On arterial roadways, HC and CO emissions are at a minimum at about 30 mph, while NOx emissions do not reach a minimum until 35 mph. All pollutants then begin to increase again as speeds rise. Since many flow improvement strategies influence speeds in these ranges, it becomes very important to examine not just the change in speed, but where on the curve that change occurs.
On arterial roadways (see Figure E-3), where posted speed limits and traffic signals constrain speeds to moderate levels, improving flow at speeds up to 30 to 35 mph generally should reduce emissions, but if speeds should begin to exceed this level, emissions may increase unless the prior case involved significant delay. On freeways, the situation is different. Emission rates reach a minimum earlier, at a lower speed of 15 to 20 mph. The lower rates are then maintained until 30 to 35 mph, when once again they increase steadily with higher speeds. So on these types of facilities, where congestion is often severe and leads to stop-and-go conditions, improvements in speeds through pulsing of traffic or rapid resolution of incidents can have substantial benefits at the lower end of the speed curve. However, should conditions improve to the extent that traffic flows at speeds exceeding 35 mph, emissions then proceed to increase steadily with speed.
A final issue concerning flow improvements is their effect of diverting traffic from other facilities or modes. This not only increases traffic volumes on the improved facility, but also can reduce or eliminate the emission gains from the improvement. Everything depends on
|
3 |
The relationships depicted in Figure E-3 are speed correction factors. These are adjustment factors multiplied by the average emission rate obtained from the standard drive cycle to approximate how the average rate would change with speed. |
how adjustments occur in the overall travel network. A good emission analysis would be expected to account for each of these effects, although the majority of those reviewed did not.
Traffic Signalization Strategies
Table E-Annex-1 contains five examples of traffic signalization projects. They range in cost from $6,300 to more than $2 million per year and have total annual emission reductions of between 0.8 and 89.6 tons. The cost-effectiveness of the five examples ranges from $7,900 to $128,000 per ton. Median cost-effectiveness is $20,100, reflecting a concentration of examples in the lower end of the cost range.
These examples are the result of fairly credible analyses using local travel models. Each accounts for whether speed will increase or decrease emissions, and some actually account for diverted traffic effects. However, all of the studies use average speeds only, and none project what traffic conditions will be in 10 to 20 years, the cited lifetimes for the respective capital investments. As a result, it has been assumed that the emission benefits for each of these projects will be realized early and then decrease over time.
Freeway Management Strategies
Strategies in this group include both incident management systems and ramp metering. Detailed results are presented in Table E-Annex-2.
There is only one example of the ramp metering strategy in the group, from the Delaware Valley Regional Planning Commission (DVRPC) (1994), and it is estimated to have an effectiveness of $5,000 per ton reduced. However, it does not appear that this analysis in any way accounted for the off-cycle emissions occurring as a result of the ramp stop-and-start activity. Hence it is reasonable to conclude that the emission savings are overestimated and that the cost-effectiveness is deceptively low.
There are three examples of freeway ITS incident management systems. They range in cost-effectiveness from $2,400 (Atlanta) to $544,000 per ton (DVRPC, Philadelphia). The middle-of-the-road estimate is for the Maryland DOT CHART program, and its results
are perhaps the most reliable in terms of both emissions and costs. CHART reduces emissions at a cost of about $200,000 per ton, based mainly on an annual expense of $14 million in capital costs and $5 million in operating cost. It is not clear how much more extensive or sophisticated the Maryland system is than Atlanta’s, but the annual cost of $841,309 makes Atlanta’s incident management system only about 4 percent as costly as Maryland’s, raising doubt as to the accuracy of the Atlanta cost. On the basis of this limited sample, the MDOT CHART system is seen as the most credible estimate of the cost of freeway ITS-based incident management.
Supplemental Traffic Flow Information
Because many of the strategies presented above did not have significant information on their traffic and congestion management benefits, for which potentially important travel time savings benefits might be presumed, the supplemental table below contains a number of examples of traffic signalization projects, incident management systems, and ramp-metering systems for which travel impacts were provided. These impacts include changes in speed, delay and travel time, and in some cases emission reductions. Unfortunately, cost information was not available from the source to permit calculation of cost-effectiveness. It should be noted also, however, that a number of the strategies—in particular, ramp metering—were also associated with increases in traffic volume.
Performance of Sample Traffic Flow Projects
|
Site/Project |
Travel Impacts |
Emission Impacts |
|
Automobile Traffic Signal Improvements |
||
|
Los Angeles: Automated traffic signal control of 1,170 intersections |
41% reduction in stops 44% reduction in delay 16% increase in speeds |
14% reduction in VOC emissions (1994) |
|
Toronto: SCOUT adaptive traffic signal control program (75 signals) |
22% reduction in stops 17% reduction in delay 8% decrease in travel time |
3.7% reduction in HC 5.0% reduction in CO |
|
Garland County, TX: coordination of 127 signals |
22% reduction in stops 14% reduction in delay 4% reduction in travel time |
|
HOV Lanes
HOV lanes achieve their emission benefits largely in the same way as do other flow improvements, by improving flow conditions and raising average speed for vehicles traveling on congested facilities. What differentiates HOV lanes is that they also encourage change in
behavior by providing higher levels of service (higher speed, reduced travel time) for persons who use transit or who rideshare, depending on the restrictions of the particular facility.
The exact extent of the emission impacts of an HOV lane depends on numerous complex and interrelated factors. If the HOV lane is “taken” from the existing roadway cross section, then the issue is whether the number of persons who travel by HOV at a noncongested speed compensates for the number who remain in the mixed-flow lanes and experience the same or worse congested speed. If the HOV lane is “added” to the existing system, then it provides less of a travel time incentive to potential HOV users but provides an across-the-board improvement to all travelers because of the increase in physical capacity. Speeds may be sufficiently improved under these conditions that either NOx emissions rise or new vehicle trips are drawn to the facility from other routes or modes.
In the long run, the issue raised by HOV facilities where new lanes have been added is—as with new highways—whether the new capacity will encourage new trips from further locations whose accessibility has been effectively increased by the change in capacity. Few HOV studies have addressed this phenomenon in their forecasts.
HOV lanes, like other roadway projects, have service lives of about 20 years. On the basis of the above discourse on the factors that influence performance and emissions, it is difficult to know a priori whether a given system will increase or decrease in its delivery of benefits over time. Hence, for simplicity, the compromise in this analysis has been to treat the benefit stream for HOV lanes as constant.
There are only three examples of HOV facilities in Table E-Annex-3, and they reflect extremes in cost-effectiveness. The low range is represented by the Metropolitan Washington Council of Governments (MWCOG) example, which evaluates the impact of a proposed regional HOV freeway network. This system was projected (using a mode-choice model combined with a sketch planning technique) to reduce 0.6 tons of HC and 0.85 tons of NOx per day at an annual cost of $9.5 million, resulting in a cost per ton reduced of $15,100. At the other extreme, the Hartford I-84 HOV lane extension is only a fraction of the scale of the MWCOG network and delivers only about 0.01 tons of HC per day and 0.004 tons of NOx. Against annual costs of $1.47 million, this yields an effectiveness of $336,800 per ton reduced.
The third example in the table is Houston’s Katy Freeway, for which no cost-effectiveness has been calculated. While the example has both emissions and cost data, the project is shown to increase NOx emissions. The cost-effectiveness computation therefore shows a cost-per-ton increased, so for reasons of logic, the result is not reported.
The median for this strategy group is $176,200 per ton. However, on the basis of the large range in the examples and the complex issues discussed, there is considerable uncertainty as to the validity of this measure as indicative of performance in this category.
Ridesharing Programs
After transit, ridesharing is perhaps the most frequently applied strategy to try to manage travel demand. Effects on emissions are realized through a reduction in vehicle trips, which is accomplished by increasing the average number of persons riding in the vehicle through matching people with common travel parameters into car-pools, vanpools, or even 40- to 50-passenger bus pools. Typically, the only travel and emission benefits associated with a ridesharing program have to do with the reduction of vehicle trips: the number of persons converted to ridesharing modes is not nearly enough to expect an impact on systemwide travel conditions or speeds. A concern with ridesharing is that successful campaigns may divert travelers from transit to (less efficient) carpools. However, in most cases the two modes serve very different markets, and ridesharing provides a viable alternative when transit is not available or suited.
A wide range of strategies may be associated with the ridesharing category. There are “programmatic” approaches, consisting mainly of areawide programs that provide information and assistance in matching potential poolers. Of course, individual employers may institute ridesharing programs, although this is often more in the context of a broader employer trip reduction program (discussed later). Vanpool and bus pool programs are important subsets of the ridesharing genre, not only because of their greater efficiency (persons per vehicle) but because they are to various degrees institutionalized, and hence are more formal and frequently backed by employers. Finally, there are supporting facilities such as park-and-ride lots to enable carpools and vanpools to come together at a mutually convenient location.
The absolute effects of these programs are typically modest, both in terms of costs and resultant travel and emission reductions. However, in general, the cost-effectiveness of these strategies is fairly attractive. Most of the estimates of cost-effectiveness in this category are based on empirical data from formal evaluation studies (i.e., not model simulations).
Regional Approaches
Table E-Annex-4 gives five large-scale ridesharing programs taken from the literature. Four are regional rideshare matching and information programs (Riverside, California; Los Angeles; Philadelphia; and Washington, D.C.), and one is a regional program that is focused on universities in the Atlanta area. These programs cost anywhere from $100,000 to $1.7 million per year and are estimated to reduce emissions by 10 to 400 tons per year. The corresponding cost-effectiveness for this group of five strategies ranges from $1,200 to $16,000 per ton, with a median of about $7,400. Most of these programs are financed for operating and administrative expenses only (not capital). Hence, the service life is 1 year and both benefit and cost discounting are inapplicable.
Vanpool/Bus Pool Programs
Table E-Annex-5 lists six vanpool programs, most taken from the Los Angeles TDM evaluation studies of COMSIS, Pansing et al., and Zarifi (1996–1998). These projects are perhaps not typical of employer vanpools, but may be more like the types of publicly based strategies for which CMAQ funds can be expended. As a matter of scale, the projects range in cost from $31,400 to $1.7 million per year and may be capable of reducing between 3.1 and 278 tons of emissions per year. The Houston regional vanpool program is clearly an order of magnitude larger than the rest, both in annual cost ($1.7 million) and in total emissions reduced (278 tons per year), resulting in a cost of $6,100 per ton. The more modestly sized programs in the table, with the exception of the UCLA Vanpool Expansion project ($89,000 per ton), are relatively cost-effective, ranging from $5,100 to $24,300 per ton. The median for the set of six examples is $10,500. As with the preceding programmatic ridesharing strategies, funding for these projects is generally for operations and administration, not capital;
hence the time frame for analysis is 1 year and neither benefits nor costs are discounted/annualized.
Park-and-Ride Lots
Table E-Annex-6 lists four examples of park-and-ride lots to support ridesharing. The examples range from an individual lot to a region-wide system of lots to support an HOV network. The examples range in cost from about $16,000 to more than $5.3 million and are projected to yield between 1.9 and 75 tons of reduction per year. The group suggests a cost-effectiveness in the range of $8,600 to $70,100 per ton, with a median of about $43,000.
Because they involve construction, the costs of park-and-ride lots are generally amortized over a service life of 10 to 12 years, though one of the examples assumes a 30-year life. The benefit stream is assumed to be constant: frequently, demand for parking at park-and-ride lots hits capacity shortly after the lots are opened, after which additional usage is capacity constrained. Park-and-ride lots that serve only carpool staging may not reach capacity as rapidly as lots that serve transit, and particularly rail transit or commuter rail. One concern in using park-and-ride lots as an emission strategy is that, despite shifting travelers to a higher-occupancy mode, the shift still requires a vehicle trip to and from the lot. Thus the emissions associated with the cold start, the VMT, and soak/evaporative events must be netted from the face value of the mode shift enabled by the lot. Most of the better studies, including all of those reported here, make allowance for this automobile access element.
Travel Demand Management
TDM has come to mean a variety of actions that are typically aimed at commute travel. Frequently the employer is the medium for implementing these types of strategies, although its hand may be forced by the imposition of trip reduction ordinances or laws that require implementation of commute management programs. Depending on the type of circumstance (voluntary or mandatory) the program is created under, the types of strategies can be quite different. Voluntary programs may consist only of carpool matching assistance or transit information, while programs required to meet regulatory targets may use
parking management (supply manipulation or charges), subsidies, and transportation allowances.
TDM initiatives can also be mounted by governments, public agencies, and public-private partnerships such as transportation management associations (TMAs). These efforts frequently tend to be more informational and promotional and less involved in specific travel options or pricing strategies. Both types are covered in this review.
Regional or Areawide Approaches
Table E-Annex-7 lists eight examples of TDM initiatives administered through public agencies or TMAs. These range from regional TDM programs to an effort administered by the Metropolitan Atlanta Rapid Transit Authority (MARTA) to engage employers in selling and distributing transit passes. Most of these programs are operations-type projects only and hence have service lives of only 1 or 2 years. Two programs—Atlanta’s regional TMA and the Long Island TDM programs—have extended service lives (12 and 5 years), though it apparently has to do with a multiyear funding commitment and not amortization of a capital investment. For these two programs, benefits have been discounted to be compatible with the annualized costs. Atlanta was assumed to have an increasing benefit stream because of the long-term expansion objectives of the program, while the Long Island case was seen as having a constant impact.
The programs in this category span a cost range from $170,000 to more than $3.5 million per year and are estimated to reduce between 5.7 and 168 tons of emissions per year. Cost-effectiveness for these program examples ranges from $2,300 per ton (IEPA Public Outreach) to $33,200 per ton (LA County TDM). The median for the group is $12,500 per ton.
Employer-Based TDM
The employer-based trip reduction (ETR) program has attracted considerable scrutiny, given the political issues raised by California’s Regulation XV program and the 1990 Clean Air Act Amendments’ Employee Commute Options (ECO) requirement for severe nonattainment areas. Numerous analyses were conducted during the early to mid-1990s in attempts to either condemn or redeem the employer
trip reduction program as a cost-effective way of reducing VMT and emissions. As a consequence, the range of impacts shown in Table E-Annex-8 reflects the assumptions and perspectives that emanated from these two different camps. The regional scale of these programs is reflected in the level of cost and emission reduction potential. The programs range in cost from about $20 million to more than $376 million per year (median of $115 million), and from 2,100 to 9,300 annual tons of emissions reduced. The cost-effectiveness demonstrated in the seven examples ranges from $5,700 per ton (Houston ECO program with $50 per employee assumption) to $175,500 per ton (MWCOG on-site voluntary ETR). The median for the group is about $22,700 per ton.
The major issue separating the various estimates has much to do with the composition of the individual programs. If employers implement a balanced program of measures, including transportation and work schedule options along with incentives and disincentives for their use, these programs are typically very cost-effective. This is because there is an actual change in travel behavior, and in cases where employers are using pricing strategies, the revenues or avoided costs, or both, can help finance the direct costs of the program. However, since incentives and disincentives are often regarded as a threat by employees, employers are reluctant to use such measures. Hence, they may expend substantial amounts of money on strategies that have little or no effect by themselves on changing behavior (such as guaranteed ride home, transportation coordinators, marketing and promotion, TMA membership). These latter programs were the most common among the Regulation XV experience and may be associated with the low impact/high-cost reputation that was ascribed to the program as a whole. This review is not a judgment pro or con on the ETR/ECO experience, only an observation taken from the author’s own extensive work on the subject.4
Telecommuting/Telework Programs
Telecommute/telework programs are frequently employer-based and incorporated within a larger TDM program. However, those analyzed in this study are more areawide than employer-based, corresponding more closely to the types of initiatives that would be funded under CMAQ. In telecommute/telework applications, CMAQ funds may not be used for capital expenditures (i.e., computer equipment). Curiously, though, no CMAQ obligations are specifically designated for telecommute/telework programs in the 1992–1999 period (see Table E-5 in Analysis of Findings section).
Emission reductions from telecommute/telework strategies derive from the ability of the participating individual to forgo travel to a formal work site 1 or more days per week. Theoretically, each day per week that the person did not travel would reduce work-related trips, VMT, and emissions by 20 percent (1 in 5 days). However, mitigating factors impinging on this emission potential include the following:
-
Whether any other travel occurs on the telecommute day that would not have occurred if the person had not worked at home;
-
Whether the telecommuting occurs out of the home or at a remote telework center; if the latter, it is necessary to account for the trip to access the center location;
-
Whether the individual was a single-occupant vehicle commuter, or a transit, carpool, or nonmotorized mode commuter; and
-
Whether the individual changes mode (e.g., from transit or car-pool to single-occupant vehicle) on those days that he or she does travel to the work site.
Seven of the 10 examples of telecommute/telework programs shown in Table E-Annex-9 were taken from the Los Angeles MTA evaluation studies of Pansing et al., Schreffler, and Zarifi. Because these impacts are obtained from actual user surveys and not simulation approaches, they are more likely to account for the effects cited above and hence should be fairly realistic. The other three examples are much larger, regional programs. Their impacts are the result of a top-down regional analysis in which the employment base was categorized into groups likely to telecommute. Telecommute rates (average days per week taken from national studies)
were then applied to these subpopulations to estimate an overall net effect on regional travel. The cost of the programs ranged from $44,000 to more than $83 million per year, and emission reductions ranged from about 0.1 ton to more than 1,000 tons per year (reflecting the gross difference between the scale of the programs depicted). Cost-effectiveness for this set of examples ranges from $13,300 per ton (DVRPC 1994) to $8.3 million per ton [Long Beach Telebusiness (Pansing et. al 1998)], with a median value of $251,800 per ton. With the exception of one example (DVRPC), the cost per ton of these programs is very high compared with most other strategies reviewed in this paper.
Bicycle/Pedestrian Programs
Construction of new bicycle or pedestrian facilities, facilitation or subsidization of bicycle ownership, and education and safety programs for pedestrians and bicyclists are examples of programs in this category. Bicycle and pedestrian programs typically have modest effects on travel and emissions, particularly in the case of commute travel, because of trip length characteristics. Typically, pedestrian trips have an upper limit of 1 mile and bicycle trips a limit of 5 miles, which reduces their viability as substitutes for driving for a high percentage of commuters. They may be much more effective as strategies for reducing vehicle access trips to transit or for nonwork trips that may be made to nearby destinations (provided the land use offers such opportunities). While short bike or walk trips may not displace significant VMT, they do eliminate the cold start portion of the vehicle emission profile. Also, improving pedestrian (or bike) mobility in activity centers can help diminish the need for midday automobile travel and thus increase the possibility of switching modes for the commute trip itself.
Table E-Annex-10 lists 14 examples of these programs, taken from a fairly wide range of source studies. Travel and emission benefits are assumed to follow an increasing trend over time for discounting purposes, because of the adaptive nature of development and awareness over time. The results range from a low of $4,300 per ton (MWCOG Bike Rack and Locker program, 1995) to $295,600 per ton for bike lockers in Santa Clarita (Pansing et al. 1998). Median performance for the group of programs is $84,100. Overall, it does not
appear that these are among the more cost-effective CMAQ strategies, at least in their current form. Coupled with more compact land use and targeted toward their strength (access to transit, mobility in activity centers, local nonwork travel), they might be considerably more cost-effective.
Transit Improvements
This category covers a wide range of possible strategies, as seen in Tables E-1 and E-5. CMAQ funds may be expended on service expansions (involving capital investment), conventional service improvements (improved headways or speeds), innovative services (shuttles, circulators, feeders), construction of parking facilities, as well as purchase of new or replacement vehicles5 (which may be either conventionally powered or alternative fuel).
Transit-related strategies account for 28.3 percent of CMAQ obligations between 1992 and 1999, the single largest obligation category after traffic flow improvements (33.1 percent). However, it should be noted that some substantial capital purchases are included in this total, since states and MPOs use CMAQ funds to purchase new or replacement buses, rail cars, and locomotives, as well as to construct or rehabilitate transit stations, bus stops, and parking facilities. Thus, many of these expenditures may not translate immediately into “improved service” that would attract new transit ridership.
New Transit Shuttle or Feeder Services
In Table E-Annex-11, 15 examples of transit services that consist of new shuttle or feeder services are given. Included in this group are several paratransit programs that serve broader areas than the shuttles, which tends to be reflected in their impact and costs. Because of gross scale differences among the examples, the strategies in this category range in cost from $11,300 to more than $5 million per year, and emission reductions range from 0.1 ton to 158.5 tons per
|
5 |
The replacement of vehicles with new diesel- or alternative-fuel-powered vehicles has been grouped under the Fuels and Maintenance section. |
year. In terms of cost-effectiveness, the examples range from $12,300 per ton (Lake Cook Shuttle Bug) to $1.97 million per ton (West Hollywood Shuttle). This is quite a range, partially explained by the types of service. In general, the shuttle services appear to be the least cost-effective. This is shown by the various Los Angeles– based examples (Pansing et al. 1998), which reflect new specialized local transit services that have attracted relatively modest use in their reported 1 year since introduction. The 10 shuttle services alone range in cost-effectiveness from $1.97 million per ton (West Hollywood Shuttle) to $31,200 per ton (Hollywood Connection) and average about $475,000 per ton. In contrast, the Lake Cook Shuttle Bug, at $12,300 per ton, and the Pace VIP Transit Van Program, at $24,700 per ton, are innovative services that appear to serve the characteristics of their (suburban) markets well, yielding a comparatively attractive cost per ton in reducing emissions (average of $18,400).
New Vehicles or Capital System Expansion
As noted above, this may be the single biggest expenditure category among CMAQ projects (24.7 percent if conventional fuel vehicles and new capital systems/vehicles are included). As such, the six examples presented in Table E-Annex-12 may not do justice to the wide range of strategies and expenditures that could occur under this heading. All but one of the strategies (Coronado Ferry) have long (30-year) service lives, spreading enormous capital costs over a long period, but also allowing for growth in ridership through long-term shaping of land use and travel patterns. Thus, the benefits discounting procedure assumes a “constant plus increasing” trend, meaning that the initial design ridership is likely to be sustained and accompanied by a gradual long-term increase in ridership as the mentioned growth factors develop.
Three of the strategies in the table are new transit guideway systems, ranging from $8,500 per ton to $470,800 per ton. Two of these, the Ottawa TransitWay ($8,500 per ton) and the Metra North Central commuter rail line ($17,600 per ton) have good ridership and appear overall to be sound transportation investments as well as
emission strategies. The St. Louis MetroLink light rail transit (LRT) service, however, has not attracted a ridership commensurate with its costs and hence is in a completely different league with regard to cost-effectiveness.
The Coronado Ferry is an unusual case in that it is only showing funding for a 1-year trial operation; hence, it is not clear whether the modest ridership would increase over a more realistic period of observation. It has the second-poorest cost-effectiveness in the group at $132,600 per ton.
The two examples of new rail transit vehicles are both from Maryland and range from $32,600 per ton for an investment in new commuter rail coaches to $100,100 per ton for purchase of new light rail vehicles for Baltimore’s LRT system expansion.
In light of the above, while the median cost-effectiveness of the strategy group is $66,400 per ton of reduced emissions, evidence suggests that well-targeted investments can deliver benefits in the $10,000 to $30,000 per ton area. These are favorable cost ranges, indicating that context for the given strategy is a very important factor in evaluation of desirability.
Conventional Service Improvements
Table E-Annex-13 presents 10 examples of conventional transit service improvements, consisting largely of improved frequency of fixed-route bus service, though route restructuring and traveler information are also included. The service improvements range in effectiveness from $16,700 per ton (DVRPC suburban bus service improvements) to $120,100 per ton (MWCOG increased commuter rail service frequency). The median for all service improvement strategies, including the MARTA ITS Traveler Information System ($3,800 per ton), is $24,600 per ton, which appears to be reasonably attractive compared with several other categories.
Fuels and Maintenance
This category of strategies has been defined to include each of the following: conventional fuel (diesel) replacement buses for transit operators; alternative-fuel buses (either new or conversion); more general
alternative-fuel programs such as refueling facilities; and inspection and maintenance programs. Each of these approaches is eligible for funding under CMAQ, and together they account for 20.6 percent of all CMAQ funding allocations between 1992 and 1999. Conventional fuel replacement buses alone have accounted for 12.7 percent of total allocations.
Replacement Conventional Fuel Buses
Diesel engines have the characteristic of being relatively efficient in terms of HC and CO emissions, but they are comparatively “dirty” in terms of NOx and PM emissions. Heavy-duty diesel vehicles may make up only 5 to 10 percent of the VMT mix in metropolitan areas, but in 1990 they contributed between 35 and 50 percent of all mobile source NOx emissions.6 Several major improvements have occurred in diesel engine technology, particularly for urban transit buses since 1983, greatly reducing their rates of NOx and PM emissions. Hence, as transit agencies have replaced fleets of aging buses, the new vehicles have also offered a significant reduction in NOx emissions. As illustrated in the table on the next page, there have been several clear jumps in emission technology as new diesel engine standards have come on line.
Clearly, major improvements occurred across the board (HC, NOx, and PM) when buses of the 1973–1983 vintage were replaced with 1984–1990 models, with another slight increase occurring with the introduction of the 1991–1995 vehicles (biggest improvement in PM). However, the post-1995 vehicles demonstrated the next big jump in emission reduction, especially for NOx. Shown in the table for 1996-and-later buses are NOx emission rates for buses in typical “urban” service, with an assumed average speed of 15 mph, and in “commuter” service, with a higher average speed of 45 mph. Emission rates are shown for engines produced under two standards: 4.0 g/bhp-hr and 2.0 g/bhp-hr. NOx emissions for this class of engines are 43 to 79 percent lower than the 1973–1983 versions, and 20 to 72 percent lower than the 1984–1995 models.
Emission Rates for Transit Diesel Buses by Period of Manufacture
|
Year of Manufacture |
VOCs (g/mi) |
NOx(g/mi) |
PM10(g/mi) |
|
1973–1983 |
4.2 |
30.4 |
2.28 |
|
1984–1990 |
3.7 |
22.5 |
1.45 |
|
1991–1995 |
3.7 |
21.5 |
0.70 |
|
1996 and later |
3.1 |
Urban (15 mph): |
0.60 |
|
|
|
17.2 (4.0 g/bhp-hr std) 8.6 (2.0 g/bhp-hr std) |
|
|
|
|
Commuter (45 mph): |
|
|
|
|
12.5 (4.0 g/bhp-hr std) 6.3 (2.0 g/bhp-hr std) |
|
|
Source: Methods to Find Cost-Effectiveness of Air Quality Projects. California Air Resources Board, 1999, p. 43, as taken from MVE17G, Certification and In-Use Tests. |
|||
The service life of urban transit buses is 12 to 15 years, and they generally are used about 40,000 miles per year. At a current cost of $250,000 per bus, replacement of a pre-1984 bus with one manufactured after 1994 would result in an emission savings of between 0.7 and 2.0 tons per year, against an annualized cost of about $27,500 (12 years at 5 percent), and assuming constant delivery of benefits during this period. As shown in Table E-Annex-14A, this results in a cost per ton of between $13,800 (commuter use, 2.0 g/bhp-hr standard) and $39,900 (urban use, 4.0 g/bhp-hr standard). Obviously, if the buses being replaced were newer than the 1973–1983 vintage, the emission savings would be less and the cost per ton would be higher. The other example shown in Table E-Annex-14A, from Maryland DOT, results in the lowest cost per ton, $10,900, of the group. However, the median for the group of five examples is about $16,000 per ton.7
It should be noted that all of the cost-effectiveness estimates for this strategy relate solely to the difference in emission production of a replacement vehicle. They do not include any accounting for emissions saved as a result of diversions of travelers to transit, since it is assumed that the switch in buses would have a negligible effect on ridership itself.
|
7 |
See following section for discussion of the Schimek study, also on the list (see Table E-Annex-14A). |
Alternative-Fuel Buses
Table E-Annex-14 gives 11 examples of clean (alternative) fuel vehicles acquired for transit service. The examples represent a wide range of technologies and scale. Eight of the examples are of CNG-powered buses; five of these are simply replacement services, while three are CNG buses used in new service or service expansions. As a result, the three latter examples have emission reductions based on both ridership effect and lower emission rates, while all the other examples are based only on the difference in emission rates. The final three examples consist of a CNG-powered van and two electric buses.
Again, there is quite a range of cost and effectiveness among the examples, due both to scale and type of technology, as well as to whether emission reductions were based on differences in emission rates only or included the effect of travel mode shifts. The primary advantage of switching to alternative fuels (particularly CNG) is in greatly reduced rates of NOx emissions. Electric vehicles, obviously, are superior in regard to all pollutants.
The least cost-effective examples in the category were the CNG bus replacements. The four cases at the bottom of the table are all CNG replacements, which occurred in the Los Angeles region. The emission reductions for each are the result of simply performing the same service with CNG emission rates (i.e., no travel/ ridership effects) and are very modest, ranging from 0.1 to 2.8 tons per year. As a result, the fairly substantial costs yield a cost-effectiveness of between $443,000 and $569,000 per ton. At the other extreme, the Boise CNG Bus Replacement (Baker 1997) shows a cost-effectiveness of $6,800 per ton. This example also does not claim travel-related emission benefits, but for some reason, the replacement of 28 buses of 1984 vintage with 1994 CNG vehicles was judged capable of reducing 96 tons of emissions per year, most substantially NOx.
In contrast, the electric vans and shuttles appear to have been very cost-effective. The SCE and Laguna Beach examples (Pansing 1998) have annual emission reductions of 23 and 11.5 tons per year, respectively, and cost-effectiveness numbers of $6,700 and $7,200 per ton, making them among the most attractive strategies evaluated. The
results derive only from the change in emission rates (no travel effects) and appear to be due to a much greater difference in emission rates between electric and diesel than was the case between CNG and diesel.
Four of the examples in the table involve CNG bus replacement but also account for the travel effects of these vehicles in revenue service. These examples (all Pansing) are Metropolitan Transit Development Board (MTDB) Route 904, MTDB Route 901, and MTDB Routes 933/934 in San Diego, and the CUSD Clean Air Van Purchase in Los Angeles. The range of effectiveness in reducing emissions is between 0.1 and 22.5 tons per year, while cost-effectiveness ranges from $32,800 to $212,300 per ton, with the two best-performing examples—MTDB Routes 901 and 933/934—having substantial ridership and vehicle trip reductions in comparison with the other two cases.
As a group, the 11 examples have a median annual emission reduction of 2.8 tons, a cost of $219,000, and a median cost-effectiveness of $126,400 per ton.
Schimek (2001) offers another set of cost-effectiveness numbers for comparison with the above, though they must be carefully qualified. While he calculates lifetime benefits (discounted at 7 percent) over the 15-year lifetime of a bus, he restricts his definition of costs to the incremental cost of introducing the new technology and capitalizing it over the life of the vehicle. As would be expected, this results in a more favorable set of cost-effectiveness determinations. However, its direct comparison with the other examples is inappropriate, since when CMAQ funding dollars are spent, they are not spent on just the incremental cost of a new technology, but on the entire “package” that it comes in, that is, the new vehicle and any supporting infrastructure.
Schimek’s intention in performing the analysis is to demonstrate that, while alternative fuel options can produce lower emissions than new-generation diesel buses, it is at a cost that does not justify their use. His analysis compares conventional fuel diesel buses with 1998 NOx standards with pre-1991 models, and then also with methanol-, CNG-, and hybrid-electric-powered versions. Focusing only on the incremental costs, his analysis produced the results in the following table.
Incremental Cost-Effectiveness of Alternative-Fueled Transit Buses
|
Technology |
Lifetime Emission Benefits (tons) |
Incremental Cost (2000 $) |
Cost per Ton, NOx (2000 $) |
Cost per Ton, PM (2000 $) |
|
|
NOx |
PM |
||||
|
1991-1998 diesel |
0.545 |
0.267 |
196 |
360 |
734 |
|
Methanol |
6.051 |
Negligible |
128,534 |
21,242 |
N.A. |
|
CNG |
6.580 |
0.231 |
88,570–143,796 |
8,334–13,488 |
383,420–622,494 |
|
Hybrid-electric |
4.198 |
0.242 |
35,428–172,972 |
8,439–41,203 |
146,397–714,760 |
|
Source: Schimek, Reducing Emissions from Transit Buses (2001). |
|||||
Using this incremental cost approach, Schimek estimates the cost-effectiveness of new-generation diesel buses in reducing NOx to be $360 per ton, compared with $21,200 per ton for methanol buses, $88,600 to $143,800 per ton for CNG buses, and $35,400 to $173,000 per ton for hybrid-electric. PM reductions come at an even greater advantage for the new, cleaner diesel over the AFVs.
If, on the other hand, one were to compute a full cost for the various options as Schimek’s incremental cost plus the base cost of a bus (assumed to be $250,000), the rank order of the options changes dramatically. Suddenly the new conventional diesel buses (which have relatively poor NOx emission rates compared with the AFVs) show a cost-effectiveness of $478,500, while methanol reduces NOx at $64,300 per ton, CNG reduces at $57,200 per ton, and hybrid-electric at $86,900 per ton. From the standpoint of CMAQ funding, the full cost comparisons seem to be more appropriate and, hence, suggest that the alternative-fuel buses are more cost-effective, and certainly much more aggressive at reducing NOx emissions, than the diesel. For PM, there appears to be no major difference among the options (except for methanol, which is described as having no benefit).
The major unresolved issue is whether CNG buses are cost-effective. On the basis of the modified Schimek analysis above, they appear to be the best option on the list of bus technologies. However, they show a range from as low as $6,700 per ton (NOx plus HC) to $570,000 per ton (NOx plus HC), while the modified Schimek example would fall somewhere on the low end of this range at $57,200.
Even at this level, the CNG buses are still among the more expensive of the strategies in the overall CMAQ list in Table E-1.
Other Alternative-Fuel Programs
Two programs listed in Table E-Annex-14B serve as examples of general-purpose alternative-fuel strategies (versus transit vehicles in the previous section). These are the Fairfax County, Virginia, Alternative Fuels Program and the Douglas County, Georgia, Alternative Fuels Refueling Station (Hagler Bailly 1999).
The Virginia program provides loans, grants, and matching funds to encourage use of alternative fuels in fleets (e.g., taxicabs, shuttle vans) by making up the difference in cost between the conventional and the alternative-fuel vehicle. This program is estimated to reduce 4.4 tons per year (on the basis of differential emission rates only, not VMT) at a cost per ton of $31,600.
The other example—Douglas County—entails construction of an alternative-fuel station at the site of a future multiuse transfer station, providing a centralized fueling site for 122 county fleet vehicles, transit vans, and buses. The primary benefit is in the centralized location of the site, which is estimated to save 50 miles of unnecessary travel per day and an estimated 6.1 tons of emissions per year. This program has a service life of 20 years, which helps bring down its average yearly cost, while benefits are assumed to remain fairly constant (they would actually increase as the fleet grows) over the period. This results in a cost per ton of about $4,000.
Vehicle Inspection and Maintenance
Table E-Annex-15 presents comparative information on five different types of vehicle inspection and maintenance (I&M) procedures, ranging from the standard idle test to the more advanced IM240 procedure, which tests vehicles in motion. The standard idle test, which is reasonably effective at detecting hydrocarbon emissions, does not do a particularly good job with NOx. The IM240 test forces the vehicle to operate (via dynamometer) in a more realistic drive cycle, with accelerations and decelerations as well as steady-state running.
The results in Table E-Annex-15 were taken from a 1998 TRB paper by Lachance and Mierzejewski focusing on application of
statewide I&M procedures in Florida. The authors compared the state’s existing annual standard idle test with the same test administered biennially, and then with the more involved IM240 test. The IM240 procedure is evaluated in three forms, but all tests are conducted biennially.
The cost side of this analysis is different from other strategies discussed in the paper. The authors chose to evaluate the programs from the standpoint of costs to the vehicle owner. Thus, the estimated cost of the procedure is the sum of the cost of the inspection itself, the driver’s time to reach the facility and have the test conducted, the vehicle operating cost to get to the test site, and the average expected cost of repairs.
The analysis suggests an overall range of cost-effectiveness for I&M of between $1,800 and $7,000 per ton, with a median of $1,900. The IM240 test, while more intensive, does cost the consumer slightly more than the idle test, but because it is so much more effective at reducing emissions, its cost per ton is in the $1,800 to $1,900 range, versus $5,800 to $7,000 per ton for the idle test.
Non-CMAQ Strategies: Pricing
Although pricing strategies are not explicitly named as eligible for CMAQ funding, and no funding obligations are shown for them through 1999, under certain circumstances strategies with pricing characteristics might actually be eligible for CMAQ funding. Examples would include start-up subsidies for transit or vanpooling services or for supporting employer trip reduction programs (including incentives, according to the CMAQ guidance). However, the primary purpose for including pricing strategies in this review is to compare them with the conventional strategies that have been funded under CMAQ.
Pricing strategies generally fall into two categories: subsidies (or discounts), which are designed to serve as incentives for desirable behavior (switching modes, traveling off-peak, etc.), and charges (including fees, taxes, and surcharges), which serve as disincentives for such behaviors as driving alone or traveling during peak-demand periods. Subsidies involve a direct outlay of resources to “buy” a particular result, with no return other than the objective of the strategy (e.g., to reduce vehicle travel or emissions). Fees and surcharges, on
the other hand, use pricing as a way of having the “market” force choices on the basis of consumer economics; in addition to achieving the travel or emission objectives, these strategies also usually generate revenues that cover (or in many cases exceed) the direct costs of the program. What happens to this revenue influences the nature and cost-effectiveness of the strategy. If, for example, revenues from a parking fee program are used to subsidize transit passes or carpool parking, the fee levied for parking will have a multiplier effect on ultimate behavior, since the disincentive effect is strengthened by the addition of an incentive effect.
A special characteristic of pricing strategies is that they generally have an immediate effect on behavior (since they can be implemented rapidly). But, perhaps as important, they also serve as signals for long-term consumer planning and decision making (land use locations, development patterns, modal options) such that the long-term effects are likely to be even more important than the initial effects.
Tables E-Annex-16 and E-Annex-17 present examples of these incentive and disincentive strategies, respectively.
Subsidies/Financial Incentives
Table E-Annex-16 presents 14 examples of pricing strategies used as incentives. They range from discounted transit fares to vanpool subsidies, voucher systems, parking discounts, and parking cash-out. Cost-effectiveness results in the overall category range from a low of $800 per ton to $471,000 per ton, with a median of $46,600.
The wide range of differences in impacts is due to several factors, though the service life issue is not among them. Each of these strategies, by definition of the source studies, is a 1-year program based on the funds being used for operations only and not construction. The effects on travel and emissions of this short time period may be muted because the measure may not be in place long enough to gain maximum awareness or may not inspire confidence in its permanence.
Five subsidy strategies involve reductions in transit fare: the MWCOG regional fare media with discount, single-price transit service, and half-price feeder service, and the DVRPC 20 percent systemwide fare reductions and $25 TransitCheck promotion. The range for this group of strategies is $5,700 to $39,400 per ton, with a median
of about $6,700. While both of these source studies estimated the travel effects using the established regional mode split model, the MWCOG strategies estimated significantly more response (transit ridership and VT/VMT) and hence emission reductions for similar levels of cost.
Five of the examples involved subsidies for taxi, vanpool, or para-transit use (Pansing et. al 1998). These examples ranged from a low of $800 per ton (Route 14 vanpool subsidy) to $471,000 per ton (Burbank flat-fare taxi), with a median of about $65,000. Apparently, the major difference among the cases is in the ridership success of the program. The lowest-cost programs were those that attracted the most riders and hence diverted the most vehicle trips.
The remaining four examples deal with some variant of travel voucher or parking fee rebate (cash-out). These programs all were demonstrated to be fairly expensive because they involve granting subsidies to a potentially large number of recipients, including those who may already be taking transit or ridesharing. Hence, the cost of these strategies ranges from $53,900 (MWCOG transit cash-out) to $238,500 (MWCOG free parking for carpools and vanpools), with a median of about $121,000.
Fees and Charges
Table E-Annex-17 presents an array of pricing strategies applied as traveler charges or fees, representing a disincentive to driving. They include workplace parking fees, pollution or mileage fees, and congestion pricing. The range of impact for these six examples is $800 to $49,400 per ton, with a median of $10,300 per ton. In practice, most of these strategies would raise enough revenue from the fees to cover their direct costs and would operate at close to zero cost per ton, or would generate net revenue that could be used for subsidies or service improvements to further enhance the effect of the base strategy. As with the subsidy strategies, each of these examples is assumed to have a service life of only 1 year, which likely diminishes an increasing long-term benefit stream.
Non-CMAQ Strategies: New Roadway Capacity
An important challenge raised by the CMAQ review process is in whether investment of the resources currently reserved for CMAQ-
eligible projects would yield higher returns to air quality, mobility, and public welfare if they were invested in roadway capacity expansions. This question provokes one of the most debated topics in transportation planning: whether new highways provide temporary relief to congestion and air pollution problems but trigger long-term adjustments in development and travel patterns that eliminate the initial gains and perhaps lead to more severe long-term conditions. The big issue, therefore, in evaluating the effectiveness of new highway capacity as an air quality measure concerns the long term. A substantial body of evidence shows that new highway capacity is fairly rapidly met with new demand, since by its very nature, it enhances accessibility to areas within its service envelope.8
Unfortunately, the review was unable to identify any studies that comprehensively investigated the relationship between highway investment, subsequent land use and travel effects, and emissions and costs. Technically, most major urban transportation investment studies that evaluate alternatives for a corridor should generate the type of information necessary to perform such an analysis: they would need to furnish information on the expected travel utilization—volume by mode and level of service—throughout the 20- to 30-year lifetime of the improvement. From such information for a major highway system expansion alternative, one would expect to observe the following chronology of events: (a) disruption during the period of construction, probably with an increase in emissions resulting from traffic congestion and stoppages and diversions to alternative routes, possibly offset by the shift of some automobile traffic to transit or HOV; (b) in the years immediately after opening,
a notable improvement in highway travel speed and congestion, most likely resulting in a reduction in emissions, provided that major diversions do not occur from alternative modes and parallel facilities and that speeds do not rise to nonoptimal levels (above 40 mph); (c) a long-term trend toward increased traffic because of the relative advantages for development of the area served by the corridor, resulting in increased emissions due to both higher volumes and advancing congestion; and finally (d) a long-term state where congestion returns but with higher volumes than before, longer trip lengths than before, and land use patterns with greater automobile dependency than before.
Thus, to properly assess the cost-effectiveness of highway capacity expansion as an air quality and congestion management strategy, it would be necessary to quantify the changes during the lifetime of the improvement, as profiled above. Unfortunately, this time stream of information is generally not developed in planning studies, such that the “crossover” points can be properly evaluated (using discounted benefits and costs) to determine what the net effect would be over the course of the project.
One study that sheds some light on the long-term consequences of highway investment on travel and emissions was performed in 1997 by Robert Johnston and Caroline Rodier of the University of California at Davis, as part of the PATH research program. The study examined various major system development plans in the Sacramento region as set forth in the Sacramento Area Council of Governments (SACOG) long-range transportation plan. These included major regional investments in light rail transit, new (automated) freeways, and an extensive HOV network, analyzed alone and in combination with concurrent pricing and land use concentration scenarios. The study estimated the travel, congestion, and emission benefits for each strategy and scenario “package” for 2015. Unfortunately, costs were not developed for any of the strategies (a consumer benefits approach was used), nor were estimates of travel or emission conditions in the intervening years leading up to 2015 developed. Hence, the primary value of the Johnston/Rodier analysis is for creating a view of the long-term effects of major investment strategies and, secondarily, for appraising the important supporting roles of pricing and land use strategies.
The particularly valuable aspect of the Johnston/Rodier analysis was the evaluation of various types of new, high-level highway capacity improvements. These improvements did not involve construction of substantial new pavement miles, but rather increased capacity and performance through ITS technology. Specific facilities were to be “automated” so that vehicles could travel at high sustained speeds (60 or 80 mph) with a very small headway (1/2 to 1 second of separation) between vehicles. One lane was also added to ramps in the existing network (no-build scenario) and to both sides of arterials or connector links serving the freeway access points. Also evaluated was an automated HOV network consisting of a 184.5-mile HOV lane and freeway system set to perform at either 60 or 80 mph sustained speeds, and accompanied by the ramp and arterial/connector lane additions.
Impacts for the strategies were estimated through use of SACOG’s regional travel forecasting model system. The model had been recently updated and enhanced to state-of-the-art capability, including feedback throughout the model chain, the addition of choice-based formulations to modules other than modal choice (e.g., route and destination choice), and availability of microsimulation tools to more accurately estimate speed and delay conditions on facilities. The SACOG model system was used to simulate the effects of each scenario on 2015 travel conditions, with impacts gauged against the performance of a no-build scenario.
A brief description of the strategies that were tested is as follows:
-
No build: All new freeways, expressways, HOV lanes, and transit projects listed in SACOG’s 1993 long-range plan (LRP) and in the 2015 network were removed.
-
Full automation (60 mph): All freeway lanes automated and set to 60 mph with a 1-second headway. In addition, one lane added to all ramps in no-build network and both sides of arterials or connector links to freeway lanes.
-
Full automation (80 mph): Same as above, but lanes set to operate at 80 mph with 1/2-second headway.
-
Partial automation (60 mph): Same as full automation, but only one freeway lane automated instead of all.
-
HOV: Includes all new HOV lanes, freeways, and expressways listed in the 1993 LRP (184.5 lane miles).
-
Automated HOV (60 mph): HOV lanes are automated and set to 60 mph with 1-second headway. Capacity of lane set to 3,600 vph to reflect the reduced headway. Base HOV network has one lane added to SR-50, where a gap exists in the planned network.
-
LRT: 61.5 track miles of new LRT projects as listed in the LRP.
-
Super LRT: Expanded rail network with new lines and line extensions, plus new and extended feeder bus service, and headways on all services reduced by half.
-
Pricing: $0.10/mile congestion pricing on freeways, $2 parking charges in areas without current charges, and $2/gallon fuel tax (adjusted down to $0.60/gallon to account for long-term vehicle technology shifts).
-
Centers: Projected growth in households and employment channeled into 45 transit-oriented centers.
The various strategies were tested individually and in select combinations, resulting in the travel and emission impacts summarized in Table E-2. The strategies are listed in order of emission reductions, from poorest to best. The following are the key findings:
-
The highway capacity improvement strategies generally account for the greatest travel delay savings but the poorest emissions of all the strategies. The fully automated freeways increase emissions over the no-build case by 40 to 220 tons per day, mainly as a result of significant increases in vehicle trips and VMT, as well as higher operating speeds (60 to 80 mph) that fall in the upper range of the speed/emission curves.
-
When combined with the concentrated land use (centers) strategy, the automated freeways produce even higher comparative benefits in travel delay savings while slightly improving emission performance over the basic freeway automation scenario above. They do this by reducing vehicle trips against the no-build case through greater bike/walk use, though VMT still increases significantly.
-
The HOV scenarios (each of which involved addition of capacity) also acted to reduce travel delay but to increase vehicle trips, VMT,
TABLE E-2 Analysis of Sacramento Transportation System Investment Alternatives
-
and emissions. However, the HOV approach resulted in significantly less VMT and emissions than the unrestricted automated freeways. Emissions under the HOV options ranged from 14 to 35 tons per day more than under the no-build scenario.
-
The LRT option, by itself, was not particularly effective, and in fact resulted in an increase in vehicle trips, VMT, and emissions over the no-build case, while performing worst of all the scenarios in terms of travel delay reduction. When teamed with pricing or land use strategies, however, the light rail scenarios are among the best in terms of emissions and travel delay reduction. The LRT scenario teamed with land use centers results in an emission reduction of 14.2 tons per day, and LRT combined with pricing results in a reduction of 28.1 tons per day.
The general lessons from this work are that major highway capacity expansions may provide congestion relief but most probably will not result in emission reductions over the long run. HOV and transit can have positive effects on both emissions and travel delay, but those effects are marginal unless supported with pricing and land use strategies. This longer-term view suggests that the many CMAQ strategies reviewed earlier in this section should have their impact potential taken with a grain of salt. That is, it is important to look at the context in which the strategies may be implemented and the effects that they can deliver over time. Similarly, it is important to be cautious in encouraging the short-term benefits of capacity expansion in relation to long-term performance and sustainability.
ANALYSIS OF FINDINGS
Comparative Cost-Effectiveness of Strategies
If the strategies discussed above are mapped in terms of their range of cost-effectiveness and then ranked in relation to their median values, they show the comparative effectiveness illustrated in Figure E-4. The strategies demonstrating the best cost-effectiveness characteristics (least cost per ton) are seen at the right of the chart, while those with the poorest performance are located at the left of the chart. For comparison purposes, the median cost-effectiveness of all 139 strategies examined was about $66,300.
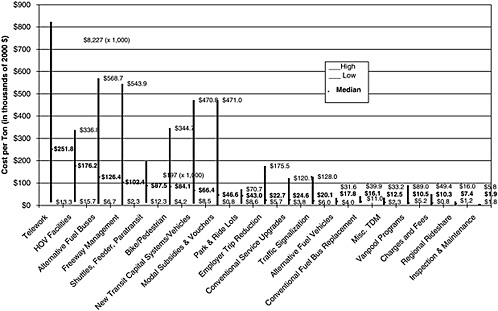
About half of the strategies displayed in the chart have median cost-effectiveness performance of between $2,000 and $23,000 per ton reduced. Moreover, the range of most of these strategies is fairly narrow, which suggests that the median is not a statistical quirk but represents performance that is fairly likely to happen when strategies of this type are implemented. In order of ranking, the strategies found in this top group are as follows:
-
I&M programs (median = $1,900 per ton),
-
Regional ridesharing programs ($7,400 per ton),
-
Charges and fees (not an eligible CMAQ strategy) ($10,300 per ton),
-
Vanpool programs ($10,500 per ton),
-
Miscellaneous travel demand management programs ($12,500 per ton),
-
Conventional fuel transit bus replacements ($16,100 per ton),
-
AFV programs (not AFV bus replacement) ($17,800 per ton),
-
Traffic signalization ($20,100 per ton),
-
Conventional transit service improvements ($24,600 per ton), and
-
Employer trip reduction programs ($22,700 per ton).
In marked contrast to the above, the following strategies did not— as a group—demonstrate favorable cost-effectiveness:
-
Telecommute/telework strategies ($251,800 per ton),
-
HOV lanes ($176,200 per ton),
-
Alternative-fuel buses ($126,400 per ton),
-
Freeway management ($102,400 per ton),
-
New transit shuttles or feeder lines ($87,500 per ton),
-
Bicycle/pedestrian facilities/programs ($84,100 per ton), and
-
New transit capital investments or vehicles ($66,400 per ton).
Importance of Pollutant Weighting Assumptions
The determination of strategy performance is, of course, dependent on the importance of the weights assigned to the various pollutants when computing total emission reductions. The cost-effectiveness
calculations that result in the values and rank ordering shown in Figure E-4 are the result of assigning weights of 1 to reductions of HC and 4 to reductions of NOx. Emissions of CO and PM10 are not included in this weighting scheme, for reasons that were presented in the section on methodology.
With a weighting ratio that values NOx emissions 4 times greater than HC, clearly strategies that have a comparative advantage in reducing NOx are going to perform much better than those that do not. To see how sensitive the study conclusions about comparative effectiveness of strategies are, each of the strategy examples was also evaluated on the basis of alternative weighting schemes that test the importance of the NOx weighting assumptions in the standard case. The alternative weighting schemes of 1:1 and 1:8 (HC to NOx) result in the pattern of high/low range and median cost-effectiveness displayed earlier in Table E-1. That information is presented in an alternative format in Table E-3, which shows how the ranking of the strategies would change under the two alternative weighting schemes.
Pictured in the first two columns of Table E-3 are the 19 strategy groups ranked in order of median cost-effectiveness—from best to worst—for the standard 1:4 weighting case. The adjacent sets of columns give the median cost-effectiveness values for the same strategies weighted with ratios of 1:1 and 1:8, respectively. To the right of each of those cost values is the rank that that strategy would have if the ranking were based on that particular weighting scheme. This can then be compared with the 1:4 standard case to see how much the valuation would change if only the weighting assumptions were changed.
Several interesting observations result from this analysis. First, the top five strategies do not change in rank as a result of the change in weighting assumptions. I&M remains the most cost-effective overall strategy, followed by regional rideshare in second position, charges and fees in third, vanpool programs in fourth, and miscellaneous TDM in fifth. Elsewhere in the list, strategies that do not change their order of ranking when the weighting assumptions are changed are AFV (not replacement buses) programs in 7th position, new transit shuttle and feeder services in 15th position, freeway management strategies in 16th position, and telework in last place in 19th position.
TABLE E-3 Rank Order of Strategies by Median Cost-Effectiveness and Weighting Scheme
Most of the changes in rank order that do occur are not particularly significant. The conventional transit service improvements category becomes slightly more attractive under the high (1:8) NOx weight-ing, rising from 10th position to 9th. Under the low NOx weighting (1:1), park-and-ride lots drop from 11th position to 12th, new transit capital systems and improvements drop from 13th position to 14th, and alternative-fuel buses drop from 17th position to 18th. Strategies that become more attractive when NOx is weighted at the lower 1:1 ratio are modal subsidies and vouchers, moving from 12th position to 11th, bike/pedestrian facilities, moving from 14th to 13th, and HOV facilities, moving from 18th to 17th.
Those strategies affected the most by the different pollutant weighting assumptions are conventional fuel bus replacements and traffic signalization. Conventional fuel bus replacements offer significant reductions in NOx over older models and hence look particularly attractive under schemes with higher NOx weights; they drop from sixth position to ninth when the low NOx weight ratio of 1:1 is used. Traffic signalization, on the other hand, looks better when NOx is de-emphasized, since these strategies were frequently observed to increase NOx emissions. These strategies improve from 8th to 6th in the rankings when the 1:1 weight ratio is used and fall from 8th to 10th when the 1:8 weight ratio is used.
Evaluating Cost-Effectiveness Within Strategy Categories
While the range, median, and ranking of the cost-effectiveness performance of the CMAQ strategies go a long way toward revealing which strategies are most or least effective, unfortunately a lot of insight is lost in the gross averaging approach. In particular, if one were to look at the strategies one by one, it would be clear that there are both extremely good and extremely poor examples in virtually all of the strategy groups. Table E-4 has been prepared to illustrate this point.
Table E-4 indicates that the experience follows a bimodal, and almost a bipolar, distribution. Of the 139 cases included in the analysis, 36 (or 26 percent) had very attractive cost-effectiveness performance of under $10,000 per ton. If the envelope of acceptable cost-effectiveness is extended to $19,999, 39 percent of all cases are accounted for, and if $29,999 is the threshold, fully half of the entire sample is accounted for. However, at the other extreme, 49 cases, or 35 percent, are above the $70,000 per ton level (sample median estimated at $66,300), many of which are considerably above this threshold. Moreover, this dichotomy occurs across the majority of strategy groups—in other words, very successful and very poor examples can be found in each category, raising the important question of whether it is the strategy or the implementation that is responsible for the result.
Some strategies seem to rise to the top consistently despite this distributional characteristic. For example, regional rideshare (5 cases
TABLE E-4 Number of Project Examples by Project Category and Cost-Effectiveness Level
|
|
Cost per Ton (in 2000 $) |
|||||||
|
< $10,000 |
$10,000–$19,999 |
$20,000–$29,999 |
$30,000–$39,999 |
$40,000–$49,999 |
$50,000–$59,999 |
$60,000–$69,999 |
$70,000+ |
|
|
Traffic signalization |
2 |
|
2 |
|
|
|
|
1 |
|
Freeway management |
2 |
|
|
|
|
|
|
2 |
|
HOV facilities |
|
1 |
|
|
|
|
|
1 |
|
Ridesharing—programmatic |
3 |
2 |
|
|
|
|
|
|
|
Ridesharing—vanpool/buspool |
2 |
2 |
1 |
|
|
|
|
1 |
|
Park-and-ride |
1 |
1 |
|
|
|
|
1 |
1 |
|
Regional TDM |
4 |
1 |
2 |
1 |
|
|
|
|
|
Employer trip reduction program |
1 |
2 |
1 |
|
1 |
1 |
|
1 |
|
Telework |
1 |
|
|
|
|
|
|
9 |
|
Bike/pedestrian |
1 |
1 |
1 |
|
|
|
2 |
9 |
|
Transit shuttles |
|
1 |
1 |
1 |
1 |
2 |
|
9 |
|
Transit capital improvements |
1 |
1 |
|
1 |
|
|
|
3 |
|
Transit service improvements |
1 |
2 |
4 |
1 |
|
|
|
2 |
|
AFV buses |
3 |
|
|
1 |
1 |
|
|
6 |
|
Replacement buses |
|
3 |
1 |
1 |
|
|
|
|
|
Other AFV programs |
1 |
|
|
1 |
|
|
|
|
|
Inspection and maintenance |
5 |
|
|
|
|
|
|
|
|
Subsidies and discounts |
5 |
|
1 |
1 |
|
1 |
2 |
4 |
|
Charges and fees |
3 |
1 |
1 |
|
1 |
|
|
|
|
Total (139) |
36 |
18 |
15 |
8 |
4 |
4 |
5 |
49 |
|
Percent |
26 |
13 |
11 |
6 |
3 |
3 |
4 |
35 |
under $20,000, none over $70,000), vanpooling (4 of 6 cases under $20,000, only 1 over $70,000), miscellaneous TDM (5 of 8 cases under $20,000, none over $70,000), I&M (all 5 of 5 cases under $20,000), charges and fees (not an eligible CMAQ strategy) (4 of 6 cases under $20,000, none over $70,000), conventional fuel replacement buses (3 of 5 cases under $20,000, none over $70,000) and other AFV programs (1 of 2 cases under $20,000, none over $70,000) are almost all ranked high in the order and almost always produce attractive cost-per-ton returns.
On the other hand, some strategies almost always show poor rates of return. For example, telework (only 1 of 10 cases under $20,000, but 9 cases over $70,000), bike/pedestrian facilities (only 2 of 14 cases under $20,000, but 9 cases over $70,000), and transit shuttles (only 1 of 15 cases under $20,000, but 9 cases over $70,000) have the vast majority of their experience over $70,000 per ton. The question is, Given that there are a small number of examples that do result in acceptable performance, are there ways to learn from this experience to suggest guidelines for future applications of these strategies?
Perhaps most compelling in this regard are those strategies that reflect performance across the entire spectrum. Examples in this group include freeway management, where of the four cases, two are very effective (under $20,000) while the other two are very ineffective (over $70,000). Other such examples are employer trip reduction (3 of 7 cases under $20,000, 1 case over $70,000), park-and-ride lots (2 of 5 under $20,000, 1 over $70,000), transit capital improvements (2 of 6 under $20,000, 3 over $70,000), transit service improvements (3 of 10 under $20,000, 2 over $70,000), and subsidies and incentives (5 of 14 under $20,000, 4 of 14 over $70,000). Apparently these groups of strategies are very context sensitive—it really matters where a particular strategy is applied and how it is applied, which seems to make a great difference in the effectiveness of the same concept.
The conclusions reached from this particular analysis of the CMAQ experience is that certain strategies may be inherently more effective than others, but almost all of the strategy types that have been reviewed here have the potential to produce positive results. What seems to be of central importance is whether the right strategies are
being selected and applied in the given setting. For example, the review indicates that certain areas of the country have used their CMAQ opportunities entirely on, say, traffic flow improvements, with little if any diversification into other potentially productive areas. Another example is in the use of CMAQ funds to replace transit equipment, as opposed to the use of other funding sources for the same purpose. These uses have seldom resulted in high rates of return on CMAQ dollars. This subject will be discussed in somewhat greater detail in the next section.
Overall CMAQ Program Cost-Effectiveness
By using the examples of CMAQ strategies that have been evaluated in this paper and by taking into account the manner in which CMAQ funds have been expended on the various categories of projects to date, a preliminary assessment can be made of the overall cost-effectiveness of the CMAQ program in “buying” emission reductions. To this end, Table E-5 illustrates the percentage allocation of CMAQ funds across the various types of strategies explored in this paper, from program inception in FY 1992 through FY 1999, the most recent year for which this information is available. The distribution of funding obligations illustrates the following major patterns in the types of projects that have been implemented:
-
Traffic flow improvements: most heavily funded at 33.1 percent of all allocations and delivering emission reductions at a group average of $85,400 per ton.
-
Transit improvements: receiving 28.3 percent of all funding allocations and delivering emission reductions at an average of $59,600 per ton.
-
Fuels and technology: accounting for 20.6 percent of all allocations and delivering emission reductions at an average of $29,900 per ton.
-
Ridesharing: accounting for only 3.8 percent of all funds but delivering emission reductions at an average of $20,500 per ton.
-
Bike/pedestrian programs: accounting for 3.2 percent of all funds and delivering reductions at $84,100 per ton.
In general, this pattern suggests that the most funds have been allocated to the least cost-effective strategies, with the exception of
TABLE E-5 Summary of Cost-Effectiveness by Strategy (Cost-Effectiveness Results Based on HC: NOx Weighting Ratio of 1:4)
|
|
Number of Cases |
Cost per Ton Range (2000 $) |
Median (2000 $) |
FY 1992–1999 CMAQ Obligations (%) |
Median x Percent of Funding |
|
|
Low |
High |
|||||
|
Traffic flow improvements |
|
|
|
|
33.1 |
|
|
Signalization |
5 |
6,000 |
128,000 |
20,100 |
8.5 |
1,709 |
|
Freeway/incident management |
4 |
2,300 |
543,900 |
102,400 |
8.1 |
8,294 |
|
HOV facilities |
2 |
15,700 |
336,800 |
176,200 |
4.6 |
8,105 |
|
Intersections, traveler info, other |
0 |
NA |
NA |
NA |
11.9 |
NA |
|
Allocation-weighted median |
|
|
|
85,416 |
|
|
|
Ridesharing |
|
|
|
|
3.8 |
|
|
Regional rideshare |
5 |
1,200 |
16,000 |
7,400 |
|
89 |
|
Vanpool programs |
6 |
5,200 |
89,000 |
10,500 |
126 |
|
|
Park-and-ride lots |
4 |
8,600 |
70,700 |
43,000 |
1.4 |
602 |
|
Allocation-weighted median |
|
|
|
20,516 |
|
|
|
Travel demand management |
|
|
|
|
2.9 |
|
|
Misc. TDM |
8 |
2,300 |
33,200 |
12,500 |
2.1 |
263 |
|
Employer trip reduction |
7 |
5,799 |
175,500 |
22,700 |
0.8 |
182 |
|
Allocation-weighted median |
|
|
|
15,314 |
|
|
|
Telework |
10 |
13,300 |
8,227,000 |
251,800 |
0.0 |
0 |
|
Bike/pedestrian |
14 |
4,200 |
344,700 |
84,100 |
3.2 |
2,691 |
|
|
Number of Cases |
Cost per Ton Range (2000 $) |
Median (2000 $) |
FY 1992–1999 CMAQ Obligations (%) |
Median x Percent of Funding |
|
|
Low |
High |
|||||
|
Transit improvements |
|
|
|
|
28.3 |
|
|
Shuttles, feeder, paratransit |
15 |
12,300 |
1,974,000 |
87,500 |
7.4 |
6,475 |
|
New capital systems/vehicles |
6 |
8,500 |
470,800 |
66,400 |
12.0 |
7,968 |
|
Conventional service upgrades |
10 |
3,800 |
120,100 |
24,600 |
7.4 |
1,820 |
|
Park-and-ride lots |
1 |
56,200 |
56,200 |
56,200 |
1.5 |
843 |
|
Allocation-weighted median |
|
|
|
60,447 |
|
|
|
Fuels and technology |
|
|
|
|
20.6 |
|
|
Conventional fuel vehicles |
5 |
11,000 |
39,900 |
16,100 |
12.7 |
2,045 |
|
Alternative-fuel buses |
11 |
6,700 |
568,700 |
126,400 |
3.1 |
3,918 |
|
Alternative-fuel vehicles |
2 |
4,000 |
31,600 |
17,800 |
0.6 |
107 |
|
Inspection and maintenance |
5 |
1,800 |
5,800 |
1,900 |
4.2 |
80 |
|
Allocation-weighted median |
|
|
|
29,853 |
|
|
|
Other |
|
|
|
|
2.8 |
|
|
Rail freight |
0 |
NA |
NA |
NA |
0.4 |
NA |
|
Paving and sweeping (PM) |
0 |
NA |
NA |
NA |
0.9 |
NA |
|
All other improvements |
0 |
NA |
NA |
NA |
1.5 |
NA |
|
Allocation-weighted median |
|
|
|
NA |
|
|
|
STP/CMAQ |
NA |
NA |
NA |
NA |
5.4 |
NA |
|
Sum, known strategies |
|
|
|
|
80.0 |
45,317 |
|
Allocation-weighted median, all strategies |
|
|
|
|
100.0 |
56,646 |
bike/pedestrian, which has a high cost per ton, and telework, for which no funds have been officially allocated. However, as was stressed in the previous section, it can be very misleading to make such sweeping generalizations about one category being more effective than another, when some of the most significant differences in performance lie within the category (e.g., I&M, transit service upgrades, signalization) or even within the strategy group.
With these caveats in place, if one were to seek a rough estimate of the overall cost-effectiveness of the CMAQ program to date, Table E-5 provides such an estimate. The median cost-per-ton performance for each strategy (where data are available) is weighted by the percentage of CMAQ funds that have been obligated to that strategy between FY 1992 and FY 1999. The intermediate products, shown in the last column, are summed over all strategies and then divided by the respective percentage of all funding that this represents. On the basis of the projects covered in this paper review, cost-effectiveness performance has been estimated for project categories representing 80.1 percent of all funds allocated. The major missing strategy groups are
-
Traffic flow improvements related to intersection improvements, traveler information systems, and so forth, accounting for 11.9 percent of all funds allocated;
-
STP/CMAQ allocations, accounting for 5.4 percent of all funds allocated; and
-
Other, including rail freight, paving and sweeping, and miscellaneous other, accounting for 2.8 percent of all allocations.
These missing categories are therefore not reflected in the overall program estimate, which is shown at the bottom of Table E-5 as approximately $56,600 per ton of emissions reduced.
FINAL THOUGHTS AND CLOSING
In this review, a sweeping approach has been taken toward assessing the effectiveness of the CMAQ program. It is a technical assessment, and not a policy assessment, a job that is more properly suited to the committee that has been assembled for that purpose. Hopefully, the analysis and findings contained in this review will
help that executive body reach a satisfactory set of recommendations concerning the future and potential of the CMAQ program.
Clearly, the technical analysis is but one factor that will enter the committee’s deliberations, as well it should be. This review, while extensive and diligent, perhaps raises as many questions or uncertainties as it provides answers. It is pointed out that the information that has been developed to document CMAQ project performance has been of generally poor quality and precision. The great majority of the almost 100 sources consulted for this evaluation were found to be insufficient to support an acceptable appraisal of the cost-effectiveness of proposed or implemented strategies. Rejected studies either failed to provide estimates of emissions or costs, or the necessary supporting data from which to estimate emissions or costs. This shortcoming extends to CMAQ proposals and even postimplementation evaluation studies.
As a prime example, many studies dealing with traffic flow enhancements raised questions in review as to whether they would be effective overall in reducing emissions, given concerns about NOx/speed relationships, traffic diversions, or the effects of increasing traffic levels over time. Potential source studies either did not report NOx emissions or left out critical speed/flow information from which those emissions could be calculated. Of course, as new modal emission relationships are developed, the speed/flow relationships are challenged, making it even more important to look comprehensively at speed/volume relationships across the affected network. Few if any of the reviewed studies dealt with employed system-level methods, nor did they allude to potential effects of traffic diversion, mode split changes, or secular growth in traffic on estimated benefits. This is disturbing because that category of projects represents the highest percentage of CMAQ funding obligations and is the “strategy of choice” for particular regions of the country, while its overall positive, long-term effect on travel is less than clear.
Whereas a more systematic, primary analytic approach to estimated CMAQ travel and emission impacts may have produced a more internally consistent and comparable set of findings, it was seen as important by the committee to use the literature review and synthesis to appraise the general state of the practice. In effect, these
estimates reflect the tools, judgment, and perceptions that are being applied by agencies and professionals when planning, evaluating, and recommending strategies for funding. Thus, the numbers arrived at in this review, while perhaps lacking in analytic sophistication, nevertheless are useful in reflecting the processes and perceptions in the field. These norms, unless otherwise influenced by improved guidelines or methods, may well produce the same patterns of project priorities in the future.
Perhaps the most important finding of this review is that there is a great diversity in not only the types of strategies that have been deployed under CMAQ assistance but also in their effectiveness, which depends enormously on context. While some categories of strategies generally deliver high rates of return in reducing emissions, such as I&M and ridesharing programs, virtually all program categories showed examples of projects that delivered very attractive cost-effectiveness. Conversely, program categories that generally had attractive cost-effectiveness examples also included examples where the cost-effectiveness was very poor. This suggests that many strategies may be programmed for reasons other than comparative cost-effectiveness. This may be because certain strategies are popular with the public, politically attractive, a source of funding that might not otherwise exist, intuitive to planners or elected officials, or easy to implement.
This leads to the overall conclusion that the CMAQ program is capable of achieving a much higher level of performance—both total emissions reduced and cost per ton of reduction—than it has to date. Of 139 project examples reviewed, 26 percent were determined to reduce emissions at a cost of less than $10,000 per ton, another 13 percent could produce reductions at between $10,000 and $20,000 per ton, and another 11 percent could achieve reductions at a cost of between $20,000 and $30,000 per ton. In other words, about half of all examples studied delivered emission reductions for under $30,000 per ton. Why, then, do 35 percent of all projects have costs of over $70,000 per ton, with many of these substantially over $70,000 per ton? The conclusion is that this may be the result of the very flexibility that has made the CMAQ program so attractive to the audience for which it was developed, as an aid to meeting federally imposed requirements
for meeting congestion and air quality targets. Given this flexibility and the general absence of supporting guidance, it seems unlikely that the CMAQ program can be expected to perform at a higher level than it has to date.
Tightening application requirements for CMAQ projects to demonstrate appropriate returns in achieving emission reductions that are commensurate with the desired funding and the needs of the particular area might be one way of achieving improved program performance. However, not only would this place increased review responsibility on the funding agency, it would also be viewed as an unacceptable break with the historic flexibility ethic of the program. It might be more effective in the long run to gather information on experience with various projects to serve as guidelines for would-be implementers of the same concept. This could be done through the introduction of an evaluation component to CMAQ grants, whereby the recipient agrees to monitor and furnish certain performance data on the project. Since not all recipients would be expected to favor such an added responsibility, nor would all eligible projects likely be of comparable interest, a selective evaluation program might be most appropriate. This could consist of first targeting specific types of projects/strategies as being of evaluation interest, and then offering additional funds to support evaluation of these projects by willing grant recipients. This technique was used successfully by the former Urban Mass Transportation Administration in the 1970s and 1980s in conjunction with its Service and Methods Demonstration program, as well as the Section 4(I) and Section 3(a) (1)(c) programs. Were such an information base to exist, it could help future proposers make more informed decisions on which strategies were most appropriate to their situation, as well as guiding them in making better estimates of the probable impact of the projects and in identifying those supporting and implementation factors that would result in the best performance.
These are but a few of the considerations that the committee has before it. This reviewer believes that the CMAQ program has been effective in defined ways and could be greatly improved in effectiveness if the positive lessons learned can be translated into future program operations.
Literature Sources Reviewed in CMAQ Evaluation Paper
|
Year |
Title/Authorship |
Abstract/Assessment |
Topic Focus |
Use in Paper |
|
1998 |
Adler, K., M. Grant, and W. Schroeer. Emissions Reduction Potential of the Congestion Mitigation and Air Quality Improvement Program: A Preliminary Assessment. In Transportation Research Record 1641, TRB, National Research Council, Washington, D.C., pp. 81–88. |
More of a policy/program position piece than a technical analysis. Does make point that some projects will deliver benefits into the future, beyond their lifetimes. |
CMAQ. |
Not used. |
|
1994 |
Apogee Research, Inc. Costs and Effectiveness of Transportation Control Measures: A Review and Analysis of the Literature. National Association of Regional Councils, Jan. |
Suggests typical impacts for comprehensive list of TCMs (per Section 108f) using findings taken/synthesized from major air quality studies performed in 1991–1993 to support CAAA requirements. Information includes change in trips and VMT, emissions, and costs. Unfortunately, impacts on travel and emissions limited to “percentage” changes and only HC emissions reported. |
Transit, HOV, bike/ped, TDM, pricing, technology, flow improvements. |
Used in preliminary analysis, not in final because of stated short-comings in data. |
|
1994 |
Apogee Research, Inc., and Sarah Siwek & Associates. TCM Quick Response Handbook: Tools for Local Planners. North Jersey Transportation Planning Authority, Dec. |
More of a methodology than presentation of possible outcomes. Could use methods to estimate some types of TCMs (similar to CARB CMAQ guidance, but not as complete). |
TCMs. |
Not used. |
|
Year |
Title/Authorship |
Abstract/Assessment |
Topic Focus |
Use in Paper |
|
1996 |
Arnold. Effectiveness of TCMs: Overview of State of the Practice. |
Includes impact estimates from TCM analyses in WASHCOG, DiRenzo’s 1979 paper from TRR 714, CSI 1988, Kuzmyak & Meyer 1993; JHK/DeGang, Apogee 1994, Capital Beltway MIS 1995, SAI/EPA SIP guidance 1990. |
TCMs. |
A synthesis document that includes many of the other source studies used in this review. No new information added. |
|
1994 |
Beaton, W. P., H. Meghdir, and K. Murty. Employer- Provided Transportation Benefits, Public Transit, and Commuter Vanpools: A Cautionary Note. In Transportation Research Record 1433, TRB, National Research Council, Washington, D.C., pp. 152–158. |
Examines effect of tax-free employee subsidy on choice of transit or vanpool using modeling approach coupled with empirical data from NY/NJ Port Authority commuter study. Stated preference approach deals mainly with trade-offs between transit and ridesharing, not with travel and emission impacts. |
TDM and ECO. |
Not used. |
|
1991 |
Bhatt, K. Review of Transportation Allowance Programs. In Transportation Research Record 1321, TRB, National Research Council, Washington, D.C., pp. 45–50. |
Looks at transit and van-pool allowances, parking allowances for carpools, and mixed/ general travel allowances. Unfortunately, no usable travel, emission, or cost information. |
TDM and pricing. |
Not used. |
|
1999 |
Burbank, C., and C. Adams. Program Guidance on the CMAQ Improvement Program. FHWA, U.S. Department of Transportation, April. |
Latest guidance from FHWA on CMAQ strategies, eligibility, evaluation. Useful for seeing what strategies are encouraged, how they will be evaluated. |
All CMAQ strategies. |
Not used. |
|
Year |
Title/Authorship |
Abstract/Assessment |
Topic Focus |
Use in Paper |
|
1999 |
California Air Resources Board. Methods to Find the Cost-Effectiveness of Funding Air Quality Projects for Evaluating Motor Vehicle Registration Fee and CMAQ Projects (1999 edition), Aug. |
Provides methods/ formulas for calculating emissions (ROG, NOx, and PM10) reductions and cost-effectiveness of many popular CMAQ-type projects. |
All CMAQ strategies. |
Used to estimate emissions where they were lacking, dated, or suspect in source study. |
|
2000 |
Cambridge Systematics. Quantifying Air Quality and Other Costs and Benefits of TCMs. Final report, NCHRP Project 8–33, Dec. |
Greatest potential value lies in results of Sacramento (HOV, ramp metering) and Portland (tour-based model application of combined auto pricing, telecommuting, transit improvements) pilot testing. Unfortunately, only partial impact information presented, and no cost data. |
HOV lanes, ramp metering, pricing, transit. |
Not used. |
|
2000 |
Cambridge Systematics. NCHRP 8–33. Quantifying Air Quality Benefits of TCMs-Task 2: Improvements to Current Techniques. |
Chapter 5 does simulation of pricing, transit, and telecommute policies with Portland, Oregon, tour-based model, but no statistics on individual policies, and no cost information. |
TCMs. |
Not used. |
|
2000 |
Chang, G.-L., and Y. Point-du-Jour. Performance Evaluation of Maryland’s CHART Incident Management Program. University of Maryland, May. |
Estimates the impact of MDOT ITS incident management system on traffic flow and emissions. |
Traffic flow improvements. |
Used in study. |
|
Year |
Title/Authorship |
Abstract/Assessment |
Topic Focus |
Use in Paper |
|
1994 |
Chicago Transit Authority. Orange Line Travel Survey, May. |
Used CMAQ grant to market new Orange Line service. Reports on survey performed 4 months after opening. Found 6,700 new daily transit trips, reduction of 60,800 DVMT and 3,000 cold starts.Unfortunately, cannot attribute the impacts entirely to the marketing, plus no emission or cost data provided. |
Transit improvements. |
Not used. |
|
2000 |
Cohen, H. S. Analysis of the CMAQ Database. (Presented as Appendix C of this Special Report.) |
Assessment of types of projects funded by CMAQ, trends over time. Some information on impacts, but as taken from grantee applications (not for use in this review). |
All CMAQ strategies. |
Overall perspectives on program strategies, funding patterns, performance, documentation problems. |
|
1996 |
COMSIS et al. MTA TDM Demonstration Program Third Party Evaluation. Final report, Los Angeles County Metropolitan Transportation Authority, Feb. |
Detailed findings on performance of 12 TDM demonstration projects sponsored by MTA (as part of 110) in Los Angeles County. |
Shuttles, telecommuting, ridesharing centers, vanpooling. |
Examples used directly in study. |
|
1997 |
COMSIS et al. MTA Transportation Demand Management Evaluation. Final report, Los Angeles County Metropolitan Transportation Authority, April. |
Presents project-specific before-and-after evaluation findings for 11 TDM projects funded and evaluated under MTA’s TDM Program in Los Angeles County. |
Transit improvements, bike facilities, vanpooling, general TDM. |
Used directly in study. |
|
Year |
Title/Authorship |
Abstract/Assessment |
Topic Focus |
Use in Paper |
|
1994 |
Congestion Management and Air Quality Improvement Program: Indirect Benefits. FHWA, U.S. Department of Transportation. |
Describes indirect benefits associated with CMAQ program, based on surveys of MPOs, DOTs, and interest groups. Largely increased public participation, enhanced planning process, advances in evaluation methodologies, MPO empowerment, encouragement of innovation, education/outreach, quality of life. No quantitative data or guidelines. |
All CMAQ strategies. |
Background only. |
|
1977 |
Crowell, W., et al. Carpools, Vanpools and HOV Lanes: Cost-Effectiveness and Feasibility. Office of Planning and Evaluation, U.S. Environmental Protection Agency, May. |
Used empirical (but anecdotal) data on voluntary employer ridesharing programs from four metropolitan areas to establish that such programs can reduce regional VMT by 0.1% to 2–3%. Also studied transit/carpool HOV lanes, concluding that with 20-minute time savings, could reduce regional VMT by 1%. |
Ridesharing and HOV lanes. |
Information a little too anecdotal, conclusions a bit too simplistic for this study. |
|
1998 |
Dahlgren, J. High Occupancy Vehicle Lanes: Not Always More Effective Than General Purpose Lanes. Transportation Research A, Vol. 32, No. 2, pp. 99–114. |
Airs dilemma that HOV lanes require congestion in order to provide an advantage to attrac users. Compares various add-a-lane, take-a-lane, no change scenarios. More of an academic/policy piece, not directly useful for emissions. |
HOV lanes. |
Not used. |
|
Year |
Title/Authorship |
Abstract/Assessment |
Topic Focus |
Use in Paper |
|
1994 |
De Leuw, Cather & Co. Station Renovations and Pedestrianways. Final report, CMAQ Evaluation Method Study for City of Chicago, July. |
CMAQ evaluation study that addresses transit station renovations and pedestrianways. Develops a technique for estimating effects of station and access improvements that are too small to be reflected in regional travel model. No actual travel, emission, or cost results, however. |
Transit improvements. |
Not used. |
|
1991 |
Deakin, Harvey, and Skabardonis. TCMs for San Francisco Bay Area: Analysis of Effectiveness and Costs. Bay Area Air Quality Management District, July. |
Covers full range of TCM strategies, provides estimates of cost and effectiveness, emission reductions of HC, NOx, CO, PM10. Unfortunately, only percent reductions in VMT and emissions are reported (no control totals), and cost/ton presented for ROG only. |
TCMs. |
Used in preliminary analysis only, insufficient information for final assessment. |
|
1994 |
Delaware Valley Regional Planning Commission. An Analysis of Potential TCMs for Implementation in the Pennsylvania Portion of the DVRPC (Philadelphia) Region. May. |
Travel, emissions, and cost-effectiveness for 30+ TCMs across all categories. |
Transit, HOV, bike/ped, TDM, pricing, technology, flow improvements. |
Used directly in study. |
|
Year |
Title/Authorship |
Abstract/Assessment |
Topic Focus |
Use in Paper |
|
1993 |
Euritt, M. A., D. B. Taylor, and H. S. Mahmassani. Cost-Effectiveness Analysis of Texas Department of Transportation Compressed Natural Gas Fleet Conversion. In Transportation Research Record 1416, TRB, National Research Council, Washington, D.C., pp. 95–104. |
Basically a summary of detailed formal report (see below). Good study but no emission data. |
Technology and fuels. |
Not used. |
|
1992 |
Euritt, M., et al. C/E Analysis of TxDOT CNG Fleet Conversion, Volumes 1 and 2. Research Report 983–2/1. University of Texas at Austin, Aug. |
Estimates life-cycle costs and benefits of TxDOT’s proposed conversion of state vehicle fleet to CNG. Good study but no emission data. |
Technology and fuels. |
Not used. |
|
1986 |
Feeney. Review of Impact of Parking Policy Measures on Travel Demand. |
Reviews empirical evidence on impact of parking policy (availability, location, price) on parking demand and travel. Assembles, compares elasticities. Insufficient data to estimate emission or cost impacts. |
Market based. |
Not used. |
|
1990 |
Ferguson, E. Influence of Employer Ridesharing Programs on Employee Mode Choice. Transportation, Vol. 17, Aug., pp. 179–207. |
Surveyed national sample of employers under National Ridesharing Demonstration Program. Unfortunately, no information obtained on travel responses/ mode shifts. |
Ridesharing. |
Not used. |
|
Year |
Title/Authorship |
Abstract/Assessment |
Topic Focus |
Use in Paper |
|
1993 |
FHWA. Implementing Effective TDM Measures. |
Provides impact information on 11 different demand management strategies, including transit, carpool, van-pool, bike/ped, economic incentives, HOV, parking pricing and management, tolls and congestion pricing, alternative work hours, telecommuting, and employer support measures. Also tied to TDM evaluation model. No emissions estimates, and cost data limited. |
TDM and ECO. |
Used for cross-checking validity of assumptions and impacts in other studies. |
|
1992 |
Giuliano and Wachs. Comparative Analysis of Regulatory and Market-Based TDM Strategies. |
Presents typology of TDM policies, focusing on differences between regulatory and market-based approaches. Insufficient data for computation of emission cost-effectiveness. |
TDM and ECO. |
Not used. |
|
1990 |
Giuliano, G., et al. Impact of High Occupancy Vehicle Lanes on Carpooling Behavior. Transportation,Vol. 17, pp. 159–177. |
Examines extent to which an HOV facility increases ridesharing using data from Route 55 in Orange County, California. Difficult to get change in VT or VMT from presentation. |
HOV lanes. |
Not used. |
|
1992 |
Giuliano, G. Transportation Demand Management: Promise or Panacea? Journal of the American Planning Association,Vol. 58, No. 3, pp. 327–335. |
Presents information from three case studies to argue that TDM has little impact on traffic conditions but big impacts on consumers. Insufficient data for computation of emission cost-effectiveness. |
TDM and ECO. |
Not used. |
|
Year |
Title/Authorship |
Abstract/Assessment |
Topic Focus |
Use in Paper |
|
1998 |
Guensler. Increasing Vehicle Occupancy in the U.S. |
Summarizes state of practice in regional programs to increase vehicle occupancy, including regulatory trip-reduction measures, congestion pricing and other economic incentives, and education. Recommends experimenting with parking pricing and incentive-based voluntary programs before congestion pricing or privatizing roadways. No directly usable findings for this assessment. |
TDM and ECO. |
Not used. |
|
1999 |
Hagler Bailly. Summary Review of Costs and Emissions Information for 24 CMAQ Improvement Program Projects. U.S. Environmental Protection Agency, Sept. |
Reviews project impacts in six different CMAQ categories: shared ride, ped/bike, traffic flow, transit, TDM, other. Includes information on project lifetimes, costs, emissions. Emission estimates for VOC, NOx, CO, PM10. |
All CMAQ strategies. |
Impact estimates directly used. |
|
Year |
Title/Authorship |
Abstract/Assessment |
Topic Focus |
Use in Paper |
|
1995 |
Harrington, W., M. A. Walls, and V. D. McConnell. Using Economic Incentives to Reduce Auto Pollution. Issues in Science and Technology, Vol. 11, No. 2, March. |
Argues for economic incentive over regulatory approaches to achieve emission reductions. Presents cost/ton ranges for wide range of approaches, including alternative-fuel vehicles, reformulated fuels, various I&M programs and remote sensing, and a variety of economic incentives (gas tax, congestion pricing, parking cashout, emissions-based registration fees, accelerated scrappage). Argues against AFVs, and is dubious about I&M. |
Market based. |
Not used because results reflect cost/emission/technology relationships of 1994; emissions are only VOCs, not sure how analysis would hold up for NOx. Economic incentive arguments seem sensible, but not much supporting information provided. |
|
1999 |
ICF Inc. Benefits Estimates for Selected TCM Programs. U.S. Environmental Protection Agency, Office of Mobile Sources, March. |
Illustrative application of EPA’s TCM guidance and analysis procedures to six actual TCM programs. Estimates change in trips, VMT, speeds, and reductions in emissions (HC only). No costs provided. |
Vanpool and shuttle programs, telecommute, bike/ped facilities. |
Not used. |
|
1999 |
Intelligent Transportation Systems Benefits—1999 Update. FHWA ITS Joint Programs Office, May. |
Summarizes empirical results from field operations of deployed systems, supplemented with benefits information based on modeling and statistical studies. Distinguishes between ITS for commercial vehicles and ITS user services. Insufficient information to derive emission cost-effectiveness. |
Traffic flow improvements. |
Examples of incident management projects used in report. |
|
Year |
Title/Authorship |
Abstract/Assessment |
Topic Focus |
Use in Paper |
|
1992 |
JHK Associates and COMSIS. Procedural Guidelines for Evaluation of TCM Impacts with Existing Tools. For Southern California Association of Governments. |
Investigates characteristics of existing tools in relation to the needs of analysts to evaluate diverse TCM strategies. A technical review study, not a source for impacts. |
TCMs. |
Not used. |
|
1997 |
Johnston, R., and C. Rodier. A Comparative Systems-Level Analysis: Automated Freeways, HOV Lanes, Transit Expansion, Pricing Policies and Land Use Intensification. California PATH Research Report, April. |
Uses advanced modeling tools to evaluate travel and emission impacts of regional LRT, HOV lanes, automated freeways, and the supportive effects of land use concentration and pricing. Setting is Sacramento, and projects as set forth in 2020 long range plan. No cost information limited extensive use. |
Automated highways, HOV lanes, LRT, road/fuel/park ing fees, land use concentration. |
Used to illustrate effects of highway capacity additions, reinforcing effects of pricing and land use concentration. |
|
1996 |
Johnston, R. A., and R. Ceerla. The Effects of New High-Occupancy Vehicle Lanes on Travel and Emissions. Transportation Research A, Vol. 30, No. 1, pp. 35–50. |
Statistics presented to argue that new HOV lanes may increase travel and emissions when compared with transit alternatives. Good analysis but no cost information. |
HOV lanes. |
Examples used in preliminary analysis, but not in final report due to missing cost information. |
|
1993 |
Kessler, J., and W. Schroeer. Meeting Mobility and Air Quality Goals: Strategies That Work. U.S. Environmental Protection Agency, Office of Policy Analysis, Jan. |
Identifies/recommends strategies clearly likely to have impact on emissions. Unfortunately, impacts reported are in gross national terms and/or percentages. Difficult to put into proper context for this paper. |
TCMs. |
Not used. |
|
Year |
Title/Authorship |
Abstract/Assessment |
Topic Focus |
Use in Paper |
|
1996 |
Kimley-Horn Associates. Garland TX CMAQ Signal Timing Project. |
Four separate studies dealing with CMAQ-funded signalization projects. Extensive raw data on vehicle movements, but no information provided on emissions or costs. |
Traffic flow improvements. |
Not used. |
|
1994 |
Knowles, W. Mobile Source Emissions Impacts of HOV Facilities. TTI Report 1353-2. Nov. |
Benchmarks and compares SAI and SANDAG methods for application in estimating emission impacts of HOV lanes. Finds considerable differe nces between the two methods. Unfortunately, no real quantitative value for CMAQ assessment. |
HOV lanes. |
Not used. |
|
1991 |
Krupnick. Vehicle Emissions, Urban Air Quality, and Clean Air Policy. |
Focuses on reformulated fuels, high emitters, high-tech emission monitoring, congestion pricing. Standards questioned. |
Technology and fuels. |
Too dated for direct use. |
|
1998 |
Lachance, L. C., and E. Mierzejewski. Analysis of the Cost-Effectiveness of Motor Vehicle Inspection Programs for Reducing Air Pollution. In Transportation Research Record 1641, TRB, National Research Council, Washington, D.C., pp. 105–111. |
Examines cost-effectiveness of five types of MVIP technologies (advanced I&M) re potential application in Florida. Estimates of VOCs and NOx reduction, associated costs. |
I&M. |
Used directly for I&M program estimates. |
|
Year |
Title/Authorship |
Abstract/Assessment |
Topic Focus |
Use in Paper |
|
1996 |
Lewis, J., et al. New Commuter Railroad Stations and Station Parking Impact Evaluation Study. Illinois Department of Transportation, June. |
Develops technique to predict increase in rail ridership if parking capacity is added to existing lot or for infillstation. Unfortunately, all methodological—no change in trips/VMT, no emission or cost data. |
Transit improvements. |
Not used. |
|
1992 |
Loudon, W., and D.Dagang. Predicting the Impact of Transportation Control Measures on Travel Behavior and Emissions. Presented at 71st Annual Meeting of the Transportation Research Board, Washington, D.C. |
Provides an overview of methodology developed for Caltrans to predict impact of TCMs. Paper provides elasticity estimates derived from empirical studies, but no real examples for use. |
TCMs. |
Not used. |
|
1994 |
Lupa, M. Feasibility of Employee Trip Reduction as a Regional Transportation Control Measure. In Transportation Research Record 1459, TRB, National Research Council, Washington, D.C., pp. 46–52. |
Compares ETR as a strategy with wide range of TCMs, using data from SCAQMD; concludes that ETR is very expensive. Comparisons show 2010 ROG and cost/cost-effectiveness for all TCMs. |
TDM and ECO; TCMs. |
Not used because emission data limited to ROG. |
|
1994 |
Metropolitan Washington (D.C.) Council of Governments. Transportation Control Measure Analysis. FHWA Metropolitan Planning Technical Report, Feb. |
Travel, emissions, and cost/cost-effectiveness for 60+ TCMs across all categories. |
Transit, HOV, bike/ped, TDM, pricing, technology, flow improvements. |
Used directly in study. |
|
Year |
Title/Authorship |
Abstract/Assessment |
Topic Focus |
Use in Paper |
|
1997 |
Meyer, M. A Toolbox for Alleviating Traffic Congestion and Enhancing Mobility. Institute of Transportation Engineers. |
Some impact information on TSM & TDM strategies for congestion relief. Does not get into emissions or costs. |
Traffic flow improvements, TDM, transit, ITS, new capacity. |
Examples of signalization and ramp metering projects used in report. |
|
1997 |
Michael Baker Corporation et al. The Potential of Public Transit as a TCM: Case Studies and Innovations. Draft final report, National Association of Regional Councils, Oct. |
Review of 10 exemplary transit or transit-related projects that demonstrate effectiveness of transit as an air quality strategy. Impacts include travel, emissions, and costs. |
Transit, paratransit, subsidies, TDM. |
Examples used directly in study. |
|
1998 |
Mokhtarian et al. Estimating Impacts of Telecommuting on Travel. |
Develops model for forecasting demand for telecommuting and resulting transportation impacts. Computes that only 1.5% of workforce commutes on given day, at most reducing 1% of daily household VMT. Broad national analysis with lots of factor assumptions; no costs, no emissions. |
TDM and ECO. |
Not used. |
|
1994 |
National Engineering Technology Corporation. CMAQ Special Study 1993-SCAT-OGL-009. Final report. Illinois Department of Transportation, April. |
Before/after analysis of seven signal coordination projects in Chicago area. Emission and cost data not provided, travel speed/delay data not in format suitable for post-facto emission estimation. |
Traffic flow improvements. |
Not used. |
|
Year |
Title/Authorship |
Abstract/Assessment |
Topic Focus |
Use in Paper |
|
2000 |
National Research Council. Modeling Mobile Source Emissions (prepublication copy). |
Report of NRC committee tasked to review the MOBILE model. Insights into critical relationships, shortcomings in modeling and data, how they may influence effectiveness determinations. |
Traffic flow improvements. |
Reference only. |
|
1997 |
NCHRP Report 394: Improving Transportation Data for Mobile Source Emission Estimates. TRB, National Research Council, Washington, D.C. |
Focuses on importance of input data to emission calculations, especially role of speed and vehicle classification mix. Guidance on sensitivity of emissions to these factors. |
Traffic flow improvements. |
Reference only. |
|
1996 |
NCTCOG. TCM Effectiveness Study. |
Assessment of TCMs for 15% reduction SIP. Calculation of travel effects, VOC emissions (only). No cost information. |
Traffic flow, HOV, incident management, rail transit, street widening. |
Not used. |
|
1993 |
Orski, K. ETR Programs—An Evaluation. Transportation Quarterly,Vol. 47, No. 3. |
Critiques ineffectiveness of Southern California’s Regulation XV ETR program requirement following 3 years of experience. Presents arguments based on percent reduction in VMT and emissions, and cost per reduction to employers. |
TDM and ECO. |
Used as data point in study. |
|
Year |
Title/Authorship |
Abstract/Assessment |
Topic Focus |
Use in Paper |
|
1998 |
Pansing, C., E. N. Schreffler, and M. A. Sillings. Comparative Evaluation of the Cost-Effectiveness of 58 Transportation Control Measures. In Transportation Research Record 1641, TRB, National Research Council, Washington, D.C., pp. 97–104. |
Reviews travel, emissions, and cost-effectiveness of transit, fuels, and TDM projects implemented in Los Angeles and San Diego areas. Results taken from actual before-and-after studies. |
TDM, shuttles, ridesharing, transit, alternative fuels. |
Used. |
|
1999 |
Parsons Brinckerhoff et al. CMAQ Analysis: North Central Service Impact Evaluation-Phase II Final Report. Metra, Chicago, June. |
Analysis of impact of new 41-mile commuter rail line in northwest Chicago on ridership and emissions. |
Rail transit. |
Used directly in study. |
|
1995 |
Replogle, M. Overcoming Barriers to Market-Based Transportation Reform. Environmental Defense Fund. |
Addresses broad cross section of market and pricing strategies, but more from the barriers and implementation side. |
Pricing. |
Not used. |
|
1994 |
Replogle, M., and H. Dittmar. Integrating Travel Demand Management Strategies. In Transportation Research Circular 433, TRB, National Research Council, Washington, D.C., pp. 107–122. |
Addresses what is strong/ weak about current TDM approaches, how effectiveness can be improved through synergistic packaging, and use of correct tools/assumptions. Impact estimates for laundry list of TCMs provided, but only VMT, though attempt is made to show short- and long-term effects. |
All TCMs. |
Not used. |
|
Year |
Title/Authorship |
Abstract/Assessment |
Topic Focus |
Use in Paper |
|
1991 |
SAI. TCM Analysis Procedures. |
Describes methodology developed for analyzing travel and emission changes resulting from individual and packged TCMs. Shows formulations, source of information for factors/relationships. |
TCMs. |
Methodological only, no cost-effectiveness. Not used. |
|
2001 |
Schimek, P. Reducing Emissions from Transit Buses. Regional Science and Urban Economics, Vol. 31, pp. 433–451. |
Presents estimates of incremental cost of gaining NOx and PM emission reductions through new-genera-tion diesel buses versus CNG, methanol, and hybrid electric-fueled vehicles. |
Conventional and alternative-fuel transit buses. |
Used for comparison purposes; limited by incremental cost approach. |
|
1996 |
Schreffler, E. How Costly and Cost Effective are ECO Programs? Institute of Transportation Engineers Annual Meeting. |
Discusses costs per employee and per trip reduced for sample of ECO programs. More of a policy position piece than source document for this study. |
TDM and ECO. |
Not used. |
|
1990 |
Shoup and Wilson. Parking Subsidies and Travel Choices: Assessing the Evidence. |
Reviews empirical studies of how employer-paid parking affects employees’ travel choices (one of many such studies). Insufficient data to estimate emission or cost impacts. |
Market based. |
Not used. |
|
1991 |
Sierra Research, Inc. Methodologies for Quantifying the Emissions Reductions of TCMs. San Diego Association of Governments, Oct. |
Presents the methodology and assumptions behind the TCM Tools model built for SANDAG in early 1990s. Not much in the way of directly usable impact information. |
TCMs. |
Not used. |
|
Year |
Title/Authorship |
Abstract/Assessment |
Topic Focus |
Use in Paper |
|
1996 |
Sivasailam, D., and J. Williams. Estimating Impacts of Transportation Control Measures on Work-Related Trips. In Transportation Research Record 1518, TRB, National Research Council, Washington, D.C., pp. 32–37. |
Specifically deals with the implication of work-related trips being only small portion of total daily travel, and methods to account for in TCM impact assessment. No impact information directly useful to this assessment. |
TCMs. |
Not used. |
|
1994 |
Systems Applications, Inc. Methodologies for Estimating Emissions and Travel Activity Effects of TCMs. U.S. Environmental Protection Agency, Office of Mobile Sources, July. |
Mainly suggests analytic approaches, with some factors/rules of thumb, for calculating impacts. Little/no empirical data. |
TCMs. |
Not used. |
|
2000 |
TCRP B-12. Update of Traveler Response to Transportation System Changes Handbook. |
Detailed impact informa tion on wide range of transit, HOV, pricing, land use strategies. Travel effects only, not emissions or costs. |
TCMs. |
For cross-checking validity of assumptions, range of impacts. |
|
1992 |
Texas Transportation Institute. HOV Project Case Studies: Historical Trends and Project Experiences. Research Report 925–4. Aug. |
Examines historical trends with HOV projects in six case study sites. Very informative, but not type of information to support emission or C/E analysis. |
HOV lanes. |
Not used. |
|
Year |
Title/Authorship |
Abstract/Assessment |
Topic Focus |
Use in Paper |
|
1995 |
Texas Transportation Institute. TTI CM/AQ Evaluation Model User’s Guide and Workshop Training Materials. Research Report 1358–1. Aug. |
Applies model originally developed for DRCOG by JHK Associates and enhanced by TTI (“CMAQ Model”) to evaluate independent projects on the basis of criteria score. Appendix E offers impact estimates for congestion pricing, pedestrian improvements, fleet conversion, telework, park-and-ride, and signal improvement strategies. |
All CMAQ strategies. |
Used in initial review, assumptions regarding impacts and costs are “assumption based” and judged too generic for final inclusion. |
|
1997 |
Texas Transportation Institute. An Evaluation of HOV Lanes in Texas, 1996. Research Report 1353–5. Nov. |
Provides assessment of impact of HOV lanes on five Houston freeways. Uses before-and-after trendline analysis and comparison to control highways. |
HOV lanes. |
Used example of Katy Freeway. |
|
1990 |
Transportation Control Measure: SIP Guidance. U.S. Environmental Protection Agency, Office of Air and Radiation, Sept. |
Developed by SAI and UC Berkeley while 1990 CAA Amendments were being finalized. Summarizes TCM experience of previous 10 to 15 years. No usable numbers for this assessment. |
TCMs. |
Not used. |
|
1995 |
TTI. Evaluation and Monitoring of TCMs. Report 1279–10F. |
Reviewed advantages and limitations of TCM evaluation methods currently available, identified critical issues in their accuracy and applicability. Monitoring programs presented for four TCMs: transit plazas, intersection improve-ments, ridesharing, and park-and-ride lots. |
TCMs. |
Insufficient data for use in this review. |
|
Year |
Title/Authorship |
Abstract/Assessment |
Topic Focus |
Use in Paper |
|
1996 |
TTI. Houston Employee Commute Options Program: Analysis of Emissions Benefits. |
Analyzed database of submitted ETR plans for 1,200 worksites/396,000 employees in eight-county non-attainment area. Evaluated the potential impact of programs on emissions and energy. |
TDM and ECO. |
Used example of ECO program in Employer Trip Reduction section. |
|
1995 |
TTI. Research Concerning Analysis of CMAQ Transportation Improvement Projects. |
Summarizes literature search and national survey on procedures in use to potentially help Texas MPOs analyze CMAQ projects. Examples focus on traffic flow improvements and park-and-ride. Emission estimates provided, but no cost information. |
Traffic flow improvements. |
Not used. |
|
1994 |
TTI. TCM Analyst 1.0 Users Guide. |
Combined SAI and SANDAG tools into one spreadsheet evalu-ation tool. Covers 11 different TCMs. Mainly an instruction manual; formulas and sensitivity results too abstract for use in this review. |
TCMs. |
Not used. |
|
1993 |
TTI. Critical Analysis of Sketch-Planning Tools for Evaluating Emission Benefits of TCMs. |
Reviewed SAI and SANDAG planning tools for effectiveness in assessing TCMs. Sensitivity analysis performed, results presented, but too generic for use in this assessment. |
TCMs. |
Not used. |
|
Year |
Title/Authorship |
Abstract/Assessment |
Topic Focus |
Use in Paper |
|
1994 |
University of Texas at Austin. Framework for Evaluating TCMs: Energy, Air Quality and Mobility Tradeoffs. |
Focuses on how current four-step models do not adequately account for how individuals make travel decisions, comes up with improved framework, applies to test scenarios to estimate effectiveness of TCMs. Had concerns about analysis, no cost data provided. |
TCMs. |
Not used. |
|
1993 |
Wachs, M. Regulation XV in Southern California: Success or Failure? TDM Review, Vol. 4, No. 1. |
Reports on findings from study of Regulation XV in Southern California. Concludes not entirely a failure, that much depends on what types of measures are applied in programs (e.g., pricing). |
TDM and ECO. |
Used in study. |
|
1993 |
Wachs, M. Learning from Los Angeles: Transport, Urban Form, and Air Quality. University of California Transportation Center. |
Takes issue with California experience with increased emphasis on rail transit investment and demand management, contrasts with market-based and emerging technology approaches. |
TDM and ECO. |
Regulation XV findings used in TDM/ECO assessment. |
|
1997 |
Wang, M. Mobile Source Emission Control Cost-Effectiveness: Issues, Uncertainties, and Results. Transportation Research D, Vol. 2, pp. 43–56. |
Source paper dealing with methodological issues in determining cost-effectiveness. |
Technology and fuels. |
Methodology only. |
|
Year |
Title/Authorship |
Abstract/Assessment |
Topic Focus |
Use in Paper |
|
1999 |
Wellander, C., and K. Leotta. HOV Lanes-Are They Effective? Parsons Brinckerhoff. |
Overviews sample of freeway HOV lanes across North America. Measures of effectiveness include throughput, utilization, travel time savings. Not directly useful for emission evaluation. |
HOV lanes. |
Not used. |
|
1996 |
Welzenbach, K. Analysis of 1995 Bicycle Survey of Suburban Bike Trails. Working Paper 96–08. Chicago Area Transportation Study, June. |
Provides survey data only, no impacts or strategies. |
Bike/ped. |
Not used. |
|
1997 |
Western Governors’ Association. Air Quality Initiative—Mobile Source Options. |
Provides ranges of travel, emission, and cost impacts for comprehensive list of TCMs in relation to meeting reduction targets in Western states to assess cross-source emission trading program. |
TCMs. |
Used for preliminary study of fuels, technology, and TCM strategy impacts. |
|
1989 |
Whinihan. Use of Economic Incentives to Reduce Mobile Source Emissions. |
Examines economic incentives to meet pending emission requirements, but focuses on accelerated vehicle turnover. Pretty dated for this application. |
Technology and fuels, pricing. |
Not used. |
|
1996 |
Zarifi, S. Transportation Demand Management Program—Second Tier Evaluation. Los Angeles County Metropolitan Transportation Authority, July. |
Presents information for 17 additional TDM projects funded and evaluated under MTA’s TDM program. |
Shuttles, telecommuting, pricing and subsidies, general TDM. |
Examples used directly in study. |
|
Year |
Title/Authorship |
Abstract/Assessment |
Topic Focus |
Use in Paper |
|
1993 |
Zupan, J., and J. Dean. The Effect of VMT and Smog Fees on VMT. Report to Conservation Law Foundation, March. |
Looks at pricing actions but from perspective of assumption testing. Relies a lot on vehicle scrappage/replacement for cost/benefit. |
Technology and fuels, pricing. |
Not used. |
|
1993 |
Zupan, J., H. Levinson, and J. Dean. Potential of Transportation Vouchers to Reduce Vehicle Miles of Travel. Presented at 72nd Annual Meeting of the Transportation Research Board, Washington, D.C. |
Tests different methodologies for estimating regional VMT, then plays with assumptions about how voucher might work in different locations. Concludes voucher works best in low-density areas where there is no transit conflict. Unfortunately, too hypothetical for this analysis. |
TDM and pricing. |
Not used. |
TABLE E-ANNEX-1 CMAQ Project Impacts Evaluation: Project Category, Traffic Flow Improvements; Subcategory, Signalization Systems and Improvements
|
Source |
Designation |
Daily Travel Impacts |
Emission Reductions (tons per day) |
||||||
|
VTR |
VMTR |
Transit Riders |
Delay Red. (hr) |
Speed Imp. (mph) |
HC |
NOx |
CO |
||
|
|
|
|
|
Emission Weights: |
1 |
4 |
0 |
||
|
Hagler Bailly (1999) |
Arterial street signal connect (Philadelphia) |
NA |
NA |
NA |
NA |
NA |
0.052 |
0.0057 |
|
|
Hagler Bailly (1999) |
Maryland Rt. 2 signal systemization |
NA |
NA |
NA |
NA |
3 |
0.012 |
(0.0012) |
|
|
Hagler Bailly (1999) |
Pulaski Rd. signal interconnect (Chicago) |
NA |
NA |
NA |
NA |
0.2 |
0.03 |
|
|
|
DVRPC (1994) |
Advanced signals on most congested 4-lane arterials |
NA |
70,554 |
NA |
NA |
NA |
0.149 |
0.160 |
0.601 |
|
DVRPC (1994) |
Compr. signal improvements in Philadelphia CBD |
NA |
7,336 |
NA |
NA |
NA |
0.0353 |
0.028 |
0.250 |
|
Mean |
NA |
38,945 |
NA |
NA |
1.6 |
0.056 |
0.048 |
|
|
|
Median |
NA |
38,945 |
NA |
NA |
1.6 |
0.035 |
0.017 |
|
|
|
Travel term definitions: VTR = vehicle trip reduction; VMTR = vehicle miles of travel reduced; transit riders = increase in daily transit ridership. Emission term definitions: total emissions = weighted sum of HC, NOx, CO, and PM10; emission weights = importance weights representing value of individual pollutants; emission year = time period for which source study estimate applies; benefits trend indicates whether emissions are decreasing, increasing, or constant over project life. Cost-effectiveness definitions: BDF = benefits discount factor (combination of benefits trend and discount rate); annual benefits = weighted emissions *days/year *BDF; annual costs = annualized capital costs plus applicable operating, administrative, and private costs. |
|||||||||
|
|
|
|
Cost-Effectiveness |
||||||
|
PM10 |
Total |
Emission “Year” |
Life (years) |
Benefits Trend |
Discount Rate (%) |
BDF |
Annual Benefits (tons/year) |
Annual Costs (2000 $) |
Cost/Ton (2000 $) |
|
0 |
|
|
|
|
|
|
|
|
|
|
|
0.0748 |
1994 |
10 |
Decrease |
7 |
0.455 |
8.5 |
231,156 |
27,168 |
|
|
0.0074 |
1999 |
12 |
Decrease |
7 |
0.431 |
0.8 |
6,326 |
7,934 |
|
|
0.03 |
Avg. over life of project |
20 |
Decrease |
7 |
0.359 |
5.4 |
32,139 |
5,968 |
|
|
0.788 |
1996 |
10 |
Decrease |
7 |
0.455 |
89.6 |
1,801,653 |
20,100 |
|
|
0.146 |
1996 |
10 |
Decrease |
7 |
0.455 |
16.6 |
2,121,346 |
127,997 |
|
|
0.209 |
|
|
|
|
|
24.2 |
838,524 |
37,833 |
|
|
0.075 |
|
|
|
|
|
8.5 |
231,156 |
20,100 |
TABLE E-ANNEX-2 CMAQ Project Impacts Evaluation: Project Category, Traffic Flow Improvements; Subcategory, Freeway/Incident Management
|
Source |
Designation |
Daily Travel Impacts |
Emission Reductions (tons per day) |
||||||
|
VTR |
VMTR |
Transit Riders |
Delay Red. (hr) |
Speed Imp. (mph) |
HC |
NOx |
CO |
||
|
|
|
|
|
Emission Weights: |
1 |
4 |
0 |
||
|
Hagler Bailly (1999) |
ATMS freeway incident management (Atlanta) |
NA |
NA |
NA |
NA |
NA |
0.660 |
0.632 |
|
|
DVRPC (1994) |
Congestion/incident management on Philadelphia freeways |
NA |
(12,472) |
NA |
NA |
4.2 |
0.164 |
(0.007) |
0.703 |
|
Univ. of MD (2001) |
MDOT CHART Program (ITS) |
NA |
NA |
NA |
62,560 |
NA |
0.0213 |
0.168 |
0.913 |
|
DVRPC (1994) |
Ramp metering |
NA |
43,216 |
NA |
|
|
0.412 |
0.034 |
3.482 |
|
Mean |
|
NA |
15,372 |
NA |
62,560 |
4.2 |
0.314 |
0.207 |
1.699 |
|
Median |
|
NA |
15,372 |
NA |
62,560 |
4.2 |
0.288 |
0.101 |
0.913 |
|
Travel term definitions: VTR = vehicle trip reduction; VMTR = vehicle miles of travel reduced; transit riders = increase in daily transit ridership. Emission term definitions: total emissions = weighted sum of HC, NOx, CO, and PM10; emission weights = importance weights representing value of individual pollutants; emission year = time period for which source study estimate applies; benefits trend indicates whether emissions are decreasing, increasing, or constant over project life. Cost-effectiveness definitions: BDF = benefits discount factor (combination of benefits trend and discount rate); annual benefits = weighted emissions * days/year * BDF; annual costs = annualized capital costs plus applicable operating, administrative, and private costs. |
|||||||||
|
|
|
|
Cost-Effectiveness |
||||||
|
PM10 |
Total |
Emission “Year” |
Life (years) |
Benefits Trend |
Discount Rate (%) |
BDF |
Ann. Benefits (tons/year) |
Annual Costs (2000 $) |
Cost/Ton (2000 $) |
|
0 |
|
|
|
|
|
|
|
|
|
|
|
3.188 |
2010 |
10 |
Decrease |
7 |
0.455 |
362.6 |
853,087 |
2,352 |
|
|
0.138 |
1996 |
10 |
Decrease |
7 |
0.455 |
15.7 |
8,531,152 |
543,866 |
|
|
0.695 |
1999 |
5 |
Decrease |
7 |
0.550 |
95.5 |
19,095,000 |
199,846 |
|
|
0.549 |
1996 |
10 |
Decrease |
7 |
0.455 |
62.4 |
313,856 |
5,028 |
|
|
1.142 |
|
|
|
|
|
134.1 |
7,198,274 |
187,773 |
|
|
0.622 |
|
|
|
|
|
79.0 |
4,692,120 |
102,437 |
TABLE E-ANNEX-3 CMAQ Project Impacts Evaluation: Project Category, HOV Facilities
|
Source |
Designation |
Daily Travel Impacts |
Emission Reductions (tons per day) |
|||||||
|
VTR |
VMTR |
Transit Riders |
Delay Red. (hr) |
Speed Imp. (mph) |
HC |
NOx |
CO |
|||
|
|
|
|
|
Emission Weights: |
1 |
4 |
0 |
|||
|
Hagler Bailly (1999) |
I-84 HOV lane extension (Hartford) |
NA |
NA |
NA |
NA |
NA |
0.0132 |
0.0044 |
|
|
|
MOCOG (1995) |
HOV freeway network |
39,400 |
684,100 |
(8,000) |
NA |
NA |
0.606 |
0.847 |
|
|
|
TTI (1997) |
Katy Freeway HOV (Houston) |
5,620 |
75,600 |
NA |
NA |
26% |
0.066 |
(0.035) |
|
|
|
Mean |
|
22,510 |
379,850 |
−8,000 |
NA |
0.260 |
0.228 |
0.272 |
|
|
|
Median |
|
22,510 |
379,850 |
−8,000 |
NA |
0.260 |
0.066 |
0.004 |
|
|
|
Travel term definitions: VTR = vehicle trip reduction; VMTR = vehicle miles of travel reduced; transit riders = increase in daily transit ridership. Emission term definitions: total emissions = weighted sum of HC, NOx, CO, and PM10; emission weights = importance weights representing value of individual pollutants; emission year = time period for which source study estimate applies; benefits trend indicates whether emissions are decreasing, increasing, or constant over project life. Cost-effectiveness definitions: BDF = benefits discount factor (combination of benefits trend and discount rate); annual benefits = weighted emissions * days/year * BDF; annual costs = annualized capital costs plus applicable operating, administrative, and private costs. |
||||||||||
|
|
Cost-Effectiveness |
||||||||
|
PM10 |
Total |
Emission “Year” |
Life (years) |
Benefits Trend |
Discount Rate (%) |
BDF |
Annual Benefits (tons/year) |
Annual Costs (2000 $) |
Cost/Ton (2000 $) |
|
0 |
|
|
|
|
|
|
|
|
|
|
|
0.0308 |
Avg. over life of project |
20 |
Constant |
7 |
0.567 |
4.4 |
1,470,355 |
336,782 |
|
0.339 |
3.995 |
1997 |
20 |
Constant |
6 |
0.608 |
607.2 |
9,527,760 |
15,690 |
|
|
(0.074) |
1996 |
20 |
Constant |
7 |
0.567 |
(10.5) |
8,030,880 |
NA |
|
|
1.317 |
|
|
|
|
|
200.4 |
6,342,998 |
176,236 |
|
|
0.031 |
|
|
|
|
|
4.4 |
8,030,880 |
176,236 |
TABLE E-ANNEX-4 CMAQ Project Impacts Evaluation: Project Category, Ridesharing; Subcategory, Programmatic
|
Source |
Designation |
Daily Travel Impacts |
Emission Reductions (tons per day) |
||||||
|
VTR |
VMTR |
Transit Riders |
Delay Red. (hr) |
Speed Imp. (mph) |
HC |
NOx |
CO |
||
|
|
|
|
|
Emission Weights: |
1 |
4 |
0 |
||
|
Hagler Bailly (1999) |
University rideshare program (Atlanta) |
864 |
8,640 |
NA |
NA |
NA |
0.016 |
0.016 |
|
|
Hagler Bailly (1999) |
Commuter assistance program (Riverside, CA) |
NA |
NA |
NA |
NA |
NA |
0.011 |
0.011 |
0.091 |
|
Pansing et al. (1998) |
CTS telephone ridematching (Los Angeles) |
382 |
23,868 |
NA |
NA |
NA |
0.0764 |
0.0764 |
|
|
MWCOG (2000) |
Integrated ridesharing program |
238 |
6,977 |
NA |
NA |
NA |
0.0043 |
0.0093 |
|
|
DVRPC (1994) |
Regional ridesharing program |
24,142 |
184,256 |
5,539 |
NA |
NA |
0.300 |
0.325 |
1.542 |
|
Mean |
|
6,407 |
55,935 |
5,539 |
NA |
NA |
0.081 |
0.087 |
0.817 |
|
Median |
|
623 |
16,254 |
5,539 |
NA |
NA |
0.016 |
0.016 |
0.817 |
|
Travel term definitions: VTR = vehicle trip reduction; VMTR = vehicle miles of travelreduced; transit riders = increase in daily transit ridership. Emission term definitions: total emissions = weighted sum of HC, NOx, CO, and PM10; emission weights = importance weights representing value of individual pollutants; emission year = time period for which source study estimate applies; benefits trend indicates whether emissions are decreasing, increasing, or constant over project life. Cost-effectiveness definitions: BDF = benefits discount factor (combination of benefits trend and discount rate); annual benefits = weighted emissions * days/year * BDF; annual costs = annualized capital costs plus applicable operating, administrative, and private costs. |
|||||||||
|
|
Cost-Effectiveness |
||||||||
|
PM10 |
Total |
Emission “Year” |
Life (years) |
Benefits Trend |
Discount Rate (%) |
BDF |
Annual Benefits (tons/ year) |
Annual Costs (2000 $) |
Cost/Ton (2000 $) |
|
0 |
|
|
|
|
|
|
|
|
|
|
|
0.08 |
NA |
10 |
Constant |
7 |
0.752 |
15.0 |
111,268 |
7,398 |
|
0.007 |
0.053 |
1995–96 |
1 |
Constant |
NA |
1.000 |
26.4 |
423,287 |
16,034 |
|
0.0382 |
0.382 |
1997–2001 |
1 |
Constant |
NA |
1.000 |
95.5 |
118,752 |
1,243 |
|
|
0.042 |
1996 |
1 |
Constant |
NA |
1.000 |
10.4 |
154,128 |
14,856 |
|
|
1.600 |
1996 |
1 |
Constant |
NA |
1.000 |
400.1 |
1,731,785 |
4,329 |
|
0.023 |
0.431 |
|
|
|
|
|
109.5 |
507,844 |
8,772 |
|
0.023 |
0.080 |
|
|
|
|
|
26.4 |
154,128 |
7,398 |
TABLE E-ANNEX-5 CMAQ Project Impacts Evaluation: Project Category, Ridesharing; Subcategory, Vanpool/Buspool Programs
|
Source |
Designation |
Daily Travel Impacts |
Emission Reductions (tons per day) |
||||||
|
VTR |
VMTR |
Transit Riders |
Delay Red. (hr) |
Speed Imp. (mph) |
HC |
NOx |
CO |
||
|
|
|
|
|
Emission Weights: |
1 |
4 |
0 |
||
|
Hagler Bailly (1999) |
Regional vanpool program (Houston) |
NA |
NA |
NA |
NA |
NA |
0.12 |
0.248 |
|
|
Pansing et al. (1998) |
Palmdale community vanpool |
66 |
3,704 |
NA |
NA |
NA |
0.0026 |
0.0043 |
|
|
Pansing et al. (1998) |
Torrance vanpool |
57 |
2,950 |
NA |
NA |
NA |
0.0021 |
0.0034 |
|
|
Pansing et al. (1998) |
City of Anaheim commuter express buspool |
13 |
2,419 |
NA |
NA |
NA |
0.0015 |
0.0027 |
|
|
Pansing et al. (1998) |
UCLA vanpool expansion |
127 |
5,392 |
NA |
NA |
NA |
0.0040 |
0.0063 |
|
|
Pansing et al. (1998) |
Coronado TMA vanpool |
574 |
27,520 |
NA |
NA |
NA |
0.0198 |
0.0322 |
|
|
Mean |
|
167 |
8,397 |
NA |
NA |
NA |
0.025 |
0.050 |
NA |
|
Median |
|
66 |
3,704 |
NA |
NA |
NA |
0.003 |
0.005 |
NA |
|
Travel term definitions: VTR = vehicle trip reduction; VMTR = vehicle miles of travel reduced; transit riders = increase in daily transit ridership. Emission term definitions: total emissions = weighted sum of HC, NOx, CO, and PM10; emission weights = importance weights representing value of individual pollutants; emission year = time period for which source study estimate applies; benefits trend indicates whether emissions are decreasing, increasing, or constant over project life. Cost-effectiveness definitions: BDF = benefits discount factor (combination of benefits trend and discount rate); annual benefits = weighted emissions * days/year * BDF; annual costs = annualized capital costs plus applicable operating, administrative, and private costs. |
|||||||||
|
|
Cost-Effectiveness |
||||||||
|
PM10 |
Total |
Emission “Year” |
Life (years) |
Benefits Trend |
Discount Rate (%) |
BDF |
Annual Benefits (tons/year) |
Annual Costs (2000 $) |
Cost/Ton (2000 $) |
|
0 |
|
|
|
|
|
|
|
|
|
|
|
1.112 |
1997/98 |
1 |
Constant |
NA |
1.000 |
278.0 |
1,708,208 |
6,145 |
|
0.0018 |
0.020 |
1997–2001 |
1 |
Constant |
NA |
1.000 |
5.0 |
54,516 |
10,984 |
|
0.0015 |
0.016 |
1997–2001 |
1 |
Constant |
NA |
1.000 |
4.0 |
96,593 |
24,347 |
|
0.0012 |
0.013 |
1997–2001 |
1 |
Constant |
NA |
1.000 |
3.1 |
31,380 |
10,017 |
|
0.0027 |
0.029 |
1997–2001 |
1 |
Constant |
NA |
1.000 |
7.3 |
652,379 |
88,960 |
|
0.0136 |
0.149 |
1997–2001 |
1 |
Constant |
NA |
1.000 |
37.2 |
191,932 |
5,164 |
|
0.004 |
0.223 |
|
|
|
|
|
55.8 |
455,835 |
24,270 |
|
0.002 |
0.025 |
|
|
|
|
|
6.1 |
144,262 |
10,501 |
TABLE E-ANNEX-6 CMAQ Project Impacts Evaluation: Project Category, Ridesharing; Subcategory, Park-and-Ride for Carpool/Vanpool
|
Source |
Designation |
Daily Travel Impacts |
Emission Reductions (tons per day) |
||||||
|
VTR |
VMTR |
Transit Riders |
Delay Red. (hr) |
Speed Imp. (mph) |
HC |
NOx |
CO |
||
|
|
|
|
|
Emission Weights: |
1 |
4 |
0 |
||
|
Hagler Bailly (1999) |
Park-and-ride facilities (Baltimore) |
0 |
2,100 |
42 |
NA |
NA |
0.001 |
0.004 |
|
|
MWCOG (1995) |
Park-and-ride lots at major highway intersections |
(730) |
63,500 |
(50) |
NA |
NA |
0.035 |
0.070 |
|
|
MOCOG (1995) |
Build HOV park-and-ride lots |
(2,400) |
41,600 |
NA |
NA |
NA |
0.012 |
0.041 |
|
|
DVRPC (1994) |
New park-and-ride lots along highways |
0 |
50,616 |
(1,985) |
NA |
NA |
0.054 |
0.086 |
0.330 |
|
Mean |
|
(783) |
39,454 |
(664) |
NA |
NA |
0.025 |
0.050 |
0.330 |
|
Median |
|
(365) |
46,108 |
(50) |
NA |
NA |
0.023 |
0.056 |
0.330 |
|
Travel term definitions: VTR = vehicle trip reduction; VMTR = vehicle miles of travel reduced; transit riders = increase in daily transit ridership. Emission term definitions: total emissions = weighted sum of HC, NOx, CO, and PM10; emission weights = importance weights representing value of individual pollutants; emission year = time period for which source study estimate applies; benefits trend indicates whether emissions are decreasing, increasing, or constant over project life. Cost-effectiveness definitions: BDF = benefits discount factor (combination of benefits trend and discount rate); annual benefits = weighted emissions * days/year * BDF; annual costs = annualized capital costs plus applicable operating, administrative, and private costs. |
|||||||||
|
|
Cost-Effectiveness |
||||||||
|
PM10 |
Total |
Emission “Year” |
Life (years) |
Benefits Trend |
Discount Rate (%) |
BDF |
Annual Benefits (tons/year) |
Annual Costs (2000 $) |
Cost/Ton (2000 $) |
|
0 |
|
|
|
|
|
|
|
|
|
|
|
0.017 |
1999 |
30 |
Constant |
7 |
0.443 |
1.9 |
16,206 |
8,607 |
|
0.031 |
0.313 |
1996 |
10 |
Constant |
6 |
0.780 |
61.1 |
1,095,692 |
17,935 |
|
0.021 |
0.177 |
Avg. over life of project |
10 |
Constant |
6 |
0.780 |
34.6 |
2,349,459 |
67,994 |
|
|
0.398 |
1996 |
10 |
Constant |
7 |
0.752 |
74.8 |
5,291,343 |
70,717 |
|
0.026 |
0.226 |
|
|
|
|
|
43.1 |
2,188,175 |
41,313 |
|
0.026 |
0.245 |
|
|
|
|
|
47.8 |
1,722,576 |
42,964 |
TABLE E-ANNEX-7 CMAQ Project Impacts Evaluation: Project Category, Travel Demand Management; Subcategory, Regional Approaches
|
Source |
Designation |
Daily Travel Impacts |
Emission Reductions (tons per day) |
||||||
|
VTR |
VMTR |
Transit Riders |
Delay Red. (hr) |
Speed Imp. (mph) |
HC |
NOx |
CO |
||
|
|
|
|
|
Emission Weights: |
1 |
4 |
0 |
||
|
Hagler Bailly (1999) |
Long Island TDM program |
300 |
13,500 |
NA |
NA |
NA |
0.018 |
0.028 |
0.142 |
|
Hagler Bailly (1999) |
IEPA public education and outreach (Chicago) |
NA |
NA |
NA |
NA |
NA |
0.102 |
0.102 |
|
|
Hagler Bailly (1999) |
Regional TMAs (Atlanta) |
NA |
NA |
NA |
NA |
NA |
0.105 |
0.106 |
|
|
Hagler Bailly (1999) |
Glendale, CA, TMA parking management program |
NA |
NA |
NA |
NA |
NA |
0.018 |
0.020 |
0.156 |
|
Hagler Bailly (1999) |
Clean air action program transit subsidy (Houston) |
NA |
NA |
75,627 |
NA |
NA |
0.117 |
0.139 |
|
|
Pansing et al. (1998) |
Santa Monica TMA |
253 |
3802 |
NA |
NA |
NA |
0.0037 |
0.0048 |
|
|
Pansing et al. (1998) |
Los Angeles County integrated TDM |
215 |
3867 |
NA |
NA |
NA |
0.0035 |
0.0048 |
|
|
Hagler Bailly (1999) |
MARTA employer transit passes |
1,504 |
39,104 |
1,504 |
NA |
NA |
0.066 |
0.067 |
|
|
Mean |
|
568 |
15,068 |
38,566 |
NA |
NA |
0.054 |
0.059 |
0.149 |
|
Median |
|
277 |
8,684 |
38,566 |
NA |
NA |
0.042 |
0.047 |
0.149 |
|
Travel term definitions: VTR = vehicle trip reduction; VMTR = vehicle miles of travel reduced; transit riders = increase in daily transit ridership. Emission term definitions: total emissions = weighted sum of HC, NOx, CO, and PM10; emission weights = importance weights representing value of individual pollutants; emission year = time period for which source study estimate applies; benefits trend indicates whether emissions are decreasing, increasing, or constant over project life. Cost-effectiveness definitions: BDF = benefits discount factor (combination of benefits trend and discount rate); annual benefits = weighted emissions * days/year * BDF; annual costs = annualized capital costs plus applicable operating, administrative, and private costs. |
|||||||||
|
|
Cost-Effectiveness |
||||||||
|
PM10 |
Total |
Emission “Year” |
Life (years) |
Benefits Trend |
Discount Rate (%) |
BDF |
Annual Benefits (tons/year) |
Annual Costs (2000 $) |
Cost/Ton (2000 $) |
|
0 |
|
|
|
|
|
|
|
|
|
|
|
0.129 |
Average |
5 |
Constant |
10 |
0.834 |
26.9 |
454,500 |
16,885 |
|
|
0.511 |
1998 |
2 |
Constant |
NA |
1.000 |
127.8 |
297,102 |
2,326 |
|
|
0.529 |
2005 |
12 |
Increase |
7 |
0.278 |
36.8 |
300,183 |
8,165 |
|
0.012 |
0.098 |
1995 |
1 |
Constant |
NA |
1.000 |
24.6 |
108,889 |
4,428 |
|
|
0.673 |
1996 |
2 |
Constant |
NA |
1.000 |
168.4 |
3,549,000 |
21,081 |
|
0.0019 |
0.023 |
1997–2001 |
1 |
Constant |
NA |
1.000 |
5.8 |
170,214 |
29,521 |
|
0.0019 |
0.023 |
1997–2001 |
1 |
Constant |
NA |
1.000 |
5.7 |
189,609 |
33,205 |
|
|
0.334 |
1999 |
1 |
Constant |
NA |
1.000 |
83.5 |
376,875 |
4,513 |
|
0.005 |
0.290 |
|
|
|
|
|
59.9 |
680,797 |
15,016 |
|
0.002 |
0.232 |
|
|
|
|
|
31.8 |
298,643 |
12,525 |
TABLE E-ANNEX-8 CMAQ Project Impacts Evaluation: Project Category, Travel Demand Management; Subcategory, Employer Trip Reduction Programs and ECO
|
Source |
Designation |
Daily Travel Impacts |
Emission Reductions (tons per day) |
||||||
|
VTR |
VMTR |
Transit Riders |
Delay Red. (hr) |
Speed Imp. (mph) |
HC |
NOx |
CO |
||
|
|
|
|
|
Emission Weights: |
1 |
4 |
0 |
||
|
Wachs (1994) |
Regulation XV program |
334,480 |
2,675,840 |
2.0% |
NA |
NA |
3.455 |
3.761 |
|
|
Ernst & Young (1993) |
Regulation XV program |
334,480 |
2,675,840 |
2.0% |
NA |
NA |
3.455 |
3.761 |
|
|
TTI (1996) |
Houston ECO program (at $50/employee) |
NA |
NA |
NA |
NA |
NA |
2.820 |
2.830 |
|
|
TTI (1996) |
Houston ECO program (at $200/employee) |
NA |
NA |
NA |
NA |
NA |
2.820 |
2.830 |
24.960 |
|
MWCOG (1995) |
On-site voluntary ETR |
95,600 |
1,411,600 |
25,800 |
NA |
NA |
1.379 |
1.802 |
|
|
MWCOG (1995) |
Mandatory ECO |
415,600 |
6,135,000 |
48,400 |
NA |
NA |
5.996 |
7.830 |
|
|
DVRPC (1994) |
Implement ECO/meet APO targets in PA portion of Philadelphia |
161,236 |
1,226,424 |
55,567 |
NA |
NA |
1.791 |
2.200 |
11.479 |
|
Mean |
|
268,279 |
2,824,941 |
25,953 |
NA |
NA |
3.102 |
3.573 |
18.220 |
|
Median |
|
334,480 |
2,675,840 |
25,800 |
NA |
NA |
2.820 |
2.830 |
18.220 |
|
Travel term definitions: VTR = vehicle trip reduction; VMTR = vehicle miles of travel reduced; transit riders = increase in daily transit ridership. Emission term definitions: total emissions = weighted sum of HC, NOx, CO, and PM10; emission weights = importance weights representing value of individual pollutants; emission year = time period for which source study estimate applies; benefits trend indicates whether emissions are decreasing, increasing, or constant over project life. Cost-effectiveness definitions: BDF = benefits discount factor (combination of benefits trend and discount rate); annual benefits = weighted emissions * days/year * BDF; annual costs = annualized capital costs plus applicable operating, administrative, and private costs. |
|||||||||
|
|
Cost-Effectiveness |
||||||||
|
PM10 |
Total |
Emission “Year” |
Life (years) |
Benefits Trend |
Discount Rate (%) |
BDF |
Annual Benefits (tons/year) |
Annual Costs (2000 $) |
Cost/Ton (2000 $) |
|
0 |
|
|
|
|
|
|
|
|
|
|
1.326 |
18.50 |
1997–2001 |
1 |
Constant |
NA |
1.000 |
4,624.9 |
61,020,000 |
13,194 |
|
1.326 |
18.50 |
1997–2001 |
1 |
Constant |
NA |
1.000 |
4,624.9 |
263,877,600 |
57,056 |
|
|
14.14 |
1997–2001 |
1 |
Constant |
NA |
1.000 |
3,535.0 |
20,101,942 |
5,687 |
|
|
14.14 |
1997–2001 |
1 |
Constant |
NA |
1.000 |
3,535.0 |
80,407,766 |
22,746 |
|
|
8.59 |
1997–2001 |
1 |
Constant |
NA |
1.000 |
2,146.5 |
376,779,600 |
175,536 |
|
|
37.32 |
1997–2001 |
1 |
Constant |
NA |
1.000 |
9,328.9 |
170,786,301 |
18,307 |
|
|
10.59 |
1996 |
1 |
Constant |
NA |
1.000 |
2,647.8 |
115,138,686 |
43,485 |
|
1.326 |
17.40 |
|
|
|
|
|
4,349.0 |
155,444,556 |
48,002 |
|
1.326 |
14.14 |
|
|
|
|
|
3,535.0 |
115,138,686 |
22,746 |
TABLE E-ANNEX-9 CMAQ Project Impacts Evaluation: Project Category, Alternative Work Arrangements/Hours; Subcategory, Telecommuting/Telework
|
Source |
Designation |
Emission Reductions (tons per day) |
Daily Travel Impacts |
||||||
|
VTR |
VMTR |
Transit Riders |
Delay Red. (hr) |
Speed Imp. (mph) |
HC |
NOx |
CO |
||
|
|
|
|
|
Emission Weights: |
1 |
4 |
0 |
||
|
Pansing et al. (1998) |
Antelope Valley telebusiness center |
3 |
3,732 |
NA |
NA |
NA |
0.0023 |
0.0042 |
|
|
Pansing et al. (1998) |
Santa Clarita telebusiness center |
0 |
2,200 |
NA |
NA |
NA |
0.0013 |
0.0025 |
|
|
Pansing et al. (1998) |
Pomona telebusiness |
3 |
338 |
NA |
NA |
NA |
0.0002 |
0.0004 |
|
|
Pansing et al. (1998) |
Long Beach telebusiness |
15 |
163 |
NA |
NA |
NA |
0.0002 |
0.0002 |
|
|
Pansing et al. (1998) |
LA Public Defender interview teleconferencing |
9 |
370 |
NA |
NA |
NA |
0.0003 |
0.0004 |
|
|
Pansing et al. (1998) |
San Bernardino Probation Dept. teleconferencing |
8 |
451 |
NA |
NA |
NA |
0.0003 |
0.0005 |
|
|
Pansing et al. (1998) |
College of the Desert telecommuting program |
7 |
924 |
NA |
NA |
NA |
0.0006 |
0.0011 |
|
|
MWCOG (1995) |
Regional telecommute incentives |
62,500 |
868,700 |
(12,500) |
NA |
NA |
0.81 |
0.810 |
|
|
MWCOG (1995) |
Regional telecommute centers |
19,000 |
1,083,400 |
NA |
NA |
NA |
0.02 |
0.020 |
|
|
DVRPC (1994) |
Regional telecommute program |
48,306 |
388,368 |
(20,289) |
NA |
NA |
0.586 |
0.682 |
3.309 |
|
Mean |
|
12,985 |
234,865 |
(16,395) |
NA |
NA |
0.142 |
0.152 |
3.309 |
|
Median |
|
8 |
1,562 |
(16,395) |
NA |
NA |
0.001 |
0.002 |
3.309 |
|
Travel term definitions: VTR = vehicle trip reduction; VMTR = vehicle miles of travel reduced; transit riders = increase in daily transit ridership. Emission term definitions: total emissions = weighted sum of HC, NOx, CO, and PM10; emission weights = importance weights representing value of individual pollutants; emission year = time period for which source study estimate applies; benefits trend indicates whether emissions are decreasing, increasing, or constant over project life. Cost-effectiveness definitions: BDF = benefits discount factor (combination of benefits trend and discount rate); annual benefits = weighted emissions * days/year * BDF; annual costs = annualized capital costs plus applicable operating, administrative, and private costs. |
|||||||||
| Cost-Effectiveness | ||||||||
PM10 | Total | Emission “Year” | Life (years) | Benefits Trend | Discount Rate (%) | BDF | Annual Benefits (tons/year) | Annual Costs (2000 $) | Cost/Ton (2000 $) |
0 |
|
|
|
|
|
|
|
|
|
0.0018 | 0.019 | 1997–2001 | 5 | Increasing | 10 | 0.332 | 1.6 | 380,045 | 240,108 |
0.0011 | 0.0112 | 1997–2001 | 5 | Increasing | 10 | 0.332 | 0.9 | 245,427 | 263,588 |
0.0002 | 0.0018 | 1997–2001 | 5 | Increasing | 10 | 0.332 | 0.1 | 228,388 | 1,559,107 |
0.0001 | 0.0011 | 1997–2001 | 5 | Increasing | 10 | 0.332 | 0.1 | 720,523 | 8,227,399 |
0.0002 | 0.0020 | 1997–2001 | 5 | Increasing | 10 | 0.332 | 0.2 | 160,296 | 958,156 |
0.0002 | 0.0024 | 1997–2001 | 5 | Increasing | 10 | 0.332 | 0.2 | 173,623 | 866,193 |
0.0005 | 0.0048 | 1997–2001 | 5 | Increasing | 10 | 0.332 | 0.4 | 44,150 | 110,327 |
| 4.050 | 1996 | 1 | Constant | NA | 1.000 | 1,012.5 | 83,494,215 | 82,463 |
| 0.100 | 1996 | 10 | Increasing | 6 | 0.314 | 7.9 | 1,226,158 | 156,198 |
3.314 | 1996 | 1 | Increasing | NA | 1.000 | 828.5 | 11,024,442 | 13,307 | |
0.001 | 0.751 | 185.2 | 9,769,727 | 1,247,685 | |||||
0.000 | 0.008 | 0.7 | 312,736 | 251,848 | |||||
TABLE E-ANNEX-10 CMAQ Project Impacts Evaluation: Project Category, Bike/Pedestrian Improvements
|
Source |
Designation |
Daily Travel Impacts |
Emission Reductions (tons per day) |
||||||
|
VTR |
VMTR |
Transit Riders |
Delay Red. (hr) |
Speed Imp. (mph) |
HC |
NOx |
CO |
||
|
|
|
|
|
Emission Weights: |
1 |
4 |
0 |
||
|
Hagler Bailly (1999) |
Philadelphia bicycle network plan |
NA |
NA |
NA |
NA |
NA |
0.030 |
0.026 |
|
|
Hagler Bailly (1999) |
Frankfort, IL, suburban bike rack incentive program |
NA |
NA |
NA |
NA |
NA |
0.001 |
0.001 |
|
|
Pansing et al. (1998) |
Coronado TMA bike program |
85 |
1,945 |
NA |
NA |
NA |
0.002 |
0.002 |
|
|
MWCOG (1995) |
Advanced completion of LRP bike element |
23,867 |
28,100 |
NA |
NA |
NA |
0.148 |
0.086 |
|
|
DVRPC (1994) |
Regional bike improvements to capture 5% of work trips < 5 mi |
61,985 |
92,584 |
(13,469) |
NA |
NA |
0.211 |
0.180 |
1.026 |
|
DVRPC (1994) |
Capture 5% of nonwork trips < 5 mi |
112,712 |
160,336 |
(7,484) |
NA |
NA |
0.332 |
0.343 |
1.750 |
|
Pansing et al. (1998) |
LA City bike lockers |
23 |
544 |
NA |
NA |
NA |
0.0005 |
0.0007 |
|
|
Pansing et al. (1998) |
Santa Clarita bike lockers |
18 |
101 |
NA |
NA |
NA |
0.0002 |
0.0002 |
|
|
Pansing et al. (1998) |
OCTA bike and ride |
39 |
629 |
NA |
NA |
NA |
0.0006 |
0.0008 |
|
|
MWCOG (1995) |
Improved pedestrian facilities near rail stations |
1,900 |
17,000 |
2,600 |
NA |
NA |
0.021 |
0.023 |
|
|
MWCOG (1995) |
Transit station bike racks and lockers |
20,186 |
22,800 |
2,016 |
NA |
NA |
0.025 |
0.030 |
|
|
MWCOG (1995) |
Employer-provided bicycles |
4,500 |
13,500 |
NA |
NA |
NA |
0.033 |
0.025 |
|
|
Pansing et al. (1998) |
Fullerton bike loan, Ph. I |
135 |
405 |
NA |
NA |
NA |
0.0010 |
0.0008 |
|
|
|
|
|
Cost-Effectiveness |
||||||
|
PM10 |
Total |
Emission “Year” |
Life (years) |
Benefits Trend |
Discount Rate (%) |
BDF |
Annual Benefits (tons/year) |
Annual Costs (2000 $) |
Cost/Ton (2000 $) |
|
0 |
|
|
|
|
|
|
|
|
|
|
|
0.132 |
1994 |
30 |
Increase |
7 |
0.144 |
4.8 |
322,024 |
67,520 |
|
|
0.005 |
Avg. over life of project |
30 |
Increase |
7 |
0.144 |
0.2 |
27,232 |
145,471 |
|
|
|
|
12 |
|
|
|
|
|
|
|
0.001 |
0.011 |
1997–2001 |
|
Increase |
5 |
0.318 |
0.9 |
9,182 |
10,364 |
|
0.014 |
0.490 |
1997–2001 |
10 |
Increase |
6 |
0.332 |
40.7 |
3,013,876 |
74,121 |
|
|
0.929 |
1996 |
20 |
Increase |
7 |
0.144 |
33.5 |
3,249,698 |
97,137 |
|
|
1.703 |
1996 |
20 |
Increase |
7 |
0.144 |
61.3 |
5,627,794 |
91,795 |
|
0.0003 |
0.0031 |
1997–2001 |
12 |
Increase |
5 |
0.318 |
0.2 |
16,149 |
65,445 |
|
0.0000 |
0.001 |
1997–2001 |
12 |
Increase |
5 |
0.318 |
0.1 |
18,091 |
295,605 |
|
0.0003 |
0.004 |
1997–2001 |
12 |
Increase |
5 |
0.318 |
0.3 |
29,660 |
98,759 |
|
0.008 |
0.114 |
1997–2001 |
10 |
Increase |
6 |
0.332 |
9.5 |
3,269,754 |
344,660 |
|
0.011 |
0.146 |
1997–2001 |
10 |
Increase |
6 |
0.332 |
12.1 |
51,368 |
4,248 |
|
0.007 |
0.134 |
1997–2001 |
10 |
Increase |
6 |
0.332 |
11.1 |
2,042,694 |
183,526 |
|
0.0002 |
0.004 |
1997–2001 |
12 |
Increase |
5 |
0.318 |
0.3 |
9,578 |
29,892 |
|
Source |
Designation |
Daily Travel Impacts |
Emission Reductions (tons per day) |
||||||
|
VTR |
VMTR |
Transit Riders |
Delay Red. (hr) |
Speed Imp. (mph) |
HC |
NOx |
CO |
||
|
|
|
|
|
Emission Weights: |
1 |
4 |
0 |
||
|
Pansing et al. (1998) |
Fullerton bike loan, Ph. II |
15 |
47 |
NA |
NA |
NA |
0.0001 |
0.0001 |
|
|
Mean |
|
18,789 |
28,166 |
(4,084) |
NA |
NA |
0.057 |
0.051 |
1.388 |
|
Median |
|
1,018 |
7,722 |
(2,734) |
NA |
NA |
0.011 |
0.013 |
1.388 |
|
Travel term definitions: VTR = vehicle trip reduction; VMTR = vehicle miles of travel reduced; transit riders =increase in daily transit ridership. Emission term definitions: total emissions = weighted sum of HC, NOx, CO, and PM10; emission weights = importance weights representing value of individual pollutants; emission year = time period for which source study estimate applies; benefits trend indicates whether emissions are decreasing, increasing, or constant over project life. Cost-effectiveness definitions: BDF = benefits discount factor (combination of benefits trend and discount rate); annual benefits = weighted emissions * days/year * BDF; annual costs = annualized capital costs plus applicable operating, administrative, and private costs. |
|||||||||
TABLE E-ANNEX-11 CMAQ Project Impacts Evaluation: Project Category, Transit; Subcategory, New Shuttle and/or Feeder Services
|
Source |
Description |
Daily Travel Impacts |
Emission Reductions (tons per day) |
||||||
|
VTR |
VMTR |
Transit Riders |
Delay Red. (hr) |
Speed Imp. (mph) |
HC |
NOx |
CO |
||
|
|
|
|
|
Emission Weights: |
1 |
4 |
0 |
||
|
Hagler Bailly (1999) |
Lake Cook, IL, Shuttle Bug |
NA |
NA |
NA |
NA |
NA |
0.026 |
0.026 |
|
|
Hagler Bailly (1999) |
University City/30th Street circulator (Philadelphia) |
NA |
NA |
NA |
NA |
NA |
0.004 |
0.0032 |
|
|
Pansing et al. (1998) |
Children’s Court shuttle |
67 |
3,342 |
NA |
NA |
NA |
0.0024 |
0.0039 |
|
|
Pansing et al. (1998) |
PVTA Metrolink connection |
15 |
92 |
NA |
NA |
NA |
0.0001 |
0.0001 |
|
|
Pansing et al. (1998) |
Santa Clarita shuttles and shelters |
8 |
63 |
NA |
NA |
NA |
0.0001 |
0.0001 |
|
|
Pansing et al. (1998) |
West Hollywood Sunset shuttle |
25 |
40 |
NA |
NA |
NA |
0.0002 |
0.0001 |
|
|
Pansing et al. (1998) |
Hollywood Connection |
66 |
1,970 |
NA |
NA |
NA |
0.0016 |
0.0024 |
|
|
Pansing et al. (1998) |
Burbank Media District TMO shuttle |
124 |
2,471 |
NA |
NA |
NA |
0.0022 |
0.0031 |
|
|
Pansing et al. (1998) |
City of Anaheim express feeder |
11 |
167 |
NA |
NA |
NA |
0.0002 |
0.0002 |
|
|
Pansing et al. (1998) |
Orange County employer shuttle |
22 |
348 |
NA |
NA |
NA |
0.0003 |
0.0004 |
|
|
Pansing et al. (1998) |
Mainplace Santa Ana shuttle |
14 |
70 |
NA |
NA |
NA |
0.0001 |
0.0001 |
|
|
Pansing et al. (1998) |
City of Los Angeles EV shuttle |
16 |
183 |
NA |
NA |
NA |
0.0002 |
0.0002 |
|
|
Pansing et al. (1998) |
Big Bear transit and dial-a-ride |
67 |
336 |
NA |
NA |
NA |
0.0006 |
0.0005 |
|
|
Michael Baker (1997) |
Pace VIP transit van program |
2,529 |
119,956 |
4,846 |
NA |
NA |
0.0666 |
0.156 |
0.639 |
|
Michael Baker (1997) |
NJ Transit WHEELS program |
4,070 |
57,653 |
11,016 |
NA |
NA |
0.057 |
0.074 |
|
|
Mean |
|
541 |
14,361 |
7,931 |
NA |
NA |
0.011 |
0.018 |
0.639 |
|
Median |
|
25 |
336 |
7,931 |
NA |
NA |
0.001 |
0.001 |
0.639 |
|
Travel term definitions: VTR = vehicle trip reduction; VMTR = vehicle miles of travel reduced; transit riders = increase in daily transit ridership. Emission term definitions: total emissions = weighted sum of HC, NOx, CO, and PM10; emission weights = importance weights representing value of individual pollutants; emission year = time period for which source study estimate applies; benefits trend indicates whether emissions are decreasing, increasing, or constant over project life. |
|||||||||
|
|
|
|
Cost-Effectiveness |
||||||
|
PM10 |
Total |
Emission “Year” |
Life (years) |
Benefits Trend |
Discount Rate (%) |
BDF |
Annual Benefits (tons/year) |
Annual Costs (2000 $) |
Cost/Ton (2000 $) |
|
0 |
|
|
|
|
|
|
|
|
|
|
|
0.129 |
1998 |
1 |
Constant |
NA |
1.000 |
32.2 |
395,460 |
12,300 |
|
|
0.0168 |
1994 |
1 |
Constant |
NA |
1.000 |
4.2 |
367,200 |
87,429 |
|
0.0017 |
0.0180 |
1997–2001 |
1 |
Constant |
NA |
1.000 |
4.5 |
337,975 |
75,056 |
|
0.0000 |
0.0007 |
1997–2001 |
1 |
Constant |
NA |
1.000 |
0.2 |
49,327 |
284,761 |
|
0.0000 |
0.0004 |
1997–2001 |
1 |
Constant |
NA |
1.000 |
0.1 |
57,683 |
525,676 |
|
0.0000 |
0.0006 |
1997–2001 |
1 |
Constant |
NA |
1.000 |
0.1 |
279,191 |
1,973,671 |
|
0.0010 |
0.011 |
1997–2001 |
1 |
Constant |
NA |
1.000 |
2.7 |
85,704 |
31,171 |
|
0.0012 |
0.014 |
1997–2001 |
1 |
Constant |
NA |
1.000 |
3.6 |
195,723 |
54,392 |
|
0.0001 |
0.001 |
1997–2001 |
1 |
Constant |
NA |
1.000 |
0.3 |
11,346 |
45,155 |
|
0.0002 |
0.002 |
1997–2001 |
1 |
Constant |
NA |
1.000 |
0.5 |
68,064 |
129,803 |
|
0.0000 |
0.001 |
1997–2001 |
1 |
Constant |
NA |
1.000 |
0.1 |
54,634 |
385,857 |
|
0.0001 |
0.001 |
1997–2001 |
1 |
Constant |
NA |
1.000 |
0.3 |
227,623 |
776,958 |
|
0.0002 |
0.003 |
1997–2001 |
1 |
Constant |
NA |
1.000 |
0.7 |
383,201 |
570,082 |
|
0.059 |
0.691 |
1997–2001 |
4 |
Constant |
6 |
0.918 |
158.5 |
3,919,500 |
24,730 |
|
0.029 |
0.353 |
1997 |
1 |
Constant |
NA |
1.000 |
88.3 |
5,025,000 |
56,931 |
|
0.007 |
0.083 |
|
|
|
|
|
19.8 |
763,842 |
335,598 |
|
0.000 |
0.003 |
|
|
|
|
|
0.7 |
227,623 |
87,429 |
|
Cost-effectiveness definitions: BDF = benefits discount factor (combination of benefits trend and discount rate); annual benefits = weighted emissions * days/year * BDF; annual costs = annualized capital costs plus applicable operating, administrative, and private costs. |
|||||||||
TABLE E-ANNEX-12 CMAQ Project Impacts Evaluation: Project Category, Transit Improvements; Subcategory, New Fixed Guideway Systems or Equipment
|
Source |
Designation |
Daily Travel Impacts |
Emission Reductions (tons per day) |
||||||
|
VTR |
VMTR |
Transit Riders |
Delay Red. (hr) |
Speed Imp. (mph) |
HC |
NOx |
CO |
||
|
|
|
|
|
Emission Weights: |
1 |
4 |
0 |
||
|
Hagler Bailly (1999) |
New light rail vehicles (Baltimore) |
3,044 |
42,135 |
3,044 |
NA |
NA |
0.025 |
0.083 |
|
|
Hagler Bailly (1999) |
Commuter rail coaches (MARC/Maryland) |
4,508 |
271,291 |
5,410 |
NA |
NA |
0.111 |
0.373 |
|
|
|
|
97 |
776 |
NA |
NA |
NA |
0.001 |
0.001 |
0.009 |
|
Pansinget al.(1998) |
Coronadoferry |
|
|
|
|
|
|
|
|
|
Michael Baker (1997) |
St. Louis Metro Link LRT |
0 |
133,560 |
22,260 |
NA |
NA |
0.087 |
0.1 |
|
|
Michael Baker (1997) |
Ottawa Transit Way |
181,818 |
2,258,609 |
200,000 |
NA |
NA |
2.365 |
2.948 |
|
|
Parsons Brinckerhoff (1999) |
Metra North Central commuter rail |
2,267 |
67,500 |
4,306 |
NA |
NA |
0.126 |
0.174 |
|
|
Mean |
31,956 |
462,312 |
47,004 |
NA |
NA |
0.453 |
0.613 |
0.009 |
|
|
Median |
|
2,656 |
100,530 |
5,410 |
NA |
NA |
0.099 |
0.137 |
0.009 |
|
Travel term definitions: VTR = vehicle trip reduction; VMTR = vehicle miles of travel reduced; transit riders = increase in daily transit ridership. Emission term definitions: total emissions = weighted sum of HC, NOx, CO, and PM10; emission weights = importance weights representing value of individual pollutants; emission year = time period for which source study estimate applies; benefits trend indicates whether emissions are decreasing, increasing, or constant over project life. Cost-effectiveness definitions: BDF = benefits discount factor (combination of benefits trend and discount rate); annual benefits = weighted emissions * days/year * BDF; annual costs = annualized capital costs plus applicable operating, administrative, and private costs. |
|||||||||
|
|
|
|
Cost-Effectiveness |
||||||
|
PM10 |
Total |
Emission “Year” |
Life (years) |
Benefits Trend |
Discount Rate (%) |
BDF |
Annual Benefits (tons/year) |
Annual Costs (2000 $) |
Cost/Ton (2000 $) |
|
0 |
|
|
|
|
|
|
|
|
|
|
|
0.358 |
2005 |
30 |
Modif. constant |
7 |
0.567 |
50.8 |
5,083,261 |
100,114 |
|
|
1.602 |
1998 |
30 |
Modif. constant |
7 |
0.567 |
227.1 |
7,410,339 |
32,627 |
|
0.002 |
0.004 |
1997–2001 |
1 |
Constant |
NA |
1.000 |
1.0 |
138,002 |
132,617 |
|
0.035 |
0.487 |
1997 |
30 |
Constant + increase |
6 |
0.654 |
79.6 |
37,486,500 |
470,791 |
|
1.119 |
14.156 |
1997–2001 |
30 |
Constant + increase |
6 |
0.654 |
2,314.5 |
19,687,950 |
8,506 |
|
0.335 |
0.822 |
1996 |
30 |
Constant + increase |
6 |
0.654 |
134.4 |
2,362,620 |
17,579 |
|
0.373 |
2.905 |
|
|
|
|
|
467.9 |
12,028,112 |
127,039 |
|
0.185 |
0.655 |
|
|
|
|
|
107.0 |
6,246,800 |
66,370 |
TABLE E-ANNEX-13 CMAQ Project Impacts Evaluation: Project Category, Transit Improvements; Subcategory, Conventional Transit Service Improvements
|
Source |
Description |
Daily Travel Impacts |
Emission Reductions (tons per day) |
||||||
|
VTR |
VMTR |
Transit Riders |
Delay Red. (hr) |
Speed Imp. (mph) |
HC |
NOx |
CO |
||
|
|
|
|
|
Emission Weights: |
1 |
4 |
0 |
||
|
Hagler Bailly (1999) |
MARTA ITS traveler information system |
NA |
NA |
720 |
NA |
NA |
0.008 |
0.009 |
|
|
Pansing et al.(1998) |
MTDB Route 19 |
149 |
892 |
NA |
NA |
NA |
0.0014 |
0.0013 |
|
|
Pansing et al.(1998) |
MTDB Route 901 |
2,100 |
16,803 |
NA |
NA |
NA |
0.022 |
0.024 |
|
|
Pansing et al.(1998) |
MTDB Routes |
2,376 |
19,011 |
NA |
NA |
NA |
0.025 |
0.027 |
|
|
MWCOG (1995) |
Increased frequency of existing transit service |
72,100 |
1,153,300 |
90,000 |
NA |
NA |
1.094 |
1.458 |
|
|
MWCOG (1995) |
Increased frequency of commuter rail service |
8,100 |
221,400 |
13,300 |
NA |
NA |
0.179 |
0.267 |
|
|
MWCOG (1995) |
Increased suburban coverage, timed transfer |
18,900 |
274,500 |
23,300 |
NA |
NA |
0.270 |
0.351 |
|
|
MWCOG (1995) |
Increased bus speeds in bus corridors |
4,100 |
49,500 |
5,400 |
NA |
NA |
0.053 |
0.065 |
|
|
DVRPC (1994) |
Suburban bus service improvements |
5,373 |
54,000 |
6,161 |
NA |
NA |
0.067 |
0.101 |
0.433 |
|
DVRPC (1994) |
Reduce city transit headways by 10% |
4,579 |
52,512 |
5,343 |
NA |
NA |
0.094 |
0.089 |
0.410 |
|
Mean |
|
13,086 |
204,657 |
20,603 |
NA |
NA |
0.181 |
0.239 |
0.422 |
|
Median |
|
4,579 |
52,512 |
6,161 |
NA |
NA |
0.060 |
0.077 |
0.422 |
|
Travel term definitions: VTR = vehicle trip reduction; VMTR = vehicle miles of travel reduced; transit riders = increase in daily transit ridership. Emission term definitions: total emissions = weighted sum of HC, NOx, CO, and PM10; emission weights = importance weights representing value of individual pollutants; emission year = time period for which source study estimate applies; benefits trend indicates whether emissions are decreasing, increasing, or constant over project life. Cost-effectiveness definitions: BDF = benefits discount factor (combination of benefits trend and discount rate); annual benefits = weighted emissions * days/year * BDF; annual costs = annualized capital costs plus applicable operating, administrative, and private costs. |
|||||||||
|
|
|
|
Cost-Effectiveness |
||||||
|
PM10 |
Total |
Emission “Year” |
Life (years) |
Benefits Trend |
Discount Rate (%) |
BDF |
Annual Benefits (tons/year) |
Annual Costs (2000 $) |
Cost/Ton (2000 $) |
|
0 |
|
|
|
|
|
|
|
|
|
|
|
0.044 |
1999 |
10 |
Constant |
7 |
8.3 |
0.752 |
31,709 |
3,833 |
|
|
0.007 |
1997–2001 |
1 |
Constant |
5 |
1.7 |
1.000 |
133,125 |
79,404 |
|
|
0.116 |
1997–2001 |
1 |
Constant |
5 |
29.0 |
1.000 |
1,107,009 |
38,118 |
|
|
0.131 |
1997–2001 |
1 |
Constant |
5 |
32.9 |
1.000 |
837,400 |
25,496 |
|
0.572 |
6.927 |
1997–2001 |
10 |
Constant + increase |
6 |
1,894.6 |
1.094 |
41,954,625 |
22,144 |
|
0.110 |
1.247 |
1997–2001 |
30 |
Constant + increase |
6 |
203.8 |
0.654 |
24,472,629 |
120,080 |
|
0.136 |
1.674 |
1997–2001 |
10 |
Constant + increase |
6 |
457.8 |
1.094 |
10,861,887 |
23,726 |
|
0.025 |
0.312 |
1997–2001 |
10 |
Constant + increase |
6 |
85.4 |
1.094 |
2,516,676 |
29,483 |
|
|
0.473 |
1996 |
10 |
Constant + increase |
7 |
124.0 |
1.049 |
2,065,306 |
16,657 |
|
|
0.451 |
1996 |
10 |
Constant + increase |
7 |
118.2 |
1.049 |
2,106,468 |
17,814 |
|
0.210 |
1.138 |
|
|
|
|
295.6 |
|
8,608,683 |
37,674 |
|
0.123 |
0.382 |
|
|
|
|
101.8 |
|
2,085,887 |
24,606 |
TABLE E-ANNEX-13A CMAQ Project Impacts Evaluation: Project Category, Transit; Subcategory, Park-and-Ride at Transit Stations
|
Source |
Description |
Daily Travel Impacts |
Emission Reductions (tons per day) |
||||||
|
VTR |
VMTR |
Transit Riders |
Delay Red. (hr) |
Speed Imp. (mph) |
HC |
NOx |
CO |
||
|
|
|
|
|
Emission Weights: |
1 |
4 |
0 |
||
|
DVRPC (1994) |
Expand parking at rail stations |
0 |
106,160 |
7,352 |
NA |
NA |
0.111 |
0.187 |
0.654 |
|
Travel term definitions: VTR = vehicle trip reduction; VMTR = vehicle miles of travel reduced; transit riders = increase in daily transit ridership. Emission term definitions: total emissions = weighted sum of HC, NOx, CO, and PM10; emission weights = importance weights representing value of individual pollutants; emission year = time period for which source study estimate applies; benefits trend indicates whether emissions are decreasing, increasing, or constant over project life. Cost-effectiveness definitions: BDF = benefits discount factor (combination of benefits trend and discount rate); annual benefits = weighted emissions * days/year * BDF; annual costs = annualized capital costs plus applicable operating, administrative, and private costs. |
|||||||||
TABLE E-ANNEX-14 CMAQ Project Impacts Evaluation: Project Category, Alternative Fuels; Subcategory, AFV Bus Purchase, Replacement, or Conversion
|
Source |
Description |
Daily Travel Impacts |
Emission Reductions (tons per day) |
||||||
|
VTR |
VMTR |
Transit Riders |
Delay Red. (hr) |
Speed Imp. (mph) |
HC |
NOx |
CO |
||
|
|
|
|
|
Emission Weights: |
1 |
4 |
0 |
||
|
Michael Baker (1997) |
Boise CNG bus replacement |
NA |
NA |
NA |
NA |
NA |
0.008 |
0.122 |
0.375 |
|
Pansing et al.(1998) |
CUSD clean air van purchase |
2 |
55 |
NA |
NA |
NA |
0.0000 |
0.0001 |
|
|
Pansing et al.(1998) |
MTDB Route 904 |
143 |
429 |
NA |
NA |
NA |
0.001 |
0.001 |
|
|
Pansing et al.(1998) |
MTDB Route 901 |
2,100 |
16,803 |
NA |
NA |
NA |
0.022 |
0.024 |
|
|
Pansing et al.(1998) |
MTDB Routes 933/934 |
2,376 |
19,011 |
NA |
NA |
NA |
0.025 |
0.027 |
|
|
Pansing et al.(1998) |
SCE electric vans/shuttles |
NA |
NA |
NA |
NA |
NA |
0.024 |
0.024 |
|
|
Pansing et al.(1998) |
Laguna Beach electric bus |
NA |
55 |
NA |
NA |
NA |
0.012 |
0.012 |
|
|
Pansing et al.(1998) |
Los Angeles County CNG bus replacement |
NA |
NA |
NA |
NA |
NA |
0.001 |
0.001 |
|
|
|
|
|
|
|
NA |
NA |
0.003 |
0.003 |
|
|
Pansing et al.(1998) |
Pacific Bell CNG bus replacement |
NA |
NA |
NA |
|
|
|
|
|
|
Pansing et al.(1998) |
Huntington Beach CNG bus replacement |
NA |
NA |
NA |
NA |
NA |
0.000 |
0.000 |
|
|
Pansing et al.(1998) |
Oldtimers’ Foundation CNG bus replacement |
NA |
NA |
NA |
NA |
NA |
0.000 |
0.000 |
|
|
Mean |
|
1,155 |
7,270 |
NA |
NA |
NA |
0.009 |
0.019 |
0.375 |
|
Median |
|
1,122 |
429 |
NA |
NA |
NA |
0.003 |
0.003 |
0.375 |
|
Travel term definitions: VTR = vehicle trip reduction; VMTR = vehicle miles of travel reduced; transit riders = increase in daily transit ridership. Emission term definitions: total emissions = weighted sum of HC, NOx, CO, and PM10; emission weights = importance weights representing value of individual pollutants; emission year = time period for which source study estimate applies; benefits trend indicates whether emissions are decreasing, increasing, or constant over project life. Cost-effectiveness definitions: BDF = benefits discount factor (combination of benefits trend and discount rate); annual benefits = weighted emissions * days/year * BDF; annual costs = annualized capital costs plus applicable operating, administrative, and private costs. |
|||||||||
|
|
Cost-Effectiveness |
||||||||
|
PM10 |
Total |
Emission “Year” |
Life (years) |
Benefits Trend |
Discount Rate (%) |
BDF |
Annual Benefits (tons/year) |
Annual Costs (2000 $) |
Cost/Ton (2000 $) |
|
0 |
|
|
|
|
|
|
|
|
|
|
0.012 |
0.495 |
1997 |
12 |
Constant |
5 |
0.776 |
96.1 |
652,245 |
6,788 |
|
|
0.0003 |
1997–2001 |
5 |
Constant |
5 |
0.909 |
0.1 |
8,771 |
126,396 |
|
|
0.004 |
1997–2001 |
12 |
Constant |
5 |
0.776 |
0.8 |
175,376 |
212,267 |
|
|
0.116 |
1997–2001 |
12 |
Constant |
5 |
0.776 |
22.5 |
1,107,009 |
49,121 |
|
|
0.131 |
1997–2001 |
12 |
Constant |
5 |
0.776 |
25.5 |
837,400 |
32,842 |
|
|
0.118 |
1997–2001 |
12 |
Constant |
5 |
0.776 |
23.0 |
153,888 |
6,701 |
|
|
0.059 |
1997–2001 |
12 |
Constant |
5 |
0.776 |
11.5 |
82,106 |
7,150 |
|
|
0.004 |
1997–2001 |
12 |
Constant |
5 |
0.776 |
0.8 |
338,145 |
443,233 |
|
|
0.015 |
1997–2001 |
12 |
Constant |
5 |
0.776 |
2.8 |
1,603,548 |
568,676 |
|
|
0.002 |
1997–2001 |
12 |
Constant |
5 |
0.776 |
0.4 |
219,051 |
508,045 |
|
|
0.0005 |
1997–2001 |
12 |
Constant |
5 |
0.776 |
0.1 |
51,552 |
518,499 |
|
0.012 |
0.086 |
|
|
|
|
|
16.7 |
475,372 |
225,429 |
|
0.012 |
0.015 |
|
|
|
|
|
2.8 |
219,051 |
126,396 |
TABLE E-ANNEX-14A CMAQ Project Impacts Evaluation: Project Category, Conventional Fuels; Subcategory, Replacement Buses
|
Source |
Description |
Daily Travel Impacts |
Emission Reductions (tons per day) |
||||||
|
VTR |
VMTR |
Transit Riders |
Delay Red. (hr) |
Speed Imp. (mph) |
HC |
NOx |
CO |
||
|
|
|
|
|
Emission Weights: |
1 |
4 |
0 |
||
|
CARB (1999) |
Replace pre-1991 with post-1996 buses; urban use, 15 mph, 4 g/b-hp NOx std. |
NA |
NA |
NA |
NA |
NA |
0.0001 |
0.0008 |
|
|
CARB (1999) |
Replace pre-1991 with post-1996 buses; urban use, 15 mph, 2 g/b-hp NOx std. |
NA |
NA |
NA |
NA |
NA |
0.0001 |
0.002 |
|
|
CARB (1999) |
Replace pre-1991 with post-1996 buses; commuter use, 45 mph, 4 g/b-hp NOx std. |
NA |
NA |
NA |
NA |
NA |
0.0001 |
0.002 |
|
|
MDOT (2000) |
Replace pre-1991 with post-1996 buses; commuter use, 45 mph, 2 g/b-hp NOx std. |
NA |
NA |
NA |
NA |
NA |
0.0001 |
0.003 |
|
|
Schimek (2000) |
Replace pre-1991 with post-1996 buses |
NA |
NA |
NA |
NA |
NA |
0.0001 |
0.003 |
|
|
|
Replace pre-1991 with post-1996 buses |
NA |
NA |
NA |
NA |
NA |
NA |
NA |
|
|
Mean |
|
NA |
NA |
NA |
NA |
NA |
0.0001 |
0.0021 |
NA |
|
Median |
|
NA |
NA |
NA |
NA |
NA |
0.0001 |
0.0022 |
NA |
|
Travel term definitions: VTR = vehicle trip reduction; VMTR = vehicle miles of travel reduced; transit riders = increase in daily transit ridership. Emission term definitions: total emissions = weighted sum of HC, NOx, CO, and PM10; emission weights = importance weights representing value of individual pollutants; emission year = time period for which source study estimate applies; benefits trend indicates whether emissions are decreasing, increasing, or constant over project life. Cost-effectiveness definitions: BDF = benefits discount factor (combination of benefits trend and discount rate); annual benefits = weighted emissions * days/year * BDF; annual costs = annualized capital costs plus applicable operating, administrative, and private costs. |
|||||||||
|
|
Cost-Effectiveness |
||||||||
|
PM10 |
Total |
Emission “Year” |
Life (years) |
Benefits Trend |
Discount Rate (%) |
BDF |
Annual Benefits (tons/year) |
Annual Costs (2000 $) |
Cost/Ton (2000 $) |
|
0 |
|
|
|
|
|
|
|
|
|
|
0.0001 |
0.0034 |
2000 |
12 |
Constant |
5 |
0.776 |
0.7 |
27,500 |
39,924 |
|
0.0001 |
0.0088 |
2000 |
12 |
Constant |
5 |
0.776 |
1.7 |
27,500 |
16,083 |
|
0.0001 |
0.0064 |
2000 |
12 |
Constant |
5 |
0.776 |
1.2 |
27,500 |
22,239 |
|
0.0001 |
0.0103 |
2000 |
12 |
Constant |
5 |
0.776 |
2.0 |
27,500 |
13,824 |
|
|
0.0129 |
2000 |
12 |
Constant |
5 |
0.776 |
2.5 |
27,500 |
10,952 |
|
NA |
NA |
2000 |
12 |
Constant |
5 |
0.776 |
NA |
NA |
388 |
|
0.0001 |
0.0084 |
|
|
|
|
|
1.6 |
27,500 |
17,235 |
|
0.0001 |
0.0088 |
|
|
|
|
|
1.7 |
27,500 |
14,953 |
TABLE E-ANNEX-14B CMAQ Project Impacts Evaluation: Project Category, Alternative Fuels; Subcategory, Alternative-Fuel Vehicles (Nontransit) and Refueling Facilities
|
Source |
Description |
Daily Travel Impacts |
Emission Reductions (tons per day) |
||||||
|
VTR |
VMTR |
Transit Riders |
Delay Red. (hr) |
Speed Imp. (mph) |
HC |
NOx |
CO |
||
|
|
|
|
|
Emission Weights: |
1 |
4 |
0 |
||
|
Hagler Bailly (1999) |
Fairfax County, VA, alternative fuel vehicles |
NA |
NA |
NA |
NA |
NA |
0.002 |
0.0045 |
|
|
Hagler Bailly (1999) |
Douglas County, GA, alternative fuels refueling station |
NA |
NA |
NA |
NA |
NA |
0.011 |
0.0080 |
|
|
Mean |
|
NA |
NA |
NA |
NA |
NA |
0.007 |
0.006 |
NA |
|
Median |
|
NA |
NA |
NA |
NA |
NA |
0.007 |
0.006 |
NA |
|
Travel term definitions: VTR = vehicle trip reduction; VMTR = vehicle miles of travel reduced; transit riders = increase in daily transit ridership. Emission term definitions: total emissions = weighted sum of HC, NOx, CO, and PM10; emission weights = importance weights representing value of individual pollutants; emission year = time period for which source study estimate applies; benefits trend indicates whether emissions are decreasing, increasing, or constant over project life. Cost-effectiveness definitions: BDF = benefits discount factor (combination of benefits trend and discount rate); annual benefits = weighted emissions * days/year * BDF; annual costs = annualized capital costs plus applicable operating, administrative, and private costs. |
|||||||||
|
|
Cost-Effectiveness |
||||||||
|
PM10 |
Total |
Emission “Year” |
Life (years) |
Benefits Trend |
Discount Rate (%) |
BDF |
Annual Benefits (tons/year) |
Annual Costs (2000 $) |
Cost/Ton (2000 $) |
|
0 |
|
|
|
|
|
|
|
|
|
|
|
0.020 |
2000 |
5 |
Constant |
7 |
0.877 |
4.4 |
138,391 |
31,560 |
|
|
0.043 |
2005 |
20 |
Constant |
7 |
0.567 |
6.1 |
24,164 |
3,964 |
|
NA |
0.032 |
|
|
|
|
|
5.24 |
|
17,762 |
|
NA |
0.032 |
|
|
|
|
|
5.24 |
|
17,762 |
TABLE E-ANNEX-15 CMAQ Project Impacts Evaluation: Project Category, Inspection and Maintenance
|
Source |
Description |
Daily Travel Impacts |
Emission Reductions (tons per day) |
||||||
|
VTR |
VMTR |
Transit Riders |
Delay Red. (hr) |
Speed Imp. (mph) |
HC |
NOx |
CO |
||
|
|
|
|
|
Emission Weights: |
1 |
4 |
0 |
||
|
Lachance and Mierzejewski (1998) |
Standard annual idle test (Florida) |
NA |
NA |
NA |
NA |
NA |
4.72 |
0.82 |
|
|
Lachance and Mierzejewski (1998) |
Biennial idle test (Florida) |
NA |
NA |
NA |
NA |
NA |
3.78 |
0.66 |
|
|
Lachance and Mierzejewski (1998) |
Biennial IM240 test |
NA |
NA |
NA |
NA |
NA |
7.56 |
5.99 |
|
|
Lachance and Mierzejewski (1998) |
Biennial IM240 test with pressure test |
NA |
NA |
NA |
NA |
NA |
11.98 |
5.99 |
|
|
Lachance and Mierzejewski (1998) |
Biennial accelerated simulation mode with pressure test |
NA |
NA |
NA |
NA |
NA |
9.71 |
4.20 |
|
|
Mean |
|
NA |
NA |
NA |
NA |
NA |
7.55 |
3.53 |
NA |
|
Median |
|
NA |
NA |
NA |
NA |
NA |
7.56 |
4.20 |
NA |
|
Travel term definitions: VTR = vehicle trip reduction; VMTR = vehicle miles of travel reduced; transit riders = increase in daily transit ridership. Emission term definitions: total emissions = weighted sum of HC, NOx, CO, and PM10; emission weights = importance weights representing value of individual pollutants; emission year = time period for which source study estimate applies; benefits trend indicates whether emissions are decreasing, increasing, or constant over project life. Cost-effectiveness definitions: BDF = benefits discount factor (combination of benefits trend and discount rate); annual benefits = weighted emissions * days/year * BDF; annual costs = annualized capital costs plus applicable operating, administrative, and private costs. |
|||||||||
|
|
Cost-Effectiveness |
||||||||
|
PM10 |
Total |
Emission “Year” |
Life (years) |
Benefits Trend |
Discount Rate (%) |
BDF |
Annual Benefits (tons/year) |
Annual Costs (2000 $) |
Cost/Ton (2000 $) |
|
0 |
|
|
|
|
|
|
|
|
|
|
|
7.99 |
1994 |
1 |
Constant |
NA |
1.000 |
1,996.8 |
14,119,920 |
7,071 |
|
|
6.40 |
1994 |
1 |
Constant |
NA |
1.000 |
1,599.5 |
9,302,040 |
5,816 |
|
|
31.53 |
1994 |
1 |
Constant |
NA |
1.000 |
7,881.8 |
15,202,080 |
1,929 |
|
|
35.94 |
1994 |
1 |
Constant |
NA |
1.000 |
8,985.8 |
16,237,800 |
1,807 |
|
|
26.49 |
1994 |
1 |
Constant |
NA |
1.000 |
6,621.8 |
12,113,280 |
1,829 |
|
NA |
21.67 |
|
|
|
|
|
5,417.1 |
13,395,024 |
3,690 |
|
NA |
26.49 |
|
|
|
|
|
6,621.8 |
14,119,920 |
1,929 |
TABLE E-ANNEX-16 CMAQ Project Impacts Evaluation: Project Category, Pricing; Subcategory, Subsidies and Discounts
|
Source |
Description |
Daily Travel Impacts |
Emission Reductions (tons per day) |
||||||
|
VTR |
VMTR |
Transit Riders |
Delay Red. (hr) |
Speed Imp. (mph) |
HC |
NOx |
CO |
||
|
|
|
|
|
Emission Weights: |
1 |
4 |
0 |
||
|
MWCOG (1995) |
Compatible regional fare media with discount |
45,900 |
597,500 |
57,800 |
NA |
NA |
0.614 |
0.775 |
|
|
MWCOG (1995) |
Single price transit service |
129,700 |
2,144,700 |
175,200 |
NA |
NA |
1.992 |
2.668 |
|
|
MWCOG (1995) |
Half-price feeder bus fares |
41,600 |
453,200 |
53,900 |
NA |
NA |
0.503 |
0.603 |
|
|
Pansing et al.(1998) |
Route 14 vanpool subsidy |
418 |
22,992 |
NA |
NA |
NA |
0.016 |
0.027 |
|
|
Pansing et al. (1998) |
12th District subsidy |
163 |
6,537 |
NA |
NA |
NA |
0.005 |
0.008 |
|
|
Pansing et al. (1998) |
Broadway Plaza |
254 |
5,171 |
NA |
NA |
NA |
0.0045 |
0.0064 |
|
|
Pansing et al. (1998) |
12th District taxi voucher |
77 |
1,459 |
NA |
NA |
NA |
0.0013 |
0.0018 |
|
|
Pansing et al. (1998) |
Burbank flat fare taxi |
25 |
76 |
NA |
NA |
NA |
0.0002 |
0.0001 |
|
|
MWCOG (1995) |
Free workplace parking for carpools and vanpools |
3,700 |
108,600 |
(21,700) |
NA |
NA |
0.086 |
0.130 |
|
|
MWCOG (1995) |
Regional voucher program |
172,800 |
2,388,800 |
99,200 |
NA |
NA |
2.39 |
3.07 |
|
|
MWCOG (1995) |
Mandatory employer cashout for transit/HOV |
555,300 |
7,166,500 |
(138,200) |
NA |
NA |
7.39 |
9.30 |
|
|
MWCOG (1995) |
Mandatory employer cashout for transit only |
312,600 |
3,963,300 |
340,600 |
NA |
NA |
4.12 |
5.16 |
|
|
DVRPC (1994) |
20% systemwide fare reductions |
8,275 |
144,016 |
9,696 |
NA |
NA |
0.196 |
0.262 |
1.08 |
|
DVRPC (1994) |
Promotion of $25 Transitcheck |
12,348 |
84,972 |
7,467 |
NA |
NA |
0.119 |
0.141 |
0.699 |
|
Mean |
|
91,654 |
1,220,559 |
64,885 |
NA |
NA |
1.245 |
1.583 |
0.888 |
|
Median |
|
10,312 |
126,308 |
53,900 |
NA |
NA |
0.158 |
0.202 |
0.888 |
|
Travel term definitions: VTR = vehicle trip reduction; VMTR = vehicle miles of travel reduced; transit riders = increase in daily transit ridership. Emission term definitions: total emissions = weighted sum of HC, NOx, CO, and PM10; emission weights = importance weights representing value of individual pollutants; emission year = time period for which source study estimate applies; benefits trend indicates whether emissions are decreasing, increasing, or constant over project life. |
|||||||||
|
|
Cost-Effectiveness |
||||||||
|
PM10 |
Total |
Emission “Year” |
Life (years) |
Benefits Trend |
Discount Rate (%) |
BDF |
Annual Benefits (tons/year) |
Annual Costs (2000 $) |
Cost/Ton (2000 $) |
|
0 |
|
|
|
|
|
|
|
|
|
|
0.296 |
3.71 |
1997–2001 |
1 |
NA |
NA |
1.000 |
928.2 |
5,293,200 |
5,702 |
|
1.048 |
12.67 |
1997–2001 |
1 |
NA |
NA |
1.000 |
3,166.5 |
19,007,400 |
6,003 |
|
0.225 |
2.91 |
1997–2001 |
1 |
NA |
NA |
1.000 |
728.7 |
4,863,128 |
6,674 |
|
0.011 |
0.123 |
1997–2001 |
1 |
NA |
NA |
1.000 |
30.8 |
25,829 |
838 |
|
0.003 |
0.036 |
1997–2001 |
1 |
NA |
NA |
1.000 |
8.9 |
40,285 |
4,513 |
|
0.0026 |
0.030 |
1997–2001 |
1 |
NA |
NA |
1.000 |
7.5 |
488,311 |
65,002 |
|
0.0007 |
0.009 |
1997–2001 |
1 |
NA |
NA |
1.000 |
2.1 |
139,767 |
65,347 |
|
0.0000 |
0.0008 |
1997–2001 |
1 |
NA |
NA |
1.000 |
0.2 |
89,376 |
471,012 |
|
0.054 |
0.607 |
1997–2001 |
1 |
NA |
NA |
1.000 |
151.8 |
36,210,300 |
238,500 |
|
1.18 |
14.69 |
1997–2001 |
1 |
NA |
NA |
1.000 |
3,672.3 |
400,495,061 |
109,059 |
|
3.55 |
44.60 |
1997–2001 |
1 |
NA |
NA |
1.000 |
11,150.8 |
1,459,960,800 |
130,929 |
|
1.96 |
24.75 |
1997–2001 |
1 |
NA |
NA |
1.000 |
6,186.7 |
333,229,797 |
53,862 |
|
|
1.25 |
1996 |
1 |
NA |
NA |
1.000 |
311.4 |
12,269,807 |
39,408 |
|
|
0.683 |
1996 |
1 |
NA |
NA |
1.000 |
170.8 |
4,991,535 |
29,233 |
|
0.695 |
7.576 |
|
|
|
|
|
1,894.0 |
162,650,328 |
87,577 |
|
0.139 |
0.964 |
|
|
|
|
|
241.1 |
5,142,368 |
46,635 |
|
Cost-effectiveness definitions: BDF = benefits discount factor (combination of benefits trend and discount rate); annual benefits = weighted emissions * days/year * BDF; annual costs = annualized capital costs plus applicable operating, administrative, and private costs. |
|||||||||
TABLE E-ANNEX-17 CMAQ Project Impacts Evaluation: Project Category, Pricing; Subcategory, Fees and Charges
|
Source |
Description |
Daily Travel Impacts |
Emission Reductions (tons per day) |
||||||
|
VTR |
VMTR |
Transit Riders |
Delay Red. (hr) |
Speed Imp. (mph) |
HC |
NOx |
CO |
||
|
|
|
|
|
Emission Weights: |
1 |
4 |
0 |
||
|
MWCOG (1995) |
$0.10/mile LOV congestion pricing |
18,400 |
108,600 |
6,300 |
NA |
NA |
0.167 |
0.164 |
|
|
MWCOG (1995) |
$500 annual pollution fee on gas-powered vehicles |
56,200 |
1,027,700 |
37,200 |
NA |
NA |
0.931 |
1.281 |
|
|
MWCOG (1995) |
Employee parking tax outside metro core |
154,500 |
2,063,100 |
79,000 |
NA |
NA |
2.097 |
2.666 |
|
|
MWCOG (1995) |
Employee parking tax in metro core |
147,100 |
1,954,500 |
120,500 |
NA |
NA |
1.991 |
2.528 |
|
|
MWCOG (1995) |
$0.05/mile vehicle mileage tax after first 10,000 miles |
13,600 |
266,500 |
11,400 |
NA |
NA |
0.248 |
0.353 |
|
|
Pansing et al. (1998) |
Glendale parking management |
566 |
24,228 |
NA |
NA |
NA |
0.018 |
0.028 |
|
|
Mean |
|
65,061 |
907,438 |
50,880 |
NA |
NA |
0.908 |
1.170 |
NA |
|
Median |
|
37,300 |
647,100 |
37,200 |
NA |
NA |
0.589 |
0.817 |
NA |
|
Travel term definitions: VTR = vehicle trip reduction; VMTR = vehicle miles of travel reduced; transit riders = increase in daily transit ridership. Emission term definitions: total emissions = weighted sum of HC, NOx, CO, and PM10; emission weights = importance weights representing value of individual pollutants; emission year = time period for which source study estimate applies; benefits trend indicates whether emissions are decreasing, increasing, or constant over project life. Cost-effectiveness definitions: BDF = benefits discount factor (combination of benefits trend and discount rate); annual benefits = weighted emissions * days/year * BDF; annual costs = annualized capital costs plus applicable operating, administrative, and private costs. |
|||||||||
|
|
Cost-Effectiveness |
||||||||
|
PM10 |
Total |
Emission “Year” |
Life (years) |
Benefits Trend |
Discount Rate (%) |
BDF |
Annual Benefits (tons/year) |
Annual Costs (2000 $) |
Cost/Ton (2000 $) |
|
0 |
|
|
|
|
|
|
|
|
|
|
0.054 |
0.821 |
NA |
1 |
Constant |
NA |
1.000 |
205.2 |
5,293,200 |
25,798 |
|
0.482 |
6.06 |
NA |
1 |
Constant |
NA |
1.000 |
1,514.0 |
1,203,000 |
795 |
|
1.026 |
12.76 |
NA |
1 |
Constant |
NA |
1.000 |
3,190.7 |
157,568,940 |
49,385 |
|
0.969 |
12.10 |
NA |
1 |
Constant |
NA |
1.000 |
3,025.4 |
44,847,840 |
14,824 |
|
0.142 |
1.66 |
NA |
1 |
Constant |
NA |
1.000 |
414.5 |
2,406,000 |
5,804 |
|
0.012 |
0.132 |
NA |
1 |
Constant |
NA |
1.000 |
32.9 |
105,963 |
3,217 |
|
0.447 |
5.59 |
|
|
|
|
|
1,397.1 |
35,237,491 |
16,637 |
|
0.312 |
3.86 |
|
|
|
|
|
964.3 |
3,849,600 |
10,314 |


