
3
OVERVIEW OF CMAQ PROGRAM OPERATIONS
In this chapter, an overview of the CMAQ program since its inception is provided. A description of how program funds are allocated and for what activities is first presented. An analysis of program spending trends is then provided, focusing on the types of projects funded to date and differences in project spending priorities by geographic area. Drawing from the case studies conducted by the committee (see Chapter 1), a discussion of how the program operates in five large metropolitan areas is then presented. The chapter ends with a brief summary and findings.
PROGRAM OPERATION
Funding Allocation
The CMAQ program is funded by the Highway Trust Fund, which finances federal highway and mass transportation assistance programs. As noted in Chapter 1, under the Intermodal Surface Transportation Efficiency Act (ISTEA), the 6-year, $6 billion CMAQ program represented slightly less than 4 percent of the $155 billion authorized for highways, highway safety, and mass transportation. Although CMAQ funding was increased to $8 billion during the 6-year life of the Transportation Equity Act for the 21st Century (TEA-21), total transportation authorizations also increased, so that the share represented by the CMAQ program stayed the same. CMAQ is one of the smaller federal-aid transportation programs. For example, the Surface Transportation Program (STP), which provides flexible funding for transit as well as highway projects, was authorized at $33.3 billion during the life of TEA-21 (DOT 1998). And the National Highway System program, which funds projects involving highways of national significance connecting
major population centers, was funded at $28.6 billion during the same period.
The CMAQ program is also modest when viewed from a regional perspective. For example, the Los Angeles region has some of the nation’s poorest air quality and thus qualifies for and receives the maximum apportionment of CMAQ funds.1 However, these grants represent on the order of 4 to 5 percent of annual federal funds and only 2 to 3 percent of total annual revenues coming to the Los Angeles region. Moreover, in many regions, CMAQ funds are widely disbursed over a diverse program of eligible activities.
The CMAQ program may be modest relative to other federal-aid transportation programs and to any given region’s transportation budget, but the funds are targeted to where the problems are—to those nonattainment and maintenance areas in states with the most severe ozone and carbon monoxide (CO) air quality problems.2 For example, between 1992 and 1999, the most recent year for which national data are available, six states—California, New York, Texas, New Jersey, Pennsylvania, and Illinois—received more than half of all CMAQ apportionments (see Table 3-1). California alone received about 65 percent more than the next-largest state apportionment—to New York—reflecting the severity of its air quality problems. Fourteen states accounted for about three-quarters of CMAQ obligations for the 8-year period (see Table 3-1).3
Program funds are apportioned by statute to the states each year on the basis of the severity of air quality problems and the size of
TABLE 3-1 CMAQ Fiscal Year 1992–1999 Apportionments to the 14 Largest State Recipients
|
State |
FY 1992–1999 Apportionment ($) |
Percentage of Total |
Cumulative Percentage |
|
California |
1,333,663,021 |
16.8 |
16.8 |
|
New York |
809,478,328 |
10.2 |
27.0 |
|
Texas |
688,177,010 |
8.7 |
35.7 |
|
New Jersey |
458,052,764 |
5.8 |
41.4 |
|
Pennsylvania |
452,995,651 |
5.7 |
47.1 |
|
Illinois |
394,636,727 |
5.0 |
52.1 |
|
Ohio |
325,911,956 |
4.1 |
56.2 |
|
Massachusetts |
320,496,439 |
4.0 |
60.3 |
|
Maryland |
245,089,591 |
3.1 |
63.3 |
|
Florida |
244,339,637 |
2.8 |
66.2 |
|
Michigan |
215,138,968 |
2.7 |
68.9 |
|
Connecticut |
183,116,191 |
2.3 |
71.2 |
|
Virginia |
163,119,202 |
2.1 |
73.2 |
|
Georgia |
131,472,852 |
1.7 |
74.9 |
|
Source: FHWA CMAQ database. |
|||
affected populations. More specifically, the population of each of a state’s nonattainment or maintenance areas for ozone or CO that meets the classification contained in the CAAA is multiplied by the appropriate weighting factor as listed in Table 3-2 (FHWA 1999, 4). Particulate matter (PM10) is noticeably absent as a factor in the federal apportionment formula. CMAQ funds can be spent on projects in nonattainment and maintenance areas for PM10 (FHWA 1999, 7), but the formula has not been revised to give weight to those areas in allocating the funds.4 Each state is guaranteed at least 1/2 of 1 percent of each year’s authorized CMAQ funding, regardless of whether it has any nonattainment or maintenance areas. In states without such areas, the minimum allocation may be used for
TABLE 3-2 Weighting Factors Used for CMAQ Apportionments Under TEA-21 [23 U.S.C. Title 23 Sec. 104(2)(B)]
|
Pollutant |
Classification at the Time of Annual Apportionment |
Weighting Factor |
|
Ozone or CO |
Maintenance (these areas had to be previously eligible as nonattainment areas) |
.8 |
|
Ozone |
Submarginal |
.8 |
|
|
Marginal |
1.0 |
|
|
Moderate |
1.1 |
|
|
Serious |
1.2 |
|
|
Severe |
1.3 |
|
|
Extreme |
1.4 |
|
|
CO Nonattainment (for CO only) |
1.0 |
|
Ozone and CO |
Ozone nonattainment or maintenance and CO maintenance |
1.1 × ozone factora |
|
|
Ozone nonattainment or maintenance and CO nonattainment |
1.2 × ozone factora |
|
Minimum apportionment, all states |
1/2 of 1 percent of total annual apportionment of CMAQ funds |
NA |
|
Note: NA = not applicable. a The ozone factor ranges from 0.8 to 1.4, depending on the area’s ozone designation. |
||
any eligible project under the CMAQ program or the STP (FHWA 1999, 5).5
States having designated nonattainment or maintenance areas are required to spend CMAQ funds in those areas. However, as is true of most federal grant programs, the states are under no statutory obligation to suballocate the funds according to the federal apportionment formula; a state may use its CMAQ funds in any ozone, CO, or PM10 nonattainment or maintenance area (FHWA 1999, 5). The
federal program sponsors have recommended that states consult with the affected metropolitan planning organizations (MPOs) in making these funding decisions.
The federal share for most eligible CMAQ projects is 80 percent, and up to 90 percent if the funds are used on the Interstate system. That share may be increased to 100 percent for some projects mentioned specifically in the statute.6
Eligible Activities
According to CMAQ program guidance, the primary purpose of the program is to fund projects in nonattainment and maintenance areas that are aimed at reducing transportation-related emissions (FHWA 1999, 1). The highest-priority projects are transportation control measures (TCMs) identified in applicable state implementation plans (SIPs) as critical for a state to attain and maintain the National Ambient Air Quality Standards (NAAQS) (FHWA 1999, 2). TCMs refer to both supply-side strategies designed to improve traffic management and demand-side strategies intended to manage travel demand by such means as encouraging higher vehicle occupancies; reducing trips and travel, at least during peak hours; and providing nonmotorized forms of transportation (Apogee Research, Inc. 1994, 1; Meyer 1999, 576). All projects funded under the CMAQ program must come from a conforming transportation plan and transportation improvement program (TIP) to be consistent with the requirements of the CAAA (FHWA 1999, 9).
CMAQ funds are intended primarily for new facilities, equipment, and services whose primary purpose is to reduce emissions. In many cases, serving this purpose requires capital investment in transportation infrastructure or establishment of a new demand management program (FHWA 1999, 9). For example, transit projects are
eligible, but only if they expand service (e.g., express buses) or offer cleaner vehicles (e.g., alternative-fuel buses).7 Maintenance and reconstruction projects are not eligible because they involve maintaining existing levels of highway and transit service, thus offering no progress toward reduction of emissions and improvement of ambient air quality levels (FHWA 1999, 8). Moreover, other funding sources are available for such activities.
Operating assistance can be an eligible CMAQ activity, but only when the intent is to help start up new transportation services with demonstrated potential to reduce air pollution. Most operating assistance under CMAQ is limited to 3 years (FHWA 1999, 9–10). CMAQ funding may not displace existing operating funds or be used to further subsidize operations of existing facilities or services.
In its program guidance, the Federal Highway Administration (FHWA) lists specific activities eligible for CMAQ funding. For example, with one exception—older-vehicle scrappage programs that are explicitly excluded8—the TCMs included in the CAAA (listed in Box 3-1) are appropriate activities. In addition, CMAQ funds may be used for inspection and maintenance (I&M) programs (construction of facilities, equipment purchase, and operating assistance for 3 years); alternative-fuel vehicles (purchase of publicly owned vehicles, fueling facilities, and other needed infrastructure);9 public education, marketing, and other outreach activities aimed at advertising transportation alternatives to single-occupant vehicle (SOV) travel
|
BOX 3-1. Transportation Control Measures Included in the Clean Air Act Amendments of 1990, Eligible for CMAQ Funding
|
Source: FHWA (1999, 10–11). |
(carpooling, vanpooling);10 intermodal freight facilities (capital improvements and operating assistance); projects focused on PM10 reduction;11 experimental pilot projects (projects that offer an innovative approach to emission reductions); and—under TEA-21—projects focused on the deployment of magnetic levitation transportation technology (planning, engineering, and construction) and intercity rail, including high-speed rail, projects12 (FHWA 1999, 13, 16, 18–20).
Under TEA-21, eligibility criteria have been relaxed to encourage innovative, experimental projects provided an activity can be defined as a transportation project that can reasonably be expected to result in emission reductions (FHWA 1999, 20). FHWA regulations require
that project proposals have the concurrence of the MPO, the state department of transportation (DOT), and FHWA or the Federal Transit Administration (FTA), and also be coordinated with the Environmental Protection Agency (EPA) and state and local air agencies (FHWA 1999, 20). Finally, such projects must be explicitly identified in annual reports to FHWA, and before-and-after studies are required to determine actual project impacts (FHWA 1999, 20).
CMAQ funds may be used for projects implemented cooperatively under public–private partnership arrangements. TEA-21 encourages projects initiated by the private sector or nonprofit entities, but it remains the responsibility of the cooperating public agency to apply for CMAQ funds through the metropolitan planning process and to oversee and monitor the public investment (FHWA 1999, 11–12).
As noted earlier, the CMAQ legislation explicitly prohibits construction projects that will add new capacity for SOV travel (e.g., the addition of general-purpose lanes to an existing facility or a new highway at a new location).13 Older-vehicle scrappage programs are also ineligible, as are rehabilitation and maintenance activities (as previously discussed). Finally, CMAQ funds may not be used to finance statutory mandates imposed on the private sector or nonprofit entities by the CAAA or any other federal law (e.g., phase-in of alternatively fueled vehicle fleets) (FHWA 1999, 8).
Determination of Project Eligibility
Figure 3-1 summarizes the CMAQ project selection process as envisioned by the federal program sponsors. However, as the committee’s case study results show, practices differ across the regions.
CMAQ projects can be proposed by many different organizations— counties, cities, transit operators and transportation authorities, and state DOTs (typically the local district office in a nonattainment area). Private or nonprofit sponsors must have public partners. The MPOs and state DOTs typically play major roles in determining
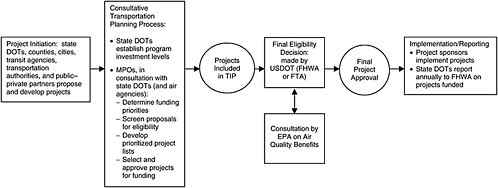
availability of CMAQ funds, establishing investment priorities, and determining recommended slates of projects. The extent of involvement of a state DOT depends on the state and on whether responsibility for managing transportation projects lies at the state or local level. At a minimum, the state DOT determines the amount of CMAQ funds available to nonattainment and maintenance areas14 and may also recommend projects in these areas. The MPO typically has lead responsibility for the prioritization, evaluation, and selection of CMAQ projects for funding.15 The MPO is also responsible for ensuring that selected projects come from or are included in a conforming transportation plan and TIP. FHWA urges state DOTs and MPOs to consult with state and local air quality agencies to develop lists of priority projects for CMAQ programming that are expected to have the greatest impact on pollution reduction (FHWA 1999, 24). In practice, however, the extent of interagency consultation varies widely, as do the approaches used for identifying and selecting appropriate projects for CMAQ funding. Final determinations of project eligibility rest with the program sponsors—FHWA or FTA, depending on the nature of the project (FHWA 1999, 23). EPA plays a consultative role in the program and may be called upon by FHWA or FTA to review the estimated pollution reduction benefits of specific projects.
HISTORY OF CMAQ PROGRAM SPENDING
Many projects are eligible for funding within the dual focus areas of the CMAQ program—air quality improvement and congestion mitigation. This section presents a summary and analysis of program expenditures, by activity, for the period for which data are available in the CMAQ database. The discussion draws heavily on an analysis of that database conducted for this study (see Appendix C).
The CMAQ database is a national database of all CMAQ-funded projects, providing information on type of project, location, funding level, and estimated emission reductions. The database currently
covers the first 8 years of the program—federal fiscal years 1992 to 1999—and is the primary source of information on project spending trends reported here. A critical assessment of the database as a source of data on project-level emission reduction estimates and costs is provided in Chapter 4.
Classification of Projects
FHWA requires the states to report annually on the amount of CMAQ funds obligated for each project financed by the program. FHWA further instructs the states to classify CMAQ projects into six categories16 and to report project-level obligations by this classification scheme:
-
Transit,
-
Other shared ride (e.g., vanpool and carpool) programs,
-
Traffic flow improvements,
-
Demand management (e.g., employer trip reduction programs),
-
Bicycle and pedestrian projects, and
-
Other projects not covered by the above categories.
States in which there are no nonattainment or maintenance areas or where funding results in less than the minimum apportionment may use a portion of their CMAQ funds for either STP- or CMAQ-eligible activities. These projects are designated as “STP/CMAQ” in the CMAQ database.
The six categories are broad and include many different types of projects. For example, projects categorized as providing traffic flow improvements range from retiming of traffic signals to construction of HOV lanes. Similarly, transit projects range from the purchase of replacement buses to the addition of parking spaces at park-and-ride lots near transit stations. For this study, FHWA’s classification scheme was expanded to add subcategories (see Table 3-3). The purpose of this expansion was not only to gain a better understanding of the specific types of projects funded by the program, but also to provide a better link with data on cost-effectiveness available in the literature.
TABLE 3-3 Expansion of CMAQ Database Project Classification Scheme
|
Project Category |
Project Subcategories |
|
Transit |
Alternative-fuel vehicles Conventional-fuel transit vehicles Park-and-ride facilities Station and bus stop improvements Transit service expansion Other transit improvements |
|
Shared ride |
Park-and-ride facilities Other shared ride |
|
Traffic flow |
Congestion and incident management HOV lanes Traffic signal improvements Turn lanes and other intersection improvements Traveler information Other traffic flow improvements |
|
Demand management |
Employee trip reduction Other demand management |
|
Bicycle and pedestrian |
No subcategories |
|
Other projects and unclassifiable |
Alternative-fuel vehicles Paving and sweeping to reduce PM Rail freight Vehicle inspection and maintenance All other improvements |
|
STP/CMAQ |
No subcategories |
Spending Trends
Figure 3-2 and Table 3-4 provide a summary of CMAQ program spending for the 8-year period from fiscal years 1992 through 1999. During this period, approximately three-quarters of CMAQ funds was obligated in two project categories—transit (44 percent) and traffic flow improvements (33 percent). Another 10 percent was obligated in three project categories—shared ride (4 percent), demand management (3 percent), and bicycle and pedestrian (3 percent). The remainder—other projects and STP/CMAQ—accounted for 8 percent and 5 percent, respectively.
The data were reanalyzed by numbers of projects within broad project categories instead of dollar value to account for the fact that
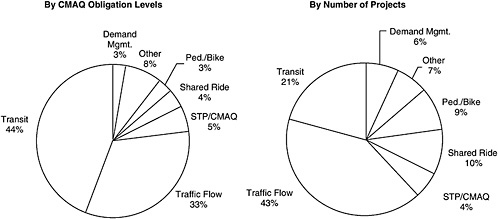
TABLE 3-4 CMAQ Obligations by Type of Project for Each Fiscal Year
|
Project Category and Subcategory |
Percentage for Fiscal Year |
Total |
|||||||
|
FY 1992 |
FY 1993 |
FY 1994 |
FY 1995 |
FY 1996 |
FY 1997 |
FY 1998 |
FY 1999 |
||
|
Transit |
|||||||||
|
Alternative-fuel vehicles |
0.3 |
6.9 |
2.9 |
3.5 |
2.6 |
4.3 |
1.5 |
1.9 |
3.1 |
|
Conventional-fuel transit vehicles |
17.8 |
11.1 |
17.1 |
15.5 |
9.5 |
9.3 |
8.7 |
14.2 |
12.7 |
|
Park-and-ride facilities |
1.4 |
2.5 |
1.5 |
1.2 |
1.3 |
0.8 |
0.7 |
2.1 |
1.5 |
|
Station and bus stop improvements |
9.4 |
3.6 |
2.3 |
4.6 |
5.4 |
4.5 |
5.2 |
5.5 |
4.8 |
|
Transit service expansions |
0.0 |
6.4 |
4.3 |
13.3 |
6.8 |
2.2 |
1.8 |
13.5 |
7.2 |
|
Other transit improvements |
20.9 |
18.1 |
12.6 |
13.1 |
14.2 |
13.1 |
15.9 |
15.4 |
14.9 |
|
Subtotal |
49.8 |
48.6 |
40.6 |
51.2 |
39.8 |
34.1 |
33.8 |
52.6 |
44.1 |
|
Traffic flow |
|||||||||
|
Congestion and incident management |
1.9 |
5.3 |
10.8 |
9.9 |
7.7 |
8.0 |
4.6 |
10.5 |
8.1 |
|
HOV lanes |
23.5 |
0.8 |
0.8 |
2.4 |
8.7 |
7.8 |
1.8 |
1.8 |
4.6 |
|
Traffic signal improvements |
5.7 |
7.4 |
9.6 |
8.5 |
12.0 |
10.7 |
8.8 |
4.7 |
8.5 |
|
Traveler information |
0.8 |
6.4 |
1.8 |
0.7 |
0.2 |
0.6 |
1.1 |
0.4 |
1.3 |
|
Turn lanes and other intersection improvements |
4.0 |
2.9 |
2.6 |
3.2 |
7.0 |
11.4 |
3.6 |
2.8 |
4.7 |
|
Other traffic flow improvements |
0.1 |
4.5 |
9.8 |
4.6 |
2.6 |
4.8 |
15.0 |
4.9 |
5.9 |
|
Subtotal |
36.0 |
27.2 |
35.3 |
29.4 |
38.2 |
43.3 |
35.0 |
25.2 |
33.1 |
|
Project Category and Subcategory |
Percentage for Fiscal Year |
Total |
|||||||
|
FY 1992 |
FY 1993 |
FY 1994 |
FY 1995 |
FY 1996 |
FY 1997 |
FY 1998 |
FY 1999 |
||
|
Shared ride |
|||||||||
|
Park-and-ride facilities |
0.8 |
1.6 |
1.1 |
3.0 |
1.2 |
1.3 |
1.0 |
0.5 |
1.4 |
|
Other shared ride |
2.1 |
4.0 |
3.1 |
2.0 |
1.6 |
1.7 |
2.7 |
2.5 |
2.4 |
|
Subtotal |
2.9 |
5.6 |
4.2 |
5.0 |
2.8 |
3.1 |
3.7 |
2.9 |
3.8 |
|
Pedestrian and bicycle |
3.0 |
3.0 |
2.2 |
1.5 |
4.0 |
4.9 |
4.4 |
2.7 |
3.2 |
|
Demand management |
|||||||||
|
Employee trip reduction |
0.0 |
0.2 |
1.1 |
0.8 |
1.8 |
0.2 |
1.2 |
0.6 |
0.8 |
|
Other demand management |
1.2 |
1.7 |
3.1 |
1.9 |
2.5 |
2.3 |
2.4 |
1.5 |
2.1 |
|
Subtotal |
1.2 |
2.0 |
4.3 |
2.7 |
4.2 |
2.4 |
3.5 |
2.1 |
2.9 |
|
STP/CMAQ |
6.6 |
6.8 |
6.3 |
3.5 |
5.2 |
6.1 |
7.9 |
3.3 |
5.4 |
|
Other projects and unclassifiable |
|||||||||
|
Alternative-fuel vehicles |
0.0 |
0.5 |
0.8 |
1.5 |
0.0 |
1.3 |
0.6 |
0.0 |
0.6 |
|
Paving and sweeping to reduce PM |
0.3 |
0.7 |
2.5 |
0.8 |
0.1 |
0.4 |
1.1 |
0.9 |
0.9 |
|
Rail freight |
0.0 |
0.5 |
0.2 |
0.9 |
0.0 |
0.8 |
0.3 |
0.1 |
0.4 |
|
Vehicle inspection and maintenance |
0.1 |
0.1 |
2.5 |
2.6 |
2.8 |
2.3 |
8.9 |
9.9 |
4.2 |
|
All other improvements |
0.1 |
4.9 |
1.1 |
0.9 |
2.9 |
1.2 |
0.8 |
0.2 |
1.5 |
|
Subtotal |
0.5 |
6.8 |
7.1 |
6.7 |
5.9 |
6.0 |
11.7 |
11.1 |
7.6 |
|
Grand total |
100.0 |
100.0 |
100.0 |
100.0 |
100.0 |
100.0 |
100.0 |
100.0 |
100.0 |
per-project obligation levels are not the same for each project category (see Figure 3-2). For example, transit projects are typically characterized by larger dollar values obligated per project; thus, they account for a smaller share of the CMAQ program when number of projects is the basis of comparison (see Figure 3-2). Nevertheless, transit and traffic flow improvements still account for nearly two-thirds of all funded CMAQ projects. Shared ride, bicycle and pedestrian, and demand management projects, which typically have smaller obligation levels per project, predictably account for a larger share of the projects—10 percent, 9 percent, and 6 percent, respectively.
An analysis of CMAQ projects by size (see Table 3-5) shows that project costs in many program categories are modest.17 For example, the median or 50th-percentile project in the pedestrian and bicycle, shared ride, and demand management categories costs near or below $200,000. Several types of traffic flow improvements were also funded at this level, although projects focused on HOV lanes and congestion and incident management tended to be larger. The median transit and rail freight projects were among the largest, with project costs in the range of $300,000 to $725,000 for transit and up to more than $1.1 million for rail freight (see Table 3-5). To provide some perspective, however, federally assisted highway rehabilitation and transit capital projects typically cost several millions of dollars.
Trends over Time
Table 3-4 shows spending by project category and subcategory for each year since the inception of the program. With few exceptions, there are large year-to-year variations in funding that exhibit no discernable trends at the national level. In fact, one of the explanations for these variations is the local nature of the program; changes in CMAQ spending are easier to observe at the state and local levels. The exception is HOV projects, which accounted for nearly
TABLE 3-5 CMAQ Project Size Analysis, Fiscal Years 1992–1999 ($)
one-quarter of all CMAQ obligations in fiscal year 1992, reflecting a large investment by California in CMAQ-funded HOV projects that year. In the following 2 years, HOV projects accounted for less than 1 percent of total CMAQ obligations, rising to 9 and 8 percent in fiscal years 1996 and 1997, respectively, but falling back to under 2 percent in fiscal years 1998 and 1999 (see Table 3-4).
The federal regulations promulgated after reauthorization of the CMAQ program under TEA-21 required that states report experimental pilot projects and public-private partnerships as separate project categories (FHWA 1999, 20). Some states were already identifying such projects. For example, six states reported 21 experimental pilot projects between fiscal years 1996 and 1999 for a total cost of $20.8 million, or less than 1 percent of program obligations during this period. Projects ranged from traffic calming (Maine), to transponder purchases for automatic toll collection (Florida), to special street sweeping activities to control PM10 and a statewide air quality education project (Alaska), to telecommuting and teleconferencing projects (Arizona), to alternative fuel and other pilot transit projects (Texas), to a golf cart transportation program (California). No further project detail is provided in the FHWA database.
Four projects were listed as public–private partnerships, all in fiscal year 1999. The projects were undertaken in two states and the District of Columbia for a total cost of $880,000. They included three public education and ozone action programs and a ferry project. Again, only cursory project detail is provided. In short, the CMAQ database offers a limited record of CMAQ spending on experimental pilot projects and public–private partnerships.
Trends by Region
Analysis of CMAQ program obligation levels by the 10 DOT regions (see Figure 3-3 and Table 3-6) reveals large variations in how CMAQ funds are obligated across the regions. For example, during fiscal years 1992 through 1999, transit projects accounted for the largest share of total CMAQ spending in Regions 1, 2, 3, 5, 9, and 10. Typically, these are regions with large metropolitan transit systems. Traffic flow improvement projects accounted for the largest share of
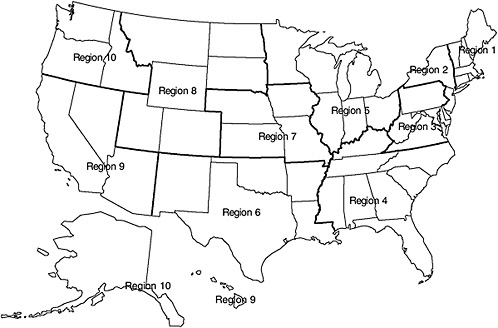
TABLE 3-6 CMAQ Obligations by Type of Project for Each Region (FY 1992–1999)
|
Project Category and Subcategory |
Percentage for Region |
Total |
|||||||||
|
1 |
2 |
3 |
4 |
5 |
6 |
7 |
8 |
9 |
10 |
||
|
Transit |
|||||||||||
|
Alternative-fuel vehicles |
1.0 |
2.0 |
1.7 |
1.6 |
4.6 |
2.6 |
0.0 |
0.3 |
5.9 |
4.1 |
3.1 |
|
Conventional-fuel transit vehicles |
9.7 |
8.7 |
26.2 |
5.6 |
13.3 |
1.3 |
9.3 |
1.6 |
19.7 |
13.1 |
12.7 |
|
Park-and-ride facilities |
4.9 |
0.4 |
2.3 |
0.0 |
3.4 |
0.5 |
0.4 |
0.0 |
0.0 |
5.2 |
1.5 |
|
Station and bus stop improvements |
9.5 |
9.4 |
1.6 |
1.9 |
8.1 |
4.1 |
0.8 |
0.4 |
1.8 |
1.9 |
4.8 |
|
Transit service expansions |
16.5 |
1.1 |
11.4 |
6.3 |
5.1 |
2.1 |
0.0 |
0.6 |
13.3 |
2.3 |
7.2 |
|
Other transit improvements |
14.7 |
25.1 |
9.2 |
9.4 |
10.0 |
11.2 |
11.6 |
1.8 |
18.3 |
20.1 |
14.9 |
|
Subtotal |
56.3 |
46.7 |
52.4 |
24.8 |
44.4 |
21.8 |
22.0 |
4.7 |
59.0 |
46.6 |
44.1 |
|
Traffic flow |
|||||||||||
|
Congestion and incident management |
3.1 |
5.9 |
4.8 |
13.7 |
7.9 |
22.8 |
9.0 |
4.6 |
6.4 |
0.8 |
8.1 |
|
HOV lanes |
3.0 |
0.5 |
0.5 |
1.4 |
0.4 |
3.9 |
0.0 |
3.6 |
16.4 |
1.2 |
4.6 |
|
Traffic signal improvements |
7.2 |
5.3 |
8.3 |
14.5 |
12.4 |
8.3 |
7.0 |
13.4 |
6.8 |
4.1 |
8.5 |
|
Traveler information |
0.4 |
3.7 |
0.6 |
3.4 |
0.3 |
2.0 |
0.0 |
0.0 |
0.2 |
0.0 |
1.3 |
|
Turn lanes and other intersection improvements |
3.5 |
5.3 |
4.4 |
12.5 |
4.5 |
8.0 |
7.4 |
3.5 |
0.8 |
0.4 |
4.7 |
|
Other traffic flow improvements |
1.8 |
4.3 |
13.4 |
6.8 |
8.3 |
12.0 |
3.6 |
1.1 |
1.7 |
3.2 |
5.9 |
|
Subtotal |
19.0 |
25.1 |
32.0 |
52.5 |
33.8 |
57.1 |
27.0 |
26.1 |
32.4 |
9.7 |
33.1 |
|
Project Category and Subcategory |
Percentage for Region |
Total |
|||||||||
|
1 |
2 |
3 |
4 |
5 |
6 |
7 |
8 |
9 |
10 |
||
|
Shared ride |
|||||||||||
|
Park-and-ride facilities |
2.0 |
0.9 |
5.4 |
0.2 |
0.6 |
1.8 |
0.5 |
2.0 |
0.3 |
1.2 |
1.4 |
|
Other shared ride |
4.4 |
1.5 |
1.8 |
3.7 |
1.9 |
2.1 |
1.7 |
6.2 |
2.1 |
2.4 |
2.4 |
|
Subtotal |
6.4 |
2.4 |
7.1 |
3.9 |
2.5 |
3.9 |
2.2 |
8.3 |
2.4 |
3.6 |
3.8 |
|
Pedestrian and bicycle |
1.7 |
4.6 |
0.6 |
2.7 |
3.3 |
2.1 |
0.1 |
4.6 |
2.3 |
18.7 |
3.2 |
|
Demand management |
|||||||||||
|
Employee trip reduction |
4.3 |
0.9 |
0.6 |
0.1 |
0.1 |
0.6 |
0.2 |
0.1 |
0.6 |
0.5 |
0.8 |
|
Other demand management |
2.4 |
4.3 |
0.9 |
3.8 |
1.6 |
1.4 |
1.0 |
1.3 |
0.7 |
4.3 |
2.1 |
|
Subtotal |
6.7 |
5.2 |
1.6 |
3.9 |
1.7 |
2.0 |
1.2 |
1.5 |
1.3 |
4.8 |
2.9 |
|
STP/CMAQ |
2.6 |
2.5 |
2.7 |
8.6 |
0.0 |
10.2 |
29.5 |
48.2 |
0.9 |
2.5 |
5.4 |
|
Other projects and unclassifiable |
|||||||||||
|
Alternative-fuel vehicles |
1.1 |
1.1 |
0.5 |
0.4 |
0.2 |
2.1 |
0.0 |
0.0 |
0.1 |
0.3 |
0.6 |
|
Paving and sweeping to reduce PM |
0.0 |
0.0 |
0.0 |
0.0 |
0.0 |
0.2 |
10.3 |
4.5 |
0.6 |
8.8 |
0.9 |
|
Rail freight |
1.2 |
1.5 |
0.0 |
0.0 |
0.1 |
0.0 |
0.0 |
0.0 |
0.0 |
0.0 |
0.4 |
|
Vehicle inspection and maintenance |
3.2 |
10.4 |
1.4 |
1.6 |
11.8 |
0.1 |
0.6 |
0.6 |
0.0 |
2.0 |
4.2 |
|
All other improvements |
1.8 |
0.6 |
1.8 |
1.6 |
2.2 |
0.4 |
7.1 |
1.5 |
0.9 |
2.9 |
1.5 |
|
Subtotal |
7.3 |
13.6 |
3.7 |
3.6 |
14.3 |
2.9 |
18.0 |
6.6 |
1.7 |
14.1 |
7.6 |
|
Grand total |
100.0 |
100.0 |
100.0 |
100.0 |
100.0 |
100.0 |
100.0 |
100.0 |
100.0 |
100.0 |
100.0 |
total CMAQ spending in several of the regions where transit spending was low, particularly Regions 4 and 6. Region 10 spent approximately 20 percent of its total CMAQ obligations on bicycle and pedestrian projects. The largest expenditure for this project type in the other regions was 5 percent. Large differences in regional spending priorities reflect the decentralized character of the program and differing local conditions.
Program Impact on Transportation Spending Priorities
The Federal Management Information System (FMIS), a financial management database developed by FHWA to track federally funded projects, was also explored as a source of information on CMAQ spending. A primary objective was to investigate whether the CMAQ program has had a measurable impact on transportation spending priorities. The primary difficulty was in separating the effects of CMAQ from those of its enabling legislation—the 1991 ISTEA—which itself brought about major changes in the use of federal transportation funds. Under ISTEA, for example, highway and transit funds could be interchanged more flexibly, and two new programs—STP and CMAQ—provided local governments with funds that could be spent on a wide range of locally determined transportation priorities. Nevertheless, a pilot study of pre- and post-ISTEA federal highway spending in the Albany, New York, nonattainment area was undertaken to explore the impacts of the introduction of the CMAQ program.18 The results showed that prior to 1991, the vast majority of funds was expended on highway projects. After 1991, the largest expenditure of funds was still on highways, but highway funds were also used to support bicycle and pedestrian, transit, and rideshare projects; CMAQ funds were dominant in the latter two project categories.
Despite the indication that CMAQ funds did play a role in supporting a more diverse set of projects in the post-ISTEA Albany area,
extending the analysis to other nonattainment areas was not considered fruitful.19 First, project detail is poor in FMIS. Thus, manual manipulation was required to group like projects together; certain CMAQ-eligible project categories, such as demand management, were simply absent from the project detail. Second, an analysis of CMAQ obligations by funding category from FMIS compared with the FHWA national CMAQ database showed a serious undercount in the former of such categories as transit, bicycle and pedestrian, HOV, and I&M projects. Finally, under TEA-21, FMIS no longer tracks data on transit projects, a major funding category of the CMAQ program. For all these reasons, it was simply not possible to obtain the data needed to separate the effects of the CMAQ program from those introduced by its much larger enabling legislation.
CASE STUDY RESULT
As discussed in Chapter 1, several in-depth case studies were undertaken in selected metropolitan areas to expand the committee’s understanding of how the CMAQ program operates at the state and local levels. State DOTs, MPOs, transit agencies, transportation authorities, cities and counties, state and local air agencies, and other selected public interest and business groups were interviewed to solicit their views concerning:
-
The air quality planning and policy context in which CMAQ program and project decisions are made;
-
Perceived program goals and objectives, including both primary and secondary objectives and likely effects of discontinuing the program;
-
Decision-making procedures for CMAQ project identification, selection, design, implementation, costs, and evaluation (e.g., effectiveness measures); and
-
Program strengths and weaknesses and suggested areas for improvement.
Five case study sites—Los Angeles; Chicago; Houston; Washington, D.C. (tristate area); and Albany—were selected to reflect a diversity of air quality problems and their severity, metropolitan area size, and growth context (see Table 3-7). Although the results cannot be generalized across all nonattainment and maintenance areas covered under the program, the case study sites include some of the largest metropolitan areas and users of CMAQ funds. Indeed, these five metropolitan areas alone account for slightly more than one-third of total current CMAQ obligations. Moreover, four of these metropolitan areas are among the nation’s 12 largest (FHWA and FTA 2000, 6); the exception is Albany, which was selected to help understand how the program operates in a smaller metropolitan area. A copy of the questionnaire used for the case studies and summaries of each of the associated site visits are presented in Appendix D.
TABLE 3-7 Criteria for Selection of Case Study Sites
The operational aspects of the program (its context and decision-making procedures) as viewed by those interviewed in the five site visits are discussed in this chapter. Evaluative comments are provided in Chapter 4.
Air Quality Context
As noted earlier, CMAQ funds are targeted to areas with ozone and CO pollution problems. Not surprisingly, in those case study sites with serious air quality problems, the CMAQ program is viewed as an important element in maintaining conformity with the NAAQS and SIP budget targets. For example, when the Washington, D.C., area is in danger of exceeding its SIP mobile source emissions budget, TCMs from an areawide agreed-upon list are implemented; Northern Virginia and the District of Columbia use CMAQ funds for these projects.20
In updating conformity estimates, some nonattainment areas account for the travel- and pollution-reducing effects [e.g., reductions in trips or in vehicle-miles traveled (VMT)] of CMAQ-funded TCMs through modeling. When the effects are too small to be identified by a regional model, the projected emission reductions are often quantified for a conformity determination using “off-model” calculations. Travel effects are estimated (e.g., projected changes in vehicle speeds, trips, or VMT), and emission factors from the MOBILE model, or the EMFAC model in California, are then used to estimate emission reductions. Some regions take a further step and include CMAQ-funded TCMs in the nonattainment area’s SIP. Typically, TCMs are incorporated in the SIP for credit only when the funds have been fully committed and project implementation is certain.
CMAQ-eligible projects differ widely in their potential for reducing emissions, and hence the amount of credit that can be taken for them. For example, northeastern Illinois was able to take an approximately 30-ton-per-day credit in its 1999 Rate of Progress plan for a CMAQ-funded enhanced I&M program in the Chicago area. By comparison, other CMAQ-funded TCMs for the area, which summed to
several hundred projects over several years, provided only an additional 2-tons-per-day credit. The total SIP mobile source emissions budget for the area is 200 tons per day. Nevertheless, the additional 2 tons per day may be sufficient to put a region over the conformity threshold. As the Chicago case study illustrates, although the amount of emissions reduced by an individual CMAQ-funded project may be small, a group of such projects may be sufficient to help keep an area in conformity and within the targets of SIP emission budgets.
As discussed earlier, the type of air quality problem in a region can affect the selection of projects for CMAQ funding. For example, the Houston–Galveston metropolitan area is designated a severe nonattainment area for ozone. The area must pay particular attention to reducing NOx (the region previously received an NOx waiver), so that many grade separation projects that were previously candidates for CMAQ funding are no longer desirable from an air quality perspective; elimination of bottlenecks increases vehicle speeds and thus NOx emissions.
In an area such as Albany without a serious air quality problem— the area is a marginal nonattainment area for ozone—meeting conformity requirements is not as important a consideration in the selection of projects for CMAQ funding. Improved air quality, for example, is not an explicit criterion for project selection. That having been said, CMAQ-funded projects support the goals of the area’s long-range plan, which are compatible with clean air.
Decision-Making Procedures
From a federal perspective, CMAQ is a highly decentralized program; decision making is devolved to state and local governments. From a local perspective, CMAQ is a state program. The states certainly play an important role in the program. They control the way CMAQ funds are suballocated, subject to the restriction, of course, that the funds must be spent within nonattainment and maintenance areas. States are also accountable for how CMAQ funds are spent and must report annually to FHWA on project obligations and estimated emission reductions. States may also reserve a portion of the funds for special projects. For example, the New York State DOT reserved $30 million of the state’s CMAQ apportionments of $129 million and
$138 million in fiscal years 1998 and 1999, respectively, for high-speed rail projects in nonattainment areas throughout the state.
State involvement in the program at the local level differs by state. In all the case study sites, the state DOT, usually the local district office, nominates projects for CMAQ funding, as do many other local agencies. Typically, the area MPO has the lead responsibility for developing a consensus list of projects for funding and programming.21 However, in two of the five case study sites—Houston and Washington, D.C. (Maryland)—the state DOTs take a more proactive role in the program at the local level. For example, the Texas DOT (TxDOT) plays a major role in the management and administration of CMAQ funds in Houston. Once projects have been selected and programmed for CMAQ funding in the TIP, TxDOT allocates the funds to its Houston District Office, which then lets the contracts for individual projects and administers the program locally, with the exception of transit projects.22 In Maryland, responsibility for highways and mass transit rests with the state. The Maryland DOT (MDOT) has primary responsibility for the CMAQ program. After reviewing the input of county staff and elected officials, MDOT makes the final project programming and funding decisions.
One notable difference among the case study sites is the extent to which special consideration is given to the identification and selection of projects for CMAQ funding. For example, the Chicago Area Transportation Study (CATS), the MPO for the area, puts out a regional call for projects for CMAQ each year, distributes the notification widely, and provides staff support to those who need assistance in preparing project proposals.23 In the Washington, D.C.,
metropolitan area, Northern Virginia has a special call for projects for the CMAQ program, but there is no regionwide call. In the Los Angeles region, where responsibility for selecting and programming CMAQ funds has been devolved to the counties, Ventura, Riverside, and San Bernardino counties have separate processes for soliciting CMAQ project proposals. In some cases, the process is open to the full range of CMAQ-eligible projects. In others, proposals are restricted to certain categories of projects that have been preselected by the lead agency as particularly effective in addressing the specific pollution problems of the area.24 Finally, in other regions, no distinction is made between CMAQ and other transportation improvement programs; nomination and selection of projects are handled as part of the regular TIP process. The decision about which funds to use frequently comes after project selection. (Of course, pollution problems are so severe in many of these regions that effects on emission levels and air quality are considered in evaluating all transportation projects for inclusion in the TIP.) In all cases, the flexibility offered by CMAQ funds—which can be used for a broad range of activities, in contrast to the funds provided by many other transportation programs, which are restricted to specific programmatic uses—makes them highly desirable to local governments.
The breadth of participation by government agencies and nongovernmental groups in the CMAQ program differs widely across the case study sites, making generalizations difficult. Those regions that make a special effort to notify potential applicants of the availability of CMAQ funds, hold technical workshops, and provide staff support to assist with proposal preparation generally have a broad range of project sponsors. This approach can provide an opportunity for nonprofit groups to become involved at an early stage in the process, but the extent of their involvement also depends on how well they are organized and what staff resources they have available to devote to the program. In the Chicago region, for example, several well-organized and -funded area interest groups formed an environmental
coalition that was instrumental in helping to shape the development of the CMAQ program, including the development of project evaluation criteria.25 In most case study sites, the air agencies have been neither consulted nor heavily involved in the development or evaluation of CMAQ projects, despite federal guidance encouraging this type of interaction.26
Another notable difference among the case study sites is the presence (or absence) of procedures for ranking and evaluating CMAQ projects and the rigor of this process. Several regions have developed a separate process for evaluating candidate CMAQ proposals, with explicit criteria for ranking projects by cost-effectiveness of expected trip, travel, and emission reductions.27 Typically projects are scored within categories; for example, bicycle projects are evaluated separately from transit projects.28 Most of those interviewed believe this is the fairest way of comparing projects. The idea is to identify and select the most cost-effective projects within each category. Of course, the amount of funding allocated to each project category is not determined on the basis of technical merit alone; practical considerations, such as project readiness, and political factors, such as geographic distribution of projects, also come into play. Secondary factors, such as mobility, economic development, safety, and community livability, are sometimes considered in project selection, frequently as tie breakers for projects that rank equivalently.
|
25 |
Coalition members include the American Lung Association, Business and Professional People in the Public Interest, the Sierra Club, the Center for Neighborhood Technology, and the Chicagoland Bicycle Federation. |
|
26 |
Notable exceptions are Ventura County and its air district (already discussed); the San Bernardino Associated Governments and one of its air districts; and the Chicago region, where the Illinois EPA is part of the CATS CMAQ project selection team. |
|
27 |
See the discussion of the Chicago, Houston, and Los Angeles site visits in Appendix D for examples of such criteria and ranking systems. |
|
28 |
The Riverside County Transportation Commission (RCTC) and the San Bernardino Associated Governments (SANBAG) in the Los Angeles area are an exception. They have adopted scoring systems that rank all proposed projects on similar criteria. In both cases, however, projects have been selected outside of the ranking process. From time to time, SANBAG has funded some transit projects that have not ranked high on their cost-effectiveness criteria. The RCTC has set aside a certain share of CMAQ funds for ready-to-obligate projects, specifically HOV projects. |
The extent of federal oversight of determinations of project eligibility depends largely on the projects involved. For example, certain bottleneck removal projects received close scrutiny by FHWA division offices to ensure that they did not conflict with the program’s prohibition against projects to provide new highway capacity. Some regions—Chicago is a good example—have memorandums of understanding with FHWA, FTA, and EPA regarding project eligibility determination that provide preclearance for certain categories of projects (e.g., TCMs and other projects directly focused on CAAA requirements in an EPA-approved SIP), thus streamlining the review process.
As noted earlier, at a minimum, all regions that receive CMAQ funds are required by FHWA to report annually on the cost and emission reduction potential of all funded projects, information that is then collected in the national CMAQ database. The area MPO often takes the lead in this activity in a region. The state is responsible for combining all the regional data and reporting the state summary to FHWA. With some exceptions, most of those interviewed noted that little guidance is provided about appropriate methods for evaluating projects, particularly those that involve behavioral as well as environmental effects.29 Hence methods vary widely from “back-of-the-envelope” to modeled estimates, depending on the technical sophistication of the agency and the complexity of the project.
Few retrospective analyses of projects are conducted to determine whether estimated changes in travel behavior and emission benefits have actually occurred. Local agency staff cite the small size and large numbers of projects as a deterrent to conducting such evaluations cost-effectively. Nor is it easy to conduct such evaluations in a methodologically sound way.
|
29 |
One exception is California, where the California Air Resources Board (ARB) has developed a methods handbook in cooperation with the California DOT for evaluating the cost-effectiveness of several of the most widely implemented transportation-related projects funded by the CMAQ and Motor Vehicle Registration Fee programs. The most recent edition (ARB 1999) can be accessed on the ARB website at www.arb.ca.gov. FHWA has also recently published a sampling of emission analysis techniques for a wide range of TCMs that represents an attempt to match methods and modeling tools with specific project categories (Louis Berger Associates 2000). This report can be found on the FHWA website at www.fhwa.dot.gov/environment. |
SUMMARY AND FINDINGS
CMAQ is a modest program relative to many other federal-aid highway and mass transportation programs, and also as a share of regional transportation budgets. However, the funds are well targeted to regions with the most serious ozone and CO air quality problems. That having been said, large differences in regional spending priorities are evident, reflecting the decentralized nature of the program and differing local conditions. In the spirit of ISTEA, the CMAQ program allows spending for a diverse range of eligible activities and provides regions with considerable latitude in determining spending priorities and selecting appropriate projects.
The highest funding priority is given to TCMs identified in area SIPs; the TCMs included in the CAAA, except for vehicle scrappage programs, are eligible spending categories. CMAQ funds are intended primarily for new facilities, equipment, and services—with limited funding for operations—to generate new sources of emission reductions. The CMAQ legislation explicitly prohibits construction projects that add new capacity for SOV travel.
An analysis of program obligations for the first 8 program years drawn from FHWA’s CMAQ database reveals that funding has been concentrated in two relatively traditional areas: transit and traffic flow improvements accounted for approximately three-quarters of CMAQ obligations during fiscal years 1992 through 1999. This pattern holds whether numbers or dollar values of projects are considered, although the former perspective reduces spending on these two categories to nearly two-thirds of the total. These spending categories are broad, however, and include nontraditional projects (e.g., alternatively fueled transit buses, intelligent transportation systems, suburban transit services), as well as more traditional activities.
An analysis of CMAQ spending trends at the national level reveals large year-to-year variations. An effort was made to determine whether the CMAQ program had resulted in any change in transportation funding priorities, but the lack of sufficiently detailed pre- and post-ISTEA data and the difficulty of separating the effects of the CMAQ program from the larger changes in funding arrangements that were ushered in with ISTEA made it impossible to pursue this line of analysis. Not unexpectedly, large variations were evident in the way
CMAQ funds are obligated in different geographic areas. For example, spending on transit dominates in regions with large metropolitan transit systems.
Results from the committee’s five in-depth case studies—four in large metropolitan areas with serious air quality problems and high usage of CMAQ funds—reveal that the program is viewed as an important funding source to help nonattainment areas comply with conformity requirements. Individual projects, particularly TCMs, often have small effects on emissions, but as a package, a program of CMAQ projects can help keep a region in conformity and within SIP emission budgets.
CMAQ projects are proposed by a range of public agencies that include cities, counties, transit agencies, transportation authorities, and state DOTs through their local district offices. The MPOs typically take the lead in helping to develop a consensus list of projects for funding and programming. The extent of the state’s involvement depends on historical arrangements, as well as the degree of state control over transportation programming and funding. Despite the federal exhortation for state DOTs and MPOs to consult with state and local air agencies in identifying CMAQ projects with high potential for emission reductions, with few exceptions the role of the air agencies, at least in the case study sites, has been limited.
One notable difference among the case study sites is the extent to which regions give special consideration to the identification and selection of projects for CMAQ funding. Some areas have a separate call for CMAQ projects, advertise widely, and provide staff support to encourage project proposals. At the other extreme, some regions treat CMAQ projects like any other transportation improvement projects; they are all handled through the normal TIP process. Sometimes funding choices are made after the projects have been selected. In all cases, CMAQ funds are highly valued by local governments because, in contrast with many transportation programs in which funds are restricted to specific programmatic areas, CMAQ funds can be used for a broad range of activities within certain eligibility requirements.
Several of the regions visited for the case studies have separate processes for evaluating and ranking candidate CMAQ projects,
which range from applying multiple criteria and weighting schemes to using more general criteria. With a few exceptions, the norm is to compare projects within rather than across project categories to reflect inherent differences in project types. At a minimum, all regions that receive CMAQ funding must attempt to estimate the emission effects of individual projects. The state compiles the regional results and reports them to FHWA for inclusion in the national database. Again with some exceptions, most areas visited noted a lack of guidance on how to quantify these effects. Highly limited postimplementation evaluations of projects are conducted because of the cost involved (given the large numbers of relatively small projects) and, in some cases, the methodological complexity of undertaking such studies. The focus of this chapter has been on providing an overview of the CMAQ program and how it currently operates in a selected group of metropolitan areas. The next chapter concentrates on an assessment of the program and the projects it funds.
REFERENCES
Abbreviations
ARB California Air Resources Board
DOT U.S. Department of Transportation
FHWA Federal Highway Administration
FTA Federal Transit Administration
Apogee Research, Inc. 1994. Costs and Effectiveness of Transportation Control Measures (TCMs): A Review and Analysis of the Literature. Bethesda, Md., Jan.
ARB. 1999. Methods to Find the Cost-Effectiveness of Funding Air Quality Projects. 1999 Edition, Final Draft.
DOT. 1998. A Summary: Transportation Equity Act for the 21st Century. July 15.
Federal Register. 2002. High-Speed Rail Projects for the Congestion Mitigation and Air Quality Improvement Program (CMAQ). Vol. 67, No. 11, Jan. 16, pp. 2278–2281.
FHWA. 1999. The Congestion Mitigation and Air Quality Improvement (CMAQ) Program Under the Transportation Equity Act for the 21st Century (TEA-21): Program Guidance. U.S. Department of Transportation, April.
FHWA and FTA. 2000. The Congestion Mitigation and Air Quality Improvement Program. FHWA-EP-00-020, U.S. Department of Transportation.
Kienitz, R. 1997. Testimony Regarding Reauthorization of Transportation-Related Air Quality Improvement Programs, Hearing (105-28) Before the Subcommittee on Health and Environment of the Committee on Commerce, House of Representatives, 105th Congress, 1st Session, June 18, pp. 37–42.
Louis Berger Associates. 2000. A Sampling of Emissions Analysis Techniques for Transportation Control Measures. Final Report. Cambridge Systematics, Inc. for FHWA, U.S. Department of Transportation. Oct.
Meyer, M. D. 1999. Demand Management as an Element of Transportation Policy: Using Carrots and Sticks to Influence Travel Behavior. Transportation Research A, Vol. 33A, No. 7/8, Sept./Nov., pp. 575–599.
Nichols, M. D. 1996. Testimony Regarding Reauthorization of the Intermodal Surface Transportation Efficiency Act of 1991 (ISTEA), Hearings (104-77) Before the Subcommittee on Surface Transportation of the Committee on Transportation and Infrastructure, House of Representatives, 104th Congress, 2nd Session, Vol. III, Sept. 26, pp. 130–159.
Schrank, D., and T. Lomax. 2001. The 2001 Urban Mobility Report. Texas Transportation Institute, The Texas A&M University System, May. http://mobility.tamu.edu.


