
5
Policies and Experiences in Two States
As stated earlier, one objective for the workshop was to hear firsthand accounts about states’ policies and experiences with providing accommodations and reporting results for accommodated test takers. This chapter summarizes the presentations made by Phyllis Stolp, director of development and administration for Texas, and Scott Trimble, director of assessment for Kentucky. Stolp’s discussion provides an overview of Texas’ statewide assessments and accommodation and reporting policies. Trimble provided similar information about Kentucky’s assessment programs and policies and also presented some of the assessment results. He focused on comparisons of performance for the general population and students with disabilities who used accommodations and those who did not.
POLICIES IN TEXAS
Phyllis Stolp began by summarizing the testing programs in place in Texas. She described three components of the state assessment program, all tied to the mandatory statewide curriculum called Texas Essential Knowledge and Skills (TEKS). The first component, Texas Assessment of Academic Skills (TAAS), is the primary statewide accountability assessment that has been in place since 1990. The test is intended for students enrolled in grades three through eight and includes an exit-level component. The state requires satisfactory performance on the TAAS exit-level tests for high school graduation. TAAS assesses students in reading, writing, math-
ematics, science, and social studies. A Spanish version of TAAS is available for students in grades three through six.
The second component of the assessment program, which has been in place since 2000, is called the Reading Proficiency Tests in English (RPTE). These tests are designed to be used with English-language learners to monitor their progress in learning to read and understand English. The tests contain reading selections and test questions divided into three levels of reading proficiency levels (beginning, intermediate, and advanced). English-language learners in grades three through twelve are required to take the RPTE until they achieve the advanced-level rating.
The State-Developed Alternative Assessment (SDAA), designed for special education students in grades three through eight, is the third component of the assessment system. Comprising tests in reading, writing, and mathematics, the SDAA is intended for students with disabilities who receive instruction in the state curriculum but for whom TAAS is an inappropriate measure of their academic progress, even when allowable accommodations are provided. The baseline year for the SDAA was 2000.
Stolp next described Texas’ accommodation policies. Accommodation decisions are made on an individual basis, and they take into consideration the student’s individual needs and the modifications students routinely receive in classroom instruction. Accommodations are available to all students in Texas, including general education students. For students receiving special education services, all accommodations must be documented in the student’s IEP. Accommodations must also be documented for the students served under Section 504 of the Rehabilitation Act of 1973. General education students can receive accommodations as provided to them in the classroom; for these students documentation is not required. The “bottom line” criterion, however, is that the accommodation should not cause test results to be invalid.
Stolp noted that allowable and nonallowable accommodations differ for the various assessment programs. For TAAS, allowable accommodations include oral administration in mathematics, social studies, and science; large-print and Braille test booklets; individual administration; dictating or typewriting responses to the writing test; recording answers on the test booklet; and orally responding to test items. Nonallowable accommodations include reading assistance on the writing and reading tests, use of a calculator or slide rule, use of English-language or foreign-language reference materials, and translation of test items. Additional information and
lists of allowable accommodations for the RPTE and SDAA are available on the state’s webpage (http://www.tea.state.tx.us/student.assessment).
The state has additional requirements and maintains records for three types of accommodations—oral administration, large print, and Braille. The state has strict criteria regarding which students may use oral administration. Oral administration is offered only for the mathematics, social studies, and sciences tests, not for reading and writing, and is available only to students who receive special education services or who have a Section 504 plan. The state also collects additional information when large-print test booklets and Braille versions are used. Large print is available for all of the state’s tests. Braille is available for TAAS and for most of the SDAA.
Stolp indicated that statewide, regional, district, and student test results are reported for each assessment program for each administration. Results for students using allowable accommodations are aggregated with the test results for all students. Results are disaggregated by language status (limited English proficient versus non-English proficient) and by special education status.
POLICIES IN KENTUCKY
Trimble provided the historical context for Kentucky’s inclusion and accommodation practices. Although the Kentucky Educational Reform Act (KERA) was passed in 1990, the state’s policies for including students with disabilities in assessment programs had been in place for some time. From 1978 through 1990, students with disabilities could be tested and accommodated in whatever way was needed; they could be excluded from testing or tested off level (take a form of the assessment intended for an earlier grade level). However, the state’s policy was to exclude results for students with disabilities in reported data. In part this policy stemmed from the fact that before 1990 the purpose for testing was primarily to monitor instruction. After 1990 and with the passage of KERA, the purpose of testing was expanded to acknowledge its role in “shaping” instruction. Furthermore, state policy makers realized that accountability systems (and public reporting of assessment data) have an effect on instruction only for those who are included in the system (and the public reports), and they implemented inclusive assessment and accountability policies to ensure that the benefits of education reform were extended to all of Kentucky’s students.
Trimble said that, based on current data, the percentage of Kentucky’s
population of elementary and middle school children considered to have a disability is between 12 and 13 percent. This figure has changed over time and was about 8 percent in 1993. Trimble commented that it is impossible to know if there really are more students with disabilities in the state or if the increased efforts to identify and serve children with disabilities have resulted in more students with disabilities being identified.
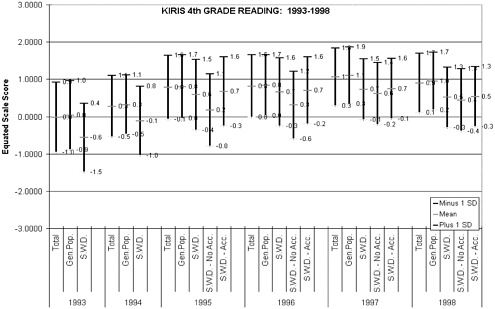
Trimble provided some examples of the types of data reported for Kentucky’s various tests. For the statewide assessment, Kentucky Instructional Results Information System (KIRIS), the reports summarize performance for the total group of test takers; they then separate the total group into students without disabilities (the “general population”) and students with disabilities. The results for students with disabilities are further disaggregated for those who received accommodations and those who did not. Performance is summarized with bands that display the range of scores one standard deviation below the mean to one standard deviation above the mean. These results are compiled over time to portray performance trends for KIRIS. Trimble presented results for the fourth grade reading and science assessments, and an example appears in Figure 5–1.
In fourth grade reading, students with disabilities tended to score lower than the general population in all years but two (1995 and 1996); in those two years students with and without disabilities performed similarly. In addition, nonaccommodated students tended to perform less well than accommodated students except in 1997 and 1998 when the two groups performed similarly.
In fourth grade science, students who took the test without accommodations scored lower than the general population in all years except 1995 when they scored similarly. As with reading, nonaccommodated students tended to perform less well than students who received accommodations. In 1995, accommodated students with disabilities actually slightly outscored the general population.
Trimble discussed results for another of Kentucky’s statewide assessment programs, the Kentucky Core Content Test (KCCT). He showed examples of KCCT reports for three years (1999–2001) for fourth grade reading and science. These reports summarized performance with the same sorts of bands used for KIRIS results. Results are reported for a variety of population groups including gender, racial/ethnic, limited English, and students with disabilities. As with the KIRIS data, this latter category is further disaggregated into those who used accommodations and those who
did not. A sample report for the 2001 reading assessment appears in Figure 5–2.
Results for both subject areas and all three years showed that fourth graders with disabilities who used accommodations performed similarly to fourth graders with disabilities who took the test without accommodations, although there was more variability in the latter group. Regardless of the conditions for administration, students with disabilities did not perform as well as those without disabilities.
Trimble presented tables for the same three-year period (1999–2001) for the KCCT reading test in grades four, seven, and ten and the KCCT science test in grades four, seven, and eleven. These reports contrasted means for the total population with means for four groups (general population, students with disabilities, students with disabilities who received accommodations, and students with disabilities who did not receive accommodations). A sample of one of these tables for fourth grade reading appears in Figure 5–3.
Over the three-year period, the students with disabilities who received accommodations outperformed their nonaccommodated counterparts by 3 to 5 points in fourth grade reading. In seventh grade reading, the nonaccommodated students slightly outscored the accommodated students by 3 to 6 points over the three-year period. For tenth grade reading, the nonaccommodated students also outperformed the accommodated students, and the differences were quite a bit larger (from 10 to 15 points) over the three years.
Similar patterns were evident in science over the three-year period. Fourth graders with disabilities who received accommodations scored 3 to 5 points higher than those who did not receive accommodations. In seventh grade, nonaccommodated test takers scored higher than accommodated test takers by 4 to 6 points; and in eleventh grade, the difference was 11 to 13 points over the three years.
Finally, Trimble compared results for accommodated and nonaccommodated test takers on the KCCT with similar data from the Comprehensive Test of Basic Skills (CTBS) and NAEP, noting that these are the sorts of comparisons that may soon be required by law. On the CTBS, students with disabilities in Kentucky who took the test without accommodations attained overall mean scores that were higher than for those who received accommodations. This finding was consistent across the grade levels (third, sixth, and ninth). On NAEP’s mathematics and science assessments in 2000, mean scaled scores were identical for Kentucky’s fourth graders with
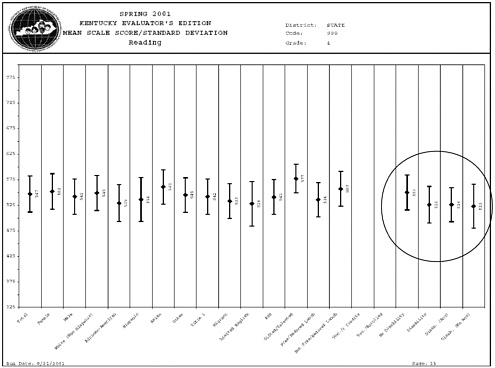
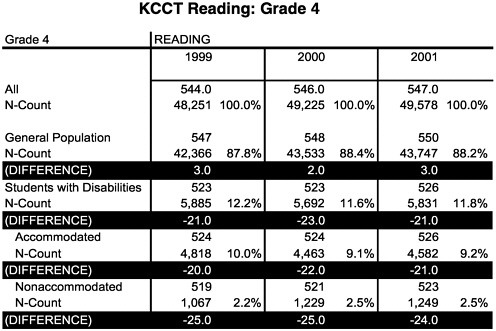
FIGURE 5–3 Differences in Mean Performance Between the General Population and Students with Disabilities on Kentucky’s Core Content Test (KCCT) in Grade 4 Reading.
disabilities who received accommodations on NAEP and those who did not receive accommodations. On the other hand, the means in mathematics and science for Kentucky’s eighth graders with disabilities who were not accommodated on NAEP were slightly higher (by 2 scale score points) than for those who were accommodated. Trimble concluded that these results show that performance on the KCCT and NAEP appears to be reasonably consistent.


