
a Markov chain probabilistic structure is affixed to the various user-supplied actions—arcs in the graphical model—that result in transitions from one node to the nodes that are linked to it. These (conditional) probabilities indicate which transitions from a given node are more or less likely based on the actions of a given type of user. These transition probabilities can govern a random drawing that is used to select paths through the graphical model for purposes of testing by selecting subsequent arcs, proceeding from one node to another. By selecting the test inputs in this way, the paths that are more frequently utilized by a user are chosen for testing with higher probability. Therefore, errors that are associated with the more frequent-use scenarios are more likely to be discovered and eliminated. An extremely important benefit of this testing is that long-run characteristics of system performance can be estimated based on well-understood properties of Markov chains. One such property is the expected length of the chain; by augmenting specific nodes with anticipated completion times and creating a continuous-time Markov chain, expected completion times with respect to all possible paths could be generated.
In his capstone discussion on the first day of the workshop, Mark Pierzchala listed three conclusions, with which we are in full agreement. First, the merits of model-based testing warrant further investigation by the survey community; it and other strategies for automated testing should be reviewed for their applicability. Second, implementing automated testing will be difficult given its novelty in the survey field; however, that difficulty does not outweigh the need for more rigorous testing than near-exclusive dependence on manual testing permits. Finally, a comprehensive CAPI test suite must always include checks of screen interface, usability, grammar, and other human interface features that are not amenable to automated testing.
DEALING WITH COMPLEXITY: BROADENING THE CONCEPT OF DOCUMENTATION
In designing the workshop, we asked Thomas Piazza and Jelke Bethlehem—the leading experts on the two existing (and evolving) systems for automated documentation of CAPI instruments, IDOC and TADEQ—to describe their programs and their approaches. To complement those talks, Thomas McCabe described research and tools to quantitatively measure the complexity of computer code and to visualize the internal logic of code. The IDOC and TADEQ talks centered on documentation in what is closer to the traditional sense of the word—a guide to the survey that can be handed or shown to users to give them an impression of what data are being collected and how specifically they
are elicited. In comparison, McCabe’s presentation is an invitation to view documentation more broadly, applying mathematical concepts of complexity in survey work, in ways that could ultimately become very important tools throughout the survey design process.
A first step in assessing complexity is to visualize computer code as a directed graph (flowgraph), wherein statements, decision points, and other pieces of code are designated as nodes and the links between them are edges (this graph of the functioning of the software is a much more code-dependent and detailed representation of the functioning of a software system than the graphical model that underlies model-based testing, described earlier). Having parsed the code as a graph, these flow-graphs may be plotted, and the resulting pictures may be extremely useful in directly seeing whether the logic underlying the code is clear or convoluted. More importantly, as McCabe has done, tools from mathematical graph theory can be applied to calculate natural metrics that objectively measure the complexity of the code.
At the workshop, McCabe focused on two such metrics. The first, cyclomatic complexity (v), is a measure of the logical complexity of a module (or a system). It can be computed by several methods, as illustrated in the proceedings, and it is defined as the number of basis paths in the graph. The set of basis paths is the minimum set of paths through the graph that—taken in combination with each other—can generate the complete set of individual paths. Accordingly, cyclomatic complexity is a benchmark of inherent complexity of the graph; it indicates the minimum number of separate tests that would be needed to cover all edges of the graph (or all the transitions in the software).
Essential complexity (ev) is a second metric that measures the degree of unstructuredness of software. Roughly speaking, essential complexity simplifies the flowgraph by fusing nodes that represent primitive (and well defined) logical structures; the collection of nodes that define a complete loop that executes while a certain condition is met may be replaced by a single node, for instance. Essential complexity is then calculated as the cyclomatic complexity of the resulting reduced graph. The quantity ev is bounded by 1 (perfectly structured, in that it can cleanly be resolved into well-defined logical modules) and v (perfectly unstructured, when no simplification is possible).
McCabe has developed many other metrics that could not be described at the workshop due to time constraints, among them a measure of the degree to which statements within modules make use of external data from other modules (thus indicating the success of the modularity of software design). Implemented for CAPI instruments, this metric would indicate how often edits within a given module make use of information collected in other modules.
There is great power in having an objective measure of complexity, and awareness of complexity throughout the survey/software design process could be a most useful diagnostic tool. Were it possible to conceive of a “first cut” measure of complexity that could be derived quickly and inexpensively from early specifications, those specifications and requirements could be reevaluated and solidified more quickly than is currently the case. Measuring the complexity of individual modules as the project moves along in increments would be a useful feedback mechanism, warning questionnaire designers of possible problem areas and urging the simplification of instrument routines. It is also reasonable to expect that complexity measures, in time, could prove to be a useful tool in budgeting and planning new CAPI instruments, since it may be possible to estimate the relationship between programmer/tester effort and expected levels of complexity.
Develop Prototype Complexity Measures for Existing Surveys
The software tools developed by McCabe and his former company act as parsers for a series of common languages, processing code and extracting the flowgraph and complexity measures. Of course, no premade software generates such measures for CASES or Blaise instruments, since those languages—being confined to the survey research arena—have a relatively small user base. However, it would be worthwhile for the survey research community to investigate the possibility of calculating McCabe-type metrics on existing CAPI instruments.
It should be noted that both of the existing automated documentation packages, IDOC and TADEQ, do generate what could be the raw materials for a complexity assessment, by resolving each questionnaire element into a node. Indeed, the prototype TADEQ software does offer the option to draw flowcharts of instruments. Trying to incorporate complexity measures into the existing TADEQ structure or converting CAPI instruments into an intermediate format that could be read by a McCabe-type parser could be the most promising ways to see how complexity measures work with existing survey code.
Develop Measures of Operational Complexity
Interpreting complexity as a mathematical construct offers a new way of thinking about and characterizing an instrument. But comments made at the workshop also suggest intriguing opportunities to build on the idea of complexity by constructing measures of what might be called “operational complexity.”
Several workshop speakers and participants made remarks about the usefulness of trying to determine modal or characteristic paths through a questionnaire. From a practical standpoint, knowing that some high percentage of respondents tended to follow, say, 12 paths through an instrument would be a very valuable piece of information, as it could obviously set high priorities for testing. But knowing the nature of those paths—what questions or question patterns typify them—could also be of great value to end data users. So, too, could knowledge of those paths be valuable to OMB in its assessment of what questions a typical respondent will be administered and how long the survey will take. Research should be done on ways to best identify these modal paths, whether through testing (either pilot fieldwork or being derived from the output dataset from automated testing) or as a byproduct of a complexity assessment program.
On a related note, respondent burden—time spent in the interview— is of particular concern to OMB, which must approve federal surveys. According to discussion at the workshop, users have requested that the Blaise/TADEQ system allow coders the capacity to enter an estimated time necessary to complete a particular question; these times could then be added up for various paths by TADEQ to estimate modal and extreme completion times. Defining and enhancing such measures of respondent burden are also useful research concerns.
Although not mentioned at the workshop, other related measures of operational complexity may be useful to consider. For instance, backtracking in an instrument—respondents asking to go back and change a preceding answer—could be interpreted as a crude measure of confusion in an instrument. Accordingly, constructing post-processing systems that identify questions and modules that were most referenced in backtracking could be useful in future incremental development.
Complexity in the Code Versus Complexity in the Survey
Developing diagnostic measures may help manage the complexity that is due to automation of a survey, the complexity of the underlying computer code. However, coming to terms with complexity in modern surveys also requires serious thought about managing the complexity inherent to the survey itself.
The federal statistical agencies, in particular, are known for fielding survey instruments that are daunting in their scope and their complexity. As Pat Doyle said in her overview comments, the Survey of Income and Program Participation (SIPP) contains on the order of 13,000 items; some 200,000 items are covered in the Consumer Expenditure Survey (CES), the purchase data that are used in deriving the Consumer Price
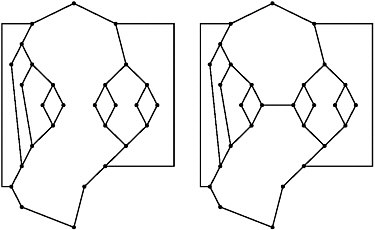
Figure I-4 Effect on mathematical complexity of a small change in code.
NOTE: This illustration is repeated in part later in the proceedings. Shown here are schematic diagrams with dots representing specific pieces of node—individual lines of code or subroutines—and the lines connecting them are function calls or links from routine to routine. The two diagrams differ by only one logical connection; however, the left graph has cyclomatic complexity 10 and essential complexity 1 (perfectly modular in structure), while the right graph has cyclomatic complexity 11 and essential complexity 10 (roughly, ten-elevenths logically confounded and hence largely incapable of modularization).
SOURCE: Workshop presentation by Thomas McCabe.
Index. Instruments like these are inherently complex because of their scope and public policy information needs, which dictate that high volumes of information be collected.
One lesson that follows from the discussion at the Workshop on Survey Automation is that there is a fundamental trade-off between having CAPI instruments that are infinitely customizable versus ones that are gratuitously complex. Paper instruments did not have the capacity for fills—for a question to recall a child’s name or to refer to “his” or “her” on the basis of preceding answers—but CAPI instruments do. The degree to which large numbers of automated fills make a survey interview smoother, faster, or better is unknown and unproven, as is the effect of fills on ultimate data quality. Hence, the question is: Do fills unnecessarily complicate the underlying software? Does the cost (in both resources and complexity) of coding behind-the-scenes calculations to provide pristine wording of a question on a laptop screen outweigh that of allowing field interviewers to use their own judgment in reading a
question using more generic labels? These cost-benefit trade-offs are important to consider. McCabe’s illustrations suggest that mathematical complexity can be increased dramatically by even the smallest of changes in a piece of code. For example, Figure I-4 depicts a schematic piece of code for which adding a single link turns perfectly modularized code into a nearly intractable logical mess. By gaining a greater appreciation of the mechanical complexity of CAPI instruments, the survey industry may also be able to engage in an important discussion of whether the drive to automate surveys might, in some cases, cross the line of gratuitous complexity.
Another fundamental source of current coding complexity is the capacity for backtracking in a CAPI interview. To best simulate the paper-and-pencil survey experience, the standard that is hoped for in some quarters—complete ability to go back and revise and correct errors, in the same way that pages could be flipped back and forth—is crucial. But allowing backtracks obviously increases the complexity of the software task; these overriding “goto” statements can result in constructs that cause code to break down, such as jumps into loops and branching into decision nodes. Moreover, they raise concerns for the final output dataset. During the workshop discussion, it was not immediately clear what happens in current instruments when backtracks lead to the formation of a new path: Do the data already entered get voided automatically? Should those data be retained, in case the survey works itself back to the point at which the respondent asked to change an earlier answer?2 Again, there is no apparent right or wrong answer, but the degree to which backward motion is permitted brings with it a cost-benefit trade-off in complexity.
To be clear, what we suggest in reexamining the complexity induced by mechanisms like fills and backtracking is an evaluation of trade-offs, not a single-minded drive to reduce complexity. Indeed, a move to absolutely minimize complexity could produce computerized survey instruments that may perform poorly in meeting survey demands or be unusable by interviewer. Moreover, it is not entirely clear that survey complexity is directly related to mathematical software complexity; that is, it is possible to imagine survey segments that seem intuitively complex but that could be quite simple software projects, and vice versa.


