
Appendix C
Likelihood of Differences in U.S. Water Resources Research Funding Levels Between the Mid 1970s and the Late 1990s
ANALYSIS GOALS AND METHODS
As stated in Chapter 4, the historical research funding data and those collected as part of the present assessment effort contain significant uncertainty. It is thus appropriate to cast any comparison between funding levels in different eras in a likelihood framework. The specific question addressed in this appendix is: How likely is it that the level of water resources research funding in the late 1990s is greater or less than the analogous level of the mid 1970s?
This question was examined for the total water resources research funding and for the funding in each major Federal Coordinating Council of Science, Engineering, and Technology (FCCSET) category under a number of assumptions, considered as most reasonable by the committee. These assumptions regard the character of data uncertainty. In particular, it was assumed that the annual data contain measurement errors that are independent from year to year, that the distribution of errors in averages of annual values can be well approximated by a normal distribution, that the standard deviation of the errors in averages of annual values ranges in all cases from 25 percent of the average to 50 percent of the average, and that there are no significant systematic biases in the annual funding data.
The available funding data consist of annual funding estimates as a total and by major FCCSET category for 1973, 1974, and 1975 (early period) and 1999, 2000, and 2001 (recent period). In all cases of analysis, averages of the annual values in the early period and averages of the annual values in the recent period were obtained. A total of 10,000 samples were generated from the assumed normal distributions that have as means the respective averages of the early and
recent periods and as standard deviations values that are first 25 percent (best guess) and then 50 percent (high value) of the respective mean. The differences between the members of each pair (the mid 1970s average minus the late 1990s average) were computed in each funding case, and the cumulative histograms of the differences were plotted on normal probability paper. The cumulative probability value for which the difference was less than zero (1970s funding minus 1990s funding < 0) was also computed and designated in the cumulative distribution plots.
The cumulative probability plots and information on them may be used to answer the posed question. If the zero-level cumulative probability value mentioned above is near 50 percent (say within 10 percent up or down), then it is doubtful that differences in funding levels are significant. If it is significantly lower than 50 percent then there is high likelihood that the late 1990s funding level is indeed lower than the mid 1970s level. If it is significantly greater than 50 percent then there is high likelihood that the late 1990s funding level is higher than the mid 1970s level. Results and significant findings for total water resources funding and for funding in each major FCCSET category are presented below.
TOTAL WATER RESOURCES RESEARCH
It is evident from Figure C-1 that the likelihood that the means are different under the stated conditions of uncertainty is small, since the values on either side of 0 (zero) are close to 50 percent. This makes zero the median and mean of the distribution of differences.
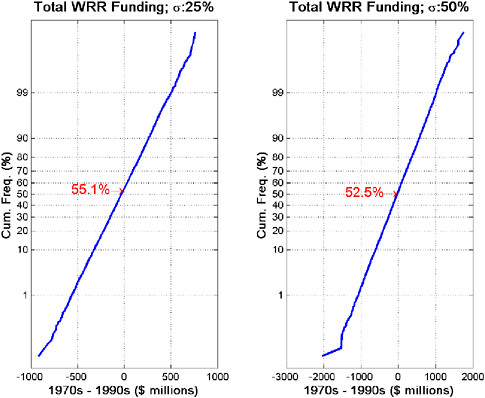
FIGURE C-1 Cumulative frequency distributions of 10,000 samples of generated differences between means of years 1973, 1974, 1975 and of years 1999, 2000, 2001 for total water resources research (WRR) funding.
CATEGORY I (NATURE OF WATER)
As shown in Figure C-2, it is very clear that the likelihood that the late 1990s funding is greater than the mid 1970s funding is very high, independent of the level of standard deviation assumed.
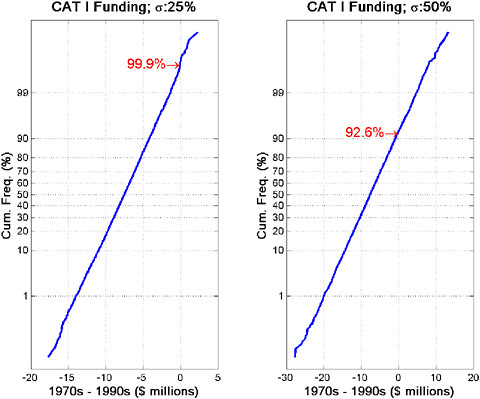
FIGURE C-2 Cumulative frequency distributions of 10,000 samples of generated differences between means of years 1973, 1974, 1975 and of years 1999, 2000, 2001 for Category I funding.
CATEGORY II (WATER CYCLE)
As shown in Figure C-3, the late 1990s level funding is significantly higher than the mid 1970s level funding, especially for a best-guess standard deviation level (25 percent of mean).
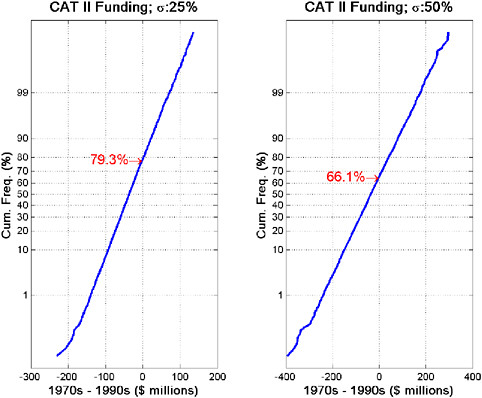
FIGURE C-3 Cumulative frequency distributions of 10,000 samples of generated differences between means of years 1973, 1974, 1975 and of years 1999, 2000, 2001 for Category II funding.
CATEGORY III (WATER SUPPLY AUGMENTATION AND CONSERVATION)
As shown in Figure C-4, the likelihood that the late 1990s level funding is higher than the mid 1970s level funding is very small in both cases of uncertainty depicted, and one concludes that funding has declined substantially in the late 1990s with respect to the mid 1970s for this category.
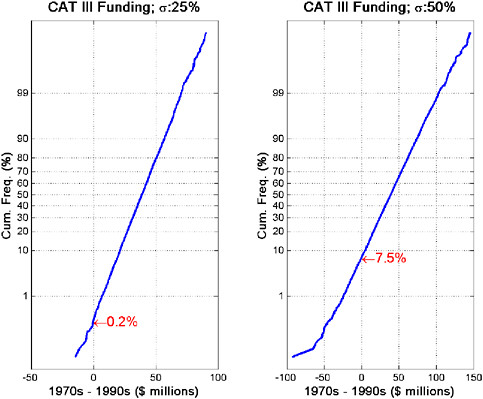
FIGURE C-4 Cumulative frequency distributions of 10,000 samples of generated differences between means of years 1973, 1974, 1975 and of years 1999, 2000, 2001 for Category III funding.
CATEGORY IV (WATER QUANTITY MANAGEMENT AND CONTROL)
As shown in Figure C-5, this is another case for which the mid 1970s funding level and the late 1990s funding level are not significantly different.
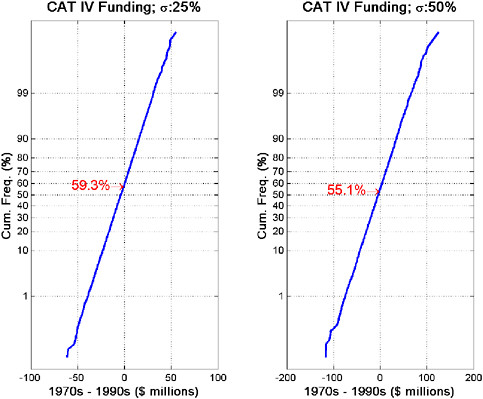
FIGURE C-5 Cumulative frequency distributions of 10,000 samples of generated differences between means of years 1973, 1974, 1975 and of years 1999, 2000, 2001 for Category IV funding.
CATEGORY V (WATER QUALITY MANAGEMENT AND PROTECTION)
As shown in Figure C-6, for this category, the mid 1970s funding is higher than the late 1990s funding with high confidence.
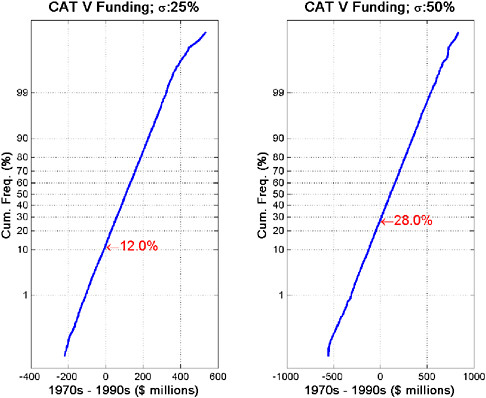
FIGURE C-6 Cumulative frequency distributions of 10,000 samples of generated differences between means of years 1973, 1974, 1975 and of years 1999, 2000, 2001 for Category V funding.
CATEGORY VI (WATER RESOURCES PLANNING AND OTHER INSTITUTIONAL ISSUES)
For this category, Figure C-7 shows that the mid 1970s funding is higher than the late 1990s funding with high confidence.
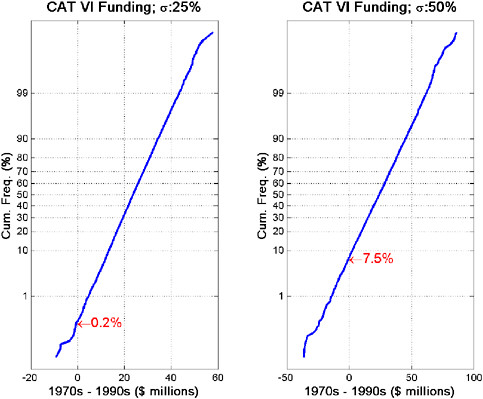
FIGURE C-7 Cumulative frequency distributions of 10,000 samples of generated differences between means of years 1973, 1974, 1975 and of years 1999, 2000, 2001 for Category VI funding.
CATEGORY VII (RESOURCES DATA)
As shown in Figure C-8, for Category VII the mid 1970s funding is higher than the late 1990s funding with high confidence.
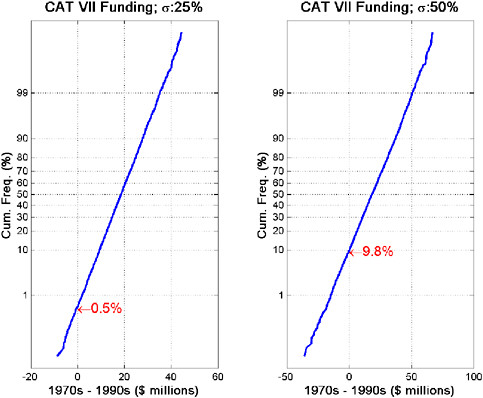
FIGURE C-8 Cumulative frequency distributions of 10,000 samples of generated differences between means of years 1973, 1974, 1975 and of years 1999, 2000, 2001 for Category VII funding.
CATEGORY VIII (ENGINEERING WORKS)
For this category, the assumed uncertainty makes a difference, as shown in Figure C-9. If it is assumed at the high value (standard deviation equal to 50 percent of the mean), the funding levels in the early (mid 1970s) and recent (late 1990s) periods cannot be distinguished with high confidence. However, if the best guess of uncertainty (25 percent is used to compute standard deviation) is assumed valid, the late 1990s funding is significantly higher than the mid 1970s funding.
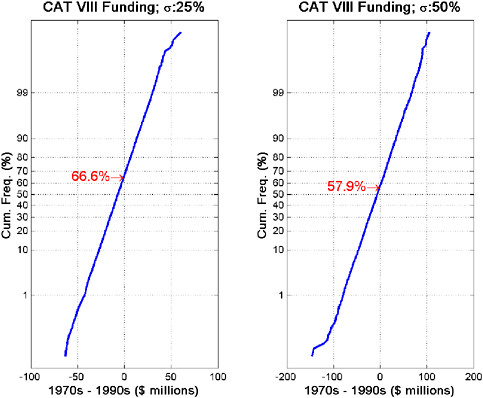
FIGURE C-9 Cumulative frequency distributions of 10,000 samples of generated differences between means of years 1973, 1974, 1975 and of years 1999, 2000, 2001 for Category VIII funding.
CATEGORY IX (MANPOWER, GRANTS, AND FACILITIES)
As shown in Figure C-10, in this case, the late 1990s funding level is substantially higher than the mid 1970s funding level with high confidence.
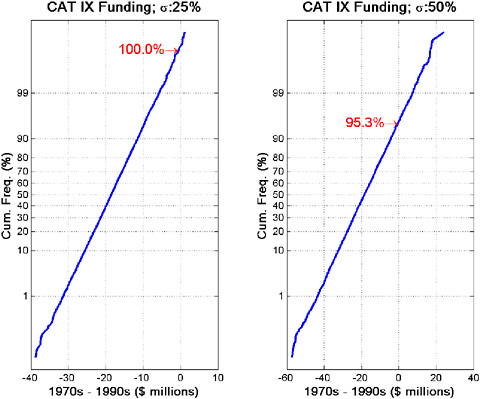
FIGURE C-10 Cumulative frequency distributions of 10,000 samples of generated differences between means of years 1973, 1974, 1975 and of years 1999, 2000, 2001 for Category IX funding.
CATEGORY X (SCIENTIFIC AND TECHNICAL INFORMATION)
As shown in Figure C-11, for this category, the mid 1970s funding is higher than the late 1990s funding with high confidence.
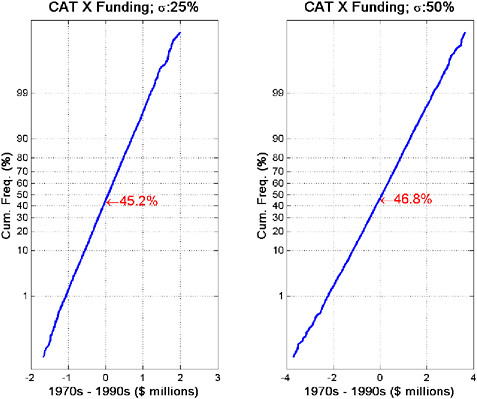
FIGURE C-11 Cumulative frequency distributions of 10,000 samples of generated differences between means of years 1973, 1974, 1975 and of years 1999, 2000, 2001 for Category X funding.
CATEGORY XI (AQUATIC ECOSYSTEM MANAGEMENT AND PROTECTION)
For this category, Figure C-12 shows that the late 1990s funding is much higher than the mid 1970s funding with high confidence (note that for the 25 percent uncertainty case, the zero-level cumulative probability distribution of the differences is 100 percent, as the entire curve lies on the negative x-axis half).

FIGURE C-12 Cumulative frequency distributions of 10,000 samples of generated differences between means of years 1973, 1974, 1975 and of years 1999, 2000, 2001 for Category XI funding.
TOTAL WATER RESOURCES RESEARCH FUNDING MINUS CATEGORY XI (AQUATIC ECOSYSTEM MANAGEMENT AND PROTECTION) FUNDING
When funding for Category XI is subtracted from the total water resources research funding, the late 1990s funding is lower than the mid 1970s funding with high confidence, even when the uncertainty in funding levels is 50 percent (see Figure C-13).

FIGURE C-13 Cumulative frequency distributions of 10,000 samples of generated differences between means of years 1973, 1974, 1975 and of years 1999, 2000, 2001 for the total water resources research funding minus Category XI funding.


